Embed Size (px)
Citation preview

i
Helping People. It’s who we are and what we do.
Analysis of Essential Diabetes Drugs that had a
Price Increase
September 30, 2018
Richard Whitley, MS
Director
Brian Sandoval
Governor
Prepared & Analyzed by: Paul Thompson, Scott Jones Ph.D.,
Heather Mitchell & Candice McDaniel MS Primary Care & Workforce Development Office,
Division of Public and Behavioral Health (DPBH)
Julie Kotchevar, PhD
DPBH Administrator
Data Provided by: Office of Analytics, DPBH

ii
Contents
Page
Introduction 1
Legislation 5
Methodology 6
Results 7
Conclusion 10
Appendix A: Burden of Diabetes in Nevada 2017 – Preliminary Report
Appendix B: List of Essential Diabetes Drugs
Appendix C: Compensation and Samples Distributed by Pharmaceutical Sales Representatives in Nevada
Appendix D: Essential Diabetes Drugs Price Increase Report

3
Introduction
Diabetes is expensive and is growing at an epidemic rate. In Nevada 281,355 of the adult population has diabetes, or 12.4%. In addition, 75,000 of those Nevadans have diabetes but are undiagnosed. There are an estimated 780,000 people in Nevada that have prediabetes with blood glucose levels higher than normal but not yet high enough to be diagnosed as diabetic. An estimated 10,000 Nevadans are diagnosed every year with diabetes. Chart 1 shows the total percentage of the adult population in Nevada impacted by diabetes and prediabetes1.
Chart 1: Nevada Percentage of Population Impacted by Diabetes and Prediabetes
The total amount of direct medical expenditures and indirect costs of diabetes in Nevada is $2.466 billion annually. Chart 2 illustrates the total direct and indirect costs of diabetes in Nevada by category. Direct medical costs including hospital care, prescription drugs to treat complications, physician office visits, antidiabetic agents and supplies, etc. totaled $1.924 billion. Indirect costs including reduced labor force participation due to chronic disability, reduced productivity at work and at home, work-related absenteeism, and reduced productivity related to premature mortality reaching $542 million2.
1 American Diabetes Associa�on – The Burden of Diabetes in Nevada 2 The Burden of Diabetes in Nevada - 2017
Prediabetes67%
Diabetes26%
Undiagosed Diabetes
7%

4
Chart 2: Nevada Direct and Indirect Cost of Diabetes by Category
Nationally, medical expenses are 2.3 times higher for people without diabetes. Chart 3 illustrates that the average total annual individual medical costs for people with diabetes is $16,750. Of that amount $9,600 is attributable to diabetes. This reflects that 57% of medical costs are associated with diabetes related medical expenditures3.
Chart 3: National Average Individual Annual Medical Expenses for Persons with Diabetes
3 Centers for Disease Control and Preven�on
DDM, $1,359,000,000 55%
UDM, $194,000,000 8%
PDM, $364,000,000 15%
GDM, $7,000,000 0%
DDM, $466,000,000 19%
UDM, $76,000,000 3%
$9,600
$7,150
National annual individual medical care costs directly attributable to diabetes
National annual individual medical care costs for all other expenditures
DDM-Diagnosed Diabetes Mellitus; UDM-Undiagnosed Diabetes Mellitus; PDM-Prediabetes; GDM-Gesta�onal Diabetes

5
Based on the June 1, 2018 published Compensation and Samples Distributed by Pharmaceutical Sales Representative in Nevada report4, the analysis showed that the largest percent of samples (27%) distributed by targeted health condition reported by Pharmaceutical Sales Representatives was to treat Diabetes. (Chart 4)
Chart 4: Percentage Samples Distributed by Targeted Health Condition as Reported by Sales
Representatives
If current national trends continue it is estimated that one out of �ive individuals will have diabetes by 2030 and increasing to one out of three by 2050. With the increase in diabetes diagnosis it is expected an adverse impact on overall wellness for Nevadans2.
Legislation
During the 79th legislative session, SB 539 was approved and required the Department of Health and Human Services (DHHS) pursuant to section 3.6 of the bill and Nevada Revised Statute (NRS) 439B.630 to compile a list of certain prescription drugs essential for treating diabetes. This was published on October 31, 20175. Additionally, the Department was required to identify and report on drugs that had a significant increase in price. This report was published on September 11, 20186. Drug manufacturers and pharmacy benefit managers (PBM) were required pursuant to sections 3.8, 4, and 4.2 to submit historical drug pricing information, drug manufacturing costs, rebates extended to consumers, drug price increase justification if applicable, and other information to the
4 2018 Compensa�on and Samples Distributed by Pharmaceu�cal Sales Representa�ves in Nevada 5 Essen�al Diabetes Drugs 6 Essen�al Diabetes Drugs Price Increase Report
Diabetes27%
Lung Health15%
Digestive Health12%
Heart Conditions9%
Skin conditions6% Mental Health
6%
Blood Disorders5%
Men's & Women's Health5%
Immune Disorder5%
Eye Health3%
Opioid & Opioid Abuse Treatment
3%Other1%Cancer
1%Nerve Disorders
1%Pain Relief
1%

6
Department. Based on all of this submitted information, the Department is required to analyze and release a report as outlined in statute:
NRS 438B.630 On or before September 30, 2018, June 1 in subsequent years, the Department shall analyze the information submitted pursuant to sections 3.8, 4, and 4.2 of this act and compile a report on the price of the prescription drugs that appear on the most current lists compiled by the department pursuant to section 3.6 of this act, the reasons for any increases in those prices and the effect of those prices on overall spending on prescription drugs in this State. The report may include, without limitation, opportunities for persons and entities in this state to lower the cost of drugs for the treatment of diabetes while maintaining access to such drugs
Methodology
Data and results presented in this report comply with the requirements of NRS 439B.630. A National Drug Code (NDC) is assigned to each specific dosage and packaging unit for a drug produced by a specific manufacturer. Thus, one drug can have hundreds of different NDC numbers to represent various dosages, product packaging variations, and manufacturers. The Department identified a total of 2,716 NDC codes, representing all the drugs identified in the essential list of medications. From that list, 175 NDCs showed a price increase above the thresholds established in statute. The pricing information utilized in this analysis was subject to limited availability of wholesale acquisition cost (WAC) data, which was available for the majority, but not all essential diabetes drugs.
This report contains an analysis of the 175 NDCs that experienced a price increase above the thresholds established in law. NDCs were subdivided by general drug function and class based on data taken from the Food and Drug Administration NDC Access database.
2017 Medicaid managed care organization (MCO) and fee-for-service (FFS) data was obtained with the total Medicaid prescription drug expenditures per drug NDC and the amount that the drugs were prescribed by doctors and utilized by Medicaid recipients. Essential diabetes drug NDCs with significant price increases were compared to Medicaid expenditures and utilization data.
This September 30, 2018 report complies with the reporting deadline. However, the data analysis highlighted in this report does not incorporate the manufacturers’ factors and justifications involved in NDC drug price increases. This report contains data solely obtained by DHHS to provide an overall analysis of essential diabetes drugs that had a price increase above the threshold established in statute. SB 539 requires manufacturers to report to the Department by July 1, 2018, per section 26.9(b) of this act., and subsequent years on or before April 1 annually per NRS 439B.640 in which a drug is included on the current essential list. The manufacturer of the drug shall submit to the Department a report describing the reasons for the increase in the wholesale acquisition cost of the drug as outlined in NRS. The report must include, each factor that contributed to the increase, the percentage of total increases attributable to each factor, an explanation of the role of each factor in the increase, and any other information prescribed by DHHS in regulation.
On June 7, 2018, DHHS provided notice that they will not proceed with enforcement action for reports made during the first six months. DHHS expects all entities will work in good faith during the six-month period, but wants to ensure manufacturers, sales representatives, PBM, and non-profit organizations have ample opportunity to come into compliance with the statutes and
6

7
regulations by January 15, 2019, before any enforcement action will be taken. DHHS continues to work with stakeholders to receive reported data. However, at the time of this report it is not included in the analysis.
Results
Percent of Essential Diabetes Drugs that Qualified for One Year vs Two Year Price Increases
Table 1 indicates the percentage of the 175 NDCs that experienced a 1-year and/or 2-year price increase above thresholds established in NRS 439B.630. To qualify for a significant price increase, the drug NDC had to increase in price above the 2017 consumer price index (CPI) in the immediately preceding calendar year, or twice the percentage increase in the CPI during the immediately preceding two calendar years. Drug NDCs that increased in price by 2.5% or greater in the immediately preceding calendar year, or by 12.6% or greater in the immediately preceding two calendar years were identified as having a significant price increase in this report. Over 97% of drugs with a significant price increase were changed by manufactures in the last year (Table 1).
Table 1: Percent of Essential Diabetes Drugs that Qualified for One Year vs Two Year Price Increases
Number of NDCs Percent
NDCs That Qualified for 1-Year Price Increase Threshold (2.5%) 170 97.14%
NDCs That Qualified for 2-Year Price Increase Threshold (12.6%) 134 76.57%
NDCs That Qualified for 1-Year and 2-Year Price Increase Threshold 129 73.71%
Number of Essential Diabetes Drug NDCs Experiencing a Price Increase per Drug Classification
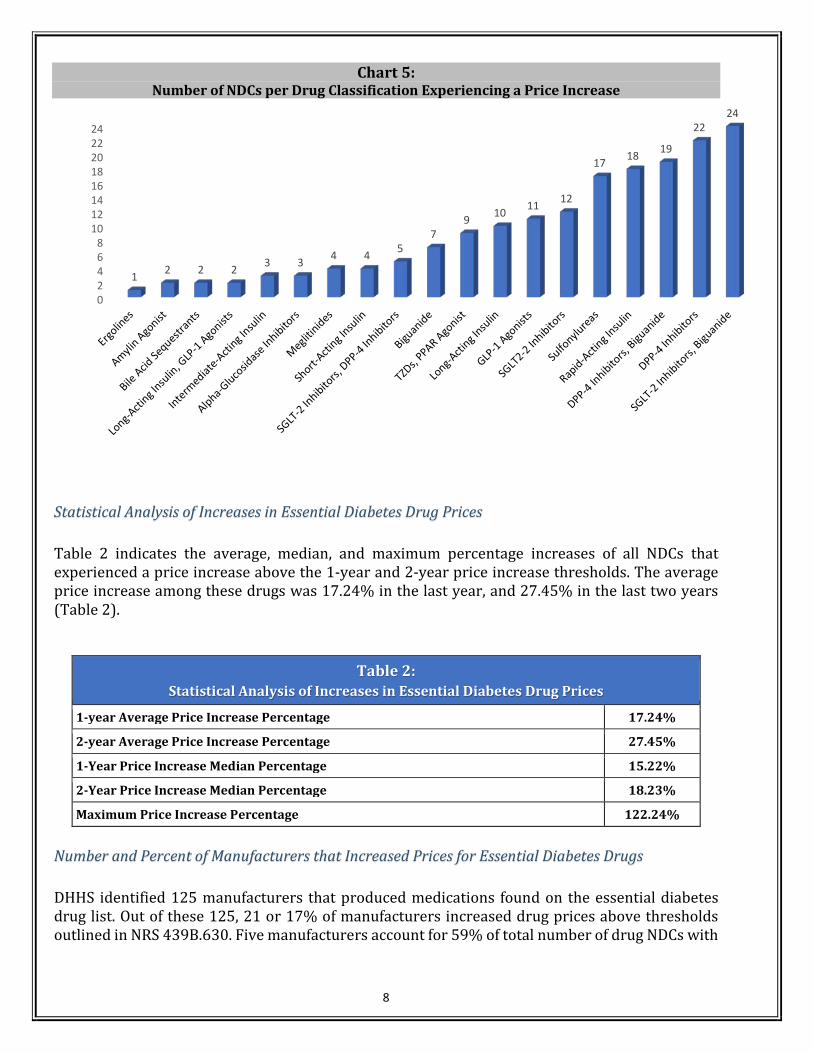
Chart 1 indicates the 14 drug classifications of the 175 individual NDCs with a price increase above the threshold established in statute. Combination drugs (drugs including multiple drug classifications in a single NDC) are grouped and separated by commas. The drug classifications included: ergolines, amylin agonists, bile acid sequestrants, long-acting insulin, glucagon-like peptide-1 (GLP-1) agonists, intermediate-acting insulin, alpha-glucosidase inhibitors, meglitinides, short-acting insulin, sodium glucose co-transporter-2 (SGLT-2) inhibitors, sulfonylureas, biguanides, thiazolidinedione (TZD), and rapid acting insulins. The top two classifications which experienced the greatest price increases were the combination SGLT-2 Inhibitors with Biguanide followed by DPP-4 Inhibitors (Chart 5)
8
Chart 5: Number of NDCs per Drug Classification Experiencing a Price Increase
Statistical Analysis of Increases in Essential Diabetes Drug Prices
Table 2 indicates the average, median, and maximum percentage increases of all NDCs that experienced a price increase above the 1-year and 2-year price increase thresholds. The average price increase among these drugs was 17.24% in the last year, and 27.45% in the last two years (Table 2).
Table 2: Statistical Analysis of Increases in Essential Diabetes Drug Prices
1-year Average Price Increase Percentage 17.24%
2-year Average Price Increase Percentage 27.45%
1-Year Price Increase Median Percentage 15.22%
2-Year Price Increase Median Percentage 18.23%
Maximum Price Increase Percentage 122.24%
Number and Percent of Manufacturers that Increased Prices for Essential Diabetes Drugs
DHHS identified 125 manufacturers that produced medications found on the essential diabetes drug list. Out of these 125, 21 or 17% of manufacturers increased drug prices above thresholds outlined in NRS 439B.630. Five manufacturers account for 59% of total number of drug NDCs with
02468
1012141618202224
1 2 2 2 3 3 4 4 57
9 10 11 12
17 18 19
2224

9
a significant price increase, which illustrates that a small number of drug companies are responsible for most of essential diabetes drug NDCs with a price increase in the last one or two-year periods.
Medicaid Expenditures on Essential Diabetes Drugs in 2017
An estimated 10% of all Medicaid prescription drug funds were expended on drugs identified by the essential diabetes drugs list produced by the Department. This cost analysis omits those drugs that treat co-morbidities and complications of diabetes (Chart 6). Additionally, 269,510 total claims were submitted for prescriptions for drugs found on the essential diabetes drug list.
Chart 6:Medicaid (MCO and FFS) Expenditures on Essential Diabetes Drugs (EDD) Compared to All Other
Drugs in 2017
Medicaid Expenditures on Essential Diabetes Drug with a Significant Price Increase in 2017
Of the 175 NDCs DHHS identified as having a price increase above the thresholds established in law, 138 or 78.9% of those NDCs were drugs prescribed in 2017 by providers to Medicaid patients. The net payment by Medicaid, for the 138 NDCs experiencing a price increase was $55,278,705, around 97% of the total Medicaid funds expended on essential diabetes drugs. Chart 7 illustrates Medicaid’s expenditures on essential diabetes drugs by drug classification. The Medicaid data indicates that an estimated 67% of expenditures on those drugs that experienced a significant price increase established in law were dedicated to the cost of short-acting, long-acting, rapid-acting, and intermediate-acting insulin.
Total Medicaid Payment for EDD* $57,156,533.00…
Total Medicaid Payment for All Other Drugs
$521,307,219.00,90%
*Drugs present on the 2017 Essential Diabetes Drugs list do not include those drugs that treat co-morbitities and complications associatedwith diabetes

10
Chart 7: Medicaid Percentage Expenditures on Drugs Experiencing a Significant Price Increase by Drug
Classification
Conclusion
Of the aggregated essential diabetes drug NDCs identified by the Department, only around 6% of those drug NDCs experienced significant price increases. However, the Medicaid expenditures on those drugs was substantial, and most of those funds went towards the purchase of insulin. Only 17% of manufacturers were responsible for significant price increases in the last two years. The average increase was 17.24% in the last year, and 27.45% in the last two years.
Upon manufacturer and PBM compliance on the January 15, 2019 reporting date, the data received from those reports will be analyzed by DHHS and made available in February 2019 as an addendum to this report. Normal reporting for section 3.8 will resume on April 1, 2019, with data analysis of those reports made available on June 1, 2019 and annually thereafter in accordance section 4.3.
DHHS Invites You to Learn More
DHHS invites you to view the Drug Transparency website at drugtransparency.nv.gov. If you are interested in receiving email notifications for Nevada Drug Transparency information and updates, please subscribe to the LISTSERV. Feedback and questions can be directed to the email: [email protected]
Long-Acting Insulin33%
Rapid-Acting Insulin32%
Glucagon-Like Peptide-1 Agonists
11%Sodium
Glucose Co-Transporter-2 Inhibitors
9%
DPP-4 Inhibitors9%
DPP-4 Inhibitors, Biguanide2%
Short-Acting Insulin1%
Intermediate-Acting Insulin1%
Sodium Glucose Co-Transporter-2 Inhibitors,
Biguanide1%
Other1%

Appendix A

Burden of Diabetes in Nevada 2017 – Preliminary Report
Nevada Department of Health and Human Services
Division of Public and Behavioral Health
Bureau of Child, Family and Community Wellness
Chronic Disease Prevention and Health Promotion Section
Diabetes Prevention and Control Program

ii

The Burden of Diabetes in Nevada 2017
Written by:
Marjorie Franzen-Weiss, MPH, CHES Diabetes Prevention and Control Program Coordinator
Chronic Disease Prevention and Health Promotion Section Bureau of Child, Family, and Community Wellness
Nevada Division of Public and Behavioral Health Nevada Department of Health and Human Services
Adel Mburia-Mwalili, PhD, MPH
Office of Public Health Informatics and Epidemiology Nevada Division of Public and Behavioral Health
Nevada Department of Health and Human Services
Edited by:
Masako Horino Berger, RD, MPH Health Systems Manager
Chronic Disease Prevention and Health Promotion Section Bureau of Child, Family, and Community Wellness
Nevada Division of Public and Behavioral Health Nevada Department of Health and Human Services
Jenni Bonk, M.S.
Chronic Disease Prevention & Health Promotion Section Manager Bureau of Child, Family, and Community Wellness
Nevada Division of Public and Behavioral Health Nevada Department of Health and Human Services

iv

Table of Contents
Nevada Demographic Profile ................................................................................................................. 1
What Is Diabetes? .................................................................................................................................. 1
What Are The Different Types Of Diabetes? ......................................................................................... 2
What Is Prediabetes? ............................................................................................................................. 3
Diabetes in Nevada ................................................................................................................................ 4 Diabetes – Prevalence in Nevada............................................................................................................ 4 Diabetes – Prevalence by County ........................................................................................................... 4 Diabetes Prevalence by Gender .............................................................................................................. 5 Diabetes Prevalence by Age .................................................................................................................... 5 Diabetes-Mortality .................................................................................................................................. 7
Prediabetes ............................................................................................................................................. 8 Prediabetes – Prevalence in Nevada ...................................................................................................... 8 Prediabetes – Prevalence by County ...................................................................................................... 9 Prediabetes – Prevalence by Gender ...................................................................................................... 9 Prediabetes – Prevalence by Age .......................................................................................................... 10
Risk Factors for Diabetes and Prediabetes .......................................................................................... 10 Overweight/Obesity .............................................................................................................................. 11
Adults .......................................................................................................................................... 11
Youth ........................................................................................................................................... 13
Physical Inactivity .................................................................................................................................. 14 Hypertension and Diabetes .................................................................................................................. 14 Smoking and Diabetes .......................................................................................................................... 15 Disparities Impact on Diabetes ............................................................................................................. 16
Race/Ethnicity ............................................................................................................................. 17
Income ........................................................................................................................................ 18
Food Insecurity and Diabetes ............................................................................................................... 19
Diabetes Prevention, Care and Management .............................................................................. 20 Access to Care ....................................................................................................................................... 21 Primary Care Provider Shortages .......................................................................................................... 25 Diabetes Self-Management Education ................................................................................................. 26 A1c Testing ............................................................................................................................................ 29 Foot Exams and Lower Extremity Amputations .................................................................................... 31 Eye Exams ............................................................................................................................................. 33 Immunizations ...................................................................................................................................... 34
Influenza Vaccination .................................................................................................................. 34
Pneumococcal Vaccination ......................................................................................................... 35
Dental Disease and Diabetes ................................................................................................................ 37
Cost of Diabetes ................................................................................................................................... 38 Economic Burden .................................................................................................................................. 38 Medical Cost.......................................................................................................................................... 39
Complications .............................................................................................................................. 39
vi
Hospital Inpatient ........................................................................................................................ 40
Life Expectancy ..................................................................................................................................... 42 Quality of Life Indicators ....................................................................................................................... 42 Depression and Diabetes ...................................................................................................................... 43
APPENDIX A - Diabetes Education Algorithm ...................................................................................... 44
APPENDIX B – Diabetes Self-Management and Diabetes Prevention Program Sites in Nevada ...... 45
APPENDIX C - Data Sources & Technical Notes ................................................................................... 48
APPENDIX D – Acronyms ...................................................................................................................... 50
APPENDIX E - Endnotes ........................................................................................................................ 51
Table of Figures
Figure 1 - Prevalence of Nevada Adults with Diabetes, 2005-2015 ...................................................... 4 Figure 2 - Prevalence of Nevada Adults with Diabetes by select Counties, BRFSS 2013- 2015 ............. 5 Figure 3 - Prevalence of Nevada Adults with Diabetes by Gender, 2005-2015 ..................................... 5 Figure 4 - National Trend, Incidence of Diagnosed Diabetes by Age, 1980-2014 (BRFSS) .................... 6 Figure 5 - Prevalence of Nevada Adults with Diabetes by Age Group, 2015 BRFSS .............................. 6 Figure 6 - Diabetes-Related Mortality Rate, Nevada, 2002-2015 ......................................................... 7 Figure 7 - Prevalence of Nevada Adults with Prediabetes, 2011, 2013 & 2014 .................................... 8 Figure 8 - Prevalence of Nevada Adults with Prediabetes by County/Region, 2014 ............................. 9 Figure 9 - Prevalence of Nevada Adults with Prediabetes by Gender, 2011, 2013 & 2014 ................ 10 Figure 10 - Prevalence of Nevada Adults with Prediabetes by Age Groups, 2014 ................................ 10 Figure 11 - Adult Obesity Rate by State, 2015 ...................................................................................... 11 Figure 12 - Prevalence of Nevada Adults Who Were Obese by Diabetes Status, 2014 & 2015 ............ 12 Figure 13 - Prevalence of Nevada Adults Who Were Overweight or Obese by Prediabetes Status ..... 12 Figure 14 - Prevalence of Nevada Adults Who Were Obese or Overweight by Diabetes Status .......... 13 Figure 15 - Prevalence of Nevada High School Students Who Were Overweight or Obese, 2015 ....... 13 Figure 16 - Prevalence of Nevada Adults Who DID NOT Participate in Leisure Time Physical
Activity* within the Past 30 Days Other Than Their Regular Job ........................................ 14 Figure 17 - Prevalence of Nevada Adults Who Had Ever Been Told They Have High Blood
Pressure by Diabetes Status ................................................................................................ 15 Figure 18 - Prevalence of Nevada Adults Who Were Current Smokers by Diabetes Status .................. 16 Figure 19 - HbA1c and Food Security Status among Patients with Diabetes ........................................ 20 Figure 20 - Percentage of Nevada Adults with Healthcare Coverage by Race/Ethnicity and
Gender ................................................................................................................................. 22 Figure 21 - Percentage of Nevada Adults who COULD NOT See a Doctor Due to Cost within the
Past 30 Days by Race/Ethnicity and Gender, Aggregate Data (2011-2015) ....................... 23 Figure 22 - Percentage of Nevada Adults with Diabetes who have had Diabetes Self-Management
Training ................................................................................................................................ 27 Figure 23 - Number of DSME Participants in Nevada, 2012-2014 ........................................................ 27 Figure 24 - Prevalence of Nevada Adults with Diabetes Who Have Had Self-Management
Training by Race/Ethnicity, 2011-2013, & 2015 Aggregate Data ....................................... 29 Figure 25 - Prevalence of Nevada Adults with Diabetes Receiving an A1C Test Twice within the ........ 29

Figure 26 - Prevalence of Nevada Adults with Diabetes Who Have Had an A1c Test Twice in the ...... 30 Figure 27 - Prevalence of Nevada Adults Who Had Their Feet Checked in the Past Year ...................... 31 Figure 28 - Prevalence of Nevada Adults with Diabetes Who Have Had Their Feet Checked in
the Past Year by Race/Ethnicity, Aggregate Data: 2011-2013, 2015 ................................. 32 Figure 29 - Crude Rate for Lower Extremity Amputations among Nevada Patients with Diabetes
in Any Diagnoses Code 2010-2014 ...................................................................................... 32 Figure 30 - Prevalence of Nevada Adults with Diabetes Who Have Had an Annual Dilated Eye
Exam 2004-2013, 2015 ....................................................................................................... 33 Figure 31 - Prevalence of Nevada Adults with Diabetes Who Have Had an Annual Dilated Eye
Exam by Race/Ethnicity, Aggregate Data: 2011-2013, 2015 ............................................. 34 Figure 32 - Prevalence of Nevada Adults with Diabetes Receiving an Annual Influenza
Vaccination by Age Group, 2005-2015 ............................................................................... 35 Figure 33 - Prevalence of Nevada Adults with Diabetes Receiving an Annual Influenza
Vaccination by Race/Ethnicity Aggregate Data (2011-2015) ............................................. 35 Figure 34 - Prevalence of Nevada Adults with Diabetes Ever Receiving a Pneumococcal
Vaccination by Age Group, 2005-2015 ............................................................................... 36 Figure 35 - Prevalence of Nevada Adults with Diabetes Ever Receiving a Pneumococcal
Vaccination by Race/Ethnicity and Age Group, Aggregate Data (2011-2015) ................... 36 Figure 36 - Nevada Adults - How Many Permanent Teeth Removed due to Tooth Decay or Gum
Disease 2012 & 2014 Pooled ............................................................................................... 37 Figure 37 - Time Since Last Visited a Dentist or a Dental Clinic for Any Reason, 2012 & 2014
Pooled Data ......................................................................................................................... 37 Figure 38 - Percentage of Type 2 Diabetes Patients by Complication, 2015 ........................................ 39 Figure 39 - New End Stage Renal Disease Patients with Diabetes as the Primary Cause in
Nevada ................................................................................................................................ 40 Figure 41 - Number of Outpatient Diabetes Mellitus Cases per Hospital per Year ............................... 41 Figure 42 – Facility Charges per Year for Type 2 Diabetes, 2014, 2015* .............................................. 41 Figure 43 - Health-Related Quality of Life Indicators by Diabetes Status, 201 ..................................... 43 Figure 44 - Percentage of Type 2 Diabetes Patients with Depression in 2015 ...................................... 43
Table of Tables
Table 1 - Social Determinants of Diabetes-Related Health Outcomes ................................................ 16 Table 2 - Health Insurance Coverage for Population under the Age of 65 in Nevada, by County
2012 ........................................................................................................................................... 23 Table 3 - Medicaid Enrollment in Nevada by County – 2004 & 2014 ................................................... 24 Table 4 - Licensed Primary Care Physicians (MDs and DOs) ................................................................. 25 Table 5 - Percentage of Type 2 Diabetes Patients, By A1c Level Range and by Payer, 2015 ................ 30 Table 6 -- Economic Burden by Diabetes Category in 2012 .................................................................. 38 Table 7 - Numbers of Inpatient Diabetes Mellitus Cases per Hospital per Year, by Payer, 2013–
2014 ........................................................................................................................................... 40


Nevada Demographic Profile
Nevada is the seventh largest state geographically with an area of 110,540 square miles. The population of Nevada increased by 12.96 % between 2006 and 2015 for a total of 2.8 million residents in 2015. Of the 17 counties, 89.9% of the state’s population resides in the state’s three urban counties of Clark, Washoe and Carson City. The remaining 14 counties consist of three rural counties (Douglas, Lyon, and Storey Counties), and the other eleven are considered frontier counties, thus creating pronounced geographic disparities. Although population growth has slowed recently, the state’s rapid population growth in the past 20 years has put almost impossible pressure on health and human services to keep pace with spiraling demand for services, especially among older age groups and racial/ethnic minorities.
Nevada is also becoming a more diverse state. The percentage of minority races and ethnicities has increased over the past years. Currently, the greatest percentage of residents identify as white at 66%, followed by Hispanic or Latino at 26%, Black or African American at 8%, and Asian American at 7%.1 As a Medicaid expansion state, Nevada's enrollment in Medicaid and the Children's Health Insurance Program (CHIP) increased 66 percent from an average of 221,450 July through September 2013 to 554,010 in April 2015. This far exceeds the national increase of 21%. Medicaid expansion is expected to
improve the quality of life for many Nevadans, but provider shortages, low health literacy, and navigation of the health care system remain substantial challenges for all Nevadans.
Furthermore, this vast geographic distribution creates many health care delivery challenges in serving the residents of Nevada, especially those in rural and frontier areas. The average distance between acute care hospitals in rural Nevada, and the next level of care or tertiary care hospitals is 115 miles.
What Is Diabetes?
Diabetes is an endocrine system disease caused by the body’s inability to create enough insulin or properly use the insulin it produces to break down blood sugar/glucose to use as fuel for the body. Insulin is a hormone that converts sugars, starches and other food components into the energy needed by the body to function. It unlocks the cells to allow blood glucose to enter and fuel the cells of the body. The cause of diabetes remains unknown, although both genetics and environmental factors, such as
obesity and a lack of physical activity, appear to play a role in determining whether a person develops diabetes.
In the United States, the number of adults aged 18 years of age and older with diagnosed diabetes has almost quadrupled from 5.5 million to 29.1 million or 9.3% of adults from 1980 through 2014. This estimate includes 21.0 million adults diagnosed with the disease, and 8.1 million (27.8%) of adults with diabetes who

2
are undiagnosed.2 As with other chronic illnesses, this increase is due to multiple factors including, the aging of the U.S. population, and the rising rate of obesity and physical inactivity. Furthermore, a greater incidence of diabetes is found among minority populations. In Nevada, according to the Behavioral Risk Factor Surveillance System (BRFSS) data, it is estimated that 215,082 or 9.7% of adults were diagnosed with diabetes in 2015.3
The Centers for Disease Control and Prevention (CDC) estimates that more than one in three adults have prediabetes. An individual with prediabetes has a blood glucose level that is too high to be considered normal, but does not meet the criteria for diabetes. Because of this increased blood glucose level, these individuals are at a higher risk for developing type 2 diabetes
and other serious health problems, including heart disease, and stroke. Without lifestyle changes to improve their health, 15% to 30% of individuals with prediabetes will develop type 2 diabetes within five years.4
Moreover, diabetes imposes a considerable burden on the economy of the U.S. in the form of increased medical costs and indirect costs due to reduced labor force participation as a result of chronic disability, reduced productivity at work and home, work-related absenteeism, and premature mortality.5,6 The occurrence of diabetes related costs are expected to more than double in the next 25 years from $113 billion to $336 billion.7 For the year 2012, Nevada’s total estimated medical cost for diabetes was $2,466 million with prediabetes representing $194 million.8
What Are The Different Types Of Diabetes?
Type 1 diabetes most often occurs among children and young adults, and was originally called juvenile-onset diabetes. Type 1 diabetes results from the body’s failure to make insulin. People with type 1 diabetes control their disease by taking insulin, monitoring their blood sugars, meal planning and engaging in a physical activity program. Nationally, 5% to 10% of those who are diagnosed with diabetes have type 1 diabetes.9
Type 2 diabetes is a preventable disease and is the most common form of diabetes. Type 2 diabetes develops when the body no longer uses insulin properly or cannot make enough insulin to keep blood glucose at normal levels. Type 2 diabetes is a substantial and growing health problem which affects both adults and children and is related to a number of serious complications, including cardiovascular disease, blindness, kidney disease, amputation and premature death. The CDC estimates indicate that 90-95% of Americans diagnosed with diabetes have type 2 diabetes. Type 2 diabetes develops most often in middle-aged and older adults but an increasing number of younger adults and children are being diagnosed with
type 2 diabetes. Individual with type 2 diabetes can control their disease through self-management by monitoring their blood glucose, eating healthy foods, and engaging in regular physical activity. In addition, medications may be needed to control blood glucose levels. 10
Gestational diabetes mellitus (GDM) is defined as impaired glucose tolerance with onset or first recognition during pregnancy and in most cases resolves with delivery. In the U.S., approximately 7% of all pregnancies (ranging from 1 to 14%, depending on the population studied and the diagnostic tests employed) are complicated by GDM, resulting in more than 200,000 cases annually. GDM occurs when the pregnant women’s body is not able to make and use all the insulin it needs for the pregnancy. In general GDM requires treatment only during pregnancy. However, women with GDM and their children are at higher risk for developing type 2 diabetes later in life. 11

3
What Is Prediabetes?
Prediabetes is a condition that occurs when an individual’s blood glucose levels are higher than normal but not high enough for a diagnosis of type 2 diabetes.12 The Centers for Disease Control and Prevention (CDC) estimates that more than one in three adults have prediabetes. Because of their increased blood glucose level, those with prediabetes are at a higher risk of developing type 2 diabetes and other serious health problems, including heart disease, and stroke.13 Research findings indicate complications associated with diabetes are present among individuals with undiagnosed diabetes and prediabetes at higher rates than among people with normal glucose levels.14
Without lifestyle changes to improve their health, 15% to 30% of people with prediabetes will develop type 2 diabetes within five years.15
Certain risk factors make it more likely for an individual to develop prediabetes and type 2 diabetes. These risk factors include: age, especially after 45 years of age; being overweight or obese; a family history of diabetes; having an African-American, American Indian, Hispanic/Latino, Asian-American, or Pacific-Islander racial or ethnic background; a history of diabetes while pregnant (gestational diabetes) or having given birth to a baby weighing nine pounds or more; and being physically active less than three times a week.16
Many people with prediabetes can prevent or delay the onset of diabetes. The Community Preventive Services Task Force in its publication entitled, Diabetes Prevention and Control: Combined Diet and Physical Activity Promotion Programs to Prevent Type 2 Diabetes among
People at Increased Risk, recommends combined diet and physical activity promotion programs for people at increased risk of type 2 diabetes.17 This is based on evidence of effectiveness in reducing new-onset diabetes. In addition to improved health outcomes, the Task Force denotes that combined diet and physical activity promotion programs are cost-effective. Commencing January 1985 thru April 2015, 21 studies assessed the cost-effectiveness of
combined diet and physical activity promotion programs by estimating incremental cost-effectiveness ratios (ICER) from the health system perspective. The health system perspective focused on the direct medical costs of care, as well as healthcare costs averted from preventing or delaying diabetes and its complications. The median ICER of combined diet and physical activity promotion programs per quality-adjusted life year (QALY) was $13,761. The cost per disability-adjusted life year (DALY) averted was $21,195 to $50,707, and the cost per life year gained (LYG) median was $2,684.18.
The CDC-Recognized Diabetes Prevention Lifestyle Change
Program (DPP) established a 58% reduction in the development of diabetes over three years in people at high risk for diabetes who implemented small lifestyle interventions. The study found that people with prediabetes can prevent or delay the onset of diabetes by losing 5% to 7 % of their body weight (10 to 15 pounds for a 200 pound person), getting 30 minutes of physical activity 5 days a week and making healthy food choices.
On March 23, 2016, Health and Human Services (HHS) Secretary Burwell announced the

4
endorsement to expand the Medicare Diabetes Prevention Program (MDPP) nationwide. The Centers for Medicare and Medicaid Services (CMS) Office of the Actuary certified that an intervention program preventing diabetes saves
the government money.19 In July 2016, the CMS presented the MDPP Model Expansion rules in the CY 2017 Medicare Physician Fee Schedule with an implementation date of January 1, 2018.20
Diabetes in Nevada
Nevada along with the rest of the United States is headed for a diabetes tsunami. Nationally 27.8% of people with diabetes are undiagnosed. It is estimated that one out of five individuals will have diabetes by 2030; increasing to one out of three by 2050 if the current trend continues.
Diabetes – Prevalence in Nevada
According to Nevada’s 2015 BRFSS data, the prevalence of diabetes among Nevadan > 18 years of age was estimated to be 9.7% or 197,570 adults which is slightly lower than the United States prevalence of 9.9%. Figure 1 compares the estimated diabetes prevalence in Nevada and U.S. adults from 2005 through 2015. Overall, the Nevada diabetes prevalence trend is similar to that of the national prevalence.
Figure 1 - Prevalence of Nevada Adults with Diabetes, 2005-2015
Diabetes – Prevalence by County
Figure 2 shows estimated diabetes prevalence by county. Rural and frontier counties have a higher prevalence than the overall state with Elko and Nye Counties showing higher at 17.9% (2015)
and 16.0% (2014) respectively. Washoe County continues to have the lowest rates in Nevada at 7.9% (2015).
7.1% 7.5% 8.0%8.6%
10.3%
8.9%9.6% 9.6% 9.7%
7.3% 7.5% 8.0% 8.3%
9.5%
9.7% 9.7% 10.0% 9.9%
0%
2%
4%
6%
8%
10%
12%
14%
2005 2006 2007 2008 2011 2012 2013 2014 2015
Source: BRFSS 2005-2015 Nevada U.S. Median BRFSS Methodology Change
5
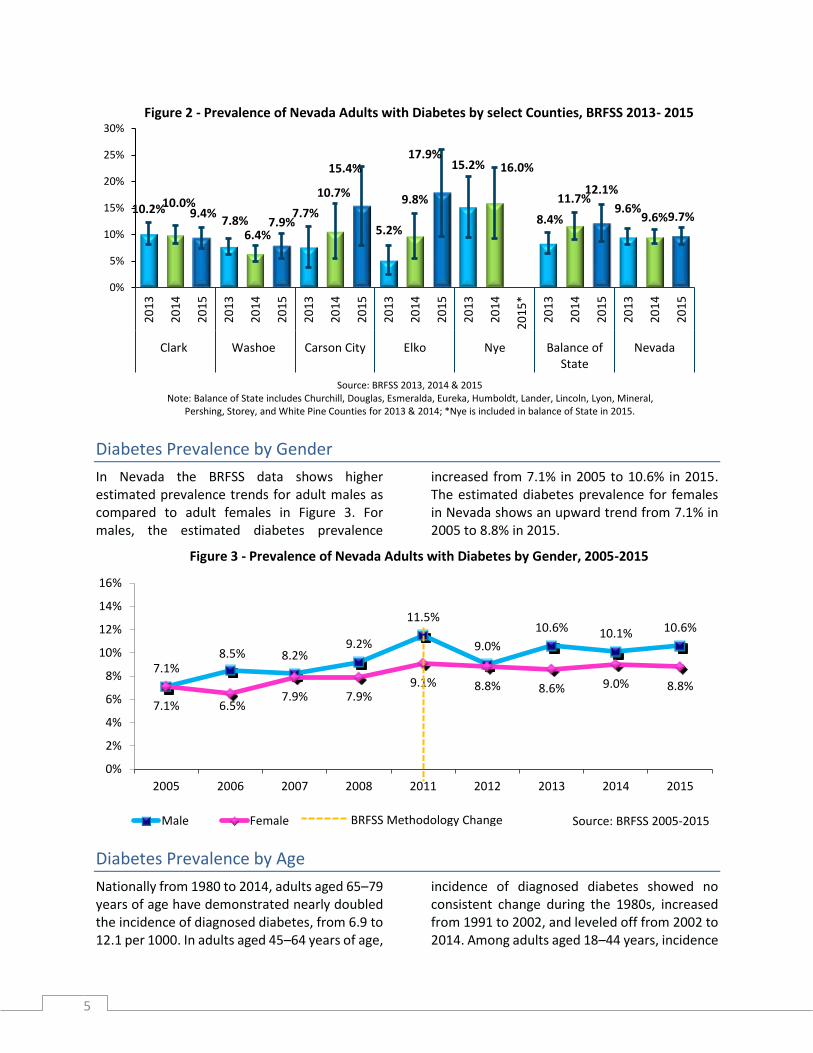
Figure 2 - Prevalence of Nevada Adults with Diabetes by select Counties, BRFSS 2013- 2015
Diabetes Prevalence by Gender
In Nevada the BRFSS data shows higher estimated prevalence trends for adult males as compared to adult females in Figure 3. For males, the estimated diabetes prevalence
increased from 7.1% in 2005 to 10.6% in 2015. The estimated diabetes prevalence for females in Nevada shows an upward trend from 7.1% in 2005 to 8.8% in 2015.
Figure 3 - Prevalence of Nevada Adults with Diabetes by Gender, 2005-2015
Diabetes Prevalence by Age
Nationally from 1980 to 2014, adults aged 65–79 years of age have demonstrated nearly doubled the incidence of diagnosed diabetes, from 6.9 to 12.1 per 1000. In adults aged 45–64 years of age,
incidence of diagnosed diabetes showed no consistent change during the 1980s, increased from 1991 to 2002, and leveled off from 2002 to 2014. Among adults aged 18–44 years, incidence
10.2%10.0%9.4%
7.8%6.4%
7.9%7.7%
10.7%
15.4%
5.2%
9.8%
17.9%15.2% 16.0%
8.4%
11.7%12.1%
9.6%9.6%9.7%
0%
5%
10%
15%
20%
25%
30%
20
13
20
14
20
15
20
13
20
14
20
15
20
13
20
14
20
15
20
13
20
14
20
15
20
13
20
14
20
15
*
20
13
20
14
20
15
20
13
20
14
20
15
Clark Washoe Carson City Elko Nye Balance ofState
Nevada
Source: BRFSS 2013, 2014 & 2015Note: Balance of State includes Churchill, Douglas, Esmeralda, Eureka, Humboldt, Lander, Lincoln, Lyon, Mineral,
Pershing, Storey, and White Pine Counties for 2013 & 2014; *Nye is included in balance of State in 2015.
7.1%8.5% 8.2%
9.2%
11.5%
9.0%
10.6% 10.1% 10.6%
7.1% 6.5%7.9% 7.9%
9.1% 8.8% 8.6% 9.0% 8.8%
0%
2%
4%
6%
8%
10%
12%
14%
16%
2005 2006 2007 2008 2011 2012 2013 2014 2015
Source: BRFSS 2005-2015Male Female BRFSS Methodology Change

6
increased significantly from 1980 to 2003, showed little change from 2003 to 2006, then significantly decreased from 2006 to 2014. Figure 4 from the CDC shows the national trend
over the last twenty-five years by age based on BRFSS data. Note that in 2011 there was a collection methodology change for the BRFSS.
Figure 4 - National Trend, Incidence of Diagnosed Diabetes by Age, 1980-2014 (BRFSS)
Figure 5 shows the diabetes prevalence differs among age groups with 21.9% of Nevada adults age 65 years and older and 11.8% of 45 to 64
year olds having been told by their doctor that they have diabetes in 2015.
Figure 5 - Prevalence of Nevada Adults with Diabetes by Age Group, 2015 BRFSS
3.3%
11.8%
21.9%
0%
5%
10%
15%
20%
25%
30%
18-44 45-64 65+
Source: BRFSS 2015
Age in Years

7
Diabetes-Mortality
Diabetes was the seventh leading cause of death in the United States in 2014 based on the 76,488 death certificates in which diabetes was listed as the underlying cause of death.21
As demonstrated in figure 6, the diabetes-related death rate in Nevada has been on a
decreasing trend since 2002 and is the eighth leading cause of death in Nevada. In 2015 the diabetes death rate was 39.8 per 100,000 people.
Unfortunately, using mortality rates for diabetes from death certificates does not paint the true picture of the impact and burden of diabetes. Diabetes may be underreported as a cause of death according to the American Diabetes Association. Studies have found that only about 35% to 40% of people with diabetes who died, had diabetes listed anywhere on the death certificate and only about 10% to 15% had it listed as the underlying cause of death.22 Diabetes, however, is a leading cause of cardiovascular mortality. Nearly two-thirds of people with diabetes die of cardiovascular disease.23
A study published in January 2017 attributes approximately 12% of deaths due to diabetes
which would make diabetes the third leading cause of death in the U.S.24
Also, life expectancy for individuals with type 2 diabetes was showed to decrease as reported in a cohort study conducted using 383 general practices in England. The results showed that:
At age 40, white men with diabetes lost 5 years of life and white women lost 6 years compared with those without diabetes. A loss of between 1 and 2 years was observed for South Asian and blacks with diabetes. . .The findings support optimized cardiovascular disease risk factor management, especially in whites with type 2 diabetes.25
50.2 5148.5
55.4
47.9
40.2 38.540.3 42.7
45.240.6 39.8
0
10
20
30
40
50
60
2002 2003 2004 2005 2006 2007 2008 2011 2012 2013 2014 2015
Rat
e P
er 1
00
,00
0 P
op
ula
tio
n
Source: Nevada Electronic Death Registry
Figure 6 - Diabetes-Related Mortality Rate, Nevada, 2002-2015
8
Prediabetes
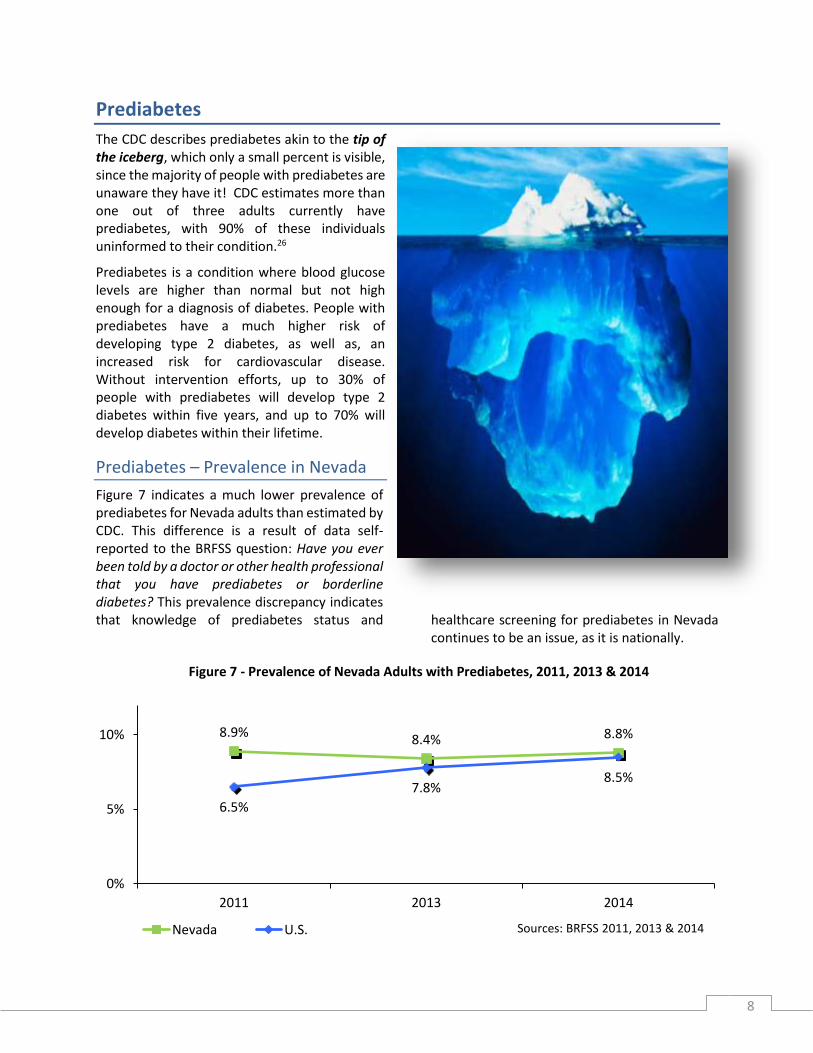
The CDC describes prediabetes akin to the tip of the iceberg, which only a small percent is visible, since the majority of people with prediabetes are unaware they have it! CDC estimates more than one out of three adults currently have prediabetes, with 90% of these individuals uninformed to their condition.26
Prediabetes is a condition where blood glucose levels are higher than normal but not high enough for a diagnosis of diabetes. People with prediabetes have a much higher risk of developing type 2 diabetes, as well as, an increased risk for cardiovascular disease. Without intervention efforts, up to 30% of people with prediabetes will develop type 2 diabetes within five years, and up to 70% will develop diabetes within their lifetime.
Prediabetes – Prevalence in Nevada
Figure 7 indicates a much lower prevalence of prediabetes for Nevada adults than estimated by CDC. This difference is a result of data self-reported to the BRFSS question: Have you ever been told by a doctor or other health professional that you have prediabetes or borderline diabetes? This prevalence discrepancy indicates that knowledge of prediabetes status and healthcare screening for prediabetes in Nevada
continues to be an issue, as it is nationally.
Figure 7 - Prevalence of Nevada Adults with Prediabetes, 2011, 2013 & 2014
8.9%8.4% 8.8%
6.5%
7.8%8.5%
0%
5%
10%
2011 2013 2014
Sources: BRFSS 2011, 2013 & 2014Nevada U.S.

9
The American Medical Association (AMA) has partnered with the CDC to address this matter by educating healthcare providers. The focused message for the average primary care practice is possibly one-third of patients over age 18, and one-half over age 65, may be affected by prediabetes. The AMA collaborated with the CDC to create the Prevent Diabetes STAT: Screen, Test, Act – Today™ Toolkit which assist physician practices to screen patients based on the United States Preventive Services Task Force (USPSTF) guidelines and refer those with prediabetes to evidence-based diabetes prevention programs while not adding a burden to their practice.27
The USPSTF issued a Grade B recommendation for screening for diabetes in 2015. This guideline
states that all adults aged 40 to 70 years of age who are overweight or obese should be screened for type 2 diabetes mellitus. The recommendation also notes that physicians can consider screening younger adults or adults with normal weight if they have a family history of type 2 diabetes mellitus, a past medical history of gestational diabetes or polycystic ovarian syndrome, or if they are a member of a racial or ethnic minority. Furthermore, the USPSTF recommends that all adults with abnormal glucose be referred to an intensive behavioral counseling intervention such as the CDC-Recognized Diabetes Prevention Program (DPP).28
Prediabetes – Prevalence by County
Figure 8 shows the prevalence of Nevadans by county who have ever been told by a doctor or
other health professional that they have pre-diabetes or borderline diabetes.
Figure 8 - Prevalence of Nevada Adults with Prediabetes by County/Region, 2014
Prediabetes – Prevalence by Gender
Gender difference for prediabetes are minimal in relation to the modifiable risk factors of obesity, hypertension and low HDL-cholesterol levels, except for alcohol consumption in men. The magnitude, however, of the associations was stronger for men than women with abdominal
obesity demonstrating the strongest association with prediabetes. In men, alcohol consumption should be considered as an additional risk factor of prediabetes compared to women.29 In Nevada, figure 9 shows a slightly higher rate of self-reported prediabetes in men.
9.9%
8.7% 8.6%9.1%
8.8%
0%
5%
10%
15%
Carson City Clark County Washoe County Balance of State NevadaSource: BRFSS 2014
Note: Balance of State includes Churchill, Douglas, Elko, Esmeralda, Eureka, Humboldt, Lander, Lincoln, Lyon, Mineral, Nye, Pershing, Storey, and White Pine Counties.

10
Figure 9 - Prevalence of Nevada Adults with Prediabetes by Gender, 2011, 2013 & 2014
Prediabetes – Prevalence by Age
Although rates of prediabetes increase with age, rates are also high among young adults with nationally up to one-third of those ages 18-39 years of age having prediabetes. Figure 10
displays the prevalence of Nevada adults told that they have prediabetes is 16.8% for adults 65 years of age and older and over ten percent for indviduals age 45-54 years old.
Figure 10 - Prevalence of Nevada Adults with Prediabetes by Age Groups, 2014
Risk Factors for Diabetes and Prediabetes
Although the causes of type 2 diabetes are unknown, there are a number of factors that may contribute. There are a number of non-modifiable risk factors that can contribute to a individual’s likelihood of developing type 2 diabetes and heart disease. The non-modifiable risk factors include: age, race and ethnicity, gender and family history. The American Diabetes Association states that
accumulating research indicates there are a number of modifiable factors that contribute to the likelihood of developing type 2 diabetes and heart disease. These include: overweight/ obesity; high blood glucose; hypertension; abnormal inflammation; physical inactivity and smoking. Moreover, the chances of developing type 2 diabetes increase the more health risk factors that are present.30
10.3%8.5% 8.9%
7.9% 8.3% 8.7%
0%
5%
10%
15%
2011 2013 2014
Source: BRFSS 2011, 2013, and 2014Male Female
5.0%
10.6%
16.8%
0%
5%
10%
15%
20%
25%
18-44 yrs of age 45-54 yrs of age 65+ yrs of age
Source: BRFSS 2014

11
Overweight/Obesity
The World Health Organization (WHO) defines overweight and obesity as abnormal or excessive fat accumulation that may impair health. WHO states:
The fundamental cause of obesity and overweight is an energy imbalance between calories consumed and calories expended - increased intake of energy-dense foods that are high in fat; and an increase in physical inactivity due to the increasingly sedentary nature of many forms of work, changing modes of transportation, and increasing
urbanization. . . Changes in dietary and physical activity patterns are often the result of environmental and societal changes associated with development and lack of supportive policies in sectors such as health, agriculture, transport, urban planning, environment, food processing, distribution, marketing, and education.31
Obesity is associated with some of the leading preventable chronic diseases, including type 2 diabetes, heart disease, stroke, and some cancers.
Adults
The increase in obesity levels in the United States is believed to be largely the cause of the type 2 diabetes epidemic. Among adults nationally the medical costs associated with obesity are an estimated $147 billion.32,33,34 Research at the Harvard School of Public Health showed that the
single best predictor of type 2 diabetes is being overweight or obese.35
The adult obesity rate by state map below (figure 11) shows that although Nevada does not have the highest rates of obesity, but is still at an unacceptable rate.
Figure 11 - Adult Obesity Rate by State, 2015

12
Fat cells, especially those stored around the waist, secrete hormones and other substances that fire inflammation. Although inflammation is an essential component of the immune system and part of the healing process, inappropriate inflammation causes a variety of health problems. Inflammation can make the body less responsive to insulin and change the way the body metabolizes fats and carbohydrates, leading to higher blood sugar levels and, eventually, to diabetes and its many complications.36
BRFSS 2015 data estimates that 38% of Nevada adults are overweight and 26.7% of Nevada adults were obese.37
Figure 12 illustrates that the prevalence of Nevada adults with diabetes who are obese is close to double the prevalence for those who do not have diabetes. Obesity in the BRFSS is defined as having a body mass index (BMI) >30. Figure 13 shows similar trend for prediabetes.
Figure 12 - Prevalence of Nevada Adults Who Were Obese by Diabetes Status, 2014 & 2015
Figure 13 - Prevalence of Nevada Adults Who Were Overweight or Obese by Prediabetes Status
While not as drastic a ratio as seen for individuals who are obese, being overweight with a BMI
between 25.0 and 29.9 is a risk factor for diabetes, as seen in Figure 14.
49.6%
42.0%
24.9% 25.1% 27.6% 26.7%30.5%
0%
20%
40%
60%
2014 2015 2014 2015 2014 2015
Diabetes No Diabetes Nevada HP 2020
Source: BRFSS 2014 & 2015
43.3%
24.0%27.6%
30.5%
0%
20%
40%
Pre-diabetes No Pre-diabetes Nevada HP 2020
Source: BRFSS 2014
13
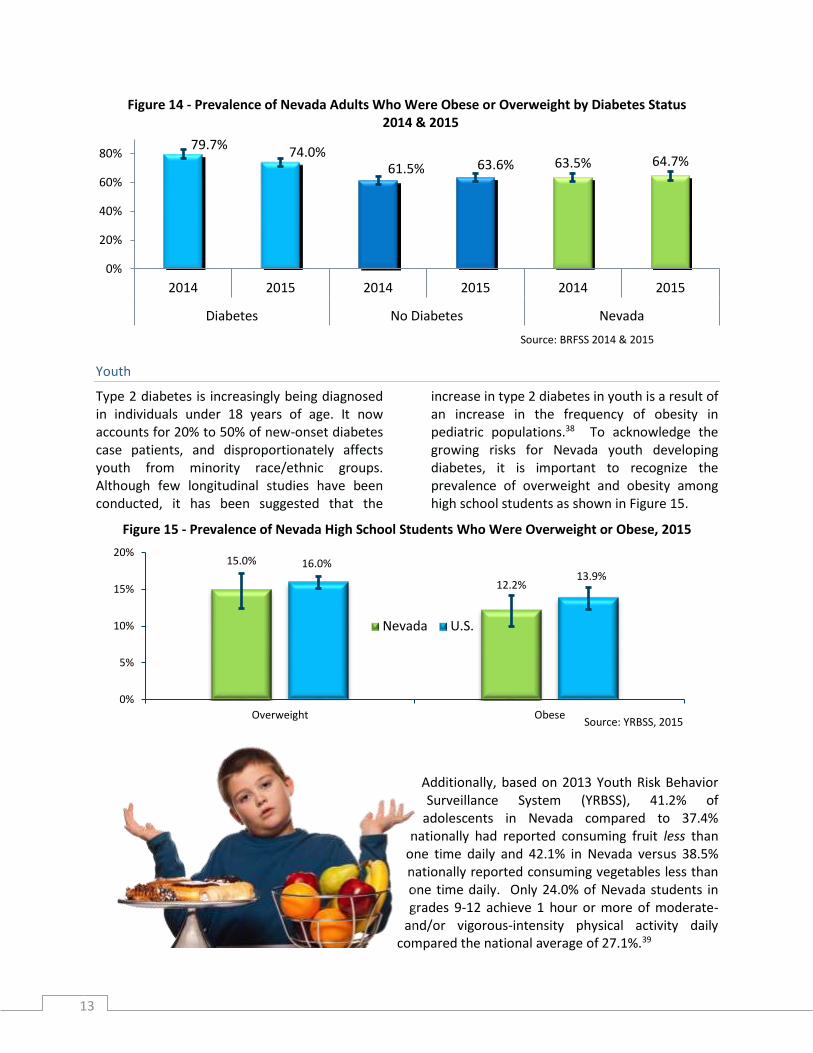
Figure 14 - Prevalence of Nevada Adults Who Were Obese or Overweight by Diabetes Status 2014 & 2015
Youth
Type 2 diabetes is increasingly being diagnosed in individuals under 18 years of age. It now accounts for 20% to 50% of new-onset diabetes case patients, and disproportionately affects youth from minority race/ethnic groups. Although few longitudinal studies have been conducted, it has been suggested that the
increase in type 2 diabetes in youth is a result of an increase in the frequency of obesity in pediatric populations.38 To acknowledge the growing risks for Nevada youth developing diabetes, it is important to recognize the prevalence of overweight and obesity among high school students as shown in Figure 15.
Figure 15 - Prevalence of Nevada High School Students Who Were Overweight or Obese, 2015
Additionally, based on 2013 Youth Risk Behavior Surveillance System (YRBSS), 41.2% of
adolescents in Nevada compared to 37.4% nationally had reported consuming fruit less than
one time daily and 42.1% in Nevada versus 38.5% nationally reported consuming vegetables less than one time daily. Only 24.0% of Nevada students in grades 9-12 achieve 1 hour or more of moderate-
and/or vigorous-intensity physical activity daily compared the national average of 27.1%.39
79.7%74.0%
61.5% 63.6% 63.5% 64.7%
0%
20%
40%
60%
80%
2014 2015 2014 2015 2014 2015
Diabetes No Diabetes Nevada
Source: BRFSS 2014 & 2015
15.0%
12.2%
16.0%13.9%
0%
5%
10%
15%
20%
Overweight Obese
Nevada U.S.
Source: YRBSS, 2015

14
Physical Inactivity
Physical activity along with maintaining a healthy weight can facilitate prevention of the onset of diabetes, as well as, help control diabetes and prevent diabetes complications. Physical activity helps blood glucose levels stay in the target range by helping the hormone insulin absorb glucose into the body’s cells, including muscles, to create energy. Since muscles use glucose
better than fat, building and using muscles through physical activity can help prevent high blood glucose levels. Figure 16 shows a definite correlation between lack of regular physical activity and the prevalence of diabetes among adult Nevadans at prevalences of 35% (2014) and 32.5% (2015).
Figure 16 - Prevalence of Nevada Adults Who DID NOT Participate in Leisure Time Physical Activity* within the Past 30 Days Other Than Their Regular Job
*Defined in BRFSS as at least 30 minutes of moderate physical activity on 5 or more days per week, or at least 20 minutes of vigorous physical activity on 3 or more days per week, or an equivalent combination.
Hypertension and Diabetes
High blood pressure/hypertension is frequently a condition affecting Individuals with type 2 diabetes. A 2016 research study published in Population Health Metrics stated,
Diagnosis codes and medication claims suggest 80% of adults diagnosed with type 2 diabetes had hypertension (controlled or uncontrolled, ranging from 91% for Medicare to 61% for Medicaid) 40
It is unknown why there is such a significant correlation between these two chronic diseases, but it is assumed that obesity, a high-fat, high-sodium diet, and inactivity have led to a rise in both conditions.
According to the America Diabetes Association (ADA), the combination of hypertension and type
2 diabetes can significantly raise an individual’s risk of suffering from a heart attack or stroke. Being affected by type 2 diabetes and hypertension also increases chances of developing other diabetes-
35.0%32.5%
21.3% 23.8% 22.5% 24.7%
32.6%
0%
10%
20%
30%
40%
2014 2015 2014 2015 2014 2015
Diabetes No Diabetes Nevada HP 2020
Source: BRFSS 2014 & 2015

15
related diseases, such as kidney disease, and retinopathy which may causes blindness.41 In figure 17 it is evident that this correlation between hypertension and diabetes exist for adults in
Nevada with a prevalence of 70.8% and 60.2% in 2013 and 2015 respectively having both chronic diseases.
Figure 17 - Prevalence of Nevada Adults Who Had Ever Been Told They Have High Blood Pressure by Diabetes Status
Smoking and Diabetes
Tobacco smokers are 30% to 40% more likely to develop type 2 diabetes than nonsmokers.42 Additionally, an individual with diabetes who smokes is more likely than a nonsmoker to have trouble with insulin dosing and with controlling their diabetes. Furthermore, the individual with diabetes who smokes is more likely to develop serious complications. These include heart and kidney disease; poor blood flow in the legs and feet leading to infections, ulcers, and possible amputation; blindness from retinopathy; and peripheral neuropathy resulting in numbness, pain, weakness, and poor coordination caused by damage to nerves in the arms and legs.
Several biologic mechanisms might explain the association between cigarette smoking and the incidence of type 2 diabetes. Multiple lines of evidence support the hypothesis that cigarette smoking and exposure to nicotine can adversely affect insulin action and the function of pancreatic cells, both of which play fundamental roles in the development of diabetes.43
Epidemiologic studies have shown that smoking is independently associated with an increased risk of central obesity which is a recognized risk factor for insulin resistance and diabetes.44
Moreover individuals with diabetes who smoke may be susceptible to the detrimental effects of nicotine on insulin resistance and thus require a larger dose of insulin to achieve a level of metabolic control similar to that of the nonsmokers. Finally, studies have found that nicotine can reduce the release of insulin through neuronal nicotinic acetylcholine receptors on islet cells of the pancreases.45
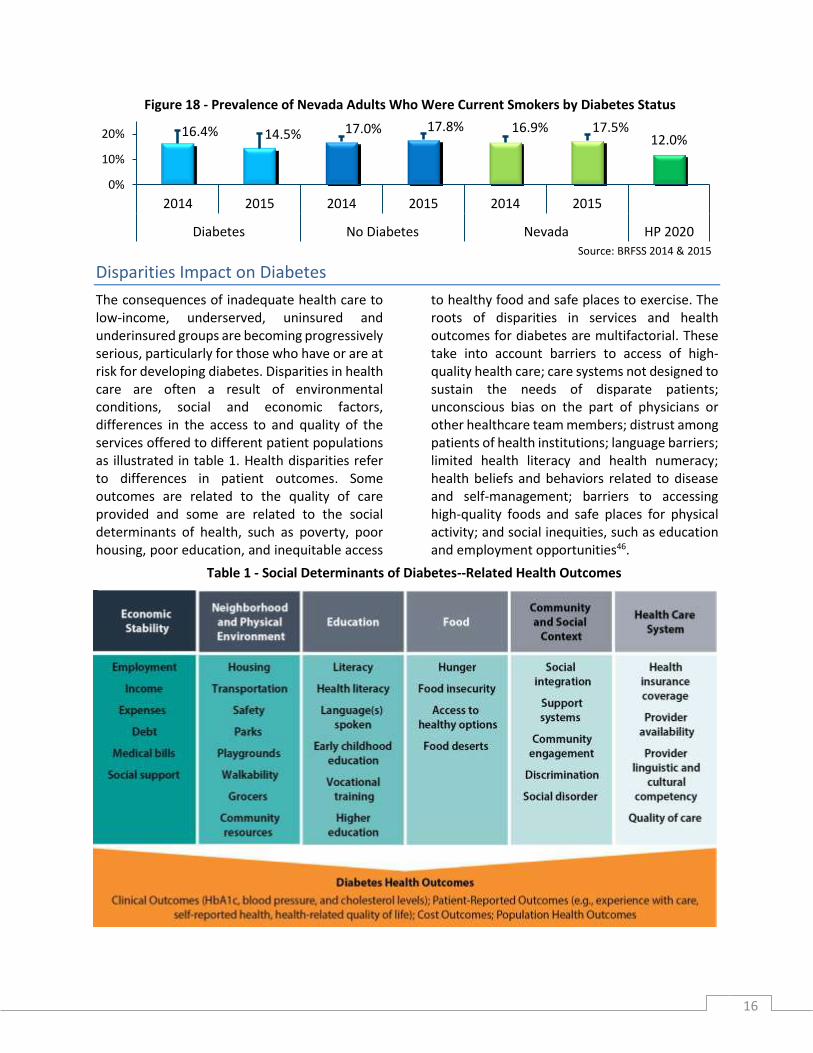
Quitting smoking, in spite of how long an individual has smoked, will improve the health of the individual with diabetes. Figure 18 indicates the prevalence of Nevada adults with diabetes and are current smokers is 16.4% and 14.5% respectively for 2014 and 2015.
70.8%60.2%
26.3% 24.9%30.6% 28.3% 26.9%
0%
20%
40%
60%
80%
2013 2015 2013 2015 2013 2015
Diabetes No Diabetes Nevada HP 2020Source: BRFSS 2013 & 2015
16
Figure 18 - Prevalence of Nevada Adults Who Were Current Smokers by Diabetes Status
Disparities Impact on Diabetes
The consequences of inadequate health care to low-income, underserved, uninsured and underinsured groups are becoming progressively serious, particularly for those who have or are at risk for developing diabetes. Disparities in health care are often a result of environmental conditions, social and economic factors, differences in the access to and quality of the services offered to different patient populations as illustrated in table 1. Health disparities refer to differences in patient outcomes. Some outcomes are related to the quality of care provided and some are related to the social determinants of health, such as poverty, poor housing, poor education, and inequitable access
to healthy food and safe places to exercise. The roots of disparities in services and health outcomes for diabetes are multifactorial. These take into account barriers to access of high-quality health care; care systems not designed to sustain the needs of disparate patients; unconscious bias on the part of physicians or other healthcare team members; distrust among patients of health institutions; language barriers; limited health literacy and health numeracy; health beliefs and behaviors related to disease and self-management; barriers to accessing high-quality foods and safe places for physical activity; and social inequities, such as education and employment opportunities46.
16.4% 14.5% 17.0% 17.8% 16.9% 17.5%12.0%
0%
10%
20%
2014 2015 2014 2015 2014 2015
Diabetes No Diabetes Nevada HP 2020
Source: BRFSS 2014 & 2015
Table 1 - Social Determinants of Diabetes-Related Health Outcomes

17
Race/Ethnicity
Individuals in specific racial and ethnic groups experience the greatest prevalence and widest disparity in outcomes for both type 1 and type 2 diabetes. Type 2 diabetes disproportionately affects African-Americans, American Indians, Hispanics/Latinos, Asian-Americans, and Pacific-Islanders. These groups also make up a disproportionate share of the poor and uninsured. Living in substandard housing or in low-income neighborhoods results in higher rates of overweight and obesity due to lack of healthy food options and opportunities to safely engage in physical activity. Even when minority populations do have access to good food and physical activity, many continue to receive a lower quality of care than non-minorities.47
The American Diabetes Association provides the following U.S. rates of diagnosed diabetes by race/ethnic background: 7.6% of non-Hispanic whites; 9.0% of Asian Americans; 12.8% of Hispanics; 13.2% of non-Hispanic blacks; 15.9% of American Indians/Alaskan Natives.48
Although it is unclear why people of certain races are more prone to the development of prediabetes, just as with the risk for diabetes, men and women of African-American, American
Indian, Hispanic/Latino, and Asian-American descent are at a greater risk.
Figure 19 presents aggregated 2011-2015 BRFSS data by racial/ethnic group. American Indians/ Alaska Natives (AI/AN) and Black/African-Americans had the highest estimated diabetes prevalence among racial/ethnic groups in Nevada at 14.2%, followed by “Other” at estimated prevalence 11.2% and Asian-Americans at an estimated prevalence 10.5% followed by non-Hispanics whites and Hispanics at 9.1% and 8.5 % respectively.
Figure 19 - Prevalence of Nevada Adults with Diabetes by Race/Ethnicity, Aggregate Data (2011-2015)
9.1%
14.2%
8.5%10.5%
14.2%
11.2%
0%
5%
10%
15%
20%
White Black Hispanic Asian AI/AN Other
Source: BRFSS 2011-2015
AI/AN = American Indian/Alaska NativeOther = Native Hawaiian/Pacific Islander, multi racial, and other race
18
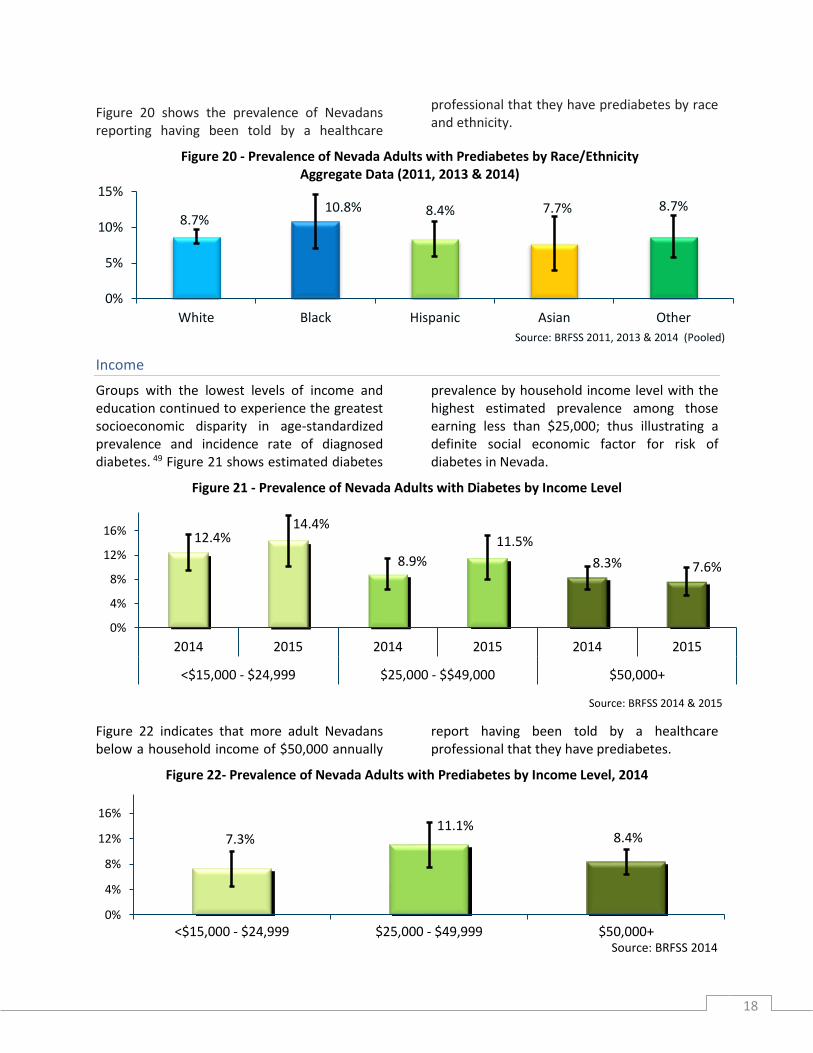
Figure 20 shows the prevalence of Nevadans reporting having been told by a healthcare
professional that they have prediabetes by race and ethnicity.
Figure 20 - Prevalence of Nevada Adults with Prediabetes by Race/Ethnicity Aggregate Data (2011, 2013 & 2014)
Income
Groups with the lowest levels of income and education continued to experience the greatest socioeconomic disparity in age-standardized prevalence and incidence rate of diagnosed diabetes. 49 Figure 21 shows estimated diabetes
prevalence by household income level with the highest estimated prevalence among those earning less than $25,000; thus illustrating a definite social economic factor for risk of diabetes in Nevada.
Figure 21 - Prevalence of Nevada Adults with Diabetes by Income Level
Figure 22 indicates that more adult Nevadans below a household income of $50,000 annually
report having been told by a healthcare professional that they have prediabetes.
Figure 22- Prevalence of Nevada Adults with Prediabetes by Income Level, 2014
8.7%10.8% 8.4% 7.7% 8.7%
0%
5%
10%
15%
White Black Hispanic Asian Other
Source: BRFSS 2011, 2013 & 2014 (Pooled)
12.4%14.4%
8.9%
11.5%
8.3% 7.6%
0%
4%
8%
12%
16%
2014 2015 2014 2015 2014 2015
<$15,000 - $24,999 $25,000 - $$49,000 $50,000+
Source: BRFSS 2014 & 2015
7.3%11.1%
8.4%
0%
4%
8%
12%
16%
<$15,000 - $24,999 $25,000 - $49,999 $50,000+Source: BRFSS 2014

19
Food Insecurity and Diabetes
Food insecurity is a condition that occurs when there is a lack of access to safe and nutritious food. Thus preventing people from living healthy and active lives. Food insecurity can occur when an individual does not have physical or economic access to the food that meets his/her preferences and/or dietary needs. As illustrated in figure 23, the United States Department of Agriculture (USDA) Economic Research Service (ERS) estimated 14.2% of households in Nevada were food insecure based on a three-year average from 2013 to 2015 which is higher than the national average of 13.7% over the same time period.
The USDA defines low and very low food security as follows: Low food security—Households reduced the quality, variety, and desirability of their diets, but the quantity of food intake and normal eating patterns were not substantially disrupted.
Very low food security—At times during the year, eating patterns of one or more household members were disrupted and food intake reduced because the household lacked money and other resources for food.50
Adjusting for socioeconomic status, food insecure adults are 48% more likely to have diabetes. Moreover, food insecurity can threaten diabetes management since an individual’s ability to maintain a healthy blood sugar level and manage their diabetes is dependent on their access to healthy foods. Due to the cyclical eating practices among adults with food insecurity, those with diabetes risk having both blood sugars that are either too high (hyperglycemia) or too low (hypoglycemia).
Binge-eating and reliance on high caloric foods makes blood sugar levels elevate. During periods of food scarcity the individual with diabetes can drop to dangerously low blood sugar levels.51
Food insecurity may increase the patients’ difficulty to follow a diabetes appropriate diet because they shift their dietary intake toward inexpensive, calorically dense foods to maintain caloric needs. These foods include a high proportion of added fats, sugars, and other refined carbohydrates.
13.7
5.4
14.2
5.6
0
2
4
6
8
10
12
14
16
Low or very low food security Very low food security
U.S. NV
Source: USDA - ERS - Household Food Security in the United States in 2015.
Figure 23 - Prevalence of Household Food Insecurity and Very Low Food Security

20
A study conducted in San Francisco among 711 patients with diabetes in a safety net clinic, and published in the February 2012 issue of Diabetes Care stated, more food-insecure participants than food-secure participants had poor glycemic control, defined as an HbA1c ≥8.5% (41.9 vs.
32.8%), with an odds ratio (OR) of 1.48 (95% CI 1.07–2.04. The relationship between FI and poor glycemic control persisted after adjustment (OR 1.46; P = 0.05). Figure 19 provides a graphic representation of this relationship between food insecurity and glycemic control.52
Figure 19 - HbA1c and Food Security Status among Patients with Diabetes Receiving Care in Safety-Net Clinics
Diabetes Prevention, Care and Management
Overwhelming evidence proves that diabetes can be prevented or delayed in high risk population through lifestyle modification or pharmacological interventions. The Diabetes Prevention Study (DPS) and the Diabetes Prevention Program (DPP) compellingly showed that intensive lifestyle modification programs are highly effective in decreasing the risk of diabetes in a high risk population by 58%.53
Individual with a diagnosis of type 2 diabetes are able to manage their diabetes thru controlling blood sugar/glucose levels. Good glycemic control may help reduce the incidence of long-term diabetes complications such as vision decline, kidney disease or damage, nerve damage, and microvascular disease. Individuals with diabetes can achieve good glycemic control by eating healthy, regularly participating in
34.18%
24.01%
17.23%
9.32%5.93%
9.32%
28.72%
21.62%17.91%
9.80%7.43%
14.53%
0%
7%
14%
21%
28%
35%
<=7.0 7.1-8.0 8.1-9.0 9.1-10.0 10.1-11.0 >11
HbA1c Levels
Food secure n=354 Food insecure n=296
Source: Diabetes Care. 2012 Feb; 35(2): 233–238.

21
physical activity, achieving a healthy weight and appropriately taking prescribed medications to lower blood glucose levels. An additionally critical part of diabetes management is reducing cardiovascular disease risk factors, like high blood pressure, high lipid levels, and tobacco use.
Uncontrolled diabetes is a leading cause of cardiovascular mortality and morbidity and may contribute to other complications, such as vision loss, renal failure, and amputation.
Diabetes is the leading cause of kidney failure nationally, accounting for more than 44% of new cases of end-stage renal disease in 2011. Nontraumatic lower-limb amputations among individuals aged 20 years and older with diabetes occur at a rate of 60%.54
Reducing risk for diabetes complications requires active disease management by the individual with diabetes in partnership with a team of health care professionals including primary care physicians, endocrinologists, diabetes educators, and dietitians.
Patient education and self-management practices are important aspects of disease management that help people with diabetes stay healthy and manage their diabetes.
The ability to follow recommended preventive care practices and lifestyle changes relates directly to the patient accessing health care; participating in diabetes prevention or diabetes self-management education classes; securing healthy food; monitoring blood glucose levels via at least biannual A1c blood test; and receiving annual eye and foot exams, and vaccinations for influenza and pneumonia.55
Access to Care
Access to health services encompasses a broad set of issues that centers on the level to which an individual or group is able to obtain needed services from a healthcare system. Access to care is defined by four components: coverage, services, timeliness, and workforce. Insurance coverage and proximity of a healthcare provider is no guarantee that an individual who needs service will get them. The Institute of Medicine (IOM) has defined access to care as:
The timely use of personal health services to achieve the best possible health outcomes. The IOM further clarifies, an important characteristic of this definition is that it relies on both the use of health services and health outcomes as yardsticks for judging whether access has been achieved.56
Access to health care is critical for people with diabetes. Lacking health insurance affects the treatment and outcome of diabetes care. Individuals without insurance coverage for blood glucose monitoring supplies have a 0.5% higher A1c than those with coverage.57
In Nevada, along with the rest of the country, progress has been made in the area of insurance coverage for persons with diabetes. The history of legislative action in Nevada includes coverage of diabetes medications, supplies, equipment,
and Diabetes Self-Management Education (DSME) provided by either American Association of Diabetes Educators (AADE) - Accredited or American Diabetes Association (ADA) - Recognized program providers.
22
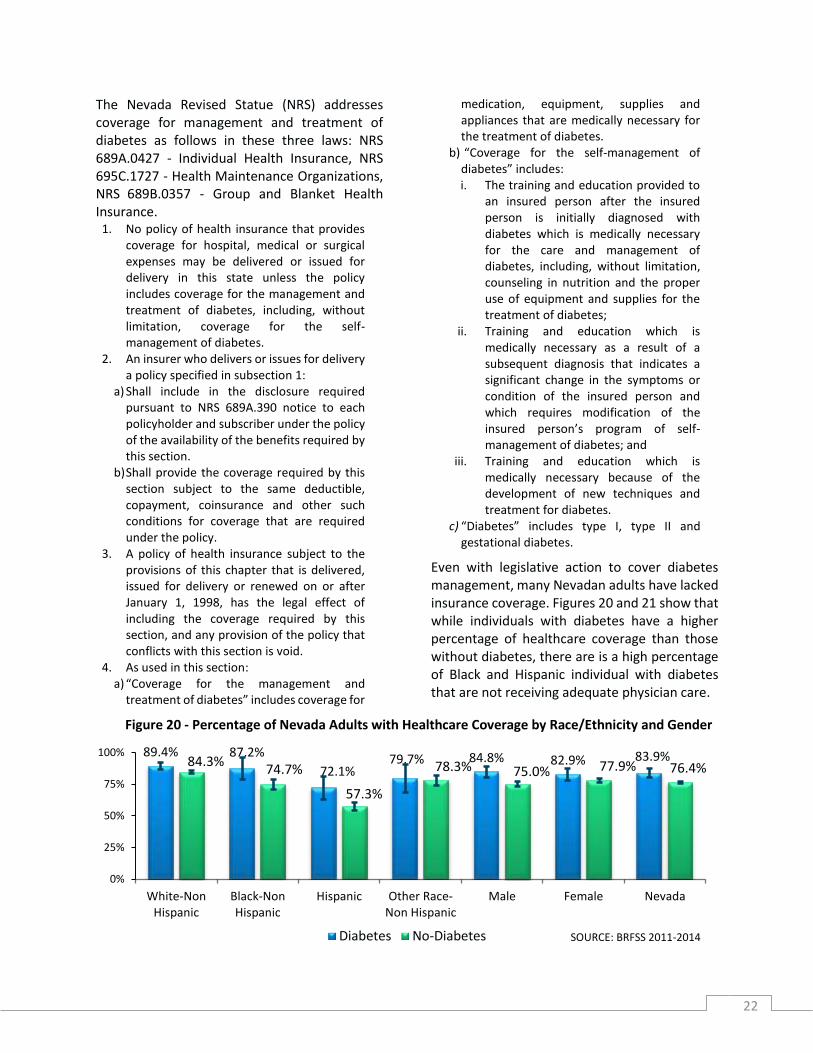
The Nevada Revised Statue (NRS) addresses coverage for management and treatment of diabetes as follows in these three laws: NRS 689A.0427 - Individual Health Insurance, NRS 695C.1727 - Health Maintenance Organizations, NRS 689B.0357 - Group and Blanket Health Insurance.
1. No policy of health insurance that provides coverage for hospital, medical or surgical expenses may be delivered or issued for delivery in this state unless the policy includes coverage for the management and treatment of diabetes, including, without limitation, coverage for the self-management of diabetes.
2. An insurer who delivers or issues for delivery a policy specified in subsection 1:
a) Shall include in the disclosure required pursuant to NRS 689A.390 notice to each policyholder and subscriber under the policy of the availability of the benefits required by this section.
b) Shall provide the coverage required by this section subject to the same deductible, copayment, coinsurance and other such conditions for coverage that are required under the policy.
3. A policy of health insurance subject to the provisions of this chapter that is delivered, issued for delivery or renewed on or after January 1, 1998, has the legal effect of including the coverage required by this section, and any provision of the policy that conflicts with this section is void.
4. As used in this section: a) “Coverage for the management and
treatment of diabetes” includes coverage for
medication, equipment, supplies and appliances that are medically necessary for the treatment of diabetes.
b) “Coverage for the self-management of diabetes” includes: i. The training and education provided to
an insured person after the insured person is initially diagnosed with diabetes which is medically necessary for the care and management of diabetes, including, without limitation, counseling in nutrition and the proper use of equipment and supplies for the treatment of diabetes;
ii. Training and education which is medically necessary as a result of a subsequent diagnosis that indicates a significant change in the symptoms or condition of the insured person and which requires modification of the insured person’s program of self-management of diabetes; and
iii. Training and education which is medically necessary because of the development of new techniques and treatment for diabetes.
c) “Diabetes” includes type I, type II and gestational diabetes.
Even with legislative action to cover diabetes management, many Nevadan adults have lacked insurance coverage. Figures 20 and 21 show that while individuals with diabetes have a higher percentage of healthcare coverage than those without diabetes, there are is a high percentage of Black and Hispanic individual with diabetes that are not receiving adequate physician care.
Figure 20 - Percentage of Nevada Adults with Healthcare Coverage by Race/Ethnicity and Gender
89.4% 87.2%
72.1%79.7% 84.8% 82.9% 83.9%84.3%
74.7%
57.3%
78.3% 75.0% 77.9% 76.4%
0%
25%
50%
75%
100%
White-NonHispanic
Black-NonHispanic
Hispanic Other Race-Non Hispanic
Male Female Nevada
SOURCE: BRFSS 2011-2014 Diabetes No-Diabetes

23
Figure 21 - Percentage of Nevada Adults who COULD NOT See a Doctor Due to Cost within the Past 30 Days by Race/Ethnicity and Gender, Aggregate Data (2011-2015)
Furthermore, Table 2 shows that in 2012, 580,573 or 24.5% of Nevadans under the age of
65 were uninsured statewide; and among the rural and frontier residents 50,533 or 22.9%
12.5%
29.0% 28.4%
20.4% 14.5%
24.0%
18.9%14.8%
21.7% 23.3%
15.6% 14.9%
20.0%17.5%
0%
10%
20%
30%
40%
White-NonHispanic
Black-NonHispanic
Hispanic Other Race-Non Hispanic
Male Female Nevada
Source: BRFSS 2011-2015 Diabetes No-Diabetes
Table 2 - Health Insurance Coverage for Population under the Age of 65 in Nevada, by County 2012
Region/County
Estimated Population Under the Aged of 65
Uninsured Population Insured Population Total Population
Aged 65 and Under
Number Percent Number Percent
Rural and Frontier
Churchill County 4,694 23.3 15,449 76.7 20,143
Douglas County 7,302 20.2 28,759 79.8 36,061
Elko County 9,672 21.1 36,119 78.9 45,791
Esmeralda County 182 31.4 399 68.6 582
Eureka County 356 20.9 1,345 79.1 1,701
Humboldt County 3,671 24.3 11,422 75.7 15,093
Lander County 1,042 20.3 4,091 79.7 5,133
Lincoln County 1,086 26.1 3,080 73.9 4,167
Lyon County 10,651 25.5 31,167 74.5 41,817
Mineral County 823 23.2 2,718 76.8 3,541
Nye County 7,854 24.7 23,910 75.3 31,764
Pershing County 1,055 25.1 3,151 74.9 4,206
Storey County 704 23.5 2,296 76.5 2,999
White Pine County 1,441 19.7 5,866 80.3 7,307
Region Subtotal 50,533 22.9 169,772 77.1 220,305
Urban
Carson City 10,291 24.2 32,287 75.8 42,579
Clark County 433,402 25 1,301,388 75 1,734,790
Washoe County 86,347 23.5 281,827 76.5 368,174
Region Subtotal 530,040 24.7 1,615,502 75.3 2,145,543
Nevada Total 580,573 24.5 1,785,274 75.5 2,365,848

24
were uninsured (Note: The Small Area Health Insurance estimates are single-year estimates produced annually using a model based upon and consistent with the American Community Survey areas of interest. These survey estimates are “enhanced” with administrative data, within a Hierarchical Bayesian framework. Data is consistent over time from 2008 to 2012.
Table 3 indications that 573,874 Nevadans or 20.3% of the population were enrolled in 2014 in Nevada Medicaid, including 47,638 rural and frontier residents. This represents an increased by 374,388 or 187.7% in Nevada Medicaid enrollment from 2004 to 2014. (Note: Enrollment increased between 2013 and 2014 due to the implementation of the Affordable Care Act.)
Table 3 - Medicaid Enrollment in Nevada by County – 2004 & 2014
Region/County
Medicaid Enrollment
2004 2014 Change
2004 to 2014
Number Percent of Population
Number Percent of Population
Number Percent
Rural and Frontier
Churchill County 2,521 9.9 5,319 20.9 2,798 111%
Douglas County 1,684 3.5 4,939 10.2 3,255 193.3%
Elko County 3,317 6.1 6,797 12.5 3,480 104.9%
Esmeralda County 100 11 123 13.5 23 23%
Eureka County 70 3.4 136 6.6 66 94.3%
Humboldt County 1,358 7.6 2,644 14.8 1,286 94.7%
Lander County 454 6.9 917 14 463 102%
Lincoln County 453 8.9 688 13.6 235 51.9%
Lyon County 3,662 6.9 11,110 20.8 7,448 203.4%
Mineral County 783 17.5 1,088 24.3 305 39
Nye County 4,899 10.9 11,308 25.2 6,409 130.8
Pershing County 431 6.2 818 11.7 387 89.8
Storey County 46 1.1 140 3.5 94 204.3
White Pine County 981 9.6 1,611 15.7 630 64.2
Region Subtotal 20,759 8.1 47,638 16.7 26,879 129.5
Urban
Carson City 6,370 11.6 13,133 24 6,763 106.2
Clark County 141,926 6.9 427,242 20.8 285,316 201
Washoe County 30,431 7 85,861 19.6 55,430 182.1
Region Subtotal 178,727 8.3 526,236 20.7 347,509 194.4
Nevada – Total 199,486 8.3 573,874 20.3 374,388 187.7
Diabetes Prevention Programs currently are not a covered benefit in Nevada. However, commencing on January 1, 2018, the Centers for Medicare and Medicaid Services (CMS) will provide coverage for the CDC Recognized Diabetes Prevention Programs for the Medicare population. The program has been named the Medicare Diabetes Prevention Program (MDPP).
The decision to cover MDPP stems from the CMS Office of the Actuary certification in March 2016 which was initiated from an innovation grant with the YMCA of the USA.58 CMS is continuing groundbreaking efforts by launching the “Medicare Supplier” category for non-traditional healthcare team providers, such as Certified Health Education Specialist, Register Dieticians,
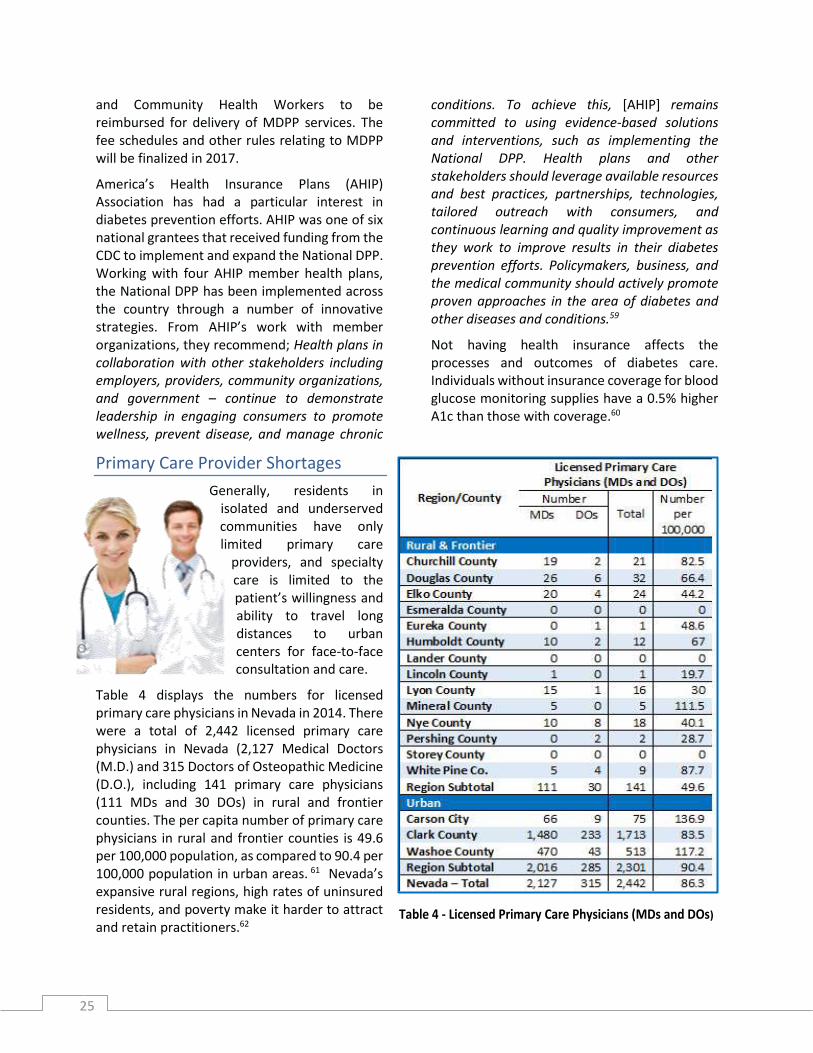
25
and Community Health Workers to be reimbursed for delivery of MDPP services. The fee schedules and other rules relating to MDPP will be finalized in 2017.
America’s Health Insurance Plans (AHIP) Association has had a particular interest in diabetes prevention efforts. AHIP was one of six national grantees that received funding from the CDC to implement and expand the National DPP. Working with four AHIP member health plans, the National DPP has been implemented across the country through a number of innovative strategies. From AHIP’s work with member organizations, they recommend; Health plans in collaboration with other stakeholders including employers, providers, community organizations, and government – continue to demonstrate leadership in engaging consumers to promote wellness, prevent disease, and manage chronic
conditions. To achieve this, [AHIP] remains committed to using evidence-based solutions and interventions, such as implementing the National DPP. Health plans and other stakeholders should leverage available resources and best practices, partnerships, technologies, tailored outreach with consumers, and continuous learning and quality improvement as they work to improve results in their diabetes prevention efforts. Policymakers, business, and the medical community should actively promote proven approaches in the area of diabetes and other diseases and conditions.59
Not having health insurance affects the processes and outcomes of diabetes care. Individuals without insurance coverage for blood glucose monitoring supplies have a 0.5% higher A1c than those with coverage.60
Primary Care Provider Shortages
Generally, residents in isolated and underserved communities have only limited primary care
providers, and specialty care is limited to the patient’s willingness and ability to travel long distances to urban centers for face-to-face consultation and care.
Table 4 displays the numbers for licensed primary care physicians in Nevada in 2014. There were a total of 2,442 licensed primary care physicians in Nevada (2,127 Medical Doctors (M.D.) and 315 Doctors of Osteopathic Medicine (D.O.), including 141 primary care physicians (111 MDs and 30 DOs) in rural and frontier counties. The per capita number of primary care physicians in rural and frontier counties is 49.6 per 100,000 population, as compared to 90.4 per 100,000 population in urban areas. 61 Nevada’s expansive rural regions, high rates of uninsured residents, and poverty make it harder to attract and retain practitioners.62
Table 4 - Licensed Primary Care Physicians (MDs and DOs)
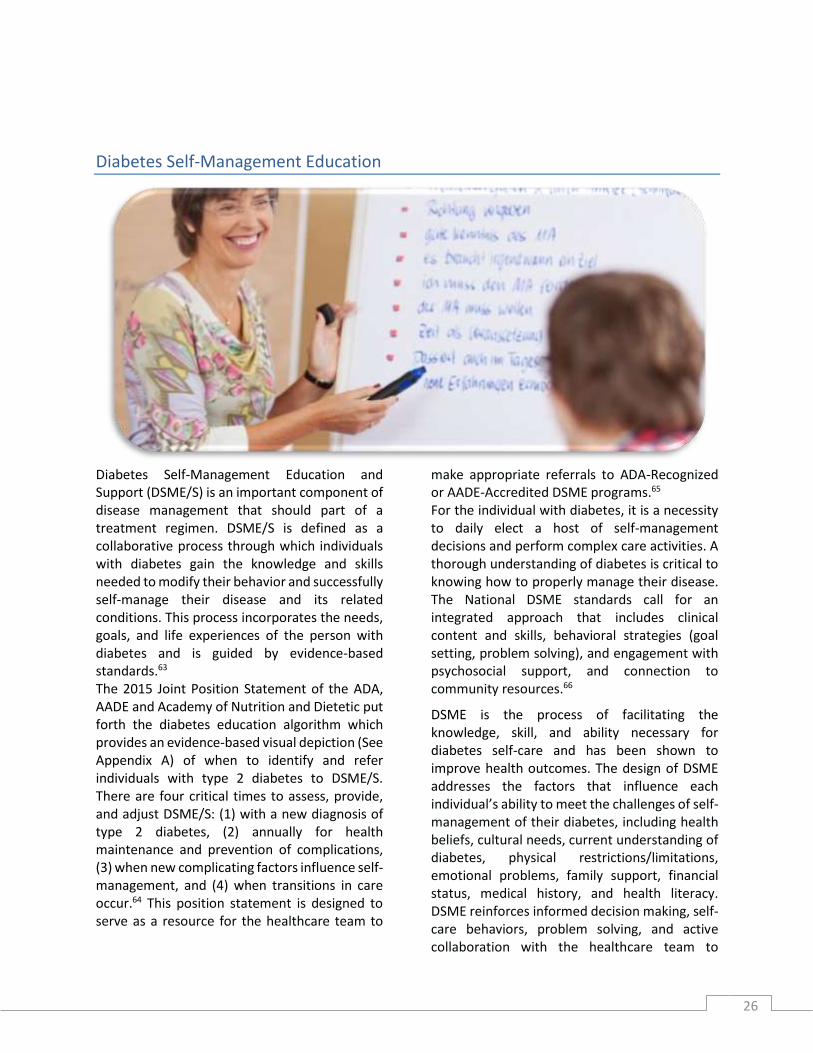
26
Diabetes Self-Management Education
Diabetes Self-Management Education and Support (DSME/S) is an important component of disease management that should part of a treatment regimen. DSME/S is defined as a collaborative process through which individuals with diabetes gain the knowledge and skills needed to modify their behavior and successfully self-manage their disease and its related conditions. This process incorporates the needs, goals, and life experiences of the person with diabetes and is guided by evidence-based standards.63 The 2015 Joint Position Statement of the ADA, AADE and Academy of Nutrition and Dietetic put forth the diabetes education algorithm which provides an evidence-based visual depiction (See Appendix A) of when to identify and refer individuals with type 2 diabetes to DSME/S. There are four critical times to assess, provide, and adjust DSME/S: (1) with a new diagnosis of type 2 diabetes, (2) annually for health maintenance and prevention of complications, (3) when new complicating factors influence self-management, and (4) when transitions in care occur.64 This position statement is designed to serve as a resource for the healthcare team to
make appropriate referrals to ADA-Recognized or AADE-Accredited DSME programs.65 For the individual with diabetes, it is a necessity to daily elect a host of self-management decisions and perform complex care activities. A thorough understanding of diabetes is critical to knowing how to properly manage their disease. The National DSME standards call for an integrated approach that includes clinical content and skills, behavioral strategies (goal setting, problem solving), and engagement with psychosocial support, and connection to community resources.66
DSME is the process of facilitating the knowledge, skill, and ability necessary for diabetes self-care and has been shown to improve health outcomes. The design of DSME addresses the factors that influence each individual’s ability to meet the challenges of self-management of their diabetes, including health beliefs, cultural needs, current understanding of diabetes, physical restrictions/limitations, emotional problems, family support, financial status, medical history, and health literacy. DSME reinforces informed decision making, self-care behaviors, problem solving, and active collaboration with the healthcare team to
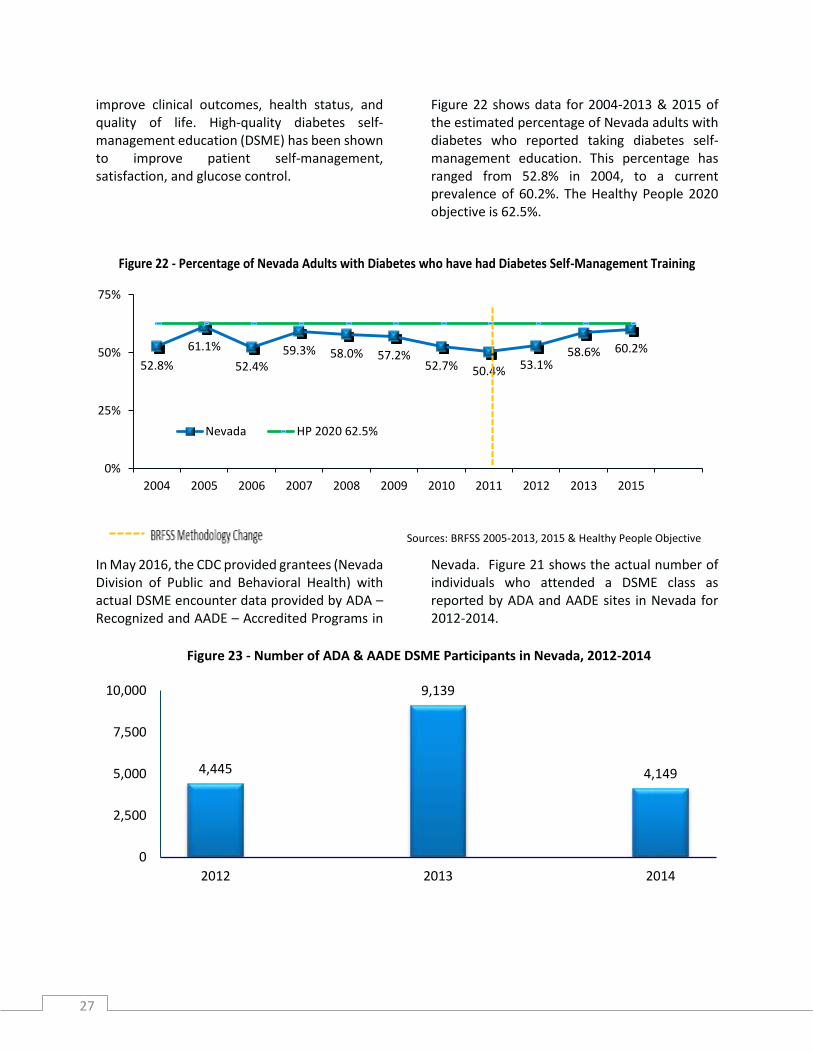
27
improve clinical outcomes, health status, and quality of life. High-quality diabetes self-management education (DSME) has been shown to improve patient self-management, satisfaction, and glucose control.
Figure 22 shows data for 2004-2013 & 2015 of the estimated percentage of Nevada adults with diabetes who reported taking diabetes self-management education. This percentage has ranged from 52.8% in 2004, to a current prevalence of 60.2%. The Healthy People 2020 objective is 62.5%.
Figure 22 - Percentage of Nevada Adults with Diabetes who have had Diabetes Self-Management Training
In May 2016, the CDC provided grantees (Nevada Division of Public and Behavioral Health) with actual DSME encounter data provided by ADA – Recognized and AADE – Accredited Programs in
Nevada. Figure 21 shows the actual number of individuals who attended a DSME class as reported by ADA and AADE sites in Nevada for 2012-2014.
Figure 23 - Number of ADA & AADE DSME Participants in Nevada, 2012-2014
52.8%
61.1%
52.4%59.3% 58.0% 57.2%
52.7% 50.4% 53.1%58.6% 60.2%
0%
25%
50%
75%
2004 2005 2006 2007 2008 2009 2010 2011 2012 2013 2015
Sources: BRFSS 2005-2013, 2015 & Healthy People Objective
Nevada HP 2020 62.5%
4,445
9,139
4,149
0
2,500
5,000
7,500
10,000
2012 2013 2014

28
Nevada was not alone with this major increase from 2012-2013 and a very similar decrease from 2013-2014. Thus, CDC, ADA and AADE took a closer look at the data to get an understanding of the trends. They stated:
The main reason for the data variances from year to year were: Data for programs with November or December anniversary dates were not being included in the annual counts if programs submitted their Annual Status Reports the following year. This problem has since been corrected. Large, multi-site DSME programs also closed in some states. In 2012 and 2013, there was a big jump in initial accreditation applications; therefore, program data were not available or included in the state totals until 2013 and 2014, respectively.67
Unfortunately, Nevada also lost two program delivery sites: the Valley Hospital site connected to Valley Health Systems in Las Vegas and Diabetes Health Services in Elko during this time which may reflect some of the drop in numbers in Nevada. To fill the gap in Elko the state has been working with the Partners Allied for Community Excelence (PACE) Coalition to offer Stanford DSMP in English and Spanish. See the map abover and appendix B for DSME and DPP sites in Nevada.
Figure 24 illustrates aggregated data (2011-2013 & 2015) for the percentage of Nevada adults who have had diabetes self-management education/training by racial/ethnic group. The “Other Race-Non Hispanic” category includes Asian-American/Pacific-Islanders and American Indians/Alaska Natives. Hispanic people with diabetes reported the lowest rate of diabetes self-management training, at an estimated 47.9%.
This map indicates the AADE sites in red, ADA sites in green and the Stanford sites in blue.

29
Figure 24 - Prevalence of Nevada Adults with Diabetes Who Have Had Self-Management Training by
Race/Ethnicity, 2011-2013, & 2015 Aggregate Data
One reason for this low participation rate among Hispanics may stem from the fact there is a language barrier. In an assessment completed in
July 2014, only three ADA or AADE programs reported offering DSME serves in Spanish, two in Las Vegas and one in Reno.68
A1c Testing
Blood sugar control is a critical part of diabetes management. Whether an individual has their diabetes under control is generally determined by hemoglobin A1c levels – with A1c < 7% often considered tight control, A1c > 9% considered uncontrolled, and recommended individual patient targets as high as 8.5% depending on a patient’s circumstances. 69 Hemoglobin A1c, also known as glycated hemoglobin or A1c, is formed in the blood when glucose attaches to hemoglobin. The higher the level of glucose in the blood, the more glycated hemoglobin is
formed. The A1c test measures average blood sugar levels over a period of the last two to three months. Recommendations of current clinical practice stipulates that the A1c test be performed at least two times per year for patients who are meeting treatment goals and quarterly in patients whose therapy has changed or who are not meeting glycemic goals.70 Figure 25 shows the percentage of persons with diabetes who report receiving an A1c test at least twice within the past year.
Figure 25 - Prevalence of Nevada Adults with Diabetes Receiving an A1C Test Twice within the Past Year, 2004-2013 & 2015
56.6%64.6%
47.9%54.8% 55.4%
62.5%
0%
20%
40%
60%
80%
White-NonHispanic
Black-NonHispanic
Hispanic Other Race-Non Hispanic
Nevada HP 2020
Source: BRFSS 2011-2013, 2015 & Healthy People Objective
58.4%63.1%
51.8%61.9% 62.1% 58.8%
63.4% 62.7% 65.7%57.0%
68.9%
0%
20%
40%
60%
80%
2004 2005 2006 2007 2008 2009 2010 2011 2012 2013 2015
Source: BRFSS 2004-2013, 2015 & Healthy People 2020 Objectives
NevadaHP 2020 71.1%
- - - - - BRFSS Methodology Change

30
Figure 26 shows aggregated data (2011-2013 and 2015) for the percentage of Nevada adults with diabetes who receive A1c tests at least
twice per year by racial/ethnic groups. The Other category includes Asian-Americans/Pacific- Islanders and American Indians/Alaska Natives.
Figure 26 - Prevalence of Nevada Adults with Diabetes Who Have Had an A1c Test Twice in the Past Year by Race/Ethnicity, Aggregate Data: 2011-2013, & 2015
Table 5 from the Nevada Diabetes and Cardiovascular Disease Report, 2016, indicates that almost one thirds (30.9%) of Nevada type 2 diabetes patients covered by Medicaid had A1c levels above 9.0%. An A1c greater than 9%
indicates patients who are in poor control and at highest risk of complications. Also noteworthy is commercial insurance patients had an A1c level in this highest range at a rate of one in six.71
Table 5 - Percentage of Type 2 Diabetes Patients, By A1c Level Range and by Payer, 2015
< 7.0% 7.1-7.9% 8.0-9.0% >9.0%
Commercial Ins.**
Medicare Medicaid Commercial
Ins.** Medicare Medicaid
Commercial Ins.**
Medicare Medicaid Commercial
Ins.** Medicare Medicaid
Las Vegas 49.9% 58.2% 42.1% 20.6% 21.2% 17.4% 13.7% 10.5% 16.4% 15.8% 10.1% 24.2%
Reno 47.3% 53.6% 37.4% 20.4% 22.6% 16.9% 15.9% 12.6% 12.1% 16.4% 11.1% 33.7%
Nevada 48.0% 56.0% 35.3% 20.5% 21.9% 16.8% 14.8% 11.8% 17.1% 16.7% 10.4% 30.9%
U.S. 47.7% 52.3% 42.5% 21.7% 21.9% 18.0% 13.9% 13.0% 14.3% 16.7% 12.8% 25.2% *The A1c test measures the amount of glucose present in the blood during the past 2–3 months. Figures reflect the percentage of type 2 diabetes patients who have had at least one A1c test in a given year.
**Includes HMOs, PPOs, point-of-service plans, and exclusive provider organizations. Data source: IMS Health © 2016
67.3%
73.4%
53.2% 53.2% 63.4%71.1%
0%
20%
40%
60%
80%
100%
White-NonHispanic
Black-NonHispanic
Hispanic Other Race-NonHispanic
Nevada HP 2020
Source: BRFSS 2011-2013, 2015 & Healthy People Objective

31
Foot Exams and Lower Extremity Amputations
Diabetic foot complications can be frequent, complicated, and expensive. Foot ulcers and amputations are a major cause of morbidity, disability, as well as emotional trauma for people with diabetes. Early recognition and management of risk factors for ulcers and amputations can prevent or delay the onset of adverse outcomes.
Diabetic neuropathy increases risk for foot problems. Neuropathy often causes pain, tingling, and numbness. Peripheral Arterial Disease (PAD) also occurs in individuals with diabetes when blood vessels in the feet and legs are narrowed or blocked by fatty deposits.72
All patients with diabetes should have their feet evaluated at least yearly for the presence of the predisposing factors for ulceration and amputation such as, neuropathy, vascular disease, and deformities. This action mandates aggressive and proactive preventative assessments by generalists and specialists.
In figure 27, the prevalence of Nevada adults with diabetes reporting at least one foot exam by their health care provider in the previous year has ranged between 59% and 73.1%.
Figure 27 - Prevalence of Nevada Adults Who Had Their Feet Checked in the Past Year 2004-2015
Figure 28 shows aggregated data (2011-2013, 2015) for the estimated prevalence of Nevada adults with diabetes who receive annual foot exams by racial/ethnic group. The Other category includes Asian-American/Pacific-
Islanders and American Indians/Alaska Natives. The racial/ethnic group with the highest estimated percentage of individuals with diabetes who receive an annual foot exam in Nevada was Black non-Hispanics at 73.2%.
61.7%69.8%
59.0%62.9% 61.2% 63.2% 60.6%
69.5%
59.7%66.8%
73.1%
0%
20%
40%
60%
80%
2004 2005 2006 2007 2008 2009 2010 2011 2012 2013 2015
Source: BRFSS 2004-2013, 2015 & Healthy People 2020 Objective
Nevada HP 2020 74.8%
- - - - BRFSS Methodology Change
For a diabetic patient, a mere nick while clipping nails, or a blister from an ill-fitting shoe, can begin the march toward amputation, according to Dr. Inman. “About 600,000 people with diabetes get foot ulcers every year,” he says. “Poor blood flow in the lower legs makes those ulcers slow to heal. And loss of sensation in the feet, called neuropathy, makes patients slow to notice even small wounds that can rapidly turn gangrenous.”

32
Hispanics represented the lowest estimated percentage receiving an annual foot exam at
53.8%. All racial/ethnic groups were lower than the Healthy People 2020 objective of 74.8%.
According to the American Podiatric Medical Association (APMA), diabetes is the leading cause of preventable, non-traumatic lower limb amputation of which 73,000 were performed in the United States in 2010.73 The average cost of each amputation was $70,434. Unfortunately, preventive foot exams by podiatrist are not
cover a covered benefit by all public and private insurers in Nevada. Figure 29 shows the crude rate for lower extremity amputations performed in Nevada from 2010 to 2014 where diabetes was the primary diagnosis.
Figure 29 - Crude Rate for Lower Extremity Amputations among Nevada Patients with Diabetes in Any Diagnoses Code 2010-2014
The APMA advises that the inclusion of care provided by podiatrists for those with diabetes would save the U.S. healthcare system $3.5 billion per year. This is based on the findings that every $1 invested in podiatric care results in $27 to $51 savings for commercial insurance and $9 to $13 savings for Medicare.74
Furthermore, individuals with diabetes should practice self-care by checking their own feet weekly if they have not had complication; and daily if they have lost sensation and/or have a history of food sores, cuts or other problems. If any new issues or irregularities are noticed or if any ailments has worsened, the healthcare provider should be contacted.
10.311.8 11.8 12.5 13.4
0
5
10
15
2010 2011 2012 2013 2014Source: Nevada Hospital Inpatient Billing
Figure 28 - Prevalence of Nevada Adults with Diabetes Who Have Had Their Feet Checked in the Past Year by Race/Ethnicity, Aggregate Data: 2011-2013, & 2015
71.3%
76.4%
52.8%64.8% 67.3%
74.8%
0%
20%
40%
60%
80%
100%
White-NonHispanic
Black-NonHispanic
Hispanic Other Race-Non Hispanic
Nevada HP 2020
Source: BRFSS 2011-2013, 2015 & Healthy People Objective

33
Eye Exams
Diabetic retinopathy affects eight million Americans with diabetes and is the leading cause of blindness in adults. Diabetic retinopathy results from damage to the small blood vessels of the retina which can break down, leak, or become blocked. When this damage occurs, it affects oxygen and nutrient delivery to the retina. Over time this leads to impaired vision. An individual with diabetes is more likely to develop diabetic retinopathy if they have poorly controlled blood sugar. They are at increased risk for diabetic retinopathy if they also have high blood pressure, high cholesterol and/or smoke tobacco.75
Yearly dilated eye examination can be used to detect and prevent vision loss. Figure 30 shows the prevalence of adult Nevadans with diabetes reporting an annual dilated eye exam from 2004 to 2015. Except for 2011 and 2012, Nevada has exceeded the Healthy People 2020 objective of 58.7%.
Figure 30 - Prevalence of Nevada Adults with Diabetes Who Have Had an Annual Dilated Eye Exam 2004-2013, 2015
Figure 31 shows aggregated data (2011-2013, 2015) for the percentage of Nevada adults with diabetes who received an annual dilated eye exam by racial/ethnic group. The Other category includes Asian-Americans/Pacific-Islanders and
American Indians/Alaska Natives. Black-Non Hispanics had the highest prevalence of receiving an annual dilated eye exam at 75%; while Hispanics had the lowest percentage at 51.9%.
67.9%59.0%
67.5% 66.9% 63.5% 67.9% 66.3%
55.2% 56.2%
67.7% 71.7%
0%
20%
40%
60%
80%
100%
2004 2005 2006 2007 2008 2009 2010 2011 2012 2013 2015
Source: BRFSS 2004-2013, 2015 & Healthy People 2020 Objective
Nevada
HP 2020 58.7%

34
Figure 31 - Prevalence of Nevada Adults with Diabetes Who Have Had an Annual Dilated Eye Exam by Race/Ethnicity, Aggregate Data: 2011-2013, 2015
Immunizations
Immunizations are important for all adults to keep current. Individual with diabetes, even if well managed, may have an increased risk for more serious complications from an illness compared to people without diabetes.76 People with diabetes (both type 1 and type 2) are at higher risk for serious problems from certain vaccine-preventable diseases. Thus, individuals with diabetes are more likely than people without diabetes to suffer from complications caused by influenza (flu) and pneumonia. Influenza, can raise blood glucose to dangerously high levels. People with diabetes are at increased risk of death from pneumonia (lung infection), bacteremia (blood infection) and meningitis (infection of the lining of the brain and spinal cord).77 Flu and pneumonia immunizations are an effective strategy to reduce illness and deaths. Hence, individuals with diabetes are encouraged to receive an annual influenza vaccination.
Influenza Vaccination
Figure 32 shows the prevalence of Nevada adults with diabetes who report receiving an annual influenza vaccination. In 2015 the prevalence of Nevada adults with diabetes who received an
annual influenza vaccination was 63.5% for those aged 65 years and older and 36.9% for those aged 18 to 64. Nevada is well below the recommended Healthy People 2020 rate of 70%.
65.3%75.0%
51.9% 56.6% 62.5% 58.7%
0%
20%
40%
60%
80%
100%
White-NonHispanic
Black-NonHispanic
Hispanic Other Race-NonHispanic
Nevada HP 2020
Source: BRFSS 2011-2013, 2015 & Healthy People Objective
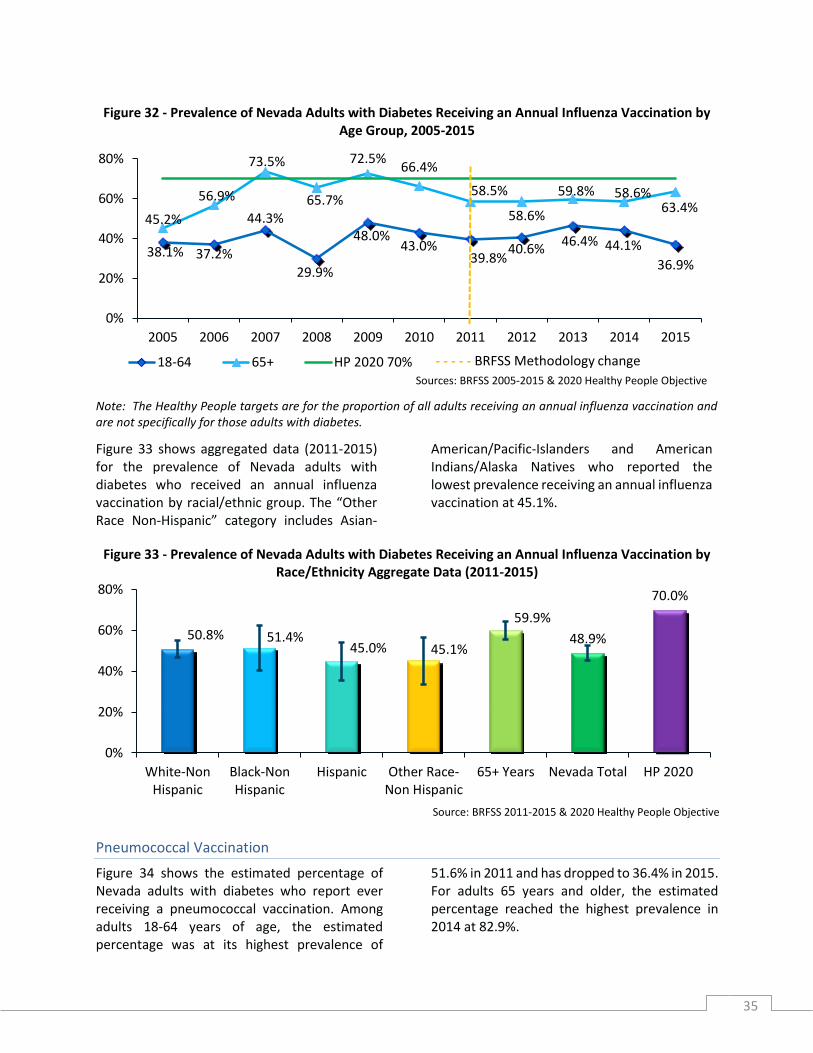
35
Figure 32 - Prevalence of Nevada Adults with Diabetes Receiving an Annual Influenza Vaccination by Age Group, 2005-2015
Note: The Healthy People targets are for the proportion of all adults receiving an annual influenza vaccination and are not specifically for those adults with diabetes.
Figure 33 shows aggregated data (2011-2015) for the prevalence of Nevada adults with diabetes who received an annual influenza vaccination by racial/ethnic group. The “Other Race Non-Hispanic” category includes Asian-
American/Pacific-Islanders and American Indians/Alaska Natives who reported the lowest prevalence receiving an annual influenza vaccination at 45.1%.
Figure 33 - Prevalence of Nevada Adults with Diabetes Receiving an Annual Influenza Vaccination by Race/Ethnicity Aggregate Data (2011-2015)
Pneumococcal Vaccination
Figure 34 shows the estimated percentage of Nevada adults with diabetes who report ever receiving a pneumococcal vaccination. Among adults 18-64 years of age, the estimated percentage was at its highest prevalence of
51.6% in 2011 and has dropped to 36.4% in 2015. For adults 65 years and older, the estimated percentage reached the highest prevalence in 2014 at 82.9%.
38.1% 37.2%
44.3%
29.9%
48.0%43.0%
39.8%40.6%
46.4% 44.1%
36.9%
45.2%
56.9%
73.5%
65.7%
72.5%66.4%
58.5%
58.6%
59.8% 58.6%63.4%
0%
20%
40%
60%
80%
2005 2006 2007 2008 2009 2010 2011 2012 2013 2014 2015
Sources: BRFSS 2005-2015 & 2020 Healthy People Objective
18-64 65+ HP 2020 70% - - - - - BRFSS Methodology change
50.8% 51.4%45.0% 45.1%
59.9%
48.9%
70.0%
0%
20%
40%
60%
80%
White-NonHispanic
Black-NonHispanic
Hispanic Other Race-Non Hispanic
65+ Years Nevada Total HP 2020
Source: BRFSS 2011-2015 & 2020 Healthy People Objective

36
Note: These Healthy People targets are for the proportion of all adults ever receiving a pneumococcal vaccination and are not specifically for those adults with diabetes.
Figure 35 shows aggregated data (2011-2015) for the percentage of Nevada adults with diabetes who had ever received a pneumococcal vaccination by racial/ethnic group. The Other category includes Asian-American/Pacific-
Islanders and American Indians/Alaska Natives. Hispanic individuals with diabetes had the lowest estimated percentage of ever received a pneumococcal vaccination.
Figure 35 - Prevalence of Nevada Adults with Diabetes Ever Receiving a Pneumococcal Vaccination by
Race/Ethnicity and Age Group, Aggregate Data (2011-2015)
61.6% 59.0%
44.5%50.7%
74.4%
56.5% 60%
90.0%
0%
20%
40%
60%
80%
100%
White-Non Hispanic Black-Non Hispanic Hispanic
Other Race-Non Hispanic 65+ Years Nevada
HP 2020 60% 18-64 HP 2020 90% 65+
Source: BRFSS 2011-2015 & 2020 Healthy People Objectives
38.7%26.6% 34.7%
30.8%39.1%
51.6%
40.5%
48.3%38.7%
36.4%
71.2% 71.5%79.6% 64.8%
73.4%
72.8%
65.2%74.6%
82.9%
73.3%
0%
20%
40%
60%
80%
100%
2005 2006 2007 2008 2010 2011 2012 2013 2014 2015
Sources: BRFSS 2005-2015 & 2020 Healthy People Objectives
18-64 65+ HP 2020 60% 18-64 HP 2020 90% 65+ - - - - - BRFSS Methodology change
Figure 34 - Prevalence of Nevada Adults with Diabetes Ever Receiving a Pneumococcal Vaccination by Age Group, 2005-2015

37
Dental Disease and Diabetes
Individuals with diabetes are at higher risk for oral health problems, such as gingivitis (an early stage of gum disease) and periodontitis (serious gum disease). Both are considered a complication of diabetes and individuals with poor glycemic control are at higher risk of getting gum disease more frequently and more severely than those with well controlled blood glucose levels. Emerging research indicates that the relationship between serious gum disease and diabetes is two-way; not only are individuals with diabetes more susceptible to serious gum disease, but serious gum disease may have the potential to affect blood glucose control and contribute to the progression of diabetes.78 Figure 36 indicates that Nevada adults with diabetes have a significantly higher percentage of tooth loss verses those without diabetes.
Figure 36 - Nevada Adults - How Many Permanent Teeth Removed due to Tooth Decay or Gum Disease 2012 & 2014 Pooled
Besides daily brushing and flossing, regular dental check-ups and good blood glucose control are the best defense against the oral complications of diabetes. Figure 37 shows that
individuals with diabetes have fewer visits to a dentist or dental clinic. Although, there is no implicit explanation for this lower rate of dental visits among those Nevada adults with diabetes
Figure 37 - Time Since Last Visited a Dentist or a Dental Clinic for Any Reason, 2012 & 2014 Pooled Data
29.5%
55.5%
35.6% 32.0%23.2%
8.1%11.6%4.4%
0%
20%
40%
60%
Have Diabetes No Diabetes
None 1 to 5 6 or more, but not all All Source BRFSS 2012 & 2014
50.1%
17.2% 13.8% 17.8%
1.0%
61.4%
14.5% 10.8% 12.0%1.3%
0%
25%
50%
75%
Within the Past Year > 1 Year and < 2Years
> 2 Year and < 5Years
5 or More Years Never
Have Diabetes No Diabetes
Source BRFSS 2012 & 2014

38
from this BRFSS data, a study conducted in northern California showed significant disparities in receipt of annual preventive dental care among “medically insured” patients with diabetes.79 This was frequently due to no dental insurance, but also associated with social
differences with respect to education, income, and race/ethnicity. These social disparities possibly reveal differences in underlying attitudes toward and knowledge of the importance of dental care or of the costs and benefits of maintaining teeth.80
Cost of Diabetes
Economic Burden
Diabetes imposes a considerable burden on the economy of the United States in the form of increased medical costs and indirect costs from reduced labor force participation due to chronic disability, reduced productivity at work and at home, work-related absenteeism, and premature mortality.81,82 Prevalence of diabetes related costs are expected to more than double in the next 25 years.83 The economic burden associated with diagnosed diabetes (all ages) and undiagnosed diabetes, gestational diabetes, and prediabetes (adults) exceeded $322 billion in 2012, consisting of $244 billion in excess medical costs and $78 billion in reduced productivity.
Table 6 illustrates that in 2012 Nevada’s total estimated medical cost for diabetes was $1,924 million with indirect cost reaching $542 for a total economic cost of $2,466 84
Yang et al. stated in their research that: The sobering statistics presented . . . underscores the urgency to better understand the cost mitigation potential of prevention and treatment strategies.85
Thus, effective prevention strategies are crucial to decelerate the diabetes surge and its associated economic burden on Nevada.
Table 6 -- Economic Burden by Diabetes Category in 2012
Medical Costs Indirect Costs
Total Costs DDM UDM PDM GDM DDM UDM
Nevada $1,359 $194 $364 $7 $466 $76 $2,466
Total U.S. $175,819 $23,433 $43,910 $1,290 $68,646 $9,329 $322,427 Data reported in millions of dollars. DDM - Diagnosed Diabetes Mellitus; UDM - Undiagnosed Diabetes Mellitus; PDM – Prediabetes; GDM – Gestational Diabetes

39
Part of the indirect cost was based on absenteeism which is defined as the number of workdays missed due to poor health. Researchers have found that people with diabetes have higher rates of absenteeism than
the population without diabetes. Estimates of excess absenteeism associated with diabetes range from 1.8% to 7% of total workdays which is statistically higher for people with diabetes.86
Medical Cost
As discussed previously Nevada’s total estimated medical cost for diabetes was $1,924 million in 2012. Individuals with diabetes use health care services more frequently than persons without diabetes. Unless otherwise noted, the following information is taken from the Nevada Diabetes and Cardiovascular Report, 2016. 10th Edition. 87
Complications
The higher rate of health care utilization for individuals with diabetes is related to treatment and metabolic control, as well as, to micro- and macrovascular complications associated with diabetes. Complications of type 2 diabetes include, but are not limited to, cardiovascular disease, peripheral artery disease (PAD), hypoglycemia, nephropathy (kidneys), neuropathy (nerves), and retinopathy (eyes). A complication is defined as a patient condition caused by the type 2 diabetes of the patient. These conditions are a direct result of having type 2 diabetes. Figure 38 illustrates the
percentage of patients with type 2 diabetes by complications.
48.8%
44.1%48.4% 48.8%
41.2%
32.7%
39.5%36.3%
45.1%
36.8%
43.7%
35.6%
20.6%
11.3%
19.6%
15.0%14.5%
19.8%
15.8%
18.0%
14.5%
7.7%
13.9%9.1%
0.%
10.%
20.%
30.%
40.%
50.%
Las Vegas Reno Nevada NATION
Cardiovascular Disease Neuropathy Nephropathy PAD Retinopathy Hypogycemia
Figure 38 - Percentage of Type 2 Diabetes Patients by Complication, 2015

40
The development of chronic kidney disease (CKD) and its progression to end-stage renal disease (ESRD) is a major cause of reduced quality of life in the U.S., and is responsible for significant premature mortality. Nationally, the number of ESRD cases per year with diabetes or hypertension listed as the primary cause had been rising rapidly, but over the past five years has been generally stable. Between the dates of January 1 through December 31, 2015, the total
incident of new End Stage Renal Disease (ESRD) patients in Nevada was 972. The primary cause of 44.2% of these new ESRD diagnoses was diabetes. As of December 31, 2015, there were 3,853 prevalent (currently treated) dialysis patients in Nevada; and 1,590 (41.3%) with the primary cause of ESRD being diabetes. Figure 39 shows the percentage of diabetes as the primary of new ESRD diagnoses in Nevada for 2013-2015.88
Figure 39 - New End Stage Renal Disease Patients with Diabetes as the Primary Cause in Nevada
Hospital Inpatient
Table 7 provides a depiction of inpatient diabetes mellitus case counts in Nevada hospital in 2013 and 2014. For all three payer types, the numbers of inpatient diabetes cases per hospital per year in Nevada were more than double what
they were nationally for 2014. Nevada hospitals discharged, on average, 464.8 cases covered by commercial insurance, compared with 200.2 across the country.
Table 7 - Numbers of Inpatient Diabetes Mellitus Cases per Hospital per Year, by Payer, 2013–2014
41.1% 40.1%44.2%
0%
10%
20%
30%
40%
50%
ESRD-Diabetes
2013
2014
2015
Commercial Insurance Medicare Medicaid
2013 2014 2013 2014 2013 2014
Las Vegas 400.4 464.8 979 1,252.60 185.2 388.8
Reno 370.3 1,094 1,093.3 3,575.5 132 979
Nevada 323.7 464.8 733.7 1,252.60 143 388.8
NATION 239.7 200.2 799 578.8 150.9 113.5

41
Figure 41 shows that Non-Medicare outpatient case volumes for diabetes diagnosis were also
significantly higher in Las Vegas, Reno, and across Nevada than the national benchmarks.
Figure 40 - Number of Outpatient Diabetes Mellitus Cases per Hospital per Year Medicare vs. Non-Medicare, 2013-2014
Figure 42 illustrates that facility charges are on the rise for type 2 diabetes patients in Las Vegas. From 2014 to 2015, average annual facility charges for type 2 diabetes patients in Las Vegas
increased across both inpatient by $2,115 and outpatient settings by $1,243. Hospital outpatient charges also expanded in Reno from $10,640 to $11,043.
$1
,69
3
$1
,79
0
$2
,74
0
$4
,12
3
$3
,14
1
$3
,14
8
$3
,49
2
$1
0,5
03
$1
,60
8
$1
,63
8
$2
,28
0 $4
,79
6
$3
,25
0
$3
,33
5
$3
,40
5
$3
,27
1
$0
$2,000
$4,000
$6,000
$8,000
$10,000
$12,000
2013 2014 2013 2014
Medicare Non-Medicare
Las Vegas Reno Nevada NATION
$3
8,9
66
$4
6,6
76
$4
0,9
43
$4
1,8
59
$4
1,0
81
$3
3,6
52
$3
9,9
62
$4
3,1
83
$8
,36
5
$1
0,6
40
$8
,80
7
$1
1,7
62
$9
,60
8
$1
1,0
43
$1
0,2
30
$1
2,2
53
$0
$10,000
$20,000
$30,000
$40,000
$50,000
Las Vegas Reno Nevada NATION
Hospital Inpatient 2014 Hospital Inpatient 2015
Hospital Outpatient 2014 Hospital Outpatient 2015
* Figures reflect the charges generated by the facilities that delivered care. The data also reflect the amounts charged, not the amounts paid
Figure 41 – Facility Charges per Year for Type 2 Diabetes, 2014, 2015*

42
Life Expectancy
Life expectancy for individual with type 2 diabetes was showed to decrease as reported in a cohort study conducted in England using 383 general practices. The results showed that at age 40, white men with diabetes lost 5 years of life and white women lost 6 years compared with those without diabetes. A loss of between 1 and 2 years was observed for South Asian and blacks with diabetes. “The findings support optimized cardiovascular disease risk factor management, especially in whites with type 2 diabetes.”89
Another report by the Gerontological Society of America states:
Despite medical advances enabling those with diabetes to live longer today than in the past, a 50-year-old with the disease still can expect to live 8.5 years fewer years, on average, than a 50-year-old without the disease.90
Risks of death for individuals with type 2 diabetes, however, fluctuates depending on age, glycemic control and renal complications. Macrovascular disease is identified as the leading cause of mortality, followed by renal disease and cerebrovascular disease. According to a New England Journal of Medicine (NEJM) article, the rate of cardiovascular death in a group with diabetes was higher than for those without diabetes. Also the risk was increased in the people with diabetes who had worse glycemic control and greater severity of renal complications. NEJM noted:
Although factors that are known to reduce the risk of myocardial infarction, including the use of lipid-lowering and antihypertensive medications and better glycemic control over time, have been noted in persons with type 2 diabetes, an excess risk of death still exists.91
Quality of Life Indicators
Quality of life is measured as physical and social functioning, and perceived physical and mental well-being. People with diabetes have a worse quality of life than people with no chronic illness, but a better quality of life than people with most other serious chronic diseases. Individuals having better glycemic control report better quality of life than those with poor control.92 When quality of life scores were assessed based on glycated hemoglobin (HbA1c) values, the mean scores of physical function, pain, general health, social function of individuals with the target HbA1c values (<7.5%) was significantly higher than those above target values (≥7.5% and greater).
Looking at multiple quality of life indicators, Nevada adults with diabetes self-reported that quality of life remains significantly reduced as compared to those without the disease as seen in figure 43.
Clinical and educational interventions, however suggest that improving the patients' health status and their perceived ability to control their disease can improve quality of life for those with diabetes.

43
Figure 42 - Health-Related Quality of Life Indicators by Diabetes Status, 2015
Depression and Diabetes
The presence of depression has been shown to adversely affect maintaining control of blood glucose and adherence to medication compliance. Patients with both diabetes and depression develop insulin resistance, and compliance to the treatment is impaired.
Depression and type 2 diabetes are two leading global causes of morbidity and mortality, with type 2 diabetes currently affecting more than 9% and depression affecting 5% of the world’s population in any given year. One of four patients with type 2 diabetes experiences a clinically significant form of depression at a prevalence five-times higher than observed in the general population 93
The presence of depression was associated with elevated HbA1c level, high BMI, being single, low social support level, and low quality health insurance. Zhang, et.al, (2015) recommends routine screening and management of depression in patients with diabetes, especially for those in primary care, to reduce the number of the depressed or unrecognized depressed patients with diabetes.94 Figure 44 displays the percentage of individuals with diabetes that were also diagnosed with depression in Nevada in 2015.95
Figure 43 - Percentage of Type 2 Diabetes Patients with Depression in 2015
A research study has shown that depression is strongly linked to increased mortality in individuals with type 2 diabetes.96 This study found that men with diabetes, but not women, had excess mortality risk associated with
depression and anxiety. Moreover, men with diabetes and symptoms of depression had the highest risk of death with a hazard ratio, of 3.47.
35.3%
21.2%27.9%
12.1%
39.5%
18.6%
6.9%17.1% 13.9% 15.1%
-10%
10%
30%
50%
Adults Limited in AnyWay
Adults NeedingSpecial Equipment
Days Poor HealthKept From Doing
Activities (10+ of thepast 30 days)
Days Poor MentalHealth (10+ of the
past 30 days)
Health Status onlyFair or Poor
Source: BRFSS 2015
Diabetes No-Diabetes
9.0%
9.9%
9.2%
10.4%
8.0%
9.0%
10.0%
11.0%
Depression
Las Vegas Reno Nevada NATION

44
APPENDIX A - Diabetes Education Algorithm
The Algorithm of Care can be downloaded at: https://www.diabeteseducator.org/practice/practice-documents/practice-statements.
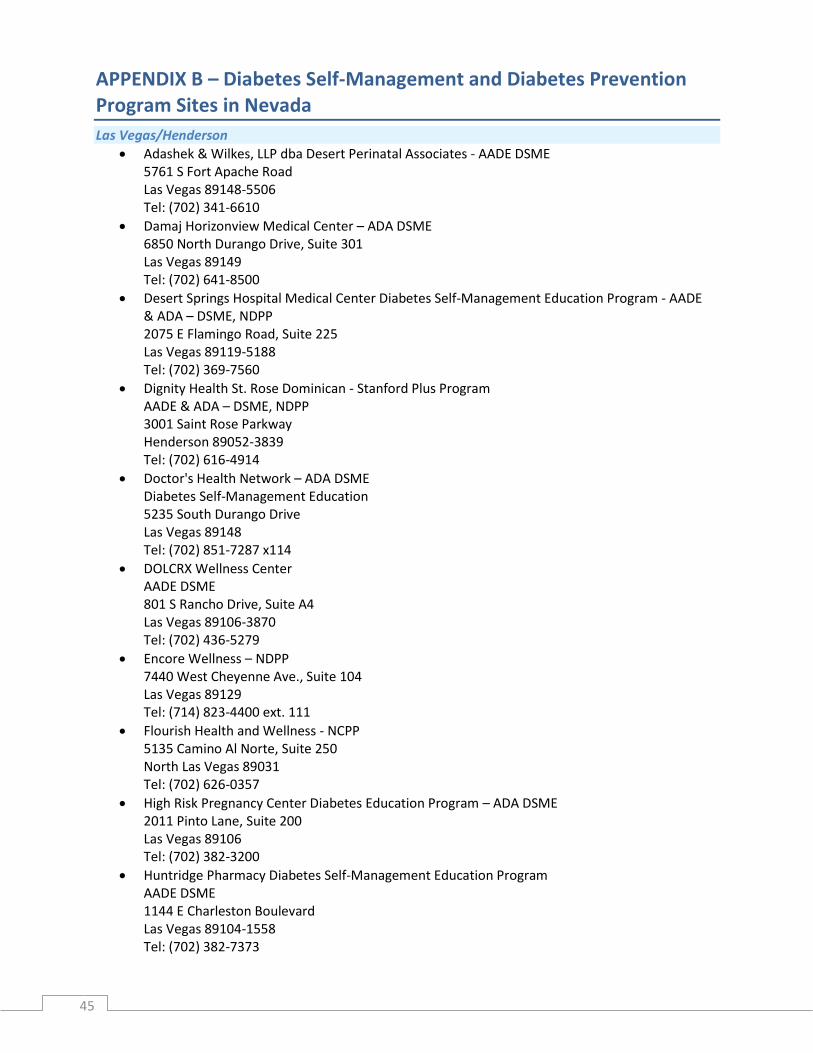
45
APPENDIX B – Diabetes Self-Management and Diabetes Prevention Program Sites in Nevada
Las Vegas/Henderson
Adashek & Wilkes, LLP dba Desert Perinatal Associates - AADE DSME 5761 S Fort Apache Road Las Vegas 89148-5506
Tel: (702) 341-6610
Damaj Horizonview Medical Center – ADA DSME 6850 North Durango Drive, Suite 301 Las Vegas 89149 Tel: (702) 641-8500
Desert Springs Hospital Medical Center Diabetes Self-Management Education Program - AADE & ADA – DSME, NDPP
2075 E Flamingo Road, Suite 225 Las Vegas 89119-5188 Tel: (702) 369-7560
Dignity Health St. Rose Dominican - Stanford Plus Program AADE & ADA – DSME, NDPP 3001 Saint Rose Parkway Henderson 89052-3839 Tel: (702) 616-4914
Doctor's Health Network – ADA DSME Diabetes Self-Management Education 5235 South Durango Drive Las Vegas 89148 Tel: (702) 851-7287 x114
DOLCRX Wellness Center AADE DSME 801 S Rancho Drive, Suite A4 Las Vegas 89106-3870 Tel: (702) 436-5279
Encore Wellness – NDPP 7440 West Cheyenne Ave., Suite 104 Las Vegas 89129 Tel: (714) 823-4400 ext. 111
Flourish Health and Wellness - NCPP 5135 Camino Al Norte, Suite 250 North Las Vegas 89031 Tel: (702) 626-0357
High Risk Pregnancy Center Diabetes Education Program – ADA DSME 2011 Pinto Lane, Suite 200 Las Vegas 89106 Tel: (702) 382-3200
Huntridge Pharmacy Diabetes Self-Management Education Program AADE DSME 1144 E Charleston Boulevard Las Vegas 89104-1558 Tel: (702) 382-7373

46
Nevada Senior Services - DSME 901 N. Jones Boulevard Las Vegas 89108 Tel: (702) 648-3425 ext. 213
Southwest Medical Associates Endocrinology - AADE DSME 4475 S Eastern Avenue, Suite 2400
Las Vegas 89119-7826 Tel: (702) 669-5867
UnitedHealthcare Nevada - Health Education & Wellness – ADA DSME 2716 North Tenaya Way, 3rd Floor Las Vegas 89128 Tel: (702) 750-3830
University of Nevada School of Medicine UNSOM (South) – AADE DSME 1707 W Charleston Blvd, Suite 220, Las Vegas, NV 89102-2353 Tel: (702)671-6469
Wellhealth Endocrinology –ADA DSME 9260 W Sunset Rd Suite 207 Las Vegas, 89148 Tel: (702) 863-9663
YMCA of Southern Nevada – YDPP 141 Meadows Lane Las Vegas 89107 Tel: (702) 476-6747 Carson City/Reno
Carson Tahoe Health – ADA DSME, NDPP 1600 Medical Parkway, PO Box 2168 Carson City 89702 Tel: (775) 445-8607
Partnership Carson City Coalition - Stanford DSME 1711 North Roop Street Carson City 89706 Tel: (775) 841-4730
Renown Health Management Services/Diabetes Center – ADA DSME 10085 Double R Blvd. Suite 325 Reno 89521 Tel: (775) 982-5073
Sanford Center for Aging, University of Nevada, Reno – Stanford DSME 1664 North Virginia Street Reno 89557 Tel: (775) 784-7557 Rural
Humboldt General Hospital DBA Living Well with Diabetes – AADE DSME 118 East Haskell Street
Winnemucca 89445 Tel: (775) 623-5222 Ext: 1756
Nye Communities Coalition - Stanford DSME 1020 East Wilson Road Pahrump 89048 Tel: (775) 727-9970
PACE Coalition – Stanford DSME

47
1645 Sewell Drive, Suite 41 Elko 89801 Tel: (775) 777-3451
Southwest Medical Associates Endocrinology - AADE DSME 2210 Calvada
Pahrump 89048 Tel: (702) 877-5306
Notes
AADE: American Association of Diabetes Educators Accredited Program for DSME ADA: American Diabetes Association Recognized Program for DSME
NDPP: CDC – National Diabetes Prevention Program YDPP: YMCA’s National Diabetes Prevention Program

48
APPENDIX C - Data Sources & Technical Notes
The Behavioral Risk Factor Surveillance System (BRFSS) is the primary data source used to describe the burden of diabetes in Nevada. The BRFSS is a program funded by the Centers for Disease Control and Prevention supplemented by state program funds. This is the largest telephone health survey in the world and is conducted in all 50 states, the District of Columbia, Puerto Rico, the U.S. Virgin Islands, and Guam. The Nevada BRFSS surveys Nevada adults aged eighteen years or older. There are limitations to the BRFSS data in terms of the representations of all regions in the state and all population groups. The frequency of responses by particular population groups (e.g. racial and ethnic minorities) may be rather small, so in several instances multiple years of data were aggregated, or counties of the state were combined (rural counties and Carson City) to achieve reliable frequencies.
The Healthy People (HP) Initiative is a national strategy for significantly improving the health of Americans and provides a framework for national, state and local health agencies, as well as non-government entities, to assess health status, health behaviors, and health services. The HP Initiative began as an offshoot from the 1979 the Surgeon General’s Report, Health Promotion and Disease Prevention, which was followed in 1980 by the report, Promoting Health/Preventing Disease: Objectives for a Nation, which detailed 226 health objectives to be reached by 1990. Subsequently the HP 2000, HP 2010, and HP 2020 were developed that documented objectives to be reached by 2000, 2010, and 2020 respectively. The goals of the HP Initiative are to increase quality and years of healthy life, and eliminate health disparities. Whenever applicable and available, HP 2020 objectives are included in this report along with their corresponding health indicators; in order to compare our progress towards the goals set for 2020.
The Hospital Inpatient Billing data provides health billing data for patients discharged from Nevada’s non-federal hospitals. NRS 449.485 mandates all hospitals in Nevada to report information as prescribed by the director of the Department of Health and Human Services. The data are collected using a standard universal billing form. The data is for patients who spent at least 24 hours as an inpatient, but do not include patients who were discharged from the emergency room. The data includes demographics such as age, gender, race/ethnicity and uses International Classification of Diseases-9-Clinical Modification (ICD-9-CM) diagnoses codes (up to 33 diagnoses). In addition, the data includes billed hospital charges, procedure codes, length of hospital stay, discharge status, and external cause of injury codes. The billing data information is for billed charges and not the actual payment received by the hospital.
Network #15 is involved in the assurance of quality care to individuals with End-Stage Renal Disease (ESRD), and also in the collection and validation of information about and treatment of persons with ESRD. The Centers for Medicare and Medicaid Services (CMS) contracts with and funds 18 ESRD Network organizations covering all 50 states and U.S. territories. The territory of Network #15 includes six states: Arizona, Colorado, Nevada, New Mexico, Utah, and Wyoming. End stage renal disease (ESRD) is irreversible kidney disease which requires treatment with an artificial kidney (dialysis) or a kidney transplant for a person to maintain life and health. In 1972, legislation was passed to extend Medicare coverage to virtually all people with ESRD. There are over 300 dialysis and 14 transplant facilities within Network 15. These facilities serve over 20,000 dialysis and 1,000 transplant patients each year.
The Nevada Type 2 Diabetes and Cardiovascular Report 2016 contains data gathered by SDI, Plymouth Meeting, Pa., a leading provider of innovative health care data products and analytic services. The data provides employers with independent, third-party information that they can use to benchmark their own data on patient demographics, professional (provider) and facility (hospital) charges, service utilization and pharmacotherapy.
The Office of Vital Records collects, processes, analyzes, and maintains the state of Nevada’s Electronic Vital Records Systems. Funeral directors, or persons acting as such, are legally responsible with filling death certificates. The Electronic Vital Records Systems include those individuals who died in Nevada (residents and non-residents) as well as Nevada residents who died outside the state of Nevada, as reported to the Office of Vital Records. Mortality data include demographic data of the individual,

49
occupation, gender, age, date of birth, age at death, place of death, manner of death, state of residence, and cause of death (identified by International Classification of Disease codes—10 (ICD-10)), among other fields. Mortality data in this report may include both the immediate cause of death and any conditions leading to the immediate cause of death.
The Youth Risk Behavior Surveillance System (YRBSS) is a national, biennial, school-based survey administered to samples of students in grades 9-12. The survey collects data on health risk behaviors such as injury, tobacco use, alcohol, and other drug use, sexual behavior, diet, nutrition, and physical activity.
Statistics based on samples of a population are subject to sampling error. Sampling error refers to a random variation that occurs because only a subset of the entire population is sampled and used to estimate a finding for the entire population. Confidence intervals provide a range of values that can describe the uncertainty around an estimate. In this report Statistical Analysis Software (SAS) was used to compute 95% confidence intervals, i.e. there is a 95% chance that the confidence intervals cover the true values. Confidence intervals have been included as error bars in the graphs representing diabetes prevalence among Nevada adults by the demographic breakdowns region, age, race/ethnicity, and household income levels.
50
APPENDIX D – Acronyms
AADE: American Association of Diabetes Educators, https://www.diabeteseducator.org/
ADA: American Diabetes Association, http://www.diabetes.org/
AMA: American Medical Association, https://www.ama-assn.org/
APMA: American Podiatric Medical Association, http://www.apma.org/index.cfm
BMI: Body mass index, https://www.nhlbi.nih.gov/health/educational/lose_wt/BMI/bmicalc.htm
BRFSS: Behavioral Risk Factor Surveillance System, https://www.cdc.gov/brfss/
CDC: Centers for Disease Control and Prevention, https://www.cdc.gov/
CKD: Chronic Kidney Disease, https://www.kidney.org/atoz/content/about-chronic-kidney-disease
CMS: Centers for Medicare and Medicaid Services, https://www.cms.gov/
DPP: Diabetes Prevention Program, https://www.cdc.gov/diabetes/prevention/index.html , and
https://www.niddk.nih.gov/about-niddk/research-areas/diabetes/diabetes-prevention-program-
dpp/Pages/default.aspx
DSME: Diabetes Self-Management Education, http://nevadawellness.org/community-wellness/diabetes-
education/i-have-diabetes/
ERS: Economic Research Service, https://www.ers.usda.gov/
ESRD: End-Stage Renal Disease, https://www.cms.gov/Medicare/Coordination-of-Benefits-and-
Recovery/Coordination-of-Benefits-and-Recovery-Overview/End-Stage-Renal-Disease-ESRD/ESRD.html
HHS: United States Department of Health & Human Services, https://www.hhs.gov/
IOM: Institute of Medicine, National Academy of Medicine, https://nam.edu/about-the-nam/
MDPP: Medicare Diabetes Prevention Program, https://innovation.cms.gov/initiatives/medicare-diabetes-
prevention-program/
NEJM: New England Journal of Medicine, http://www.nejm.org/
PAD: Peripheral Artery Disease, https://www.nhlbi.nih.gov/health/health-topics/topics/pad/
USDA: United States Department of Agriculture, https://www.usda.gov/
USPSTF: United State Preventive Services Task Force, https://www.uspreventiveservicestaskforce.org/
WHO: World Health Organization, http://www.who.int/en/
YRBSS: Youth Risk Behavior Surveillance System, https://www.cdc.gov/healthyyouth/data/yrbs/index.htm

51
APPENDIX E - Endnotes
1 Current Population Demographics and Statistics for Nevada 2017 and 2016 by age, gender and race. SuburbanStats.org. https://suburbanstats.org/population/how-many-people-live-in-nevada. Accessed March 15, 2017.
2 Centers for Disease Control and Prevention. National Diabetes Statistics Report: Estimates of Diabetes and Its Burden in the United States, 2014. Atlanta, GA: US Department of Health and Human Services; 2014.
3 Nevada Division of Public and Behavioral Health, Behavioral Risk Factor Surveillance System Survey (BRFSS) Data. Carson City, Nevada: Nevada Department of Health and Human Services, Division of Public and Behavioral Health, Office of Public Health Informatics and Epidemiology, 2015.
4 Centers for Disease Control and Prevention, National Center for Chronic Disease Prevention and Health Promotion, Division of Diabetes Translation, http://www.cdc.gov/diabetes/basics/prediabetes.html, Accessed 3/30/16.
5 American Diabetes Association. Economic costs of diabetes in the U.S. in 2002. Diabetes Care 2003; 26:917–932. 6 American Diabetes Association. Economic costs of diabetes in the U.S. in 2007. Diabetes Care 2008; 31:596–615. 7 Huang ES, Basu A, O’Grady M, Capretta JC. Projecting the future diabetes population size and related costs for the
U.S. Diabetes Care. 2009; 32:2225-9. [PMID: 19940225] doi: 10.2337/dc09-0459. 8 Wenya Yang; Timothy M.; Pragna Halder; Paul Gallo; Stacey L. Kowal; and Paul F. Hogan; Economic Costs of
Diabetes in the U.S. in 2012, Diabetes Care April 2013 vol. 36 no. 4 1033-1046. 9 American Diabetes Association [Internet]. [Cited 2016]. Available from: http://www.diabetes.org/diabetes-
basics/ 10 American Diabetes Association, “Diabetes Basics: Type 2, http://www.diabetes.org/diabetes-basics/type-2/,
Accessed 4/16. 11 American Diabetes Association. Diagnosis and classification of diabetes mellitus. Diabetes Care 2013; 36 (Suppl
1):S67–74. 12 Centers for Disease Control and Prevention, National Center for Chronic Disease Prevention and Health
Promotion, Division of Diabetes Translation, http://www.cdc.gov/diabetes/basics/prediabetes.html, accessed 3/30/16.
13 Ibid. 14 Zhang Y, Dall TM, Chen Y, et al. Medical cost associated with prediabetes. Popul Health Manag 2009; 12:157–
163. 15 Centers for Disease Control and Prevention, National Center for Chronic Disease Prevention and Health
Promotion, Division of Diabetes Translation, http://www.cdc.gov/diabetes/basics/prediabetes.html, Accessed 3/30/16.
16 Ibid. 17 The Guide to Community Preventive Services website. Diabetes Prevention and Control: Combined Diet and
Physical Activity Promotion Programs to Prevent Type 2 Diabetes among People at Increased Risk, http://www.thecommunityguide.org/diabetes/combineddietandpa.html. Accessed 3/30/16.
18 Ibid. 19 Diabetes prevention programs score Medicare Endorsement, http://www.politico.com/story/2016/03/diabetes-
prevention-programs-score-medicare-endorsement-221311#ixzz44VnBju5D, Accessed 3/28/16. 20 Federal Register / Vol. 81, No. 136 / Friday, July 15, 2016 / Proposed Rules, Medicare Program; Revisions to
Payment Policies Under the Physician Fee Schedule and Other Revisions to Part B for CY 2017; Medicare Advantage Pricing Data Release; Medicare Advantage and Part D Medical Low Ratio Data Release; Medicare Advantage Provider Network Requirements; Expansion of Medicare Diabetes Prevention Program Model. CMS.gov Centers for Medicare & Medicaid Services. https://www.cms.gov/Newsroom/MediaReleaseDatabase/Fact-sheets/2016-Fact-sheets-items/2016-07-07.html Published July 7, 2016. Accessed March 7, 2017.
21 Kochanek KD, Murphy SL, Xu J, Tejada-Vera B. Deaths: Final Data for 2014. National Vital Statistics Reports. 2016; 65(4):5. https://www.cdc.gov/nchs/data/nvsr/nvsr65/nvsr65_04.pdf. Accessed 12/23/16
52
22 Statistics about Diabetes. American Diabetes Association. http://www.diabetes.org/diabetes-basics/statistics/.
Accessed 12/23/16. 23 U.S. Department of Health and Human Services. The Health Consequences of Smoking—50 Years of Progress: A
Report of the Surgeon General. Atlanta: U.S. Department of Health and Human Services, Centers for Disease Control and Prevention, National Center for Chronic Disease Prevention and Health Promotion, Office on Smoking and Health, 2014. Accessed 5/5/14.
24 Stokes A, Preston SH. Deaths Attributable to Diabetes in the United States: Comparison of Data Sources and Estimation Approaches. Plos One. 2017; 12(1). doi:10.1371/journal.pone.0170219.
25 Wright AK, Kontopantelis E, Emsley R, et al. Life Expectancy and Cause-Specific Mortality in Type 2 Diabetes: A Population-Based Cohort Study Quantifying Relationships in Ethnic Subgroups. Diabetes Care. http://care.diabetesjournals.org/content/early/2016/12/19/dc16-1616. Accessed 12/30/16.
26 Centers for Disease Control and Prevention, “National Diabetes Statistical Report, 2014: Estimates of Diabetes and Its Burden in the United States,” http://www.cdc.gov/diabetes/pubs/statsreport14/national-diabetes-report-web.pdf, Accessed 4/16.
27 Laiteerapong N., Cifu A.S., Screening for Prediabetes and Type 2 Diabetes Mellitus. JAMA. 2016; 315 (7): 697-698. doi: 10.1001/ jama.2015.17545.
28 Screening for Abnormal Blood Glucose and Type 2 Diabetes: U.S. Preventive Services Task Force Recommendation. (2015). Annals of Internal Medicine Ann Intern Med, 163(11), 1-9. doi: 10.7326/p15-9037. American Diabetes Association, “Diabetes Basics: Type 2, http://www.diabetes.org/diabetes-basics/type-2/, Accessed 4/16.
29 Modifiable risk factors associated with prediabetes in men and women: a cross-sectional analysis of the cohort study in primary health care on the evolution of patients with prediabetes (PREDAPS-Study), Díaz-Redondo A., Giráldez-García C., Carrillo L., et al., BMC Family Practice 2015; 16: 5. Published online 2015 Jan 22. http://bmcfampract.biomedcentral.com/articles/10.1186/s12875-014-0216-3. Access 1/30/17.
30 Lower Your Risk. American Diabetes Association. http://www.diabetes.org/are-you-at-risk/lower-your-risk/. Accessed 12/28/16.
31 Obesity and overweight. World Health Organization. http://www.who.int/mediacentre/factsheets/fs311/en/. Accessed 12/28/16.
32 US Department of Health and Human Services. National Institutes of Health. Managing Overweight and Obesity in Adults: Systematic Evidence Review from the Obesity Expert Panel, 2013.
33 World Cancer Research Fund / American Institute for Cancer Research. Food, Nutrition, Physical Activity, and the Prevention of Cancer: a Global Perspective. Washington DC: AICR, 2007
34 Finkelstein, EA, Trogdon, JG, Cohen, JW, Dietz, W. Annual medical spending attributable to obesity: Payer- and service-specific estimates. Health Affairs. 2009; 28(5):w822-w831.
35 Health Risks. Obesity Prevention Source. https://www.hsph.harvard.edu/obesity-prevention-source/obesity-consequences/health-effects/. Published 2016. Accessed December 28, 2016.
36 Ibid. 37 Centers for Disease Control and Prevention, National Center for Chronic Disease Prevention and Health
Promotion, Division of Population Health. BRFSS Prevalence & Trends Data [online]. 2015. https://www.cdc.gov/brfss/brfssprevalence/. Accessed 2/27/17.
38 Dabelea, D., Mayer-Davis, E. J., Saydah, S., Imperatore, G., Linder, B., Divers, J., Hamman, R. F. (2014). Prevalence of Type 1 and Type 2 Diabetes among Children and Adolescents from 2001 to 2009. Jama, 311(17), 1778. doi:10.1001/jama.2014.3201
39 Nutrition, Physical Activity and Obesity Data, Trends and Maps web site. U.S. Department of Health and Human Services, Centers for Disease Control and Prevention (CDC), National Center for Chronic Disease Prevention and Health Promotion, Division of Nutrition, Physical Activity and Obesity, Atlanta, GA, 2015. Available at http://www.cdc.gov/nccdphp/DNPAO/index.html.
40 Dall, T. M., Yang, W., Halder, P., Franz, J., et.al. (2016). Type 2 diabetes detection and management among insured adults. Population Health Metrics, 14(1). doi:10.1186/s12963-016-0110-4
41 American Diabetes Association, High Blood Pressure http://www.diabetes.org/are-you-at-risk/lower-your-risk/bloodpressure.html Accessed 12.8.16.
42 U.S. Department of Health and Human Services. The Health Consequences of Smoking—50 Years of Progress: A Report of the Surgeon General. Atlanta: U.S. Department of Health and Human Services, Centers for Disease Control and Prevention, National Center for Chronic Disease Prevention and Health Promotion, Office on Smoking and Health, 2014. pp 40. Accessed 5/5/14

53
43 Ibid, pp. 538. 44 Ibid. 45 Ibid. 46 Heiman, H. J., Artiga, S., Beyond Health Care: The Role of Social Determinants in Promoting Health and Health
Equity. http://kff.org/disparities-policy/issue-brief/beyond-health-care-the-role-of-social-determinants-in-promoting-health-and-health-equity/. Published November 2015. Accessed 2/ 28/17.
47 Alliance to Reduce Disparities in Diabetes, About Diabetes Disparities, http://ardd.sph.umich.edu/about_diabetes_disparities.html Accessed 12.9.16.
48 Statistics about Diabetes. American Diabetes Association. http://www.diabetes.org/diabetes-basics/statistics/. Accessed 2/13/17.
49 Beckles G.L., Chou C-F. Diabetes — United States, 2006 and 2010. MMWR. 2013; 62(3):99-104. https://www.cdc.gov/mmwr/preview/mmwrhtml/su6203a17.htm. Accessed 12/23/16.
50 Coleman-Jensen A., Rabbitt M.P., Gregory C.A., Singh A. USDA ERS - Household Food Security in the United States in 2015. https://www.ers.usda.gov/publications/pub-details/?pubid=79760. Published September 7, 2016. Accessed 1/6/17.
51 Seligman H.K. Food Insecurity and Diabetes Prevention and Control in California, https://cvp.ucsf.edu/images/seligman_food.pdf, 5085.1. Accessed 12/20/16.
52 Seligman H.K., Jacobs E.A., Lopez A., Tschann J., Fernandez A. Food insecurity and Glycemic Control among Low-Income Patients with Type 2 Diabetes. Diabetes Care. 2012 Feb; 35(2): 233–238. doi: 10.2337/dc11-1627.
53 Chiasson J.L., Brindisi M.C., Rabasa-Lhoret R. The Prevention Of Type 2 Diabetes: What Is The Evidence? Minerva Endocrinology. 2005; 3:179-191. https://www.ncbi.nlm.nih.gov/pubmed/16208307. Accessed 12/28/16.
54 Division of Diabetes Translation, National Center for Chronic Disease Prevention and Health Promotion. National Diabetes Statistics Report, 2014. Atlanta: Centers for Disease Control and Prevention; 2014. www.cdc.gov/diabetes/pubs/statsreport14/national-diabetes-report-web.pdf. Accessed 9/18/15
55 Redesigning the Health Care Team: Diabetes Prevention and Lifelong Management. National Institutes of Health. https://www.niddk.nih.gov/health-information/health-communication-programs/ndep/health-care-professionals/team-care/Pages/publicationdetail.aspx#main. Accessed January 15, 2017.
56 Millman, M. L. (1993). Institute of Medicine (US) Committee on Monitoring Access to Personal Health Care Services; Access to Health Care in America. Washington (DC): National Academies Press (US) Available from: https://www.ncbi.nlm.nih.gov/books/NBK235888/.
57 Strategies for Improving Care Sec. 1, Standards of Medical Care in Diabetes 2016. Diabetes Care. 2015; 39(Supplement 1) doi: 10.2337/dc16-s004, http://care.diabetesjournals.org/content/39/Supplement_1/S6.full-text.pdf. Accessed 12/21/16.
58 Spitalnic P. Diabetes Prevention Program Independent Evaluation Report Summary; Centers for Medicare & Medicaid Services. https://www.cms.gov/Newsroom/MediaReleaseDatabase/Fact-sheets/2016-Fact-sheets-items/2016-03-23.html. Accessed 3/23/16.
59 Bocchino C. Health Plans’ Experience with the National Diabetes Prevention Program: Considerations for Organizations Who May Offer the DPP. AHIP. https://www.ahip.org/national-dpp-report/. January 2016. Accessed 12/28/16.
60 Strategies for Improving Care Sec. 1, Standards of Medical Care in Diabetes 2016. Diabetes Care. 2015; 39(Supplement 1) doi: 10.2337/dc16-s004, http://care.diabetesjournals.org/content/39/Supplement_1/S6.full-text.pdf. Accessed 12/21/16.
61 Griswold T., Packham J., Etchegoyhen L., Marchand C. 2015 Nevada Rural and Frontier Health Data Book and County Health Profiles. University of Nevada, Reno School of Medicine. http://med.unr.edu/statewide/reports/data-book-2015. Accessed 12/28/16.
62 Ku, L., Jones, K., Shin, P., Bruen, B., Hayes, K. (2011). The States’ Next Challenge – Securing Primary Care for Expanded Medicaid Populations. The New England Journal of Medicine, 364(6), 493-495.
63 Burke SD, Sherr D, Lipman RD. Partnering with diabetes educators to improve patient outcomes. Diabetes, Metabolic Syndrome and Obesity: Targets and Therapy. 2014; 7:45-53. doi:10.2147/DMSO.S40036.
64 Powers, M.A., Bardsley, J., Cypress, M., et al. Diabetes Self-Management Education and Support in Type 2 Diabetes: A Joint Position Statement of the American Diabetes Association, the American Association of Diabetes Educators, and the Academy of Nutrition and Dietetics. Journal of the Academy of Nutrition and Dietetics. 2015; 115(8):1323-1334. doi:10.1016/j.jand.2015.05.012.
65 Powers MA, Bardsley J, Cypress M, et al.

54
66 Fain JA. National Standards for Diabetes Self-Management Education and Support: Updated and Revised 2012.
The Diabetes Educator. 2012; 38(5):595-595. doi: 10.1177/0145721712460840. 67 Schumacher P. State Public Health Actions (1305): CDC email communication 1) Webinar-Developing a Data
Analysis Plan, 2) Webinar: Racial-Ethnic Disparities in Hypertension (HTN), 3) Webinar: Undiagnosed HTN in the Safety Net, 4) Webinar: Using Telehealth to Deliver DSME, 5) Revised DSME Data. State Public Health Actions (1305) Revised DSME Data. May 2016.
68 Morning K. Diabetes Self-Management Education Programs in Nevada, July 2014. (Franzen-Weiss M.A., editor). Carson City, NV: Nevada Division of Public and Behavioral Health, Chronic Disease Prevention and Health Promotion Section, Diabetes Prevention and Control Program; 2014:1-35.
69 American Diabetes Association. Standards of Medical Care in Diabetes-2015. Diabetes Care. 2015; 38 (Supplement 1):S1–93.
70 American Diabetes Association Position Statement: Standards of Medical Care in Diabetes—2016, Abridged for Primary Care Providers, Diabetes Care 2016; 39(Suppl. 1):S1–S112.
71 Nevada Diabetes and Cardiovascular Report, 2016. 10th ed. Denver, CO: Forte Information Resources, LLC; 2016:1-16. Data provided by IMS Health, Parsippany, NJ.
72 Diabetes Basics. American Diabetes Association. http://www.diabetes.org/diabetes-basics/. Accessed 12/29/16. 73 Carls GS, Gibson TB, Driver VR, et al. The Economic Value of Specialized Lower-Extremity Medical Care by
Podiatric Physicians in the Treatment of Diabetic Foot Ulcers. Journal of the American Podiatric Medical Association. 2011; 101(2):93-115. doi: 10.7547/1010093.
74 Diabetes by the Numbers: Nevada. American Podiatric Medical Association. http://apma.files.cms-plus.com/FileDownloads/DiabetesbytheNumbers_Nevada.pdf. Accessed 12/29/16.
75 Diabetic Retinopathy. Diabetic Retinopathy | Prevent Blindness. http://www.preventblindness.org/diabetic-retinopathy. Accessed 12/29/16.
76 Diabetes Type 1 and Type 2 and Adult Vaccination. Centers for Disease Control and Prevention. https://www.cdc.gov/vaccines/adults/rec-vac/health-conditions/diabetes.html. January 2016. Accessed 12/29/16.
77 Ibid. 78 Diabetes and Oral Health Problems. American Diabetes Association. http://www.diabetes.org/living-with-
diabetes/treatment-and-care/oral-health-and-hygiene/diabetes-and-oral-health.html. Last Edited: October 10, 2014. Accessed 1/4/17.
79 Moffet H.H., Schillinger D., Weintraub J.A., et al. Social Disparities in Dental Insurance and Annual Dental Visits among Medically Insured Patients with Diabetes: the Diabetes Study of Northern California (DISTANCE) Survey. Preventing Chronic Disease. 2010; 7(3):A57.
80 Ibid. 81 American Diabetes Association. Economic costs of diabetes in the U.S. in 2002. Diabetes Care 2003; 26:917–932. 82 American Diabetes Association. Economic costs of diabetes in the U.S. in 2007. Diabetes Care 2008; 31:596–615. 83 Huang E.S., Basu A., O’Grady M., Capretta J.C. Projecting The Future Diabetes Population Size and Related Costs
for the U.S. Diabetes Care. 2009; 32:2225-9. [PMID: 19940225] doi: 10.2337/dc09-0459. 84 Dall TM, Yang W, Halder P, et al. The Economic Burden of Elevated Blood Glucose Levels in 2012: Diagnosed and
Undiagnosed Diabetes, Gestational Diabetes Mellitus, and Prediabetes. Diabetes Care. http://care.diabetesjournals.org/content/37/12/3172.long. Accessed 12/29/16.
85 Wenya Yang; Timothy M.; Pragna Halder; Paul Gallo; Stacey L. Kowal; and Paul F. Hogan; Economic Costs of Diabetes in the U.S. in 2012, Diabetes Care April 2013 vol. 36 no. 4 1033-1046.
86 Ibid. 87 Nevada Diabetes and Cardiovascular Report, 2016. 10th Ed. 88 2013, 2014, 2015 Annual Report, HSAG: ESRD Network 15. HSAG. https://www.hsag.com/en/esrd-
networks/esrd-network-15/NW15-annual-reports/. Accessed 1/5/17. 89 Wright A.K., Kontopantelis E., Emsley R., et al. Life Expectancy and Cause-Specific Mortality in Type 2 Diabetes: A
Population-Based Cohort Study Quantifying Relationships in Ethnic Subgroups. Diabetes Care. http://care.diabetesjournals.org/content/early/2016/12/19/dc16-1616. Accessed 12/30/16.
90 Tancredi M., Rosengren A., Svensson A-M., Kosiborod M., et al. Excess Mortality among Persons with Type 2 Diabetes. New England Journal of Medicine. 2015; 374(8):788-789. doi:10.1056/nejmc1515130
91 Ibid. 92 Rubin RR, Peyrot M. Quality of life and diabetes. Diabetes/Metabolism Research and Reviews. 1999; 15(3):205-
218. doi: 10.1002/ (sici) 1520-7560(199905/06)15:3<205: aid-dmrr29>3.0.co; 2-o.

55
93 Naicker K, Johnson JA, Skogen JC, et al. Type 2 Diabetes and Comorbid Symptoms of Depression and Anxiety: Longitudinal Associations With Mortality Risk. Diabetes Care. 2017;40(3):352-358. doi:10.2337/dc16-2018.
94 Zhang W, Xu H, Zhao S, et al. Prevalence and Influencing Factors of Co-Morbid Depression in Patients with Type 2 Diabetes Mellitus: A General Hospital Based Study. Diabetology & Metabolic Syndrome. 2015; 7:60. doi: 10.1186/s13098-015-0053-0.
95 Nevada Diabetes and Cardiovascular Report, 2016. 10th Ed. 96 Naicker K, Johnson JA, Skogen JC, et al. Type 2 Diabetes and Comorbid Symptoms of Depression and Anxiety:
Longitudinal Associations with Mortality Risk. Diabetes Care. January 2017. http://care.diabetesjournals.org/content/early/ 2017/01/10/dc16-2018.supplemental. Accessed 1/18/17.

Appendix B

Nevada Department of Health and Human Services Helping People -- It's Who We Are And What We Do
October 31, 2017
SB539 required the Department of Health and Human Services (DHHS) to develop a list of essential diabetes drugs. To that end, DHHS sought public comment from prescribers in Nevada, analyzed data to determine drugs most often prescribed, and consulted with FDA resources to determine appropriate use as established by the label. Below describes the process for creation of the list:
o An initial list of frequently prescribed drugs used for the treatment of diabetes was createdby pharmacists employed by the department.
o The list was then sent to prescribers in the state as a survey to solicit public comment anddetermine if any drugs needed to be removed/added. DHHS received over 300 responses.
o That list was compared to the Medicaid pharmacy data reported to the Centers forMedicare and Medicaid Services (CMS) and information from the Public Employees BenefitProgram on prescribed drugs. This prescriber data accounted for approximately 700,000Nevadans insured under these public plans and was used to whittle down the list to justthose drugs prescribed in Nevada.
o The remaining drugs were checked against the FDA database to ensure that only drugsapproved by the FDA for the treatment of diabetes were included on the list. No drugswere included if their treatment of diabetes was considered an “off-label” use.
This process was designed to include the feedback from prescriber stakeholders along with addressing the concerns expressed by industry members regarding appropriate label use. This list does not include any drugs used to treat co-morbidities often present in an individual with diabetes. The list also does not contain every single drug that may be an effective treatment for diabetes or approved for the treatment of diabetes. This list attempts to distill down the numerous treatments to those which are approved for treatment, identified by prescribers as essential, and most frequently prescribed in Nevada (as determined by the publicly available data sources).
As this is the first year DHHS has created this list, we welcome feedback on the process that can be used for the development of the list for 2018. Feedback and questions can be directed to the email: [email protected].
BRIAN SANDOVAL Governor
RICHARD WHITLEY, MS Director
DEPARTMENT OF HEALTH AND HUMAN SERVICES DIRECTOR’S OFFICE
4126 Technology Way, Suite 100 Carson City, Nevada 89706
Telephone (775) 684-4000 Fax (775) 684-4010 http://dhhs.nv.gov

Proprietary Name Non_Proprietary_Name Class Labeler
Tanzeum albiglutide Glucagon-Like Peptide-1 (GLP-1) Agonists
GlaxoSmithKline, LLC
Byetta exenatide Glucagon-Like Peptide-1 (GLP-1) Agonists
Astrazeneca AB; Physicians Total Care, Inc.
Invokana; Invokamet
canagliflozin Sodium Glucose Co-Transporter-2 (SGLT2) Inhibitors
Jansen Pharmaceuticals, Inc.
Cycloset; Parlodel; Bromocriptine mesylate
bromocriptine mesylate Ergolines Paddock Laboratories, LLC; Ranbaxy Pharmaceuticals, Inc.; Sandoz, Inc.; Physcians Total Care, Inc.; Santarus, Inc.; Validus Pharmaceuticals, LLC
Farxiga;Xigduo
DAPAGLIFLOZIN Propanediol
Sodium Glucose Co-Transporter-2 (SGLT2) Inhibitors
AstraZeneca Pharmaceuticals, LP
DiaBeta glyburide Sulfonylureas (SUs) Actavis Elizabeth; Aurobihndo Pharma;Dava Pharms, Inc;Epic Pharma LLC;Heritage Pharms, Inc.;Hikma;Impax Labs, Inc;Mylan;Pharmadax, Inc;Sandoz;Sanofi-Aventis U.S., LLC;Teva;Zydus Pharms USA, Inc
Trulicity Dulaglutide Glucagon-Like Peptide-1 (GLP-1) Agonists
Eli Lilly and Company
JardianceSynjardy
Empagliflozin Sodium Glucose Co-Transporter-2 (SGLT2) Inhibitors
Boehringer Ingelheim Pharmaceuticals, Inc.;Cardinal Health
Glyxambi Empagliflozin and linagliptin Sodium Glucose Co-Transporter-2 (SGLT2) Inhibitors
Boehringer Ingelheim Pharmaceuticals, Inc.
Synjardy empagliflozin and metformin hydrochloride
Sodium Glucose Co-Transporter-2 (SGLT2) Inhibitors
Boehringer Ingelheim Pharmaceuticals, Inc.
BydureonByetta
exenatide Glucagon-Like Peptide-1 (GLP-1) Agonists
AstraZeneca Pharmaceuticals, LP;Physicians Total Care, Inc.
Fortamet Metformin hydrocloride Biguanide Physicians Total Care, Inc.;Shionogi, Inc.
Revision Date February 13, 2018

Proprietary Name Non_Proprietary_Name Class Labeler
AmarylGlimepiride
Glimepiride Sulfonylureas (SUs) Accord Healthcare Inc;Aidarex Pharmaceuticals LLC;American Health Packaging;Aurobindo Pharma Limited;Avera McKennan Hospital;Bionpharma Inc.Blenheim Pharmacal, Inc.;BluePoint Laboratories;Bryant Ranch Prepack;Cardinal Health;Carlsbad Technology, Inc.;Citron Pharma LLC;Dr. Reddy's Laboratories Limited;DIRECT RX;Golden State Medical Supply, Inc.;International Laboratories, LLC;Lake Erie Medical DBA Quality Care Products LLC;Liberty Pharmaceuticals, Inc.;MedVantx, Inc.;Micro Labs Limited;Mylan Institutional Inc.;Mylan Pharmaceuticals Inc.;NCS HealthCare of KY, Inc dba Vangard Labs;Northwind Pharmaceuticals;NuCare Pharmaceuticals, Inc.PD-Rx Pharmaceuticals, Inc.;
Prasco Laboratories;Preferred Pharmaceuticals Inc.;Physicians Total Care, Inc.;Proficient Rx LP;Qualitest Pharmaceuticals;Rebel Distributors Corp;RedPharm Drug, Inc.REMEDYREPACK INC.;St Marys Medical Park Pharmacy;Sanofi-Aventis U.S., LLC;Solco Healthcare U.S., LLC;STAT Rx USA LLC;Takeda Pharmaceuticals America, Inc.;Teva Pharmaceuticals USA, Inc.;Unit Dose Services;Virtus Pharmaceuticals
GlipizideGlipizide XLGlipizide ERGlucotrolGlucotrol XL
glipizide Sulfonylureas (SUs) Accord Healthcare Inc;Actavis Elizabeth LLC;Actavis Pharma, Inc.;Aidarex Pharmaceuticals LLC;Aphena Pharma Solutions - Tennessee, LLC;Apotex Corp.;Apotheca Inc.;Aurobindo Pharma Limited;Avera McKennan Hospital;Bionpharma Inc.Blenheim Pharmacal, Inc.;Bryant Ranch Prepack;Cardinal Health;Carlsbad Technology, Inc.;Clinical Solutions Wholesale;Contract Pharmacy Services-PA;Dr. Reddy's Laboratories Limited;DIRECT RX;Dispensing Solutions, Inc.;Golden State Medical Supply, Inc.;Greenstone LLC;International Laboratories, LLC;H.J. Harkins Company, Inc.;Lake Erie Medical DBA Quality Care Products LLC;Legacy Pharmaceutical Packaging, LLC;Major Pharmaceuticals;
MedVantx, Inc.;Mylan Institutional Inc.;Mylan Pharmaceuticals Inc.;NCS HealthCare of KY, Inc dba Vangard Labs;Northwind Pharmaceuticals;NuCare Pharmaceuticals, Inc.PD-Rx Pharmaceuticals, Inc.;Par Pharmaceutical, Inc.;Physicians Total Care, Inc.;Preferred Pharmaceuticals Inc.;Proficient Rx LP;Rebel Distributors Corp;RedPharm Drug, Inc.REMEDYREPACK INC.;Rising Pharmaceuticals, Inc.;St Marys Medical Park Pharmacy;Sandoz Inc;State of Florida DOH Central Pharmacy;STAT Rx USA LLC;Sun Pharmaceutical Industries, Inc.;TYA Pharmaceuticals;Unit Dose Services;Virtus Pharmaceuticals

Proprietary Name Non_Proprietary_Name Class Labeler
Glipizide and Metformin HydrochlorideGlipizide and Metformin HCI
Glipizide and Metformin Hydrochloride
Sulfonylureas (SUs) AvKARE, Inc.;Bryant Ranch Prepack;Cadila Healthcare Limited;Heritage Pharmaceuticals Inc.;KAISER FOUNDATION HOSPITALS;Lake Erie Medical DBA Quality Care Products LLC;Mylan Pharmaceuticals Inc.;
Physicians Total Care, Inc.;Rebel Distributors Corp;REMEDYREPACK INC.;St Marys Medical Park Pharmacy;Teva Pharmaceuticals USA, Inc.;Unit Dose Services;Zydus Pharmaceuticals (USA) Inc.
Glucophage Metformin Hydrochloride Biguanide Bristol-Myers Squibb Company;PD-Rx Pharmaceuticals, Inc.
Glumetza Metformin Hydrochloride Biguanide Depomed, Inc.;Santarus, Inc.
Glyset Miglitol Alpha-Glucosidase Inhibitors
Pharmaceia and Upjohn Company LLC
Novolin Human Insulin Short Acting or Regular Novo Nordisk; Physicians Total Care, Inc.;TYA Pharmaceuticals
Novolog insulin aspart Rapid-Acting Insulin Dispensing Solutions;Novo Nordisk; Physicians Total Care, Inc.;TYA Pharmaceuticals
Tresiba insulin degludec insulin Novo Nordisk
Xultophy insulin degludec; liraglutide Glucagon-Like Peptide-1 (GLP-1) Agonists
Novo Nordisk
Levemir insulin detemir Long-Acting Insulin Dispensing Solutions;Novo Nordisk; Physicians Total Care, Inc.
BasaglarLantusToujeo
insulin glargine Long-Acting Insulin Dispensing Soloutions, Inc.;Eli Lilly and Company;Physicians Total Care, Inc.;Sanofi-Aventis U.S. LLC
Soliqua insulin glargine; Lixisenatide Insulin Sanofi-Aventis U.S. LLC
Apidra insulin glulisine Rapid-Acting Insulin Sanofi-Aventis U.S. LLC
Afrezza Humalog 70/30HumulinHumulin NHumulin R
Insulin human Intermediate Insulin or Baseline, Basal
Eli Lilly and Company; Mankind Corporation; Physicians Total Care, Inc.
Humalog Insulin lispro Rapid-Acting Insulin Dispensing Solutions, Inc.;Eli Lilly and Company; Physicians Total Care, Inc.
Tradjenta linagliptin Dipeptidyl Peptidase 4 Inhibitors
Boehringer Ingelheim Pharmaceuticals, Inc.;Cardinal Health
JentaduetoJentadueto XR
linagliptin and metformin hydrochloride
Dipeptidyl Peptidase 4 Inhibitors
Boehringer Ingelheim Pharmaceuticals, Inc;Bryant Ranch Prepack;Physicians Total Care, Inc.

Proprietary Name Non_Proprietary_Name Class Labeler
Victoza liraglutide Glucagon-Like Peptide-1 (GLP-1) Agonists
Novo Nordisk
Metformin HCL Metformin HCL Biguanide Ascend Laboratories, Inc.;Cambridge Therapeutics Technologies, LLC;Time Cap Laboratories, Inc.
Nesina Alogliptin Dipeptidyl Peptidase 4 Inhibitors
Takeda Pharmaceuticals America, Inc.
PioglitazoneActos
Pioglitazone Thiazolidinediones (TZDs)
Avera McKennan Hospital;Cadila Healthcare Limited;Cardinal Health;Carilion Materials Management;Citron Pharma LLC;Dispensing Solultions, Inc.;International Laboratories, LLC;Lake Erie Medical & Surgical Supply dba Quality Care Products LLC;Macleods Pharmaceuticals Limited;MedVantx, Inc.;Mylan Institutional Inc.;Mylan Pharmaceuticals Inc.;
NuCare Pharmaceuticals, Inc.; Physicians Total Care, Inc.;Ranbaxy Pharmaceuticals, Inc.;Rebel Distributors Corp.;Sandoz, Inc.;Takeda Pharmaceuticals America, Inc.;Teva Pharmaceuticals USA, Inc.;Wockhardt Limited;Zydus Pharmaceuticals (USA) Inc.
Prandin Repaglinide Meglitinides Cardinal Health;Carilion Materials Management;Gemini Laboratories, LLC;Lake Erie Medical dba Quality Care Products LLC;Novo Nordisk;Physicians Total Care
Precose Acarbose Alpha-Glucosidase Inhibitors
Aphena Pharma Solutions - Tennessee, LLC;Bayer Healthcare Pharmaceuticals, Inc.;Physicians Total Care, Inc.
Riomet Metformin Hydrochloride Biguanide Ranbaxy Laboratories, Inc.
Onglyza SAXAGLIPTIN Dipeptidyl Peptidase 4 Inhibitors
AstraZeneca Pharmaceuticals LP;Cardinal Health;Physicians Total Care, Inc.
Kombiglyze SAXAGLIPTIN AND METFORMIN HYDROCHLORIDE
Metformin + AstraZeneca Pharmaceuticals LP
Januvia sitagliptin Dipeptidyl Peptidase 4 Inhibitors
Avera McKennan Hospital;Cardinal Health;Lake Erie Medical & Surgical Supply dba Quality Care Products LLC;Merck Sharp & Dohme Corp.;Physicians Total Care, Inc.
Janumet sitagliptin and metformin hydrochloride
Metformin + Lake Erie Medical & Surgical Supply dba Quality Care Products LLC;Merck Sharp & Dohme Corp
Starlix Nateglinide Meglitinides Novartis Pharmaceuticals Corporation
SymlinPen 60 & 120 Pramlintide Amylin Agonist AstraZeneca Pharmaceuticals LP

Proprietary Name Non_Proprietary_Name Class Labeler
Welchol Colesevelam Hydrochloride Bile Acid Binding Resins Avera McKennan Hospital;Carillion Materials Management;Daiichi Sankyo, Inc.;Physicians Total Care Inc.;Rebel Distributors
Revised: December 23, 2017

Appendix C

BRIAN SANDOVAL, Governor
RICHARD WHITLEY, MS, Director
JULIE KOTCHEVAR, PH.D., Administrator Division of Public and Behavioral Health
2018
Senate Bill 539 Report: Compensation and Samples Distributed by Pharmaceutical Sales Representatives in Nevada
JUNE 1, 2018
DEPARTMENT OF HEALTH AND HUMAN SERVICES

1
Introduction Senate Bill No. 539 was passed during the 2017 legislative session, requiring the Department of
Health and Human Services (DHHS) to compile lists of prescription drugs used to treat diabetes and
requiring each pharmaceutical sales representative to report samples as well as compensation in
excess of $10 provided to health care providers within the State of Nevada. This report is submitted
pursuant to Section 4.6, subsection 5 of SB539 as follows:
The Department shall analyze annually the information submitted pursuant to
subsection 4 and compile a report on the activities of pharmaceutical sales
representatives in this State. Any information contained in such a report that is
derived from a list provided pursuant to subsection 1 or a report submitted pursuant
to subsection 3 must be reported in aggregate and in a manner that does not reveal
the identity of any person or entity. On or before June 1 of each year, the Department
shall:
(a) Post the report on the Internet website maintained by the Department; and
(b) Submit the report to the Governor and the Director of the Legislative Counsel Bureau for
transmittal to the Legislative Committee on Health Care and, in even-numbered years, the next
regular session of the Legislature.
Methodology All drug manufacturer reports received by DHHS were standardized and merged into one dataset.
Those reporting compensation or sample incidents indicating that “doctor” was the professional
designation of the recipient were linked to licensing lists for Medical Doctors (MD) and Doctors of
Osteopathy (DO). Only a fraction (13%) of the original records reported by the drug companies
contained enough information to link the provider records to the physician licensing data. Due to
time constraints related to establishing regulations for reporting, a specific format was not
designated by DHHS during this first year. A report format will be prescribed in future years.
Some sales representative reports only listed the name of the recipient given compensation or a
sample, which did not allow the department to conclusively identify whether a recipient was a
health professional. Only 26% of the reports provided sufficient information to determine if a
recipient was or was not a health provider.
Manufacturers and Sales Representatives Table 1 indicates the unique number of drug manufacturers that reported on behalf of their sales
representatives or drug manufacturers from which sales representatives sent reports. Reports
were submitted in both ways. Some manufacturers sent a comprehensive list on behalf of all sales
representatives, while some manufacturers required sales representatives to submit their own
reports.

2
Table 1:
Total Number of Manufacturers Reporting 154
As of April 12, 2018, there were 2,572 active sales representatives reported by drug companies. Table 2 indicates the number of sales representatives for whom or from whom reports were
received. That number represents slightly more than 52% of sales representatives. It is unknown
whether the other 48% were unaware of the new law or did not have anything to report. Outreach
to drug companies and sales representatives will be conducted in coming years to ensure
compliance with statutory requirements.
Table 2:
Number of Sales Representatives Reporting 1347
Health Providers
Incidents in which recipient professional designation information was provided were utilized to
create Chart 1 which illustrating the percentage of each professional group receiving any type of
sample or compensation between October and December of 2017.
Chart 1: Percent Professional Designation Group Receiving Sample or Compensation Incident
Doctor (MD or DO), 60%
Physician Assistant, 12%
Nurse Practitioner, 12%
Office Staff, 7%
Other Health Care Provider,
6%
Other Non-Health Care, 2%
RN/LPN (Not NP), 1%
Pharmacist, <1%

3
Table 3 compares the percentage of incidents across all professions reported as compensation or
sample. Samples were provided more frequently than compensation to all health providers or other
staff.
Table 3:
Comparison of Compensation versus Sample Incidents
Compensation 36.80%
Samples 63.20%
Total 100.00%
Physician Data
Table 4 indicates the number and percentage of primary care doctors receiving compensation or
samples compared to all other specialties.
Table 4:
Number/Percent of Specialist or Primary Care* Doctors Receiving Compensation or Samples
Specialty of Doctors Receiving Compensation or Samples Number of Doctors Percent
All Other Specialties 358 37.53%
Primary Care* 596 62.47%
Grand Total 954 100.00%
* For the purposes of this report, primary care doctors include the following self-reported specialties: family
practice, general practice, internal medicine, obstetrics/gynecology, pediatrics, psychiatry, and geriatrics.
Table 5 illustrates the percentage of doctors that received compensation only, samples only, or a
combination of compensation and samples. Almost 60% of doctors received samples only. As an
important note, the 954 unique doctors identified in Table 5 represent only those recipients that
could be conclusively identified as a doctor from the information submitted to the department.
Table 5:
Individual Doctors Receiving Compensation, Samples or Both
Number of Doctors Percentage
Compensation Only 170 17.82%
Sample Only 558 58.49%
Compensation and Sample 226 23.69%
Total 954 100.00%
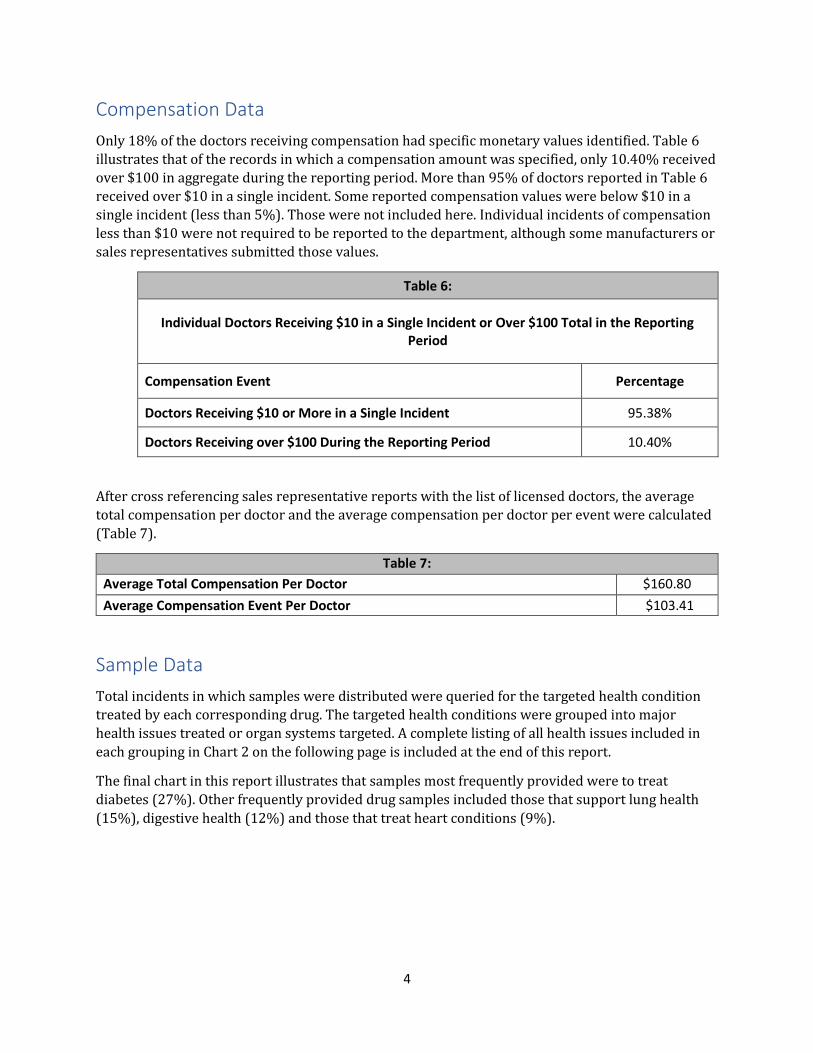
4
Compensation Data
Only 18% of the doctors receiving compensation had specific monetary values identified. Table 6
illustrates that of the records in which a compensation amount was specified, only 10.40% received
over $100 in aggregate during the reporting period. More than 95% of doctors reported in Table 6
received over $10 in a single incident. Some reported compensation values were below $10 in a
single incident (less than 5%). Those were not included here. Individual incidents of compensation
less than $10 were not required to be reported to the department, although some manufacturers or
sales representatives submitted those values.
Table 6:
Individual Doctors Receiving $10 in a Single Incident or Over $100 Total in the Reporting Period
Compensation Event Percentage
Doctors Receiving $10 or More in a Single Incident 95.38%
Doctors Receiving over $100 During the Reporting Period 10.40%
After cross referencing sales representative reports with the list of licensed doctors, the average
total compensation per doctor and the average compensation per doctor per event were calculated
(Table 7).
Table 7:
Average Total Compensation Per Doctor $160.80
Average Compensation Event Per Doctor $103.41
Sample Data
Total incidents in which samples were distributed were queried for the targeted health condition
treated by each corresponding drug. The targeted health conditions were grouped into major
health issues treated or organ systems targeted. A complete listing of all health issues included in
each grouping in Chart 2 on the following page is included at the end of this report.
The final chart in this report illustrates that samples most frequently provided were to treat
diabetes (27%). Other frequently provided drug samples included those that support lung health
(15%), digestive health (12%) and those that treat heart conditions (9%).

5
Chart 2: Percentage Samples Distributed by Targeted Health Condition as Reported by
Sales Representatives
The following includes health conditions grouped into each major category.
• Blood Disorders: Anemia, Venous Thromboembolism, Kidney Conditions, Anticoagulants • Cancer: Cancer, Chemotherapy, Carcinoid Syndrome Diarrhea, Cancer-related Nausea and
Vomiting • Diabetes: Diabetes Mellitus, Diabetic Nerve Pain, Hyperglycemia, Type 1 and 2 Diabetes • Digestive Health: Acid Reflux, Bowel Prep Kit, Crohn’s Disease, Ulcerative Colitis, Exocrine
Pancreatic Insufficiency, Heartburn, Hemorrhoids, Irritable Bowel Syndrome, Overactive Bladder, Pancreatic Enzymes, Ulcer
• Eye Health: Conjunctivitis, Dry Eye, Eye Drops, Eye Pain and Swelling, Glaucoma, Macular Degeneration
• Heart Conditions: Angina, Atrial Fibrillation, Cardiovascular Disease, Heart Attack, Stroke, Heart Disease and Pancreatitis, Heart Failure, High Cholesterol, Hypertension
Diabetes27%
Lung Health15%
Digestive Health12%
Heart Conditions9%
Skin conditions6%
Mental Health6%
Blood Disorders5%
Men's & Women's Health5%
Immune Disorder5%
Eye Health3%
Opioid & Opioid Abuse Treatment
3%Other
1%Cancer1%
Nerve Disorders1%
Pain Relief1%

6
• Immune Disorder: Auto Immune Diseases, Gout, Immunosuppressive Drug, Nonsteroidal Anti-Inflammatory Drug, Osteoarthritis, Psoriatic Arthritis, Rheumatoid Arthritis
• Lung Health: Asthma, Chronic Obstructive Pulmonary Disease • Men's & Women's Health: Birth Control, Endometriosis, Erectile Dysfunction, Fertility,
Genital Warts, Infection - Women's Health, Menopause, Morning Sickness, Prenatal Vitamin, Prostate, Testosterone, Vaginal Dryness, Osteoporosis, Urinary Tract Infection
• Mental Health: Attention Deficit Hyperactivity Disorder, Binge Eating Disorder, Parkinson’s Disease, Alzheimer’s Disease, Antidepressant, Bipolar Disorder, Depression, Dyspareunia, Schizophrenia, PseudoBulbar Affect
• Nerve Disorders: Multiple Sclerosis, Epilepsy, Parkinson’s Disease, Neuropathy, Restless Leg Syndrome
• Opioid & Opioid Abuse Treatment: Drug Withdrawal, Opioid, Opioid-Induced Constipation
• Other: Tonsillitis, Vitamin Supplement, Weight Loss, Hyperparathyroidism, Hyperthyroidism, Allergies, Cough Syrup, Dry Mouth, Ear Drops, Familial Cold Autoinflammatory Syndrome, Non-24-hour Sleep-Wake Disorder, Transfusional Iron Overload
• Pain Relief: Migraine, Muscle Relaxer • Skin conditions: Acne, Actinic Keratosis, Angioedema, Anti-Inflammatory Steroid,
Antifungal, Anti-parasite, Antipruritics, Athlete's Foot, Botox, Cold Sores, Dermatitis, Eczema, Psoriasis, Rosacea/Severe Acne, Seborrheic Dermatitis
For questions or concerns, please contact Margot Chappel, DPBH Deputy Administrator of
Regulatory and Planning at [email protected] or (775) 684-4041.

Appendix D
Helping People. It’s who we are and what we do.
Essential Diabetes Drugs Price
Increase Report
Report Date:
September 11, 2018
Richard Whitley, MS
Director
Brian Sandoval
Governor
Prepared by: Primary Care Office, State of Nevada
Division of Public and Behavioral Health (DPBH) 4150 Technology Way, Carson City, NV 89706
Julie Kotchevar, PhD
DPBH Administrator

2
Helping People. It’s who we are and what we do.
Introduction
During the 79th legislative session, SB 539 was approved and required DHHS pursuant to section 3.6 (2a,b) of the bill and Nevada Revised Statute (NRS) 439B.630 to compile a list of certain prescription drugs essential for treating diabetes and report as follows:
NRS 439B.630 Department to annually compile lists of certain prescription drugs essential for treating diabetes. On or before February 1 of each year, the Department shall compile:
1. A list of prescription drugs that the Department determines to be essential for treating diabetes in this State and the wholesale acquisition cost of each such drug on the list. The list must include, without limitation, all forms of insulin and biguanides marketed for sale in this State.
2. A list of prescription drugs described in subsection 1 that have been subject to an increase in the wholesale acquisition cost of a percentage equal to or greater than:
a.) The percentage increase in the Consumer Price Index, Medical Care Component during the im-mediately preceding calendar year; or
b.) Twice the percentage increase in the Consumer Price Index, Medical Care Component during the immediately preceding 2 calendar years.
(Added to NRS by 2017, 4297)
On October 31, 2017, the Department of Health and Human Services (DHHS) developed a list of essential diabetes medications with the feedback and collaboration from stakeholders.
This essential list does not include any drugs used to treat co-morbidities often present in an in-dividual with diabetes. The list does not contain every single drug that may be an effective treat-ment for diabetes or approved for the treatment of diabetes. This list attempts to refine the nu-merous treatments to those approved for treatment, identified by prescribers as essential, and most frequently prescribed in Nevada (as determined by the publicly available data sources).
This report was posted in “final” status after providing manufacturers 14 calendar days to re-view and notify if there may be any errors within the report. DHHS did not receive any requests for review within 14 calendar days of posting.
DHHS invites you to view the Drug Transparency website at drugtransparency.nv.gov. If you are interested in receiving email notifications for Nevada Drug Transparency information and up-dates, please subscribe to the LISTSERV.
Report Summary
The 2018 DHHS Essential Diabetes Drug Price Increase report used a methodology that met the requirements of NRS 439B.630.
To generate this report, the Department identified a total of 2,716 National Drug Codes (NDC) that included varying packing formulations from the essential list of medications. From that list, 175 NDCs showed a price increase above the thresholds established in law. The pricing data uti-lized in this analysis was limited by the availability of Wholesale Acquisition Cost (WAC) data. This report will be updated as additional data is received, but does not incorporate other pricing benchmarks at this time.

3
Helping People. It’s who we are and what we do.
Essential Diabetes List
The 2017 List of Essential Drugs for Treating Diabetes can be found on the following web page: http://dhhs.nv.gov/HCPWD/Drug_Tranparency___Essential_Lists,_Reports___Resources/
DHHS released the first list on October 31, 2017. We welcome feedback for the development of the drug selection criteria for the 2018 list. Feedback and questions can be directed to the e-mail: [email protected]
Methodology
The National Drug Codes (NDC) were compiled corresponding to all the Essential Diabetes Drugs published by DHHS on October 31, 2017. NDC and pricing data was retrieved from a pur-chased database effective July 5, 2018. For each of the NDC codes, wholesale acquisition cost (WAC) unit price data was obtained, including up to seven price histories. The minimum prices active during 2016 and 2017 and the maximum active price for 2018 were compared to identify the one-year and two-year price increase percentages. The one-year price increases were com-pared against the 2017 Consumer Price Index (CPI) Medical Component, while the two-year price increases were compared against twice the CPI Medical Component values of 2016 and 2017. The 2018 report includes only those drugs identified as having a price increase.
Manufacturer Report on Price Increases
SB 539 requires manufacturers to report to the Department by July 1, 2018, per section 26.9(b) of this act., and subsequent years on or before April 1 annually per NRS 439B.640 in which a drug is included on the current essential list. The manufacturer of the drug shall submit to the Department a report describing the reasons for the increase in the wholesale acquisition cost of the drug as outlined in NRS. The report must include, each factor that contributed to the in-crease, the percentage of total increases attributable to each factor, an explanation of the role of each factor in the increase, and any other information prescribed by DHHS in regulation. On June 7, 2018, DHHS provided notice that they will not proceed with enforcement action for reports made during the first six months. DHHS expects all entities will work in good faith dur-ing the six month period, but wants to ensure manufacturers, sales representatives, pharmacy benefit managers, and non-profit organizations have ample opportunity to come into compliance with the statutes and regulations by January 15, 2019, before any enforcement action will be taken.

4
Helping People. It’s who we are and what we do.
DHHS Essential Diabetes Drug Price Increase Report
PROPRIETARY NAME
NON-PROPRIETARY
NAME CLASS
NDCs that showed a percentage increase in the Consumer Price Index (CPI) Medical Com-ponent during the preceding calendar year;
or preceding two (2) calendar years
Actos, Pioglitazone Pioglitazone Thiazolidinediones (TZDs)
64764015104, 64764015105, 64764030114, 64764030115, 64764045124, 64764045125, 54458086610, 68084087801, 54458086510
Afrezza, Humalog, Humulin N, Humulin R
Insulin human, Insulin lispro
Intermediate Insulin or Baseline, Basal, Rapid-Acting Insulin
47918089190, 47918088236, 47918087490, 47918090218, 47918088463, 47918089463, 47918087890, 47918088018, 2751659, 2879959, 2751001, 2751017, 2771227, 2880559, 2831501, 2831517, 2821501, 2821517, 2882427, 2850101
Apidra insulin glulisine Rapid-Acting Insulin 88250033, 88250205
Basaglar, Lantus, Toujeo
insulin glargine Long-Acting Insulin 2771559, 88222033, 88502101, 88221905, 88502005, 24586903
Bydureon, Byetta exenatide Glucagon-Like Peptide- 1 (GLP-1) Agonists
310653004, 310652004, 310654004, 310652401, 310651201
Cycloset bromocriptine mesylate
Ergolines 68012025820
Farxiga, Xigduo DAPAGLIFLOZIN Propanediol
Sodium Glucose Co- Transporter-2 (SGLT2) Inhibitors
310621030, 310620530, 310628030, 310627030, 310626060, 310625030
Fortamet, Metformin HCL
Metformin HCL Biguanide 59630057560, 59630057460, 60687014301
Glimepiride Glimepiride Sulfonylureas (SUs) 16729000101, 16729000116, 16729000201, 16729000216, 16729000301, 16729000316, 54458096610
Glipizide ER, Glucotrol, Glipizide XL, Glucotrol XL
glipizide Sulfonylureas (SUs) 68084011201, 68084029521, 68084011101, 49412066, 49411066, 49017807, 49017808, 49017001, 49017402, 49017403
Glyset Miglitol Alpha-Glucosidase In-hibitors
9501401, 9501201, 9501301
Glyxambi Empagliflozin and linagliptin
Sodium Glucose Co- Transporter-2 (SGLT2) Inhibitors
597018230, 597018239, 597016430, 597016439, 597016490
Invokamet, Invokana canagliflozin Sodium Glucose Co- Transporter-2 (SGLT2) Inhibitors
50458054360, 50458054260, 50458054160, 50458054060, 50458014030, 50458014090, 50458014130, 50458014190

5
Helping People. It’s who we are and what we do.
DHHS Essential Diabetes Drug Price Increase Report cont.
PROPRIETARY NAME
NON-PROPRIETARY
NAME CLASS
NDCs that showed a percentage increase in the Consumer Price Index (CPI) Medical Com-ponent during the preceding calendar year;
or preceding two (2) calendar years
Janumet sitagliptin and metformin hydro-chloride
Metformin + 6057761, 6057762, 6057782, 6057561, 6057562, 6057582
Januvia sitagliptin Dipeptidyl Peptidase 4 Inhibitors
6027702, 6027728, 6027731, 6027733, 6027754, 6027782, 6022128, 6022131, 6022154, 6011228, 6011231, 6011254
Jardiance, Synjardy Empagliflozin, empagliflozin and metformin hydro-chloride
Sodium Glucose Co- Transporter-2 (SGLT2) Inhibitors
597015230, 597015237, 597015290, 597015330, 597015337, 597015390, 597016818, 597016860, 597018018, 597018060, 597017518, 597017560, 597015918, 597015960, 597028073, 597028090, 597030045, 597030093, 597029578, 597029588, 597029059, 597029074
Jentadueto, Jentadueto XR
linagliptin and metformin hydro-chloride
Dipeptidyl Peptidase 4 Inhibitors
597014818, 597014860, 597014618, 597014660, 597014718, 597014760, 597027073, 597027094, 597027533, 597027581
Kombiglyze SAXAGLIPTIN AND METFOR-MIN HYDRO-CHLORIDE
Metformin + 310612560, 310614530, 310613530
Levemir insulin detemir Long-Acting Insulin 169368712, 169643810
Nesina Alogliptin Dipeptidyl Peptidase 4 Inhibitors
64764012530, 64764025030, 64764062530
Novolog insulin aspart Rapid-Acting Insulin 169330312, 169750111, 169633910
Onglyza SAXAGLIPTIN Dipeptidyl Peptidase 4 Inhibitors
310610030, 310610090, 310610530, 310610590
Prandin Repaglinide Meglitinides 60846088201, 60846088401
Riomet Metformin HCL Biguanide 10631020601, 10631020602, 10631023801, 10631023802
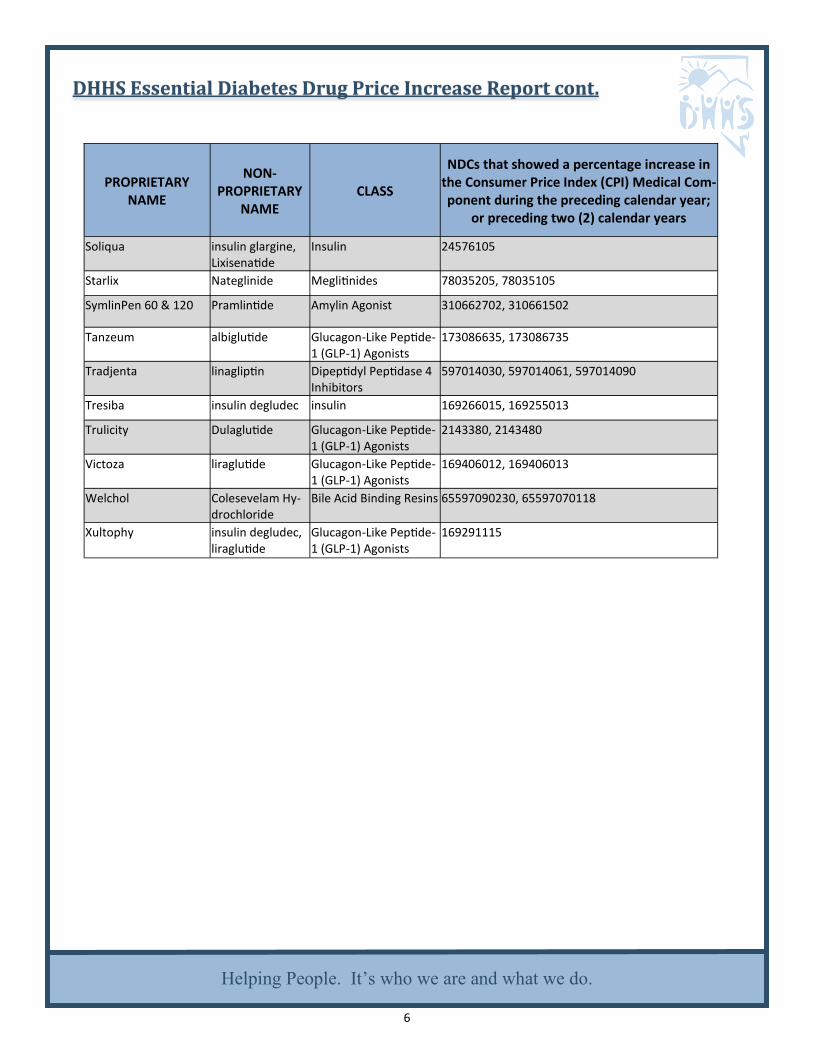
6
Helping People. It’s who we are and what we do.
DHHS Essential Diabetes Drug Price Increase Report cont.
PROPRIETARY NAME
NON-PROPRIETARY
NAME CLASS
NDCs that showed a percentage increase in the Consumer Price Index (CPI) Medical Com-ponent during the preceding calendar year;
or preceding two (2) calendar years
Soliqua insulin glargine, Lixisenatide
Insulin 24576105
Starlix Nateglinide Meglitinides 78035205, 78035105
SymlinPen 60 & 120 Pramlintide Amylin Agonist 310662702, 310661502
Tanzeum albiglutide Glucagon-Like Peptide- 1 (GLP-1) Agonists
173086635, 173086735
Tradjenta linagliptin Dipeptidyl Peptidase 4 Inhibitors
597014030, 597014061, 597014090
Tresiba insulin degludec insulin 169266015, 169255013
Trulicity Dulaglutide Glucagon-Like Peptide- 1 (GLP-1) Agonists
2143380, 2143480
Victoza liraglutide Glucagon-Like Peptide- 1 (GLP-1) Agonists
169406012, 169406013
Welchol Colesevelam Hy-drochloride
Bile Acid Binding Resins 65597090230, 65597070118
Xultophy insulin degludec, liraglutide
Glucagon-Like Peptide- 1 (GLP-1) Agonists
169291115