Embed Size (px)
Citation preview

PLEA2012 - 28th Conference, Opportunities, Limits & Needs Towards an environmentally responsible architecture Lima, Perú 7-9 November 2012
Analysis of environmental performance in a social housing: Housing complex at Conchalí, Santiago of Chile
PAULA LELIS RABELO1, SIMÓN PUJADAS TAFRA
1, JAVIER DURÁN PALMA
1
1B-Green Chile S.A., Santiago , Chile
ABSTRACT: Social housing in Latin America is still a concern, and developing innovative and affordable solutions
represents a major architectural challenge. Under this scenario, this paper aims to rethink and propose alternatives of
habitability in low-income projects, regarding bioclimatic architecture and thermal comfort.
The initial approach consists in evaluating a standard dwelling unit designed by “Un techo para Chile”, a Chilean Non-
Profit Organization that focuses in providing permanent social housing. Thermal comfort, ventilation, lighting, internal
humidity and thermal bridges are the five main parameters taken into account. The conclusions from these results
demonstrate the critical design features and lead to better suited proposals, improving the building skin performance,
indoor environmental quality and the user´s thermal comfort. The hardest challenge of this work consists in the
limitations due to the amount of economic resources.
The comparative analysis takes advantage of analytical tools, advanced simulation software, and in-situ measurements of
a built project, resembling the case study, as maximum as possible, to the actual building.
Keywords: social housing, energy efficiency, environmental design
INTRODUCTION
Social housing is a current and very necessary demand in
many parts of the world, especially in Latin America.
Focusing on the Chilean reality, it is observed that social
housing is even more challenging due to the
environmental features presented along the country. Due
to its wide extension in the north-south axis, Chile has
numerous and extreme environmental conditions,
including arid zones, in the north, and very humid or
windy zones in the south. Besides that, it is located over
a seismic zone. Therefore, besides supplying habitability
to its occupants, the social housing in Chile must provide
safe structures capable of enduring earthquakes and
radical weather conditions.
In the first decades of this century, according to the
Chilean Ministry of Housing [1], strong attempts to
address the housing deficit has begun, which has
traditionally affected the lower income families. The 27F
earthquake reveals the efforts and attempts that have
been made to rethink social housing demands in Chile.
This paper comes from a request from the ONG “Un
Techo para Chile” (A Roof for Chile), the most important
non-profit organization in Chile currently addressing
social housing agenda. The organization was founded in
1997 [2], when a group of young people decided to bring
people of different segments to build about three hundred
and fifty houses in Curanilahue, located at the south of
the country. Nowadays, this ONG has volunteers and
residents that work in nineteen countries, in two main
areas: social insertion and permanent housing.
The request for this research consists in analyzing a
project designed for permanent housing purposes, from
an environmental performance approach. The housing
complex called Villa La Esperanza is located at
Conchalí, a district of Santiago.
The project includes the construction of fifty-two houses,
green and public areas and urban development. The two
stories units – plus a mansard roof, are grouped as a
condominium (Fig. 1).
Figure 1.Site planning of Villa La Esperanza, Conchalí.
The evaluation is based on an environmental simulation
of one of the units, and in-situ measurement. The
PLEA2012 - 28th Conference, Opportunities, Limits & Needs Towards an environmentally responsible architecture Lima, Perú 7-9 November 2012
parameters evaluated are thermal comfort, ventilation,
lighting, internal humidity and thermal bridges.
This paper is developed at B-Green Chile S.A., a Chilean
Consultancy Agency that provides assessment in energy
efficiency, bioclimatic architecture, indoor environmental
quality and green-building certifications.
OBJECTIVES
This research aims to evaluate a social housing prototype
provided by “Un Techo para Chile”, analyzing its
performance facing weather conditions, as well as
focusing on the improvement of building systems applied
to social housing in Chile. Moreover, this research
establishes comparison between software simulations and
in situ measurement, identifying the advantages and
disadvantages of each method.
The second step of this investigation will be the proposal
of improvements in building components and its
operation, taking the results observed in the first stage
into account. The overall objective of this work is
contributing to the improvement of social housing in
Chile, identifying ways to obtain a better performance of
materials and constructive systems.
METHODOLOGY AND PROCEDURE
The house was studied and evaluated using two different
methods: software simulation and real-life monitoring
devices, which were later compared and studied. Both
methods took different parameters into account. Whilst
software simulation shows a more technical result, it
does not (or rather cannot) predict an accurate behavior
regarding the occupation of the project.
Softwares were used to simulate the thermal and
environmental performance of the dwellings:
1) IES VE 6.4 (Integrated Environmental Solutions,
Virtual Environment) software [3] was used to simulate
Relative Humidity, Dry Bulb Temperature, Drew point
Temperature, Air Temperature, Room´s CO2
concentration, Internal Loads, Solar Loads, Infiltration
Loads, Natural Ventilation Loads and Dissatisfied
People. Second step consisted in creating house operation
profiles, based in an average of five people per dwelling.
A specific profile has been created for the following
parameters: ventilation, lighting, miscellaneous,
occupation. The next image represents an example of a
profile created (Fig. 2).
The following step consists in generating room thermal
templates. A thermal template represents a group of
conditions associated to a room or thermal zone defined
in the model. A thermal template involves four
parameters: room conditions (comfort temperature,
cooling temperature and infiltrations), system loads
(heating and cooling systems), and internal loads
(occupation, lighting and electrical devices). Each of
these three types of load is associated with a
correspondent profile and air exchanges (exterior air
exchanges, associated with ventilation profiles and
window geometries) (Tables 1, 2).
Figure 2.Graphic of an Occupation Profile designed for a
weekday at Villa La Esperanza´s building prototype [3].
Fourth step consisted in adding materials to the model,
inserting its respective thermal properties. All the thermal
conductivity values were taken from NCH 853 [4]. The
following table displays the U values adopted (Fig. 3):
TEMPLATE DESCRIPTION U-VALUE
(W/m²·K)
TPCH_ALBAÑILERIA Masonry 2.280
TPCH_SUELO_EXPUESTO Exposed floor 2.968
TPCH_VENTANA Windows 5.692
TPCH_TECHO_EXTERIOR Exterior roof 1.299
TPCH_EXTERIOR MADERA Exterior wood 2.620
Figure 3: Conductivity values of constructive systems.
Finally, the weather data file of Santiago was imported to
IES VE 6.4 to proceed with the simulation and obtain the
results.
THERMAL TEMPLATE: DINING ROOM
• Heating
Profile off continuously
Setpoint: Constant 19 °C
Hot Water consumption 0.00 l/(h·pers)
Radiant Fraction 0.20
• Cooling
Profile off continuously
Setpoint: Constant 23 °C
Radiant Fraction 0.00
• Model Settings
Solar Reflected Fraction 0.05
Furniture Mass Factor 1.00
Systems
Auxilliary vent. system Main system
• Humidity Control
Min. % Saturation 0%
Max. % Saturation 100%
• System outside air supply
Min. Flow Rate 0.80 l/(s·m²)
Add. Free Cooling Capacity 0.00 AC/h
Variation Profile off continuously
Table 1. Example of a Thermal Template of a dining room –
heating, cooling, model settings and humidity control.
PLEA2012 - 28th Conference, Opportunities, Limits & Needs Towards an environmentally responsible architecture Lima, Perú 7-9 November 2012
THERMAL TEMPLATE: DINING ROOM
• Internal Gains
- Fluorescent Lighting : Dining room lighting profile
Max Sensible Gain 10.00 W/m²
Max Power Consumption 10.00 W/m²
Radiant Fraction 0.45
Fuel Electricity
Dimming Profile on continuously
- People : Dining room occupation profile
Max Sensible Gain 90.00 W/P
Max Latent Gain 60.00 W/P
Occupant Density 20.0 ²/person
- Miscellaneous : Dining room Miscellaneous profile
Max Sensible Gain 7.50 W/m²
Max Latent Gain 0.00 W/m²
Max Power Consumption 7.50 W/m²
Radiant Fraction 0.22
Fuel Electricity
• Air Exchanges
Type Infiltration
Variation Profile on continuously
Adjacent Condition External Air
Max A/C Rate 0.60 AC/h
Table 2. Example of a Thermal Template of a dining room –
internal gains and air exchanges.
2) Therm 6.4 (developed by Lawrence Berkeley National
Laboratory) [5] was used to identify and evaluate thermal
bridges and finishes of the house. Each material was
assigned with its correspondent thermal conductivity
value in accordance with NCH 853 [4]. Interior and
exterior temperature conditions were set to every section
using resultant data from IES VE 6.4 simulation, taking
the values of the typical days in winter and summer.
3) Regarding the real-life measurement, the data was
collected from a one week monitoring process, performed
between February 8th
and February 15th
, 2012. The
monitoring devices used were three HOBO data logger.
After measurement period, data was transferred to
HOBOware software. One data logger was attached to the
kitchen sink in the first floor, and the other two were
placed in the bedrooms of the second floor, as shown in
the following plans (Figs. 4, 5).
Second floor devices were plugged to an exterior sensor
which monitored exterior data for later comparison.
Installation of exterior sensors obliges a minimum
permanent aperture on these two windows, resulting in a
permanent infiltration rate that should be taken into
consideration. The monitored house was on pilot stage;
therefore, results do not consider occupancy, internal
loads (other than occasional entrances) nor natural
ventilation (openings of windows and doors).
RESULTS
The analysis results are presented in three categories in
accordance to the evaluation method. Results obtained
from IES VE 6.4 are exposed first, followed by Therm
6.4 results, and HOBOware results.
1. Simulation Results with IES VE 6.4
Results for a typical summer week are shown in the first
three graphs (Figs. 6, 7, 8).
Dotted curves display simulation results of northeast
bedroom located in the second floor, and solid lines
display results for the dining room located in the first
floor. First floor room presents temperatures between
17ºC and 26ºC, and the percentage of dissatisfied people
increases when temperatures reach their highest and
lowest peaks. Second floor shows an increment in
temperature compared to the first floor, due to the thermal
convection produced by the tin roof. The percentage of
people dissatisfied is considerable only when the external
air temperature reaches the highest levels (Fig. 6).
Figure 6. Analysis of air temperatures and radiant temperatures
in a typical summer week, and the percentage of dissatisfied
people in both rooms.
The following graph (Fig. 7) explains the house behavior
respect to the thermal gains. A window operation profile
has been created, taking advantage of natural ventilation
to obtain a better thermal performance. This shows that a
correct and appropriate use of natural ventilation helps to
manage the thermal gains.
Figure 4: First floor
monitoring device location
(kitchen).
Figure 5: Second floor monitoring
devices location (bedrooms);
measurement of external
temperature.
3
PLEA2012 - 28th Conference, Opportunities, Limits & Needs Towards an environmentally responsible architecture Lima, Perú 7-9 November 2012
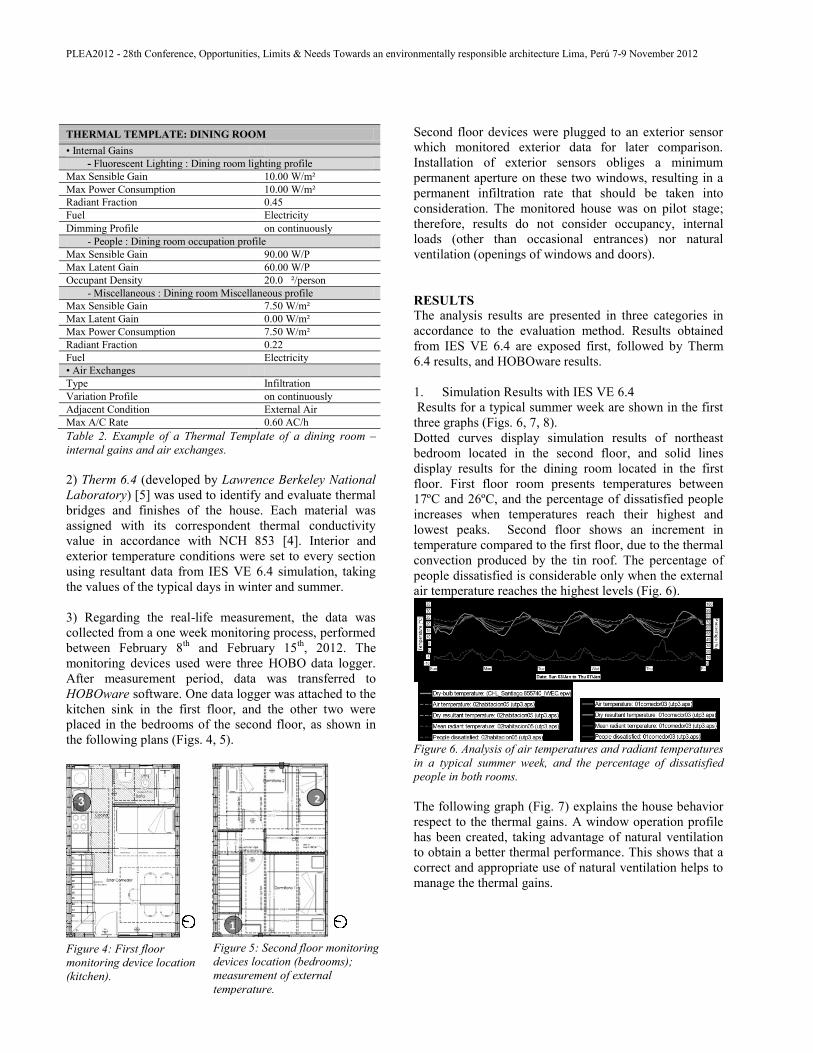
Figure 7. Analysis of gains in a typical summer week.
This third graph (Fig. 8) diagnoses the indoor air quality,
through the measure of indoor CO2 concentrations.
Current CO2 levels in Santiago are approximately 400
ppm, and this value should not exceed 1200 ppm.
Figure 8. Analysis of CO2 concentrations and dew-point
temperature in a typical summer week.
Simulation demonstrates that the dwelling´s CO2 range is
within expected, low concentrations during the day and a
slight rise during the night due to the concentration of
occupants (all asleep). However, this simulation did not
include any heating system as requested by Un techo
para Chile. Later inclusion of a heating system will
greatly increase CO2 and maybe the dwelling would
present a non-comfort range. Summer simulation does not
present problems with humidity nor condensation.
Results for a typical winter week are shown in the next
three graphs (Figs. 9, 10, 11).
The results show that the response of the house to winter
conditions is outside the comfort zone, dissatisfied users
reach 100% in some cases. Exterior temperature is similar
to interior temperature, as in summer simulation,
demonstrating that the insulation and thermal mass of the
dwelling is not enough to endure Santiago´s weather (Fig.
9).
Figure 9. Analysis of air temperatures and radiant temperatures
in a typical winter week, and the percentage of dissatisfied
people in both rooms.
The next graph (Fig. 10) explains the low temperatures of
the dwelling. Internal and solar loads are not enough to
heft the losses produced by infiltration and envelope
conduction, highlighting the inadequate constructive
solutions for weather conditions like Santiago´s.
Figure 10. Analysis of gains in a typical winter week.
In the graph shown below (Fig. 11), it can be observed
that the dew point temperature almost reaches the indoor
air temperature, (alerting to the probability of producing
condensation).indicating possible condensation in the
building walls. In addition, this condition does not take
into account sources that increase relative humidity
levels, such as boilers, wet clothes or shower steam. If
these conditions were included in the simulation,
condensation and humidity levels would certainly surpass
comfort standard, eventually causing material and
structural deterioration.
Figure 11. Analysis of CO2 concentrations and dew-point
temperature in a typical winter week.
Mon Tue Wed Thu Fri Sat
35
30
25
20
15
10
5
0
-5
-10
Te
mp
era
ture
(°C
)
600580560540520500480460440420400380360340
CO
2 c
on
ce
ntra
tion
(pp
m)
100
90
80
70
60
50
40
30
20
10
Pe
rce
nta
ge
(%
)
Date: Mon 12/Jul to Fri 16/Jul
Air temperature: 01comedor03 (utp3.aps) Air temperature: 02habitacion05 (utp3.aps)
Room CO2 concentration: 01comedor03 (utp3.aps) Room CO2 concentration: 02habitacion05 (utp3.aps)
Relative humidity: 01comedor03 (utp3.aps) Relative humidity: 02habitacion05 (utp3.aps)
Dew-point temperature: 01comedor03 (utp3.aps) Dew-point temperature: 02habitacion05 (utp3.aps)
Mon Tue Wed Thu Fri Sat
35
30
25
20
15
10
5
0
-5
-10
Tem
pera
ture
(°C
)
600580560540520500480460440420400380360340
CO
2 c
on
ce
ntra
tion (p
pm
)
100
90
80
70
60
50
40
30
20
10
Perc
enta
ge
(%
)
Date: Mon 12/Jul to Fri 16/Jul
Air temperature: 01comedor03 (utp3.aps) Air temperature: 02habitacion05 (utp3.aps)
Room CO2 concentration: 01comedor03 (utp3.aps) Room CO2 concentration: 02habitacion05 (utp3.aps)
Relative humidity: 01comedor03 (utp3.aps) Relative humidity: 02habitacion05 (utp3.aps)
Dew-point temperature: 01comedor03 (utp3.aps) Dew-point temperature: 02habitacion05 (utp3.aps)
PLEA2012 - 28th Conference, Opportunities, Limits & Needs Towards an environmentally responsible architecture Lima, Perú 7-9 November 2012
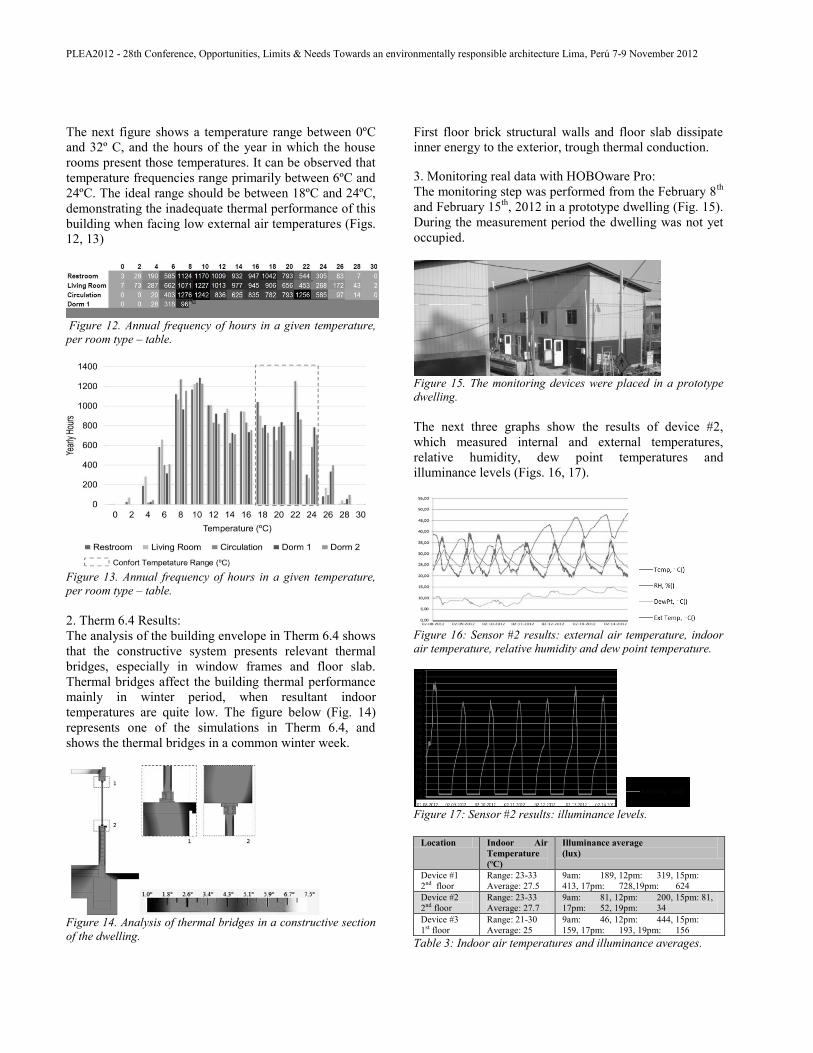
The next figure shows a temperature range between 0ºC
and 32º C, and the hours of the year in which the house
rooms present those temperatures. It can be observed that
temperature frequencies range primarily between 6ºC and
24ºC. The ideal range should be between 18ºC and 24ºC,
demonstrating the inadequate thermal performance of this
building when facing low external air temperatures (Figs.
12, 13)
Figure 12. Annual frequency of hours in a given temperature,
per room type – table.
Figure 13. Annual frequency of hours in a given temperature,
per room type – table.
2. Therm 6.4 Results:
The analysis of the building envelope in Therm 6.4 shows
that the constructive system presents relevant thermal
bridges, especially in window frames and floor slab.
Thermal bridges affect the building thermal performance
mainly in winter period, when resultant indoor
temperatures are quite low. The figure below (Fig. 14)
represents one of the simulations in Therm 6.4, and
shows the thermal bridges in a common winter week.
Figure 14. Analysis of thermal bridges in a constructive section
of the dwelling.
First floor brick structural walls and floor slab dissipate
inner energy to the exterior, trough thermal conduction.
3. Monitoring real data with HOBOware Pro:
The monitoring step was performed from the February 8th
and February 15th
, 2012 in a prototype dwelling (Fig. 15).
During the measurement period the dwelling was not yet
occupied.
Figure 15. The monitoring devices were placed in a prototype
dwelling.
The next three graphs show the results of device #2,
which measured internal and external temperatures,
relative humidity, dew point temperatures and
illuminance levels (Figs. 16, 17).
Figure 16: Sensor #2 results: external air temperature, indoor
air temperature, relative humidity and dew point temperature.
Figure 17: Sensor #2 results: illuminance levels.
Location Indoor Air
Temperature
(ºC)
Illuminance average
(lux)
Device #1
2nd floor
Range: 23-33
Average: 27.5
9am: 189, 12pm: 319, 15pm:
413, 17pm: 728,19pm: 624
Device #2
2nd floor
Range: 23-33
Average: 27.7
9am: 81, 12pm: 200, 15pm: 81,
17pm: 52, 19pm: 34
Device #3
1st floor
Range: 21-30
Average: 25
9am: 46, 12pm: 444, 15pm:
159, 17pm: 193, 19pm: 156
Table 3: Indoor air temperatures and illuminance averages.

PLEA2012 - 28th Conference, Opportunities, Limits & Needs Towards an environmentally responsible architecture Lima, Perú 7-9 November 2012
The table below resumes the results gotten from the
monitoring devices (Table 3). In all cases, relative
humidity and condensations levels are within acceptable
levels.
CONCLUSIONS AND RECCOMENDATIONS
These two methods of evaluation have led to different
results, yet lead to similar conclusions. Thermal behavior
of the house is not adequate for Santiago´s weather and it
gets critical during winter season. IES VE 6.4 results
show that the dwelling could take more advantage of
solar gains during winter. Also, it highlights possible
condensation problems during winter occupation. The
constructive systems are inefficient, making it difficult
for the house to conserve heat during winter. Therm 6.4
identifies the thermal bridges in the constructive systems,
emphasizing a better insulation, especially around
window frames and floor slab. HOBOware Pro summary
results present the thermal behavior without house
operation, highlighting the importance of windows
operation regarding ventilation issues. The following
table (Table 4) shows the points observed in the thermal
performance of the building, and some recommendations
to improve them:
Observation Possible recommendation measures
Improvement
of Envelope
Performance
1.- continuous insulation in all house perimeter taking into
consideration:
1.1.- Insulation on first level masonry walls.
1.2.- Insulation below slab. The layer must be thin in order to
keep thermal mass contribution in summer conditions.
2.- use of ventilated roof and facade to improve the thermal
performance in summer and avoid humidity in winter.
Reduction of
Heat Losses
through
Openings
3.- Reduce infiltration to avoid heat loss:
3.1.-Insulate the perimeter of windows and door frames
(example: polyurethane).
3.2.-Consider better sealants.
4.- Improve thermal performance of windows:
4.1.- Consider better thermal transmittance in glasses solutions
4.2.- Consider frames with less thermal bridges (example: PVC
frames)
5.- Consider the addition of louvers to protect from the excessive
solar heat gains.
Orientation
and planning
6.- Study orientation to avoid summer overheating and benefit
from winter radiation.
7.- Study orientation to benefit from natural light.
8.- Study forms to group the houses to achieve better compacity.
9.- Propose different solutions between corner houses and mid
paired houses, according to the exposure to outer conditions.
Operation
10.- Residents should be instructed on how to operate the house
correctly.
10.1.- Correct operation of windows can achieve appropriate
ventilation during summer.
10.2.- Instruct residents about the correct procedures regarding
house expansion or modifications, in order to maintain the
thermal behavior proposed.
Table 4: Recommendations regarding the improvement of the
thermal performance.
FOLLOWING DEVELOPMENT
The results and conclusions presented here are partial and
the research process will be continued by B-Green S.A.
and “Un Techo para Chile”. The next steps consist in
monitoring the prototype during winter period. A
thermography camera will be used to identify the thermal
bridges in the real construction. Furthermore, regarding
the occupancy issues of social housing, the second stage
of this investigation predicts the implementation of an
“occupancy manual”, emphasizing on how to accomplish
an adequate thermal behavior of the house by operating it
correctly. Third stage of this investigation aims to
evaluate different projects for different regions and
standardize constructive systems and design solutions
according to real zonal requirements, despite the local
Thermal Normative, which is highly insufficient.
Overall, the main objective of the next steps is verifying
how to implement the final recommendations of this
research. Also, it will be evaluated the ways to maintain
the comfort parameters established in the project stage,
establishing guidelines for the architects, construction
enterprises and occupants.
ACKNOWLEDGEMENTS
We would like to thank Dario Oyarzún, and Rodrigo
Araya Argomedo for providing information about Un
Techo para Chile and the housing complex Villa La
Esperanza. We also would like to thank all the
construction team in helping us to take care of all the
equipment during the measurement period. Finally, we
thank B-Green team, for all the internal support in
developing this research.
REFERENCES
1. Dattwyler, Rodrigo (1999). La vivienda social en
Chile: La acción del estado en un siglo de planes y
programas. Scripta Nova Revista Electrónica de
Geografía y Ciencias Sociales, 45 (1). Universidad de
Barcelona, Spain, August.
2. Un Techo Para Chile (2007). Memoria 2007; p. 7-8.
Santiago, Chile. [Online], Available: http://www.untecho
parachile.cl/documents/memoria2007.pdf [04 May 2012]
3. Integrated Environmental Solutions. [Online],
Available: http://www.iesve.com/ [04 May 2012]
4. Instituto nacional de normalización, INN Chile,(2007).
Thermal conditioning – Thermal Envelope of Buildings –
Thermal Resistance and Transmittance. NCH 85-2007,p.
24-27.
5. THERM 6.4, developed by Lawrence Berkeley
National Laboratory. [Online], Available: http://windows.
lbl.gov/software/therm/therm.html [04 May 2012]