Embed Size (px)
Citation preview

ANALYSIS OF ENERGY INPUTS FOR PEAT
AND PEATLAND BIOMASS DEVELOPMENT
Roger G Aiken
Gary H Heichel
Rouse S Farnham
Douglas C Pratt
Cletus E Schertz
Ronald T Schuler
Copies of this publication may be obtained from Communication ResourcesDistribution 3 Coffey Hall 1420 Eckles Ave University of Minnesota St Paul MN 55108
2
TABLE OF CONTENTS
ACKNOWLEDGMENTS bullbullbullbullbullbullbullbullbullbullbullbullbullbullbullbullbullbullbullbullbullbullbullbullbullbullbullbullbullbullbullbullbullbullbullbullbullbullbullbullbullbullbullbullbullbullbullbullbullbullbullbullbullbullbullbullbullbullbullbullbullbullbullbullbullbullbullbullbullbullbullbullbullbull 6
o SUMMAAY bullbullbullbullbullbullbullbullbullbullbullbullbullbullbullbullbullbullbullbullbullbullbullbullbullbullbullbullbullbullbullbullbullbullbullbullbullbullbullbullbullbullbullbullbullbullbullbullbullbullbullbullbullbullbullbullbullbullbullbullbullbullbullbullbullbullbullbullbullbullbullbullbullbullbullbullbullbull 7
1 INTRODUCTION bullbullbullbullbullbullbullbullbullbullbullbullbullbullbullbullbullbullbullbullbullbullbullbullbullbullbullbullbullbullbullbullbullbullbullbullbullbullbullbullbullbullbullbullbullbullbullbullbullbullbullbullbullbullbullbullbullbullbullbullbullbullbullbullbullbullbullbullbullbullbullbullbull 9
la Overview of Previous Research bullbullbullbullbullbullbullbullbullbullbullbullbullbullbullbullbullbullbullbullbullbullbullbullbullbullbullbullbullbullbullbullbullbullbullbullbullbullbullbullbullbullbullbullbullbullbull 9
lb Obj ecti yes bullbullbullbullbullbullbullbullbullbullbullbullbullbullbullbullbullbullbullbullbullbullbullbullbullbullbullbullbullbullbullbullbullbullbullbullbullbullbullbullbullbullbullbullbullbullbullbullbullbullbullbullbullbullbullbull 10
lc Methods and Presentation Format bullbullbullbullbullbullbullbullbullbullbullbullbullbullbullbullbullbullbullbullbullbullbullbullbullbullbullbullbullbullbullbullbullbullbullbullbullbullbullbullbullbullbullbullbullbull 10
2 EXTENT AND ENERGY CONTENT OF PEAT AND BIOMASS RESOURCES 11
2a The Total Peat Resource 11
2b Reference Base for peat and Biomass Resources bullbullbullbullbullbullbullbullbullbullbullbullbullbullbullbullbullbullbullbullbullbullbullbullbullbullbullbullbullbullbullbullbullbullbull 11
3 CALCULATIONS FOR EXTRACTION OF MILLED PEAT bullbullbullbullbullbullbullbullbullbullbullbullbullbullbullbullbullbullbullbullbullbullbullbullbullbullbullbullbullbullbullbullbullbullbullbullbullbullbullbullbullbullbull 12
3a primary Land Drainage bullbullbullbullbullbullbullbullbullbullbullbullbullbullbullbullbullbullbullbullbullbullbullbullbullbullbullbullbullbullbullbullbullbullbullbullbullbullbullbullbullbullbullbullbullbullbullbullbullbullbullbullbullbullbullbullbullbull 12
3b Surface vegetation Clearance 13
3c Secondary Land Drainage bullbullbullbullbullbullbullbullbullbullbullbullbullbullbullbullbullbullbullbullbullbullbullbullbullbullbullbullbullbullbullbullbullbullbullbullbullbullbullbullbullbullbullbullbullbullbullbullbullbullbullbullbullbullbullbullbull 13
3d Initial Field Preparation 13
3e Milled Peat Harvest bullbullbullbullbullbullbullbullbullbullbullbullbullbullbullbullbullbullbullbullbullbullbullbullbullbullbullbullbullbullbullbullbullbullbullbullbullbullbullbullbullbullbullbullbullbullbullbullbullbullbullbullbullbullbullbullbullbullbullbull 13
3f Densification of Milled Peat bullbullbullbullbullbullbullbullbullbullbullbullbullbullbullbullbullbullbullbullbullbullbullbullbullbullbullbullbullbullbullbullbullbullbullbullbullbullbullbullbullbullbullbullbullbullbullbullbullbullbullbull 16
3g Transportation of Undensified Milled Peat 16
3h Transportation of Densified Milled Peat bullbullbullbullbullbullbullbullbullbullbullbullbullbullbullbullbullbullbullbullbullbullbullbullbullbullbullbullbullbullbullbullbullbullbull 17
3i Milled Peat Extraction Summary bullbullbullbullbullbullbullbullbullbullbullbullbullbullbullbullbullbullbullbullbullbullbullbullbullbullbullbullbullbullbullbullbullbullbullbullbullbullbullbullbullbullbullbullbullbullbullbull 17
4 CALCULATIONS FOR EXTRACTION OF SOD PEAT bullbullbullbullbullbullbullbullbullbullbullbullbullbullbullbullbullbullbullbullbullbullbullbullbullbullbullbullbullbullbullbullbullbullbullbullbullbullbullbullbullbullbullbullbullbullbull 18
4a Primary Land Drainage 18
4b surface Vegetation Clearance bullbullbullbullbullbullbullbullbullbullbullbullbullbullbullbullbullbullbullbullbullbullbullbullbullbullbullbullbullbullbullbullbullbullbullbullbullbullbullbullbullbullbullbullbullbullbullbullbull 18
4c Sod Peat Extraction and Extrusion bullbullbullbullbullbullbullbullbullbullbullbullbullbullbullbullbullbullbullbullbullbullbullbullbullbullbullbullbullbullbullbullbullbullbullbullbullbullbullbullbullbullbullbullbullbull 18
4d Field Drying of Sods 18
4e Collection of Dried Peat Sod bullbullbullbullbullbullbullbullbullbullbullbullbullbullbullbullbullbullbullbullbullbullbullbullbullbullbullbullbullbullbullbullbullbullbullbullbullbullbullbullbullbullbullbullbullbullbullbullbullbullbullbull 18
4f Sod Peat Transportation bullbullbullbullbullbullbullbullbullbullbullbullbullbullbullbullbullbullbullbullbullbullbullbullbullbullbullbullbullbullbullbullbullbullbullbullbullbullbullbullbullbullbullbullbullbullbullbullbullbullbullbullbullbullbull 19
49 Crushing and Coarse Grinding of Peat Sod bullbullbullbullbullbullbullbullbullbullbullbullbullbullbullbullbullbullbullbullbullbullbullbullbullbullbullbullbullbullbullbullbullbullbullbullbullbullbullbull 19
4h Sod Peat Extraction Summary bullbullbullbullbullbullbullbullbullbullbullbullbullbullbullbullbullbullbullbullbullbullbullbullbullbullbullbullbullbullbullbullbullbullbullbullbullbullbullbullbullbullbullbullbullbullbullbullbullbullbullbullbull 19
3
5 CALCULATIONS FOR HYDRAULIC PEAT EXTRACTION bullbullbullbullbullbullbullbullbullbullbullbullbullbullbullbullbullbullbullbullbullbullbullbullbullbullbullbullbullbullbullbullbullbullbullbullbullbullbullbullbullbullbull 20
5a preparation of a Reservoir for Wet Peat Removal bullbullbullbullbullbullbullbullbullbullbullbullbullbullbullbullbullbullbullbullbullbullbullbullbullbullbullbullbullbull 20
Sh The Hydraulic Extraction Process bullbullbullbullbullbullbullbullbullbullbullbullbullbullbullbullbullbullbullbullbullbullbullbullbullbullbullbullbullbullbullbullbullbullbullbullbullbullbullbullbullbullbullbullbullbull 21
5c Slurry pipeline bullbullbullbullbullbullbullbullbullbullbullbullbullbullbullbullbullbullbullbullbullbullbullbullbullbullbullbullbullbullbullbullbullbullbullbull 22
5d Mechanical Dewatering (Stages I and II) bullbullbullbullbullbullbullbullbullbullbullbullbullbullbullbullbullbullbullbullbullbullbullbullbullbullbullbullbullbullbullbullbullbullbullbullbullbull 22
5e Return Water Pipeline middot 23
5f Autoclave Heat Treatment bullbullbullbullbullbullbullbullbullbullbullbullbullbullbullbullbullbullbullbullbullbullbullbullbullbullbullbullbullbullbullbullbullbullbullbullbullbullbullbullbullbullbullbullbullbullbullbullbullbullbullbullbullbullbull 23
5f Autoclaving to 33SoF (35 H20) 25
5f2 Autoclaving to 2570 F (50 H20) 25
59 Mechanical Dewatering (Stage III) bullbullbullbullbullbullbullbullbullbullbullbullbullbullbullbullbullbullbullbullbullbullbullbullbullbullbullbullbullbullbullbullbullbullbullbullbullbullbullbullbullbullbullbullbullbull 26
Sh Hydraulic Peat Extraction Summary bullbullbullbullbullbullbullbullbullbullbullbullbullbullbullbullbullbullbullbullbullbullbullbullbullbullbullbullbullbullbullbullbullbullbullbullbullbullbullbullbullbullbullbullbullbull 26
6 WETLAND PRODUCTION AND HARVEST OF CATTAILS 27
6a Cattail Planting and Water Management 30
6b Nitrogen Fertilizer Manufacture bullbullbullbullbullbullbullbullbullbullbullbullbullbullbullbullbullbullbullbullbullbullbullbullbullbullbullbullbullbullbullbullbullbullbullbullbullbullbullbullbullbullbullbullbullbullbull 30
6c Phosphorus and Potassium Fertilizer Manufacture bullbullbullbullbullbullbullbullbullbullbullbullbullbullbullbullbullbullbullbullbullbullbullbullbullbullbullbullbullbullbullbullbull 31
6d Nitrogen Fertilizer Transport bullbullbullbullbullbullbullbullbullbullbullbullbullbullbullbullbullbullbullbullbullbullbullbullbullbullbullbullbullbullbullbullbullbullbullbullbullbullbullbullbullbullbullbullbullbullbullbullbull 31
6e phosphorus and potassium Fertilizer Transport bullbullbullbullbullbullbullbullbullbullbullbullbullbullbullbullbullbullbullbullbullbullbullbullbullbullbullbullbullbullbullbullbullbull 32
6pound Nitrogen Fertilizer Application bullbullbullbullbullbullbullbullbullbullbullbullbullbullbullbullbullbullbullbullbullbullbullbullbullbullbullbullbullbullbullbullbullbullbullbullbullbullbullbullbullbullbullbullbullbullbullbull 32
6g Phosphorus and Potassium Fertilizer Application bullbullbullbullbullbullbullbullbullbullbullbullbullbullbullbullbullbullbullbullbullbullbullbullbullbullbullbullbullbullbullbullbull 32
6h Cattail Photosynthesis 32
6i Leaf and Shoot Harvesting 32
6j Leaf and Shoot Drying middot 33
6k Leaf and Shoot Baling middot 33
61 Leaf and Shoot Transportation 33
6m Rhizome Harvesting bullbullbullbullbullbullbullbullbullbullbullbullbullbullbullbullbullbullbullbullbullbullbullbullbullbullbullbullbullbullbullbullbullbullbullbullbullbullbullbullbullbullbullbullbullbullbullbullbullbullbullbullbullbullbullbullbullbullbull 33
6n Root-Rhizome Drying 34
60 Collection of Dried Rhizomes 34
6p Chopping of Rhizomes bullbullbullbullbullbullbullbullbullbullbullbullbullbullbullbullbullbullbullbullbullbullbullbullbullbullbullbullbullbullbullbullbullbullbullbullbullbullbullbullbullbullbullbullbullbullbullbullbullbullbullbullbullbullbullbullbull 34
6q Rhizome Transportation 34
6r Transportation of Ash Residues or Sludge Back to Land bullbullbullbullbullbullbullbullbullbullbullbullbullbullbullbullbullbullbullbullbullbullbullbullbullbull 34
6s Cattail production Harvest and Transportation Summary bullbullbullbullbullbullbullbullbullbullbullbullbullbullbullbullbullbullbullbullbullbullbullbullbull 35
4
7 CONVERSION OF PEAT AND CATTAILS TO SYNTHETIC NATURAL GAS (SNG) 35
7a Peat and Cattails Available for Feedstock Energy bullbullbullbullbullbullbullbullbullbullbullbullbullbullbullbullbullbullbullbullbullbullbullbullbullbullbullbullbullbullbullbull 37
7b Synthetic Natural Gas Pumping Energy bullbullbullbullbullbullbullbullbullbullbullbullbullbullbullbullbullbullbullbullbullbullbullbullbullbullbullbullbullbullbullbullbullbullbullbullbullbullbullbullbullbullbullbull 37
8 NET ENERGY ANALYSES FOR CONVERSION TO SNG USING FOUR TYPES OF FEEDSTOCK bullbullbullbullbullbullbullbullbullbullbullbullbullbull 37
8a Net Energy Analysis Summary for the Densified Milled Peat shySNG Conversion Process bullbullbullbullbullbullbullbullbullbullbullbullbullbullbullbullbullbullbullbullbullbullbullbullbullbullbullbullbullbullbullbullbullbullbullbullbullbullbullbullbullbullbullbullbullbullbullbullbullbullbullbullbullbullbullbullbullbull 38
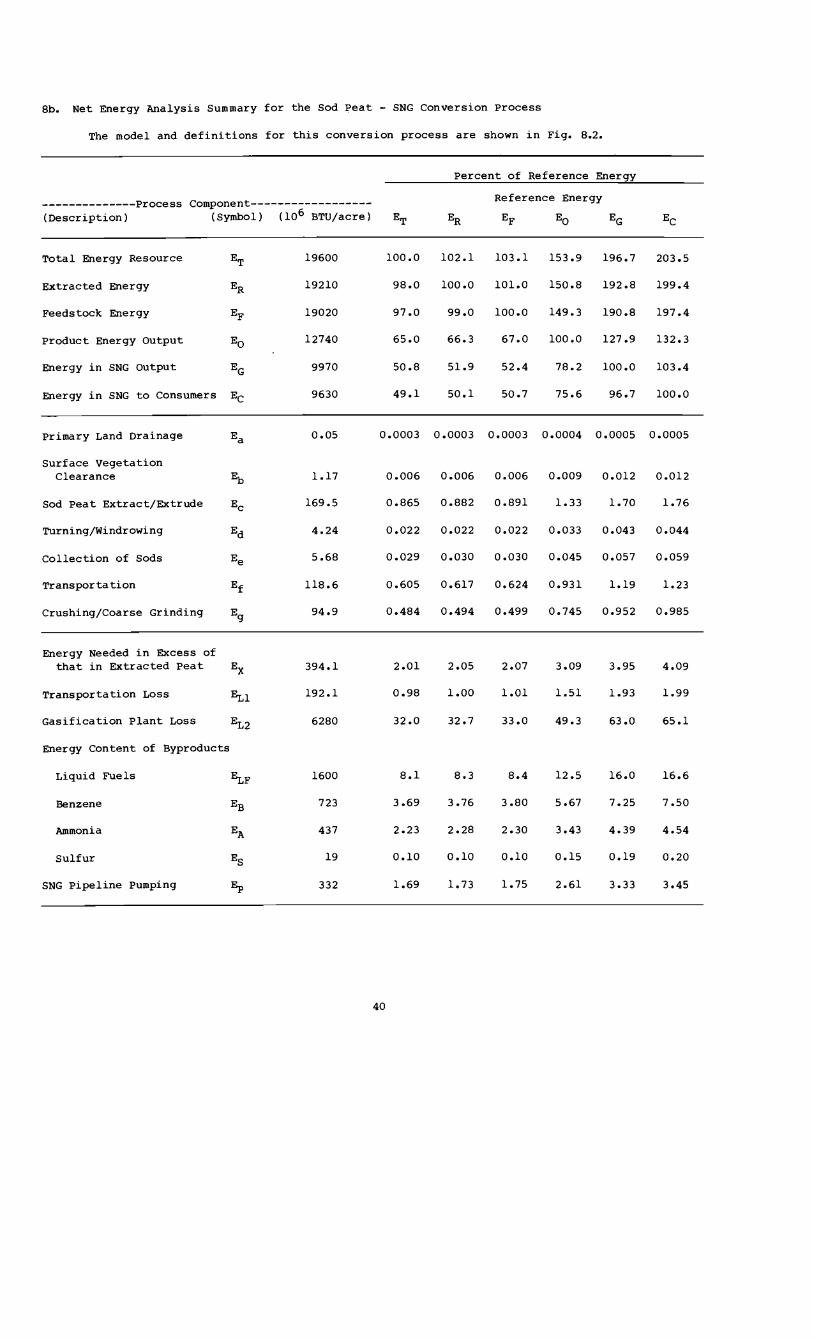
8b Net Energy Analysis Summary for the Sod Peat - SNG Conversion Process 40
8c Net Energy Analysis Summary for the Hydraulic Peat - Slurry Pipeline -Dewatering - SNG Conversion Process 42
8d Net Energy Analysis Summary for the Cattail Production - Harvest shySNG Conversion Process bullbullbullbullbullbullbullbullbullbullbullbullbullbullbullbullbullbullbullbullbullbullbullbullbullbullbullbullbullbullbullbullbullbullbullbullbullbullbullbullbullbullbullbullbullbullbullbullbullbullbullbullbullbullbullbullbullbull 44
9 CONVERSION TO ELECTRICITY ANDOR DISTRICT HEAT bullbullbullbullbullbullbullbullbullbullbullbullbullbullbullbullbullbullbullbullbullbullbullbullbullbullbullbullbullbullbullbullbullbullbullbullbullbullbull 49
9a Fine Grinding and Exhaust Fan bullbullbullbullbullbullbullbullbullbullbullbullbullbullbullbullbullbullbullbullbullbullbullbullbullbullbullbullbullbullbullbullbullbullbullbullbullbullbullbullbullbullbullbullbullbullbullbull 49
9b Electricity Generation without District Heating bullbullbullbullbullbullbullbullbullbullbullbullbullbullbullbullbullbullbullbullbullbullbullbullbullbullbullbullbullbullbullbullbull 53
ge Electrical Transmission bullbullbullbullbullbullbullbullbullbullbullbullbullbullbullbullbullbullbullbullbullbullbullbullbullbullbullbullbullbullbullbullbullbullbullbullbullbullbullbullbullbullbullbullbullbullbullbullbullbullbullbullbullbullbullbull 53
9d Electricity Generation with District Heating (Cogeneration) 53
ge District Heating Hot water Reticulation bullbullbullbullbullbullbullbullbullbullbullbullbullbullbullbullbullbullbullbullbullbullbullbullbullbullbullbullbullbullbullbullbullbullbullbullbullbullbull 54
9f District Heating - No Electrical Generation bullbullbullbullbullbullbullbullbullbullbullbullbullbullbullbullbullbullbullbullbullbullbullbullbullbullbullbullbullbullbullbullbullbullbullbullbull 55
9g Net Energy Analysis Summaries for Conversion of Peat and Cattail Feedstocks to Electricity andor District Heat bullbullbullbullbullbullbullbullbullbullbullbullbullbullbullbullbullbullbullbullbullbullbullbullbullbullbullbullbullbullbullbullbullbullbullbullbullbullbullbullbullbullbullbullbullbullbull 55
10 BRIQUETTING bullbullbullbullbullbullbullbullbullbullbullbullbullbullbullbullbullbullbullbullbullbullbullbullbullbullbullbullbullbullbullbullbullbullbullbullbullbullbullbullbullbullbullbullbullbullbullbullbullbullbullbullbullbullbullbullbullbullbullbullbullbullbullbullbullbullbullbullbullbullbullbull 59
lOa Evaporative Moisture Reduction 59
lOb Pressing into Briquettes bullbullbullbullbullbullbullbullbullbullbullbullbullbullbullbullbullbullbullbullbullbullbullbullbullbullbullbullbullbullbullbullbullbullbullbullbullbullbullbullbullbullbullbullbullbullbullbullbullbullbullbullbullbull 60
lOc Transportation of Briquettes to Consumers bullbullbullbullbullbullbullbullbullbullbullbullbullbullbullbullbullbullbullbullbullbullbullbullbullbullbullbullbullbullbullbullbullbullbullbullbull 60
lad Net Energy Analysis Summary for Conversion of Peat and Cattail Feedstocks to Briquettes bullbullbullbullbullbullbullbullbullbullbullbullbullbullbullbullbullbullbullbullbullbullbullbullbullbullbullbullbullbullbullbullbullbullbullbullbullbullbullbullbullbullbullbullbullbullbullbullbullbullbullbullbullbullbullbullbullbullbullbullbullbullbullbullbullbullbull 61
11 ESTIMATES OF PEAT RESOURCE LIFE bullbullbullbullbullbullbullbullbullbullbullbullbullbullbullbullbullbullbullbullbullbullbullbullbullbullbullbullbullbullbullbullbullbullbullbullbullbullbullbullbullbullbullbullbullbullbullbullbullbullbullbull 62
12 CONCLUSIONS bullbullbullbullbullbullbullbullbullbullbullbullbullbullbullbullbullbullbullbullbullbullbullbullbullbullbullbullbullbullbullbullbullbullbullbullbullbullbullbullbullbullbullbullbullbullbullbullbullbullbullbullbullbullbullbullbullbullbullbullbullbullbullbullbullbullbullbullbullbullbullbullbull 63
13 REFERENCES bullbullbullbullbullbullbullbullbullbullbullbullbullbullbullbullbullbullbullbullbullbullbullbullbullbullbullbullbullbullbullbullbullbullbullbullbullbullbullbullbullbullbullbullbullbullbullbullbullbullbullbullbullbullbullbullbullbullbullbullbullbullbullbullbullbullbullbullbullbullbullbull 63
5
ACKNOWLEDGMENTS
Assessment of a new source of energy is a task beyond the skill of a single individual with limited expertise Consequently this systems analysis of the energy needs for development of Minnesotas peat and peatland biomass production capabilities was an interdisciplinary research effort supported by the Minnesota Agricultural Experiment Station and the University of Minnesota Center for Urban and Regional Affairs (CURA) Roger G Aiken was a research fellow in the departshyment of mechanical engineering during this analysis with financial support from CURA This support is gratefully acknowledged Gary H Heichel US Dept of Agriculture-Agricultural Research Sershyvice and Department of Agronomy and Plant Genetics Rouse S Farnham Department of Soil Science Douglas C Pratt Department of Botany Cletus E Schertz and Ronald T Schuler Department of Agricultural Engineering contributed expertise in specific areas of peat extraction and processing and biomass (cattail) culture harvesting and processing The Minnesota Agricultural Experiment Station generously supported the publication of this research
We are grateful to numerous individuals for assistance to the authors Drs RK Crookston RV Morey EA Oelke and PJ Starr critically reviewed the manuscript T Anding T Peek and D Wilson of CORA provided counsel on interfacing this research with previous CURA efforts Debra Siegel (CURA) Julie Rinden (Agricultural Engineering) and Kay Welsch (Agronomy and Plant Genetics) typed the early drafts Gail Lotze (Agronomy and Plant Genetics) typed the final draft Kristen Kohn (College of Biological Sciences) executed much of the artwork Mary Hoff (Communication Resources) provided valuable editorial advice
Mention of commercial products or company names in this bulletin does not imply endorsement of individual firms or products The authors alone are responsible for errors or omissions in the text
6
O SUMMARY
This is the first energy systems analysis of Minnesotas peat and peatland biomass (cattail) potential The results are preliminary because of the numerous assumptions that were necessary to surmount the scarcity of data in many areas nevertheless a basic framework of knowledge was developed from which the following conclusions can be drawn
1 There are great differences in production and harvesting parameters energy productivity on a land area basis and life expectancy of resource for energy feedstocks produced by various extraction or harvesting methods (Table 01)
Table 01 A comparison of peat and biomass production and harvesting parameters for various feedstocks on a land area basis
----------------------Feedstock----------------------- shy
------------peata ___________ _ ----Cattail Biomass---shy
Hydraulic Milled Sod Leaves Characteristic Units Peat Peat Peat and Stems Whole plant
Equivalent depth harvested (ft) 50 0033 0083 per pass
Passes per year (no ) Ib 15c 12c 1 1
potential yield per acre ( T) l600d 160d 320d
per year
Harvestable energy per (l08 BTU) 192 128 320 075 210 acre per pass
Harvestable energy per (108 BTU) 192 192 384 075 210 acre per year
Time to exhaust resource (yr) 1 10 5 renewable renewable
Area to potentially yield (acres) 1 10 5 256 914 192 x 1010 BTUyr
Energy for production (t of potential 12-15 13-22 205 4-12 38-107 harvest and transport energy in
feedstock)
potential yield lost in () 20 4 1 12 23 harvest and transport
aAssume extractable peat = 5 ft bcomplete resource extracted in one pass CActual number of passes in anyone year will depend on climatic conditions for that year dAt 15 Ibft3 and 35 H20 e Oven dry basis These numbers are the amounts available for harvesting the actual yield will be smaller due to harvesting losses
2 The energy remaining in a feedstock or a fuel at a specific stage of processing varies with the method of extraction (peat) or with the cultural procedure (cattails) Comparisons of the net energy efficiencies of various feedstocks for producing various end-use fuels are summarized in Table 02
7
Table 02 Net energy analysis comparison of end use fuels for different feedstock types
Net Energy Efficiencya
Feedstock with Extraction (peat) or Cultural (Cattail) Procedure
Feedstock or Fuel Hydraulic Peat
(50 H2O)
Densified Milled Peat
(50 H2O) Sod Peat
(35 H2O) Cattail Biomass High N Low N
Feedstock as delivered to conversion plant
691 948 970 695 742
Gasification plant synthetic natural gas + byproducts
463 635 650 457 489
Synthetic natural gas consumers
to 350 480 491 358 382
Electrici ty to consumers 165 218 242 165 176
Cogeneration (elect + hot H2O) to consumers
397 527 583 399 426
District heat only (hot H2O) to consumers
407 534 589 409 436
Briquettes delivered consumers
to 591 781 854 606 645
aEnergy content in fuel product as a percentage of the potential energy in the resource plus all other (non-solar) energy requirements of extraction or culture
3 Minnesotas peat resource has an estimated life of 40 to 75 years if it is developed to provide 100 of the states total natural gas requirements (about 31 x 1014 BTUyr-l )
4 Hydraulic peat extraction required 5 to 10 times more energy input than either sod or milled peat processes for three reasons First up to 20 of the peat processed by hydraulic methods may be lost as colloids during dewatering Second pumping the peat-water slurry consumes large amounts of energy Finally dewatering consumes large amounts of fossil or peat fuel in contrast to dewatering of sod or milled peat which utilizes sunshine
5 Hydraulic peat extraction requires a ratio of 50 parts water to 1 part dry peat to produce a slurry that can be transported by pipeline More viscous slurries are not easily utilized Availability of water may limit the use of hydraulic peat processing
6 Major biomass losses will occur at harvest The design of wetland biomass harvesting equipment is in its infancy and is an important area for further research
7 water management practices necessary for cattail production in natural stands or on land previously used as a source of peat are poorly understood More information is needed on water management practices that are compatible with the implements used for planting fertilization and harvest of cattails for biomass
8 Methods of propagating cattails are poorly developed Further research is needed to determine whether rhizome residue after harvest will be sufficient for reestablishment of the crop or whether other planting methods must be used
8
9 Dewatering is the most energy-intensive step in the delivery of peat or biomass feedstock to a central conversion facility Methods to effectively use solar energy to dry peat and biomass must be developed
10 Transportation is the second most energy-intensive step in processing peat for energy Locashytion of the conversion facility near the peatland resource would reduce this component
11 Nitrogen fertilization is the second most energy-intensive step in cattail production on peatshyland The optimum method of nitrogen fertilizer application and the optimum rate of applicashytion are unknown The potential for nitrogen losses from wetlands and the role of biological nitrogen fixation in meeting biomass crop needs are also unknown Nitrogen cycling and manageshyment are important research areas for biomass crop production
12 The annual biomass productivity from cattails that can be maintained on a continual basis is unknown because of poor understanding of propagation methods harvesting methods nutrient fertilization requirements and water requirements for season-long flooding of cattail fields
1 INTRODUCTION
lao Overview of previous Research
Minnesota lacks traditional fossil energy resources such as oil and natural gas but has relatively abundant alternative energy resources of undetermined potential such as peat and wetland soils suitable for growth of biomass crops (23) The Minnesota Agricultural Experiment Station has long conducted peatland research because of the size of the resource and the challenges involved in its development Research on peatlands has included characterization and classification of peat soils and the potentials for their utilization (10 11 13) Some of the earliest research (2) was on the agricultural value and reclamation potential of peatlands Comprehensive criteria for classhysification of peat soils were developed in Minnesota (13) and have been widely adopted for organic soils classification by the USDA Soil Conservation Service (36)
Several partial inventories of Minnesota peatlands have been undertaken during the past 20 years (9 14 15 16) The only complete inventory of Minnesota peatlands and wet mineral soils was published as the Minnesota Soil Atlas Project (eg 8) The most recent evaluation (11) of uses of Minnesota peatlands found that 7 were used for agriculture and the balance were undeveloped Environmental impacts reclamation options socioeconomic considerations and policy recommendations associated with peatland utilization have been developed by the Minnesota Department of Natural Resources (DNR) Division of Minerals (23)
Baseline soils data from the Minnesota Soil Atlas Project were incorporated into the Minneshysota Land Management Information System by the State Planning Agency The University of Minnesota Center for Urban and Regional Affairs (CURA) drew upon this data base to conclude that about 8 million acres of wetlands in Minnesota were potentially useful for bioenergy production and the mining of peat for energy (26) CURA also discussed additional options for peatland use and policy implications of the various alternatives The Minnesota Energy Agency (MEA) now the Department of Energy Planning and Development has suggested a rather optimistic future for development of peatshylands as an energy resource because of the states continued dependence upon expensive imported fossil fuels Investments in peat and biomass energy crops might stimulate economic development within the state and lessen its dependence upon traditional fuel sources (24)
In contrast to conventional fossil fuels and food and fiber crops there is a scarcity of knowledge about the quantities of fossil energy resources (oil gas coal) required to produce energy from peat or to produce biomass crops on peatland soils The economic feasibility of proshyducing energy from peat or growing biomass crops on peatlands also is unknown Both energy and economic analyses are required before Minnesota citizens can benefit from the potentials of peatshylands as alternate sources of energy This report addresses only the energy needs of peatland development
9
Development of peatlands for energy and for biomass production has many important similari shyties to the contemporary use of Minnesota farmland for food and fiber production Peat (a plant product) must be extracted processed and transported to a site of utilization Wetland biomass crops must be established nourished harvested processed and transported to a site of utilizashytion Thus this energy analysis of peatland energy and biomass production is built upon principles developed for analyses of energy requirements of U~ agricultural production systems (19 20 21 28) The results address needs for information identified by MEA and CURA The analyses also reveal specific research needs that must be addressed to permit further advances in peatland develshyopment and biomass production
lb Objectives
Peatlands can provide fuel on a non-renewable or renewable basis In the first instance peat is extracted until the recoverable resource is exhausted In the second case peatland soils are used to grow a biomass crop Although the fuels that are produced may be similar in both methods the feedstocks clearly differ The methods of processing the feedstocks to produce the fuels also differ leading to several alternative technologies for extracting and processing peat and biomass to usable fuels This research is an analysis of the energy and research needs for peatland energy development and biomass production on peatlands to
1 Determine the energy inputs for peat extraction by milled sod and hydraulic methods and for transport drying or dewatering before use as a nonrenewable energy feedstock
2 Determine the energy inputs for the establishment production harvesting and transport of cattail biomass on peatlands for use as a renewable energy feedstock
3 Determine the energy inputs for conversion of peat or biomass feedstocks by the following processes conversion to synthetic natural gas direct burning for district heat direct burning for generation of electricity with or without district heat and briquetting for domestic heat
4 Determine the magnitude of the peat energy resource using current estimates of developshyable peatland and
5 Determine the expected lifetime of the peat energy resource based upon current rates of Minnesota energy consumption
lc Methods and Presentation Format
The techniques of energy modeling and net energy analysis based on the first law of thermodyshynamics were used in this research Figures 31 and 61 model the overall energy flows from source to consumer of peat and wetland biomass (cattails) respectively Each figure is divided into two parts a productionharvestingtransportation (PHT) section and a conversion section Each PHT option conceivably could be matched to any conversion method leading to a very large number of possible combinations for energy production Only a limited number were chosen for this analysis
In the case of peat (Figure 31) three extraction methods milled peat (undensified and densified) sod peat and hydraulic peat (Sections 3 4 and 5 respectively) were analyzed For hydraulic peat two different water contents were analyzed 50 (massmass hereafter mm) H20 which is adequate for gasification and 35 (mm) H20 which is about the maximum for efficient conversion by combustion One harvesting method was analyzed for cattail biomass (Figure 61) Aerial leaves and shoots and underground roots and rhizomes were removed in separate successive operations analyzed in Section 6
In Sections 7 through 10 we considered biomass and peat simultaneously as a feedstock for conversion to synthetic natural gas to electricity and district heat and to briquettes for domesshytic heat However it is difficult to make direct comparisons between biomass and peat for energy since their chemical composition H20 content and heating (calorific value) are different Section 11 provides some resource life calculations for peat
Each subsection is labeled with a number and a letter These number and letter labels are found beside the boxes on the flow diagrams and the lower case letters are also used as energy subscripts (eg Ee) on the net energy analysis summaries of Section 8 Each subsection was calculated separately from first principles to enhance the reliability of the results All assumpshy
10
tions have been carefully described and coded with numbers for evaluation and later modification The English foot-pound-second system of units has been used throughout with results given in BTUacre for peat and BTUacremiddotyear for biomass The corresponding meter kilogram Joules per hectare (Jha) and Jhamiddotyear are in parentheses
2 bull EXTENT AND ENERGY CONTENT OF PEAT AND BIOMASS RESOURCES
2a The Total Peat Resource
Assumption 21 There are 59 million acres of peatlands in Minnesota (26) but economic and environmental factors limit peatland availability for energy developshyment to 25 million acres (24)
Assumption 22 The average peat depth is 7 feet However only 5 feet can be extracted and removed without environmental damage or loss of reclamation potential
Assumption 23 Two percent of the peat volume will be lost during ditching and land preparation (12)
Assumption 24 The higher heating value (HHV) of peat is 6000 BTUlb at 35 (mm) H20 and 15 lbft3 specific weight (25)
Assumption 25 The absolute weight per unit volume of oven dry peat is the same as in situ (~ 85 H20 and 624 lbft3) peat
Usable volume per acre ~ (5280)2 ft2mile 2 x 1 mile 2640 acre x 5 ft x 098 ft3acre (149 x 104 m3ha)
Usable weight per acre 213 x 105 ft 3acre x 15 Ibft3 320 x 106 lbacre (359 x 106
kghal bull
Source energy per acre 320 x 106 Ibacre x 6000 BTUlb 192 x 1010 BTUacre (501 x 1013
Jha) bull
Total potentially usable resource available in Minnesota 192 x 1010 BTUacre x 25 x 106
acre 480 x 1016 BTU (507 x 1019 J)
2b Reference Base for Peat and Biomass Resources
To permit comparison of energy intensities and productivities among harvesting and conversion processes and between the peat and biomass resources after conversion to similar end-use fuels a reference base was established
The peat reference base [ER(peat)] is the energy available per acre (hectare) From Section 2a ER (peat) = 192 x 1010 BTUacre (501 x 1013 Jha)
Cattails were the biomass reference source From data collected by Pratt (29) and Pratt et al (30) a total plant (leaves stems rhizomes and roots) dry matter yield of 15 Tacreyr (336 metric Thayr) was assumed Forty percent of this yield (6 Tacreyr) was assumed to be above ground (stems and leaves) and 60 (9 Tacremiddotyr) below ground (roots and rhizomes) To ensure regeneration the following season about 10 (ie ~l Tacreyr) of the below-ground dry matter was assumed to be needed either for rhizome replanting in the spring or as rhizome residue in the soil at fall harvest The net dry matter yield available for energy ~ 140 Tacremiddotyr (314 metric Thamiddotyr) bull
The energy content of terrestial plants varies with species Bjork and Graneli (6) quoted 5 kWhkg (7743 BTUlb) as an average for all terrestial plants Moss (25) quoted a range of 6120-7290 BTUlb for herbaceous plants 8280-8820 BTUlb for woody plants and 15 x 106 BTUT ( 7500 BTUlb) for oven dry cattail biomass We used this latter figure and assumed it represented the calorific
11
value or HHV of the below ground (roots and rhizomes) and above ground (leaves and stems) oven dry biomass We assumed that the energy content of cattail biomass under steady-state managed condishytions = 140 Tacremiddotyr x 2000 lbT x 7500 BTUlb Therefore the biomass reference base ~ (bioshymass) 210 x 108 BTuacreyr (548 x 1011 Jhayr) The ratio shows that the peat reference base is equivalent to about 915 years of potential cattail biomass production for an equivalent land area Alternately 1 acre (hectare) of peat with 5 feet of recoverable depth is equivalent on an energy resource basis to about 915 acres (hectares) of managed cattail biomass available for harvest in 1 year
3 CALCULATIONS FOR EXTRACTION OF MILLED PEAT
Figure 31 is the flow diagram for the energy analyses of peat extraction (Sections 3 4 and 5) and conversion to synthetic natural gas (Sections 7 and 8) electricity andor district heat (Section 9) and briquettes (Section 10) Milled peat extraction involves primary and secondary land drainage surface vegetation clearance field preparation harvest and transportation in a densishyfied or undensified state In the following sections the energy requirements of each step exshypressed as a percent of the reference base ~ will be calculated
3a Primary Land Drainage
Assumption 31 The cross-sectional area of ditch required for peatland drainage is 2106 in2 (Fig 32)
1----60-----j
Figure 32 Dimensions of drainage ditch
Assumption 32 The unit draft or cutting force required for the ditching implement is 6 lbin2 bull
Assumption 33 The cutting speed = 10 mph = 147 ftsec
Assumption 34 The traction efficiency during ditching = 50 Therefore the brake horseshypower (BHP) required by the ditching implement = 6 lbin2 x 2106 in2 x 147 ftsec x 1 hp550 ft Ibsec x 105 = 674 hp
Assumption 35 The ditch spacing for primary land drainage = 120 ft Therefore the time needed to ditch 1 acre = 43560 ft2acre x 1120 ft x 1 secl47 ft = 247 secacre The work expended per acre = 674 hp x 247 secacre x 1 hr3600 sec = 463 hphracre
Assumption 36 The fuel conversion efficiency of the ditch digger 12 hpmiddothrgal of diesel fuel
Assumption 37 The energy content of No 2 diesel fuel 14 x 105 BTUgal
From the foregoing the fractional conversion efficiency of the ditchdigger = 12 hphrgal x 2547 BTUhphr x 1 gall4 x 105 BTU = 0218 A diesel engine has an optimum efficiency of about 25 to 30 However considerable time is spent in starting idling and operating at partial load The figure of 218 efficiency thus appears to be valid
12
The fuel needed for land drainage (Ea) = 463 hphracre x 10218 x 2547 BTUhpmiddothr = 541 x 104 BTUacre (141 x 108 Jha) or 0386 gal diesel fuelacre This is (541 x 104192 x 1010 ) 100 = 000028 of ERbull
3b Surface Vegetation Clearance
Assumption 38 A D9 Caterpillar bulldozer or equivalent with 200 BHP will be used
Assumption 39 The rate of vegetation clearance = 2 acrehr The work expended = 200 hp x 1 hr2 acre x 2547 BTUhphr = 255 x 105 BTUacre The fuel energy needed for surface vegetation clearance (Eb) at a fuel conversion efficiency of 218 = 117 x 106 BTUacre (305 x 109 Jha) This is (117 x 106192 x 1010 ) 100 = 000608 of ERbull
3c Secondary Land Drainage
ASSUmption 310 The interditch spacing is halved to 60 feet
Assumption 311 The ditch cross section is identical to that in assumption 31 Therefore fuel energy needed for secondary land drainage (Ec) = 541 x 104 BTUacre (141 x 108 Jha) or 000028 of ERbull
3d Initial Field Preparation
Field preparation entails leveling cambering and loosening the surface of the exposed peat
Assumption 312 Fields are prepared with a 60 BHP machine at 6 acrehr
Assumption 313 Three separate operations or passes of the above machine are needed for initial field preparation
The total work expended in three operations = 60 hp x 1 hr6 acre x 3 x 2547 BTUhphr = 764 x 104 BTUacre Since the fuel conversion efficiency is 218 the fuel energy needed for initial field preparation (Ed) = 351 x 105 BTUacre (914 x 108 Jha) This is 000182 of ERbull
3e Milled Peat Harvest
There are two operations in the harvesting of milled peat
i) Fluffing The surface centimeter of the peat is scarified and loosened for air drying
ii) Vacuum Harvesting After the fluffed peat has dried sufficiently it is harvested by a machine much like a large vacuum cleaner
Assumption 314 The fluffing operation requires energy equivalent to that of a single pass of the machine described in 3d or 117 x 105 BTUacre
Assumption 315 The vacuum harvester requires 60 BHP to vacuum a 2 m wide strip at 5 mph The work expended for a single pass = 60 hp x 43560 ft2acre x 12m x Im3281 ft x 1 hr5 miles x 1 mile5280 ft 151 hphracre = 384 x 104 BTUacre The fuel energy needed per pass at 218 conversion efficiency 176 x 105 BTUacre Thus the total fuel energy per pass for milled peat harvesting (fluffing + vacuuming) = 293 x 105 BTUacre
Assumption 316 Each fluffing and vacuuming process removes 1 cm of peat from the profile The number of harvest cycles possible over the life of the 5 feet of extractable depth 5 x 12 x 254 = 152
The fuel energy needed for milled peat harvesting over the life of the extractable peat resource (Ee) 293 x 105 x 152 = 446 x 107 BTUacre (116 x lOll Jha) This is 0232 of ERbull
13
PRODUCTION-HARVESTING-TRANSPORTATION MILLED PEAT EXTRACTION -7
G) MILLEDSECONDARY ~ FIELD
DRAINAGE ~ PREPARA1ION
SOD PEAT EXTRACTION
reg reg SOD PEAT Jd~b~G
L-8-5--H-2~Oj EXTRACT ~ TLIRNING EXTRUDE 75 WINDROWING
H20
MAKE UP
PUMP
reg
PREPARA- HYDRAULIC TION OF PEAT JSLURRY 1 _
L---_~ ~Eyen~l~TR 4 EXTRt~JION ) L PIPELINE 1---- REMOVAL PROCESSING
92H0 974 H20
reg _ RETURN
~------E_~-~ WATERPIPEUNE ~--~
Figure 31 Flow diagram for the energy analysis
~
bullbullbulle)
3510 H20
HCIsT
35H20
COLLECTION ~ TRANSshyOF
SODS
--1 WATE R f----- HYDRAULIC ( WET PEAT) EXTRACTION --7
t5d ~ ~ 75yen r---~-J)--- r-M-E-C-H-A-N-IC-A-L~ r7 AU~~i~~VE ~
DEWATERING ~ FURNACE S~E~~S r--~
(if)50 ~~----
H20 DENSIshy-t) FICATION ~- f~5--- I II-----==-= I~ TRANS- 50 ~Oreg ~ PORTATION --- -- shy
reg ~ PORTATION -i
bull
CRUSHING COARSE 35 H20 GRINDING ~-~
rs9~ DJlt~~R 35 H2
0 ~ STAGEm 1
STAGEI+lI _______
( lSO DEWATER ~~-r~-
~ AUTOCLAVE ~ PRESS ~ -I- H20 2570 F STAGEm
CFURNA E
~~----------~~ ~~------------~(
of peat extraction by milled peat sod peat or hydraulic peat processes and conversion to various end-use fuels
The dashed line is the energy flow path for utilization of 50 H20 peat and the dotted line is that for utilization of 35 H20 peat
14
CONVERSION ltsect) ltsectV ELECshy
TRICAL GENERAshy
TION NO DH
9d ELECshy
TRICAL GENERAshy
TION WITH DH
- - ------ - - - - -- - - - -- -reg- ~I~ 1G__II~_~_IN_G- ) DISTRICTI lt1Q) HEATING
I NO ELECshyI TRICALI GENERAshyI I TION I i)I I BRIQUEshy TRANSshyI TYINGbullbullbullbullbullbullbullbullbullbullbullbullbullbullbullbullbullbull- - --ltXgt-4I~t-t
FURNACE
GASIF -ICATlON
FOR SNG
TANKERI LIQUEshy- ----- - --------------reg--- I FACTION r--+---1__ shy
FOR TRUCK1ca1l~E t------~ R9fL
PORTATION I---~
SNG PIPE
PIPE ANDOR 1---iIoI
15
3f oensification of Milled Peat
Assumption 317 Vacuumed milled peat contains 50 H20 (mm)
Assumption 318 About 2 of the usable peat will be lost as dust during harvesting and a further 2 will be lost during the loading and transportation processes (26) The weight of peat recoverable for densification = 320 x 106 x 098 = 314 x 106 Ibacre at 35 H20 (mm) At 50 H20 (mm) the quantity of peat recoverable for densification 314 x 106 x (l - 035)(1 - 050)] = 408 x 106 Ibacre
Assumption 319 The air-dried 50 H20 milled peat will be densified by baling at a comshypaction ratio of about three
Assumption 320 The specific weight of undensified peat = 625 Ibft3 at 50 H20 The specific weight of the densified peat 1875 Ibft3 at 50 H20
Assumption 321 Energy required for baling or densification = 2 hpmiddothrT (3)
The fuel energy re6uired for densification (Ef ) at 218 conversion efficiency 2 h1middothrT x 1 T2000 Ib x 408 x 10 Ibacre x 2547 BTU0218 hphr 477 x 10 7 BTUacre (124 x 10 1
Jha) This is 0248 of ERbull
3g Transportation of Undensified Milled Peat
Assumption 322 The characteristics of the trucks used for transporting peat are empty weight = 27000 Ib (135 T) volume capacity 2700 ft3 maximum permitted gross load = 73000 Ib a limit set by the durability of side roads and maximum net load = 46000 lb Consequently the minimum specific weight bf peat corresponding to a capacity load = 460002700 1704 Ibft3bull
Assumption 323 There is a linear relationship between fuel consumption and net load as shown in Fig 33
E 025 - - - - - shy~020E=~~~-~=-=-=-~=-~-l -015 V) 010 - 01667 i5 005
O~__~~~______~____~~____~______~~~~ 3 4 53 6
LOAD (X 104 Ibs )
Figure 33 Fuel consumption as a function of net load
Assumption 324 The distance for peat transport = 30 miles
From Figure 33 fuel consumption = 025 galmile for a gross design load of 80000 Ib or 53000 Ib net load For an empty 27000 Ib truck the fuel consumption = 01667 galmile Fuel consumption C is given by C = 01667 + 1572 x 10-6 Lnet galmile where Lnet = net load (lb) Loads will be volume limited since the specific weight of undensified peat is 625 Ibft3bull The capacity load for undensified peat 625 Ibft3 x 2700 ft 3trip = 16900 Ibtrip and fuel consumpshytion C = 0193 galmile
16
The total fuel required for one round trip = 30 (0193 + 01667) = 108 gal The total transportation fuel required for undensified peat (Eg) = 408 x 106 Ibacre x 1 trip16900 Ib x 108 galtrip x 140000 BTUgal = 365 x 108 BTUacre (952 x lOll Jha) This is 1901 of ERbull
3h Transportation of Densified Milled Peat
The specific weight of densified peat from Assumption 320 = 1875 Ibft3 at 50 H20 The capacity load = 1875 x 2700 = 50600 Ibtrip This is greater than the maximum allowable load of 46000 lb Hence densified peatloads will be weight-limited at 46000 Ibtrip At a fuel conshysumption C = 0239 galmile the fuel for one round trip = 30 (0239 + 01667) = 122 gal The total transportation fuel required for densified peat (Eb) = 408 x 106 Ibacre x 1 trip46000 Ib x 122 galtrip x 140000 BTUgal Thus Eh 151 x 108 BTUacre (394 x lOll Jha) This is 0786 of ERbull
3i Milled Peat Extraction Summary
Table 31 summarizes the fuel requirements for each step in the harvesting of undensified and densified milled peat Note that no allowance has been made for the energy requirements of machinshyery manufacture maintenance and repair These energy requirements could be as large as 50 of the energy for operation (28)
Energy for transportation is the largest single item in the several harvesting steps Densishyfication before transportation provides a significant reduction in energy use for distances of 30 miles The break-even distance is - 7 miles
Table 31 Fuel energy inputs required for milled peat harvesting
Fuel Required of Source Process Step Symbol BTUacre Jha Energy (ER)
Primary land drainage 541 x 104 000028
Surface vegetation clearance Eb 305 x 109 000608
Secondary land drainage Ec 541 x 104 141 x 108 000028
Initial field preparation Ed 351 x 105 914 x 108 000182
Milled peat harvest Ee 446 x 107 116 x 1011 0232
oensification of milled peat Ef 477 x 107 124 x 1011 0248
Transportation - Undensified Eg 365 x 108 952 x 1011 1901
Transportation - Densified Eb 151 x 108 394 x 1011 0786
1012Total fuel - Undensified peat production- Ex 107 x 214 harvesting-transportation
Total fuel - oensified peat production- Ex 638 x 1011 127 harvesting-transportation
17
4 CALCULATIONS FOR EXTRACTION OF SOD PEAT
Sod peat extraction involves the same preliminary bog preparation used in milled peat producshytion After the surface is cleared sods are produced field-dried collected and transported and ground into a usable form The energy requirements of each step are calculated as a percent of the reference energy ER 4a Primary Land Drainage
See Section 3a The fuel energy needed (Ea) 541 x 104 BTUacre (141 x 108 Jha) which is 000028 of Ea
4b Surface vegetation Clearance
See Section 3b The fuel energy needed (Eb ) 117 x 106 BTUacre (305 x 109 Jha) which is 000608 of source energy
4c Sod Peat Extraction and Extrusion
Sod peat is harvested or extracted by a machine which slices and mixes peat from a cambered surface on the side of a ditch and then extrudes it as sods About 1 inch is ha~vested per pass
Assumption 41 The machine for sod peat extraction develops 60 BHP extrudes sod at a rate of 15 m3hr and operates at a fuel conversion efficiency = 218 Thereshyfore the fuel requirement of the machine = 60 hphr0218 hr x 2547 BTUhp hr = 701 x 105 BTUhr
Assumption 42 The extrusion process reduces the peat moisture content from 85 to 75 H20 (mm) bull
Assumption 43 The compaction ratio (CR) the ratio of the in situ to the extruded peat volume varies with amount of water extracte~by the proportionality [100 shy H20 (extruded peat)IOO - H20 (in situ peatraquo) = 53 Therefore the in situ peat extraction rate = 15 m3hr x 53 x 3531 ft3m3 = 883 ft 3hr From Section 2a the usable volume per acre = 213 x 105 ft 3 bull Therefore the total fuel energy required for extraction (Ec) = 213 x 105 ft 3acre x 1 hr883 ft3 x 701 x 105 BTUhr = 169 x 108 BTUacre (442 x lOll Jha) This is 0882 of ERbull
4d Field Drying of Sods
The extruded sods remain in the field for drying by the sun and wind They are occasionally turned to ensure uniform drying and then windrowed
Assumption 44 The sods can be field dried from 75 H20 down to 35 H20 (mm)
Assumption 45 There is no volume change in the extruded peat sods during air drying to 35 H20
Assumption 46 Turning and windrowing will be performed by a MERI Turner-Windrower powered by a 40 BHP tractor and capable of processing 250-400 m3hr of extruded peat We assume that 400 m3hr corresponds to the full tractor power
The time to process 1 acre of peat = 213 x 105 ft3acre x 35 x 1 m33531 ft3 x 1 hr400 m3
= 907 hracre Therefore the fuel energy needed for turning and windrowing (Ed) 40 hpmiddothr02l8 hr x 2547 BTUhphr x 907 hracre 424 x 106 BTUacre (110 x 1010 Jha) This is 00221 of ER 4e Collection of Dried Peat Sod
Assumption 47 A machine rated at 40kW (536 BHP) will be used to collect transport and load the dried sod into trucks We again assume that this power rating corresponds to a process rate of 400 m3hr
18
The fuel energy needed for collection and loading (Ed) = 536 hphr02l8 hr x 2547 BTUhphr x 907 hracre = 568 x 106 BTUacre (148 x 1010 Jha) This is 00296 of ERbull
4f Sod Peat Transportation
The specific weight of extruded peat at 35 H20 = 15 lbft3 x CR = 15 x 53 = 25 lbft3bull
AsSUmption 48 The truck characteristics are the same as those of Assumptions 322 to 324 At 250 lbft3 the sod peat loads will be weight limited at 46000 lbtrip
From Section 3h fuel requirement per trip = 122 gal Thus the total transportation fuel required (Efl 320 x 106 lbacre x 1 trip46000 lb x 122 galtrip x 140000 BTUgal = 119 x 108
BTUacre (309 x lOll Jha) This is 0617 of ERbull
4g Crushing and Coarse Grinding of Peat Sod
Conceivably the peat sod could be combusted on a stoker type grate for firing a boiler However most boiler furnaces use finely ground material which is blown into the furnace with a fan The resulting combustion is much more even and virtually complete As a first step towards use of sod peat in all conversion processes a crushing-coarse grinding step is needed
Assumption 49 The energy needed for crushing and coarse grinding is 5 kWhTo This is intermediate to that needed for the coarse chopping of cattail rhizomes 35 hphrsT (26 kWhT) and that needed for the fine grinding of peat for combustion or briquetting (10 kWhT) See Assumptions 632 and 91
Assumption 410 Transportation and handling losses equal 1 of the oven dry sod This leaves 320 x 106 x 099 = 317 x 106 lbacre of 35 H20 material for crushing and coarse grinding
Assumption 411 The electric motor efficiency = 95 for crushing and grinding
Assumption 412 The conversion efficiency from coal to electricity 30
The fuel energy (coal) needed for crushing and coarse grinding (Eg) 317 x 106 lbacre x 1 T2000 lb x 5 kWhT x 3413 BTUkWh x 1095 x 103 = 949 x 107 BTUacre (247 x lOll Jha) This is 0494 of ERbull
4h Sod Peat Extraction Summary
Table 41 summarizes the fuel requirements for each step in the harvesting of sod peat Note that the total diesel fuel use for harvesting and transportion of sod peat is between that for densified milled peat and undensified milled peat No allowance has been made for the energy requirements of machinery manufacture maintenance and repair
Energy for extraction and extrusion is the largest item in sod peat harvesting However energy for transportation and crushing and coarse grinding is also large The cumulative energy for extraction extrusion transportation and crushing and coarse grinding is more than 97 of the total fuel needed
No losses have been assumed during sod peat harvesting Any losses are negligible since extrusion requires a very damp raw material with good adhesion characteristics
A 1 loss of sod peat in transportation was assumed For the three harvesting procedures the transported peat as a percentage of total energy inputs is (a) sod peat 9910205 = 970 (b) densified milled peat 9610127 = 948 (c) undensified milled peat 9610214 = 940
19
Table 41 Fuel energy inputs required for sod peat harvesting
Diesel Fuel Required of Source
Process Step Symbol BTUacre Jha Energy (ER)
primary land drainage Ea 541 x 104 141 x 108 000028
Surface vegetation clearance ~ 117 x 106 305 x 109 000608
Extraction and extrusion Ec 169 x 108 442 x 1011 0882
1010Field drying of sods Ed 424 x 106 110 x 00221
106 1010Collection and loading of Ee 568 x 148 x 00296 dried peat sod
Transportation 119 x 108 309 x lOll 0617Ef
Crushingcoarse grindinga Eg 949 x 107 247 x 1011 0494
108 1012Total fuel - Sod peat harvesting Ex 394 x 103 x 205
afuel is coal
5 CALCULATIONS FOR HYDRAULIC PEAT EXTRACTION
Hydraulic peat extraction is a greatly different method than milled and sod peat extraction The peat is removed from an undrained bog and subsequently mixed with additional water from a reservoir for pipeline transport to a facility for dewatering The energy requirements of each step are calculated as a percent of the reference energy ~
Sa preparation of a Reservoir For Wet Peat Removal
Hydraulic peat extraction requires a source of water for addition to freshly removed wet peat to facilitate pumping through a pipeline to a utilization site A reservoir serves as the water source
ASSUmption 51 A 1 acre reservoir is required for every 1000 acres of peatland
Assumption 52 The reservoir will be excavated by removal of 5 acremiddotfeet of wet peat
Assumption 53 The specific weight of wet peat is 624 lbft3 bull
AsSUmption 54 Excavation of peat from the reservoir is equivalent feet to 20 feet above the initial site
to lifting the 5 acre
ASSUmption 55 The fuel to work conversion efficiency 218 is the same as in the sod and milled peat operations
The total mechanical work required to prepare a reservoir for 1000 acres == 43560 ft 2 x 5 ft x 624 lbft3 x 20 ft = 272 x 108 ftlb The mechanical work for 1 acre == 272 x 105 ftmiddotlb Therefore the fuel energy needed for reservoir preparation (Ea) = 272 x 105 ftmiddotlb02l8 acre x 1 BTU7783 ftlb = 160 x 103 BTUacre (418 x 106 Jha) This is 00000083 of ER and is clearly negligible
20
5b The Hydraulic Extraction Process
The peat is extracted by equipment on a raft floating in the reservoir Wet peat is removed by a clamshell at the end of a dragline excavator arm or by a cutter head operating at the end of a suction pipe The wet peat is lifted onto screens and filters to remove the large debris and its water content is increased to at least 97 (3 solids mm) for pumping through a slurry pipeline (7 31)
Assumption 56 The average water content of the peat-water mixture exiting the reservoir is 92 (mm) before addition of water necessary for pipeline transmission
Assumption 57 The average lift of the peat-water mixture is 15 feet
Assumption 58 The average lift plus pressure head of water used for washing and consti shytuting the slurry is 50 feet This is based upon 15 feet lift plus 35 feet head per 15 lbin2 pressure at the nozzles
Assumption 59 A slurry water content of 9725 ie a peat solids concentration (C) of 275 is required for pipeline transmission
Assumptiom 510 The mechanical efficiency of the pumps is 70
Assumption 511 The excavation rate per 8 hour day is 300 T oven dry peat
The mechanical work required to extract the 92 H20 peat = 2601 x 107 lbacre x 15 ft = 390 x 108 ftmiddotlbacre From Table 51 the weight of water for washing and increasing H20 content from 92 to 9725 (pipeline slurry consistency) = (7358 - 2393) x 106 Ibacre = 497 x 107 lbacre The pumping work required = 497 x 107 lbacre x 50 ft x 107 = 355 x 109 ftmiddotlbacre Therefore the total extraction plus pumping work = 394 x 109 ftmiddotlbacre The total extraction plus pumping power = 394 x 109 ftmiddotlbacre x 10-6 acre208 oven dry (OD) lb x 2000 lbT x 300 OD T8 hr x 1 hr3600 sec x 1 hpsec550 ftlb = 717 hp
Table 51 Water and peat solids requirements per acre to constitute wet peat and peat slurries with various water contents
Water Content ( mm)
Peat Solids Content ( mm)
(C) Water Requirement (106 Ibacre)
Total Weight (106 lbacre)
0 100 0 208a
35 65 112 320
50 50 208 416
75 25 624 832
85 15 1179 1387
92 8 2393 2601
955 45 4416 4624
9725 275 7358 7566
aoven dry
Assumption 512 All other work demands associated with the peat extraction such as manshyeuvering the raft turning the dragline controls etc consume 183 hp
21
The total power requirement of the extraction process is 90 hp It follows that the fuel energy for extraction (Eb ) ~ 90 BHP717 hp x 394 x 109 ftmiddotlbacre x 1 BTUj7783 ftmiddotlb x 10218 292 x 107 BTUacre (761 x 1010 Jha) This is 0152 of ERbull
5c Slurry Pipeline
This section was developed from material in references 6 30 and 37
Assumption 513 The slurry pipeline is 18 inches in diameter 3 miles long and operates with 75 pumping efficiency
Assumption 514 The slurry is continuously pumped from a holding tank on or near the floating raft
Assumption 515 The concentration-flow velocity relationships for our peat-water slurry are similar to those of vanasse et al (37) and are characteristic of young peat with a pronounced fibrous structure Old and strongly decomposed peat would probably behave much differently
Assumption 516 Because our pipe diameter (457 mm) is nearly lOx that used by Vanasse et al (37) the Reynolds number is also about lOx larger The resulting flow through the pipe is laminar (37) Our assumptions about flow characterisshytics appear to be justified because the rheological properties of a peat slurry with C = 275 conform to an annular model of flow in which a central peat core moves through a pipe surrounded by an annulus of clear water about 01 mm thick
Assumptions 515 and 516 are conservative and will give estimated pressure drops greater than will actually occur in practice
The pumping rate (Q) = 300 OD Tday x 100 (slurry) T275 OD T x 200 IbT x 1 ft3624 Ib x 1 day24 hr x 1 hr3600 sec = 405 ft 3 sec The average slurry velocity (V) = 405 ft3sec x 4TI ft2 x (1218)2 = 229 ftsec = 070 msec The pressure drop = 005 ft water per foot of pipe when V 07 msec and C = 275 (37) Therefore the pressure drop over the 3 mi pumping distance = 005 x 3 x 5280 = 792 ft H20
Assumption 517 There is a natural head of 108 feet over the 3 mile length of pipeline in addition to the head loss caused by the viscosity of the slurry
The total head differential (h) = 792 + 108 = 900 ft The pumping power needed = 405 ft3sec x 624 Ibft3 x 900 ft x 1075 x 1 hp550 ft Ibsec = 551 hp The fuel (diesel) energy for slurry pumping (Ec) = 550 (pump) hp90 (extract) hp x 24 (pump) hr8 (extract) hr x 292 x 107
BTUacre = 536 x 108 BTUacre (140 x 1012 Jha) This is 279 of ERbull
5d Mechanical Dewatering (Stages I and II)
Mechanical dewatering takes place in two stages The slurry is first passed over primary screens and filters which reduce the water content from 99 to about 965 (7) For a 9725 H20 slurry the primary screens reduce water content a little further The second stage uses an Ingershysoll-Rand TWin Roll Vari-Nip press which reduces water content to about 75
Assumption 518 The primary screens reduce the slurry from 9725 to 955 H20
Assumption 519 The energy consumption of the first stage primary screens and filters is negligible because they are gravity-fed
Assumption 520 The Ingersoll-Rand press operates continuously and requires 32 BHP (avershyage) from an electric motor
Assumption 521 The electric motor conversion efficiency is 95 and coal to electrical energy conversion efficiency is 30
Assumption 522 The loss of colloidal solids through the primary screens and filters is 20 of the total peat on an oven dry basis
22
Carncross (7) advised that as much as one third of the peat is lost as colloidal particles which pass through the primary screens and filters and return to the reservoir with the return water flow This figure is probably too high for the present case for two reasons First a 275 solids slurry is being pumped rather than a 1 to 15 solids slurry (7) Solid loss should be less with a more concentrated slurry Secondly colloids returned to the reservoir are likely to be picked up again with the makeup water resulting in a recycling of some of the same colloids pumped before Unrecycled colloids presumably will eventually settle out at the bottom of the reservoir and the excavated areas The colloidal loss takes place at the primary screens and filters Hence only 80 of the peat enters the mechanical presses
The fuel energy (coal for electric generation) for mechanical dewatering to 75 H~9 (Ed) = 3290 x 248 x 292 x 10 7 BTUacre x 021803 x 1095 = 238 x 10 7 BTUacre (621 x 10l1J Jha) This is 0124 of ERbull
5e Return water Pipeline
The processing of 300 T of 00 peatday in the slurry results in a return of 60 Tday of colshyloids A net 240 Tday of 00 peat reaches the presses and autoclaves The total weight of peat slurry pumped in the process (Table 51) = 300 x 7566208 10910 Tday After autoclaving and pressing to 50 H20 the total Weight of peat left = 240 x 416208 480 Tday The weight of water plus colloids returned 10910 - 480 = 10430 Tday Thus the solids concentration in the return water = 6010430 x 100 0575 After autoclaving and pressing to 35 H20 the total weight of peat left = 240 x 320208 = 370 Tday The weight of water plus colloids returned = 10910 shy370 = 10540 Tday Thus the solids concentration in return water 6010540 x 100 = 0569
Assumption 523 The characteristics of the return water pipeline are the same as those of the slurry pipeline in Assumption 513
Assumption 524 The return water is continuously pumped
Assumption 525 The effect of the colloidal solids suspended in the return water can be neglected
Thus the water viscosity (Il) = 273 x 10-5 Ibsecft2 at 50degF The pumping rate (Q) of the return volume of water = 10430 Tday x 2000 IbT x 1 ft 3624 Ib x 1 day86400 sec = 387 ft3sec The average return water velocity (V) = 387 ft) sec x 4Tf ft2 x (1218) 2 = 219 ftsec The Reynolds number Re = (VdwIlg) for this application 219 ftsec x 18 ft12 x 624 Ibft3 x 105 ft2273 lb sec x 1 sec23216 ft = 233 x 105 This value indicates a turbulent flow for which the friction factor (f) = 0017 (38) The head loss (h) = flV22 dg 0017 x 3 x 5280 ft x (219)2 ft2sec 2 x 12 x 1218 ft x 1 sec3216 ft = 134 ft
Assumption 526 There is an additional natural head difference of 166 feet for a total pumping head of 30 feet This requires a pumping power Qwhn 387 ft 3sec x 624 Ibft3 x 30 ft x 1075 x 1 hp550 ftlbsec = 176 hp
Assumption 527 The pump is driven by an electric motor with efficiency = 95 and coal to
electricity conversion efficiency 30
The fuel energy for return water pumping (E) = 17690 x 248 x 292 x 107 BTUacre x 021803 x 1095 = 131 x 10 7 BTUacre (341 x 10 0 Jha) This is 00680 of ERbull
Sf Autoclave Heat Treatment
At 75 H20 the peat is still too wet for combustion (ideal moisture content = 35 H20) or gasification ( -50 H20) The physical structure of the peat can be altered to release water more readily if it is autoclaved under pressure This process is similar to wet carbonization (22 33) except that we assume only physical (vs chemical) changes take place in the peat In wet carbonishyzation benefication of the carbon portion takes place at the expense of oxygen and nitrogen thus increasing the calorific value of the remaining solids Simple pressing after autoclaving to 1250 C (257degF) will reduce the peat to 50 H20 and to 25 H20 after autoclaving to 200degC (392oF) (30)
Assumption 528 The autoclaving temperatures corresponding to 35 H20 (for combustion) or 50 H20 (for gasification) are 170degC (338degF) and 1250 C (257oF) respecshytively
23
Assumption 529 The energy for autoclaving the water-peat mixture is given by the total change in enth~lpy between an assumed initial ambient temperature of 500 F and its final temperature of either 3380 F or 257oF We assume that there is no heat feedback or reutilization through heat exchangers
Assumption 530 The specific heat of oven dry peat is one-half that of water Because we are working with a 75-25 (mm) water-peat mixture the enthalpy values from steam tables should be multiplied by (10 x 075 + 05 x 025) = 0875
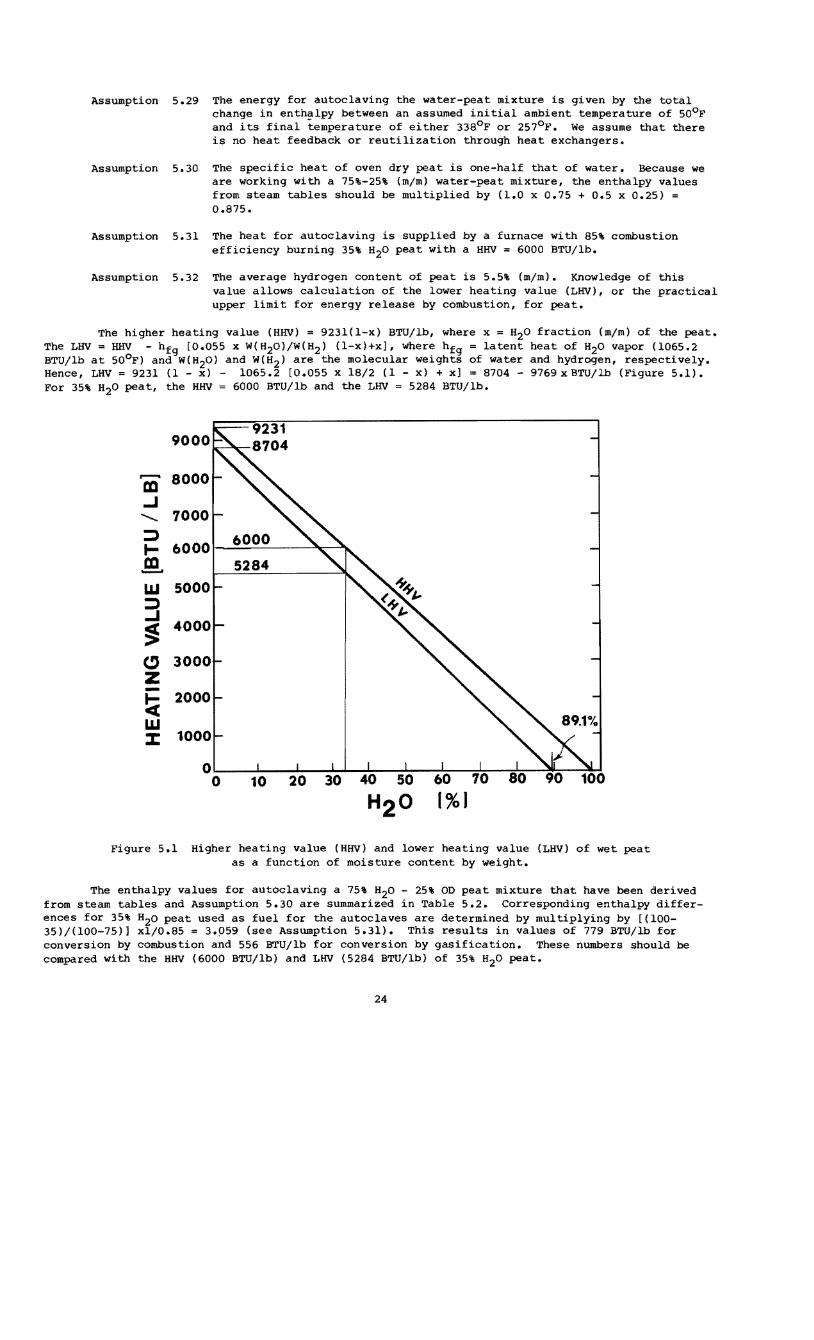
Assumption 531 The heat for autoclaving is supplied by a furnace with 85 combustion efficiency burning 35 H20 peat with a HHV = 6000 BTUlb
Assumption 532 The average hydrogen content of peat is 55 (mm) Knowledge of this value allows calculation of the lower heating value (LHV) or the practical upper limit for energy release by combustion for peat
The higher heating value (HHV) = 9231(1-x) BTUlb where x = H20 fraction (mm) of the peat The LHV = HHV - hfg [0055 x W(H20)W(H2 ) (l-xl+x] where = latent heat of H20 vapor (10652hfgBTUlb at 50oF) and W(H201 and W(H2 ) are the molecular weights of water and hydrogen respectively Hence LHV = 9231 (1 - xl - 10652 [0055 x 182 (1 - xl + x] = 8704 - 9769xBTUlb (Figure 51) For 35 H20 peat the HHV 6000 BTUlb and the LHV 5284 BTUlb
---
~
~
m ~
W ~ ~
~ 0Z ~ w
8000m 7000
6000 ~ 6000
5284
5000
4000
3000
2000
1000
0 0 10
Figure 51 Higher heating value (HHV) and lower heating value (LHV) of wet peat as a function of moisture content by weight
The enthalpy values for autoclaving a 75 H20 - 25 00 peat mixture that have been derived from steam tables and Assumption 530 are summarized in Table 52 Corresponding enthalpy differshyences for 35 H20 peat used as fuel for the autoclaves are determined by multiplying by [(100shy35)(100-75)] xl085 = 3959 (see Assumption 531) This results in values of 779 BTUlb for conversion by combustion and 556 BTUlb for conversion by gasification These numbers should be compared with the HHV (6000 BTUlb) and LHV (5284 BTUlb) of 35 H20 peat
24
Table 52 Enthalpy values for autoclaving a 75 H20 - 25 peat mixture before combustion or gasification
-----Conversion Process---shyUnits Combustion Gasification
Final H2O Content
Autoclave Temperature
Enthalpy of Water at 500 hfl
Enthalpy of Water at 2570 F hf2
Enthalpy of Water at 3380 F hf2
Enthalpy Difference for Water (hf2 -hfl )
Enthalpy Difference for 75 H20 Mixture [0875 (hf2-hfl raquo)
Fuel Energy Needed [per lb of 35 H20 peat)
degCoF
BTUlb
BTUlb
BTUlb
BTUlb
BTUlb
BTUlb
35 50
170338 125257
181 181
2257
3092
2911 2076
255 182
779 556
5fl Autoclaving to 3380 F (35 H20)
After autoclaving and pressing the peat has 35 H20 for use as fuel in the autoclave furshynace The energy flows in this operation are shown in Figure 52
68280ER 80 I PRESS1 (75 H2O) 35 H20
I 118
AUTOCLAVE 338degF
FURNACE
Figure 52 Percent ER flows for reduction of peat to 35 H20 with autoclave and press treatment
The energy needed to fuel the autoclave = 7795284 x 100 = 1474 of that in the peat fed into the autoclave However only 80 of ER gets to the autoclave with the rest lost as colloids Thus the energy needed for the autoclave furnace = 1180 of ER (Figure 52) The energy required
1012 per acre (Efl ) = 227 x 109 BTUacre (591 x Jha)
5f2 Autoclaving to 2570 F (50 H20)
The peat has 50 H20 after autoclaving and pressing Because this is too wet for efficient furnace firing a fraction X must be siphoned off for processing to 35 H20 for furnace firing as shown in Figure 53
25
AUTOCLAVE 80ER 80(1-X) r 257 OF h 80(1-X) J PR ESS I 712
75 H20) 712 FURNACE 712 (50 H20)
662X 75 AUTOCLAVE
80X 88
338degF
FURNACE
80X 88
I L1 PRESS J
88~o
(35 H2O)
I 118X =13
Figure 53 Percent ER flows for reduction of peat to 50 H20 with autoclave and press treatment
Figure 53 shows that 80X of ER is fed to the 3380 F autoclave of which 118X of ER becomes fuel for the 3380 F autoclave and the remaining 682X of ER fuel for the 2570 F autoclave From Table 52 556 BTUlb of 35 H20 peat is needed for the 2570 F autoclave Therefore the fuel energy
5565284 x 100 = 1052 of that fed to the 2570 autoclave Solving the equation 01052 x 80 (I-X) = 682X yields X = 01098 Thus the energy needed for the autoclave furnaces = 80X = (80)(01098)
1012= 88 of ER (Figure 53) The energy required per acre (Ef2 ) = 169 x 109 BTUacre (440 x Jha) bull
5g Mechanical Dewatering (Stage III)
Assumption 533 The final dewatering of the autoclaved peat is performed in an IngersollshyRand Twin Roll vari-Nip Press with the same characteristics as that used for the Stage II dewatering to 75 H20 (Assumptions 520 and 521) The total weight of 955 H20 peat fed to the presses in Stage II = (80 of 4624 x 106 Ibacre) and total weight of 75 H20 peat fed to the presses in Stage III is (80 of 832 x 106 Ibacre) This is an 82 reduction in weight
Assumption 534 The energy required to operate the presses for Stage III dewatering is only 020 that of stage II
From Section 5d and Assumption 534 the fuel energy needed for Stage III mechanical dewatershying to 50 or 35 H20 (Eg) = 238 x 107 x 020 BTUacre = 476 x 106 BTUacre (124 x 1010 Jha) This is 00248 of ERbull
5h Hydraulic Peat Extraction Summary
Table 53 summarizes the fuel requirements for each step in the hydraulic extraction of peat The energy needed for autoclaving is the largest and that for pumping the peat slurry through a pipeline the second largest The energy for autoclaving and slurry pipeline pumping together is 971 of the total fuel needs for hydraulic extraction of 50 H20 peat and 977 of the fuel needs for extracting 35 H20 peat No allowance has been made for the energy requirements of machinery manufacture maintenance and repair
No allowance has been made for the significant energy requirements of land reclamation Reclamation energy inputs following hydraulic peat extraction are likely to be substantially higher than those following sod or milled peat harvesting since hydraulic extraction results in uneven removal of peat from one area to the next so that leveling is required as the first step towards reclamation The energy requirements of reclamation will be partly affected by whether wetland biomass is produced on the reclaimed land if it is part of the reclamation energy could be discounted to the subsequent biomass production
26
For the hydraulic extraction of peat at two water contents the energy in the transported peat as a percentage of total energy inputs is
(a) Hydraulic Peat (50 H20) 712110316 690
(b) Hydraulic Peat (35 H20) 682010316 661
Table 53 Fuel energy inputs required for hydraulic peat extraction
of Source Process Step symbol Fuel Required Fuel Type Energy (ER)
03TUacre) (Jha)
Preparation of Reservoir 160 x 103 418 x 106 Diesel Negligible
1010Hydraulic Extraction Eb 292 x 107 761 x Diesel 0152
1012Slurry pipeline Pumping Ec 536 x 108 140 x Diesel 279
Mechanical Dewatering I Gravity Negligible
1010Mechanical Dewatering II Ed 238 x 107 621 x Coal 0124
1010Return Water Pumping Ee 131 x 107 341 x Coal 0068
109 1012Autoclaving to 3380 F (35) Efl 227 x 591 x Peat 1180
1012Autoclaving to 2570 F (50) Ef2 169 x 109 440 x Peat 879
Mechanical Dewatering III Eg 476 x 106 124 x 1010 Coal 00248
1012Total Fuel (Diesel) 565 x 108 147 x Diesel 294
1010TOtal Fuel (Coal) 417 x 106 109 x Coal 022
1012TOtal Fuel (Diesel + Coal) Ex 607 x 108 158 x 316
Total Fuel (35 H2O peat) Ex+Efl 288 x 109 749 x 1012 1495
109 1012TOtal Fuel (50 H2O Peat) Ex+Ef2 230 x 598 x 1194
6 WETLAND PRODUCTION AND HARVEST OF CATTAILS
Cattails have been chosen as a species for analysis of biomass production on land previously used as a peat source for two reasons first they appear to be a more prolific producer of dry biomass (and hence of energy) than other species such as phragmites sedges and woody plants Second there is an extensive body of information available on their growth and productivity in Minnesota We calculated in Section 2b that cattails may be grown to provide 140 Tacremiddotyr (314 metric Thayr) of dry matter (00) We also calculated that the Biomass Reference Base [ER(biomass)] 210 x 108 BTUacreyr (548 x lOll Jhayr)
Cattails can be used to generate electricity to generate heat as hot H20 or to produce alcohol by fermentation (Figure 61) Cattails can also be processed into briquettes using proshycedures similar to those for peat (Figure 31) Although the calculations for making briquettes from cattails are shown for the sake of completeness in Section 11 the process is excluded from Figure 61 because cattail briquettes yield less heat than those from peat
27
PRODUCTION-HARVESTING - TRANSPOR74TION
PJT MANAGE
WATER
APPLY
N FERTILIZER
I J I
ER f6i r-~------ ~~-------1
PHOTO - ~ LEAF AND SYNTHESIS SHOOT (CAllAI LS) HARVESTER
------shy~I f6I~
~ - - - - shy
TRANSPORT LEAVES
TRANSPORT 1OSS
- --t-- - HARVESTING - - -~ - - -- - ---- - TRANSPORT - - 1gt- - - - - - - -- shy I t ___ lt___ __-P~~_~IL- ~~~2_0___ -- -- -- ArSlDUEsd 1
N P+K OPTION B RHIZOME Z DRY ~ _______I
FERTlUZER FERTILIZER HARVESTING HARVESTER RHIZOMES I TRANSPORT I TRANSPORT LOSS EZL ~ I
I I I I EZ ~ I middot jl___ _J)---EQfT~I~-~---4-l---- l
L- _~____ - ___~ ______ -_ ____ lt_____ _~
_1010 EZ L I EL1 ~
N FERTIUZER MANUFACshy
TURE
I
P+K FERTILIZER
MANUFACTURE
L _ ~__ - - - - - shy
Figure 61 Flow diagram for the energy analysis of cattail production and harvesting and the conversion of cattail leaves (shoots) and rhizomes to
various end-use fuels The dotted line in the production-harvesting-transportation section of this figure identifies the flow path for replanting harvested
rhizomes (Option A) The dotted line in the conversion section of this figure identifies the uses of electricity generated by the conversion process The dashed lines in both sections of the figure identify flow paths for use of
products (eg alcohol) and byproducts (eg ash and sludge) of the conversion processes in earlier steps
28
CONVERSION
6--shy- shy E~middot-middot----------v----shy
LOSSES
---- -----------------(Y- -- - ltipound--- - --- -I
I I
FINEF~ND ~FERMENTATION FERMENTATION L_ ---l -
DISTillATION
--SLUDGE -- j r e---_ ----------------------------0----- ---lt-----~- ------ CK LCOHOL
l KER TRU - - - - - - - shy
29
6a Cattail Planting and water Management
Cattail stands can be established by either seeding or planting rhizome stock (30) It takes about 3 years for a stand to reach full maturity from seed A stand will completely regenershyate in a single year if the equivalent of 10 of the rhizomes harvested are allowed to remain this might be achieved by replanting 10 (1 Tacre) of a fully harvested rhizome crop This replanting is identified as Option A in Figure 61 and would require energy E Regeneration could also be achieved by deliberately leaving behind 10 of the rhizomes in the soil at time of harvest This is identified as Option B in Figure 61
Because ER as defined previously excludes the biomass required for regeneration of cattails E (ER + 1 Tacreyr of rhizomes for regeneration) will be used here to designate the total cattail biomass per acre
Assumption 61 Option B was chosen for this analysis because it involves no extra planting beyond establishment of the stand Amortized over many years of successful harvest the fuel energy needed for initial planting will become negligibly small
The intensive growth of cattails in natural stands or on land previously used as a source of peat will require careful water management Fossil fuels may be needed to install water control structures construct and maintain dikes install drain tile and to periodically clean perimeter drainage ditches proper drainage of the fields may be necessary to establish fertilize and harvest the stands Little information is available on the types of water management practices that may be required since they vary with the kind of implements used for each cultural practice In the absence of established principles several assumptions are necessary although they are insufshyficient to deal with all water management variables
Assumption 62 One acrefoot of water is needed to flood all areas of a cattail field to at least 1 inch depth during the growing season This allows for a level variation of about 2 feet over each flooded field New leveling technolshyogies using laser beams can achieve variations of less than 1 inch per mile hence this assumption is quite conservative unless the field is very large
Assumption 63 A total pumping head of 10 feet is needed to overcome the natural water level difference plus the head loss due to flow friction in the pipe pumping would occur in two stages First the initial flooding of the fields is required in the spring Second pumping is needed to make up the difference between evaporation and transpiration losses and normal precipishytation during the summer
Assumption 64 Evapotranspiration losses during the middle 120 days of the growing season average 020 inchday and normal precipitation during the same period is 12 inches (5)
The excess of evapotranspiration over precipitation = (120 x 02) - 12 = 12 inches The total volume of water to be pumped = 2 acre ftacreyr The work required to pump the water = 10 ft x 2 acremiddotftacreyr x 43560 ft 2acre x 624 Ibft 3 = 544 x 10 7 ftmiddotlbacremiddotyr
Assumption 65 pumping efficiency is 75 and fuel to work conversion efficiency is 218
The fuel energy needed for water management of cattail fields (Ea) = 544 x 107 ftmiddotlbacreyr x 1 BTU7783 ftmiddotlb x 1075 x 10218 = 427 x 105 BTUacreyr (111 x 109 Jhamiddotyr) This is [(427 x 105 )(210 x 108 )]100 = 0203 of ERbull
6b Nitrogen Fertilizer Manufacture
The annual nutrient uptake of cattails producing 178 oven dry Tacremiddotyr (40 oven dry metric Thayrl is 736 Ibacre (825 kghal of nitrogen (N) 108 Ibacre (121 kghal of phosphorus (P) and 496 Ibacre (556 kghal of potassium (K) (29) The actual fertilizer application needed to maintain productivity at a certain level depends on the availability of nutrients in the soil and water The
30
biological N fixation potential of the cattail ecosystem is an important variable for which we have no information
Peat soils contain about 2 N by weight (13) or 8000 lbacremiddotft Most of this N is imshymobilized and not readily available for plant uptake In agricultural soils recovery of applied N fertilizer by grain crops is about 50 to 60 due to losses by leaching and denitrification Howshyever the extent of these processes in wetlands is unknown The nutrient inflow from surrounding watershed andor ecosystem fixation is also unknown Since the energy requirement for manufacture of N fertilizers is high research on the fertilizer requirement of biomass production is needed
Assumption 66 Two values will be taken for the N fertilizer application rate A lower limit of 230 lb Nacreyr and an upper limit of 900 lb N acreyr correshysponding to the removal of 11 Tacreyr of dry matter
We assume (Sections 6i and 6m) that 11 oven dry T (5 T of leaves and 6 T of rhizomes)acreyr of the 14 tons produced are removed This corresponds to an N uptake of 455 Ibacremiddotyr If the recovery of applied N is only SO 910 Ibacremiddotyr of N would be required for production of 11 T dry matter This would appear to be an upper limit
For a lower limit we shall assume that half of the required N uptake is made available by biological fixation and release of N from the soil and all of the applied N fertilizer is utilized The lower limit is then 230 Ibacreyr of N fertilizer
Anhydrous ammonia (NH3) is the N fertilizer form requ~r~ng the least energy (21060 BTUlb N) for manufacture (28) This form will be used in our analysis The energy required for N fertilizer manufacture (lower rate) Eb (low) 21060 BTUlb x 230 Ibacre middotyr 484 x 106 BTUacreyr 1126 x 1010 Jhayr) This is 231 of ERbull The energy required for N fertilizer manufacture at the upper rate of application Eb (high) 189S x 106 BTUacreyr (494 x 10 10 Jhamiddotyr) This is 903 of
ERbull
6c Phosphorus and Potassium Fertilizer Manufacture
Assumption 67 The P and K requirements of an 11 Tacremiddotyr dry matter removal rate of cattail biomass can be met by the application of 275 lbacreyr of P20S and 301 Ibacremiddotyr of K20
Recent research suggests that P may be the limiting nutrient for cattail growth (30) The application rates corresponding to the removal of 11 Tacremiddotyr of dry matter are 120 lbacreyr of P and 2S0 lbacreyr of K These rates are equivalent to 27S lbacremiddotyr of P20S and 301 Ibacre yr of K20
Assumption 68 Ash or sludge will be trucked back from the conversion plant for reapplicashytion to the soil We assume that this recycling of inorganic material will supply 90 of the above P+K nutrient requirements needed for growth Thus the rates of fertilizer needed are reduced to 27S Ibacremiddotyr of P20S and 301 Ibacreyr of K20
Assumption 69 P20 S and K20 will be provided as normal super phosphate (0-20-0) and muriate of potash (0-0-60)
The energy requirements for the manufacture of these fertilizers are 1080 BTUlb (600 kcalkg) of P20S and 1980 BTUlb (1100 kcalkg) of K20 (28) The energy required for P+K fertilizer manufacture (Ec) = 1080 x 27S + 1980 x 301 BTUacre yr = 893 x 10 4 BTUacreyr (233 x 108 Jha yr) This is 0042S of ERbull
6d Nitrogen Fertilizer Transport
Assumption 610 N fertilizer will be transported as liquid anhydrous NH3 in tanker trucks The NH~ is 82 N The weight of NH3 transported at the lower rate of fertil~zation = 280 lbacreyr 1094 lbacremiddotyr is transported at the upper rate of fertilization
Assumption 611 The transportation distance from the NH3 manufacturing plant to the point of application is SOO miles
31
Assumption 612 Tanker trucks will be limited to 73000 lb gross weight and have other characteristics as in Assumptions 322 and 323 Therefore the net load per trip = 46000 lb and the fuel consumption per round trip = 500 (02390 + 01667) = 203 gal
For the lower rate of fertilization the fuel energy for transportation of fertilizer [Ed (low)] = 203 ~altrip x 280 lbacreyr x 1 trip46000 lb x 140000 BTUgal = 173 x 105 BTUacre yr (450 x 10 Jhayr) This is 00822 of ERbull Using similar procedures at the high rate of fertilization the fuel energy for transportation of fertilizer [Ed (high)] = 676 x 105 BTUacreyr (176 x 109 Jhayr) This is 0322 of ERbull
6e phosphorus and potassium Fertilizer Transport
Normal superphosphate (0-20-0) has 20 P205 by weight Since 275 lb P205acreyr are required (Assumption 68) 27502 1375 lbacre middotyr of superphosphate must be transported Similarly 502 lbacreyr of muriate of potash (0-0-60) must be transported to provide 301 lb K20acreyr The total P+K fertilizer weight to be transported = 188 lbacreyr
Assumption 613 The transportation assumptions used for N fertilizer Assumptions 611 and 612 apply for P and K ferti lizer
Therefore transportation fuel required (Ee) = 203 galtrip x 188 Ibacremiddotyr x 1 trip46000 lb x 140000 BTUgal 116 x 105 BTUacreyr (302 x 108 Jhamiddotyr) This is 00552 of ERbull
6f Nitrogen Fertilizer Application
Assumption 614 All N P and K fertilizer will be applied to soil in the fall
Assumption 615 N fertilizer as liquid anhydrous NH3 is applied separately from P and K and is injected directly into the soil
Assumption 616 N fertilizer is applied annually This is the rule in all other continuous monocultures such as corn wheat and sorghum
Assumption 617 The NH3 injection implement requires 420 lb pull per injection knife has a 20 inch knife spacing a 50 traction efficiency and a 218 fuel convershysion efficiency
The fuel energy required for N fertilizer in~ection (Ef) 43560 ft 2acreyr x 1220 ft x 420 Ib x 1 BTU7783 ftlb x 105 x 10218 = 129 x 10 BTUacreyr (337 x 108 Jhamiddotyr) This is 00616 of ERbull
6g Phosphorus and Potassium Fertilizer Application
Assumption 618 The spreader for P K and ash or sludge requires a tow bar force of 80 Ibft width has 50 traction efficiency and a 218 fuel conversion efficiency Assumption 614 applies as before but application of P+K is only once every 2 years at double the annual rate instead of an annual application as for N This fertilizer will be surface-applied although incorporation into the soil would promote efficiency of use
The fuel energy for P+K fertilizer application (Eg) = 43560 ft22 acreyr x 80 lbft x 1 BTUj7783 ftmiddotlb x 105 x 10218 = 205 x 104 BTUacreyr (535 x 10 7 Jhayr) This is 00978 of
ERbull
6h Cattail Photosynthesis
The total solar energy received (~) ~ 20 x 1010 BTUacremiddotyr (52 x 1013 Jha yr) for northshycentral Minnesota
The percentage of solar energy captured by the cattail biomass (14 Tacremiddotyr of dry matter) is 105 This is free energy in our analysis and does not enter further into our calculations
6i Leaf and Shoot Harvesting
32
Assumption 619 The energy requirement for leaf and shoot harvesting is 16 hphracre with a traction efficiency of 50 and fuel to work conversion efficiency of 218 (12 hphrgal)
The fuel energy requirement for leaf and shoot harvesting (Ei ) = 16 hpmiddothracremiddotyr x 2547 BTUhphr x 105 x 10218 374 x 104 BTUacreyr (975 x 107 Jhamiddotyr) This is 00178 of ERbull
Assumption 620 Of the 6 T of leaf dry matter and 8 T of rhizome dry matter available for harvesting only 5 T of leaves (833) and 6 T of rhizomes (75) are actually harvested
The leaf and shoot harves ting loss (ELL) 114 x 210 x 10 8 = 150 x 10 7 BTUacreyr (391 x 1010 Jhamiddotyr) This is 714 of ERbull
6j Leaf and Shoot Drying
Assumption 621 Growing leaves and shoots contain 85 H20 (mm) Air drying primarily before harvesting in the fall reduces this to 25 H20 For a moisture reduction from 85 to 25 H20 the drying energy per acre (from steam tables) for harvested leaves and shoots (Ej ) 568 x 107 BTUacremiddotyr (148 x lOll Jhamiddotyr) This is 2705 of ERbull Tllis drying energy is free from the sun and therefore does not enter fUrther into the analysis
6k Leaf and Shoot Baling
The weight of leaves (25 H20) for baling 5 Tacremiddotyr x 2000 IbT x 43 = 133 x 104
Ibacremiddotyr
Assumption 622 Energy required for baling 2 hpmiddothrT (3) at 218 fuel conversion efficiency
The fuel energy needed for leaf and shoot baling (~) 2 hpmiddothrT x 133 x 104 T2000 acre yr x 2547 BTUhpmiddotyr x 10218 = 156 x 105 BTUacreyr (406 x 108 Jhamiddotyr) This is 00742 of ERbull
61 Leaf and Shoot Transportation
Assumption 623 The truck characteristics are the same as those of Assumptions 322 and 323
Assumption 624 The transportation distance is 30 miles
Assumption 625 The compaction ratio during baling results in a baled specific weight greater than 1704 Ibft3bull This corresponds to a weight limited load
The transportation fuel (El ) = 133 x 104 Ibacremiddotyr x 1 trip46OOO Ib x 122 galtrip x 140000 BTUgal = 494 x 105 BTUacreyr (129 x 109 Jhamiddotyr) This is 0235 of ERbull
The transportation loss (see ASSUmption 637) is 2 for both leaves (and shoots) and rhizomes (and roots) Therefore the leaf and shoot transportation loss (~l) = 150 x 106 BTUacreyr (391 x 109 Jhamiddotyr) This is 0714 of ERbull
6m Rhizome Harvesting
Assumption 626 The energy requirement for rhizome harvesting is 7 hpmiddothracre of mechanical energy
Assumption 627 Ten percent of the rhizomes (-1 Tacremiddotyr of dry matter) is left behind as undisturbed strips for the regeneration of next years growth
The fuel energy required for rhizome harvesting (Em) 7 hphracre x 2547 BTUhpmiddothr x 10218 x 09 736 x 104 BTUacreyr (192 x 108 Jhamiddotyr) This is 00351 of ERbull
33
In Assumption 620 we assumed that an average of 6 of the 8 T dry matter of potentially harvestable rhizomes would be harvested Therefore the root and rhizome harvesting loss (EZL) 214 x 210 x 108 300 x 107 BTUacreyr (782 x 1010 Jhamiddotyr) This is 1429 of ERbull
6n Root-Rhizome Drying
Assumption 628 Rhizomes will be stacked after harvesting at the side of the field tc air dry to about 50 H20
Assumption 629 The initial H20 content of the freshly harvested rhizomes is 875
For a reduction from 875 to 50 H20 the drying energy for roots and rhizomes (En) 767 x 107 BTUacreyr (200 x lOll Jhayr) This is 3652 of ERbull As in Section 6j this drying energy is free from the sun and does not enter further into the analysis
60 Collection of Dried Rhizomes
Assumption 630 Rhizomes have a specific weight at 50 H20 (mm) of 20 Ibft3 excluding voids The rhizome biomass volume 6 x 2000 x 2 Ibacremiddotyr x 1 ft320 Ib 1200 ft3acreyr
Assumption 631 The machine described in Assumption 47 is used for collection and transshyport of rhizomes to the chopper The process rate is 400 m3hr and the machine power rating is 40 kW (536 BHP)
The fuel energy needed for collection and transportation to chopper (Eo) 1200 ft3acreyr x 1 m33531 ft 3 x 1 hr400 m3 x 536 hp0218 x 2547 BTUhphr 533 x 104 BTUacreyr (139 x 108
Jhamiddotyr) This is 00254 of ERbull
6p Chopping of Rhizomes
Assumption 632 The chopper has an energy requirement of 35 hp bull hrT with 218 fuel conversion efficiency
The fuel energy required for chopping (E ) 35 hphrT x 1 T2000 Ib x 2547 BTUhphr x 10218 x 240 x 104 Ibacremiddotyr = 491 x 105 BTJacreyr (128 x 109 Jhamiddotyr) This is 0234 of ~
6q Rhizome Transportation
Assumption 633 The chopped rhizomes are loaded directly into trucks from the chopper
Assumption 634 The truck characteristics are the same as those of Assumptions 322 and 323
Assumption 635 The specific weight of the chopped rhizomes is gt 1704 Ibft3 loads are weight limited at 46000 lb
ASSUmption 636 Transportation distance is 30 miles
The transportation fuel required (E ) = 240 x 104 Ibacreyr x 1 trip46000 Ib x 122 galtrip x 140000 BTUgal = 889 x 105 Byenuacreyr (232 x 109 Jhayr) This is 0423 of ERbull
The transportation loss (See Assumption 637) is 2 Therefore the root and rhizome transshyportation loss (EL2 ) 180 x 106 BTUacremiddotyr (469 x 109 Jhamiddotyr) This is 0857 of ERbull
The total transportation loss (BTL) ELI + EL2 330 x 106 BTUacremiddotyr (860 x 109 Jhamiddot yr) This is 157 of ERbull
6r Transportation of Ash Residues or Sludge Back to Land
Cattail leaves contain about 47 ash and rhizomes 32 ash on a dry matter basis at harvest (16) The total ash weight 2000 [5 x 0047 + 6 x 0032] 854 Ibacremiddotyr
34
Assumption 637 The loss of biomass in transportation to the conversion plant is 2 loss of ash at plant and in transportation back to land is 8 Thus potential ash loss is 10 The ash or residue actually transported bland 854 x 09 = 769 lbacremiddotyr
The the
ack to
Assumption 638 The specific weight of ash and residue is greater than 1704 lbft3bull
The ash will be transported back in some of the empty trucks returning from the conversion plants Only the difference in fuel consumption between a fully loaded and an empty truck is relevant The extra fuel consumption = 30 [02390 - 01667) = 217 galtrip Therefore the fuel energy needed for residue transportation (Er ) 769 lbacremiddotyr x 1 trip46OOO lb x 217 galtrip x 140000 BTUgal = 508 x 10 3 BTUacreyr (132 x 107 Jhamiddotyr) This is 00024 of ERbull
6s Cattail Production Harvest and Transportation Summary
Table 61 summarizes the fuel requirement for each process step in the production harVest and transportation of cattails grown for biomass on wetland This analysis shows that the energy required to manufacture N fertilizer which ranges from 23 to 90 of source energy is the largest of any of the steps The energy in cattails delivered to the conversion facility expressed as a percentage of total energy inputs depends upon the rate of N fertilization At the low rate of fertilization this value is 7710381 = 742 and 7711077 = 695 at the high rate The uncertainty about the N fertilization rates needed to sustain cattail production at 14 Tacreyr dry matter and the dependence of energy inputs on N fertilization rate suggest that research on N management and cycling in wetland biomass production deserves urgent attention
Note from Sections 6j and 6n that free solar energy used for drying would have made this step the most energy intensive with N fertilization a distant second
As in previous sections we have made no allowances for the energy requirements of machinery manufacture maintenance or repair Energy requirements of land reclamation have also been exshycluded
7 CONVERSION OF PEAT AND CATTAILS TO SYNTHETIC NATURAL GAS (SNG)
Peat and cattail feedstocks can potentially be converted into a number of different fuels and energy forms such as SNG alcohols hydrocarbon liquids electricity or steam or hot water for district heating Analysis of all of the possible combinations of feedstock types conversion methods and end-use fuels is not justified at this time Since interest is high in the potential use of peat and cattails for SNG production four specific flow paths have been analyzed in this section with SNG for home commercial and industrial use as the end product The analyses of the four specific paths correspond to four different feedstock types densified milled peat sod peat hydraulic peat (50 H20) and cattail leaves and rhizomes
This section presents calculations of the energy available from peat or cattails for use as feedstock energy (EF) as a percentage of source energy (ER) for the four different types of feedshystocks The pumping energy required for delivery of SNG from reactor to consumer is also calculated However all feedstock energy is not converted to SNG Figure 71 illustrates how EF divides among output products and losses in a peat gas reactor
PEAT GAS REACTOR COMPLEX
L_=-S~~~BENZENE-38 EB
PEAT FEEDSTOCK SNG - 524 EG
EF LIQUID - 84 ELF100 FUELS
(50 H20 Content) AMMONIA-23 EA ~----(=- SULFUR - 01 ES
Figure 71 Energy distribution and flow for the peat gas reactor
35
Table 61 Fuel energy inputs required for wetland biomass production at high (Hl and low (Ll levels of N fertilization
Fuel Required of Source Process Step Symbol BTUacreyr Jhamiddotyr Fuel Type Energy (ERl
Planting and water Management Diesel 0203
107 1010N Fertilizer (Hl 1B95 x 494 x Natural Gas 903 Manufacture (Ll 4B4 x 106 126 x 1010 Natural Gas 231
P+K Fertilizer Manufacture B93 x 104 233 x 108 Coal 0043
N Fertilizer (Hl 676 x 105 176 x 109 Diesel 0322 Transportation (Ll 173 x 105 450 x 108 Diesel 0OB2
P+K Fertilizer Transportation 302 x 108 Diesel 0055
N Fertilizer Application 337 x lOB Diesel 0062
P+K Fertilizer Application 205 x 104 535 x 107 Diesel 0010
Leaf and Shoot Harvesting 374 x 104 975 x 107 Diesel OOlB
Leaf and Shoot Baling 156 x 105 406 x 108 Diesel 0074
Leaf and Shoot Transportation 494 x 105 129 x 109 Diesel 0235
Rhizome Lifting and Cutting 192 x lOB Diesel 0035
Collection of Dried Rhizomes 533 x 104 139 x lOB Diesel 0025
Chopping of Rhizomes 491 x 105 12B x 109 Diesel 0234
Rhizome Transportation BB9 x 105 232 x 109 Diesel 0423
Ash and Residue Transportation 50B x 103 132 x 107 Diesel 0002
Total for N+P+K Fertilizer (Hl Eb(H) + Ec 190 x 107 497 x 1010 Natural Gas 907 x 1010Manufacture (Ll Eb(L) + Ec 493 x 106 129 + Coal 235
Total N+P+K Fertilizer Manufacture (H) 200 x 107 521 x 1010 Natural GasJ952 1010Transportation and Application (Ll 53B x 106 140 x Coal + Diese 256
Leaf and Shoot Harvest and Transportation 6B7 x 105 180 x 109 Diesel 0327
Rhizome and Root Harvest and Transportation 393 x 109 Diesel 0717
Total Harvest Transportation Diesel 1045
Total Nonsolar EXternal Inputs (H) 226 x 107 590 x 1010 1077 106 1010(Ll BOO x 209 x 381
Growth - Photosynthesis 210 x lOB 548 x lOll Solar 10000
Total Solar + Nonsolar Energy (Hl 233 x lOB 606 x 1011 11077 Inputs All Sources Except (Ll 21B x lOB 56B x 1011 10381 Solar Drying
107 1010Leaf and Shoot Harvesting Loss 150 x 391 x 714
1010Root and Rhizome Harvesting Loss 300 x 107 782 x 1429
Biomass Loss in Transportation ETL 330 x 106 B60 x 109 157
Total Biomass Loss 4B3 x 107 126 x lOll 2300
Biom=assEn=er 162Xl08 4 2 2 10 11 g~y--=inFeedstockfor--=Conversion=--_-=EIF-____ _ x 77 00
36
7a Peat and Cattails Available for Feedstock Energy
The energy potentially available for conversion to feedstock is given by the source energy (ER) As calculated in section 2b ER (peat) = 192 x 1010 BTUacre and ER biomass = 210 x 108
BTUacre yr The energy available as feedstock for conversion to SNG depends on the particular harvesting method
Assumption 71 Sod peat contains 35 H20 (mm) as delivered This is less than the 50 H20 feedstock for which the peatgas reactor (Figure 71) was designed However we assu~e that the percentages shown in Figure 71 will not be significantly different between 50 and 35 H20 feedstocks Water can be added if necessary to increase the H20 content
Assumption 72 The cattail feedstock will contain between 35 and 50 H20 and will conshyform to the model in Figure 71 during gasification
The amount of feedstock energy derived from each of the four feedstocks varies with the harshyvesting and transportation losses and the amount of the input feedstock used as fuel in these earlier stages The results derived using the model in Figure 71 are summarized in Table 71
Table 71 Feedstock energy (EF) as a percentage of source energy (ER) for different feedstocks
Harvesting and Transportation
Feedstock Losses Fedback Fuel Actual (Harvest Method) () (II) (BTUacre)
1010Peat (Sod) 10 990 190 x
1010Peat (Milled) 40 960 184 x
1010Peat (Hydraulic) 200 88 712 137 x
108aCattails 230 77 0 162 x
aBTUacreyr
7b Synthetic Natural Gas pumping Energy
Part of the SNG produced is consumed by the pumps required to move the SNG through the pipelines from the conversion plant to consumers According to Rader (31 32) transportation of SNG over long distances uses only about one-third as much energy as electric energy transportation which typically has a 10 dissipation loss
Assumption 73 SNG pumping energy is 333 of the energy in the gas produced or 333 x 0524 = 174 of the energy in the peat or cattail feedstock
8 NET ENERGY ANALYSES FOR CONVERSION TO SNG USING FOUR TYPES OF FEEDSTOCK
In this section energy requirements and net energy balances for conversion of the four feedstock types described above (sod peat milled peat hydraulic peat and cattails) to SNG are calculated These analyses exclude consideration of the appliance or device in which the SNG will be used and the quality matching of the end-use energy form (heat light work) to the end-use fuel (SNG in this case)
Each analysis consists of a flow chart and a tabular summary of process components in the conversion of the raw fuel source to SNG via each of the four feedstock production pathways The
37
summaries express each process component (energy input output flow or loss) as a percentage of six different base quantities Total Energy Resource (ET) Extracted or Resource Energy (ER) Feedstock Energy (EF) Product Energy Output (EO) Energy in SNG Output (EG) and Energy in SNG to Consumers (EC) Comparison of each process component with six reference quantities aids in interpretation of the results since all are currently in use and there is little unanimity among researchers on which reference base is most appropriate
8a Net Energy Analysis summary for the Densified Milled Peat - SNG Conversion Process
The model and definitions for this conversion process are shown in Figure 81
Percent of Reference Energy
Reference Energy--------------Process Component-----------------shy(Description) (Symbol) (106 BTUacre)
Total Energy Resource ~ 19460 1000 1013 1055 1575 2013 2083
EXtracted Energy ER 19210 987 1000 1042 1555 1988 2056
Feedstock Energy EF 18440 948 960 1000 1493 1908 1974
Product Energy Output EO 12360 635 643 670 1000 1279 1323
Energy in SNG Output EG 9660 497 503 524 782 1000 1034
Energy in SNG to Consumers EC 9340 480 486 507 756 967 1000
Primary Land Drainage Ea 005 00003 00003 00003 00004 00005 00005
Surface vegetation Clearance Eb 117 0006 0006 0006 0009 0012 0013
Secondary Drainage Ec 005 00003 00003 00003 00004 00005 00005
Field Preparation Ed 035 00018 00018 00019 00028 00036 00037
Milled Peat Harvest 446 0299 0232 0242 0361 0461 0477
Densification Ef 477 0245 0248 0258 0386 0493 0510
Densified Transport Eh 1511 0777 0786 0819 122 156 162
Energy Needed in Excess of that in EXtracted Peat EX 245 126 127 133 198 254 262
Harvest Dusting Loss ~1 384 197 200 208 311 397 411
Transportation Loss ~2 384 197 200 208 311 397 411
Gasification Plant Loss ~3 6090 313 317 330 493 630 651
Energy Contents of Byproducts
Liquid Fuels 1550 80 81 84 125 160 166
Benzene 701 360 365 380 567 725 750
Ammonia 424 218 221 230 343 439 454
Sulfur ES 18 009 010 010 015 019 020
SNG pipeline Pumping 322 166 168 175 261 333 345
38
PEAT GASIF1~AT10N ttO~ES lJ ELl
SQILEH 20-GASIFshy
ICATION REACTOR Ii _
FEEDSTOCK TO GASIFICATION
MATERIAL LOST IN PLANT EF TRANSPORTATION
EL2 50
----- I------~M
ESEL FUEL Ell lIOUID FUELS ELFreg BENZENE EB
W ~AMMONIA EA ~SULFUR ES
10
Figure 81 Flow diagram for the energy analysis of the densified milled peat shysynthetic natural gas conversion process
Definitions (1) Total External Energy (EX) Ea + Eb + Ec + Ed + Ee + Ef + Eh (2) Total Energy Resource (ET ) ER + EX (3) Extracted Source Energy (ER) (4) Feedstock Energy (EF ) ER - ELI - EL2 (5) Production Energy Output (EO) EF shy EL3 (6) SNG Energy Output (EG) Eo - ~F - EB - EA - ES (7) Energy on SNG to Consumers (EC) EG - Ep
8b Net Energy Analysis Summary for the Sod Peat - SNG Conversion Process
The model and definitions for this conversion process are shown in Fig 82
Percent of Reference Energy
Reference Energy--------------Process Component-----------------shy(Description) (symbol) (106 BTUacre)
Total Energy Resource ET 19600 1000 1021 1031 1539 1967 2035
Extracted Energy ER 19210 980 1000 1010 1508 1928 1994
Feedstock Energy EF 19020 970 990 1000 1493 1908 1974
Product Energy Output EO 12740 650 663 670 1000 1279 1323
Energy in SNG Output EG 9970 508 519 524 782 1000 1034
Energy in SNG to Consumers EC 9630 491 501 507 756 967 1000
primary Land Drainage Ea 005 00003 00003 00003 00004 00005 00005
Surface Vegetation Clearance Eb 117 0006 0006 0006 0009 0012 0012
Sod Peat ExtractEXtrude Ec 1695 0865 0882 0891 133 1 70 176
TurningWindrowing Ed 424 0022 0022 0022 0033 0043 0044
Collection of Sods Ee 568 0029 0030 0030 0045 0057 0059
Transportation Ef 1186 0605 0617 0624 0931 119 123
CrushingCoarse Grinding Eg 949 0484 0494 0499 0745 0952 0985
Energy Needed in EXcess of that in Extracted Peat EX 3941 201 205 207 309 395 409
Transportation Loss ELl 1921 098 100 101 151 193 199
Gasification plant Loss EL2 6280 320 327 330 493 630 651
Energy Content of Byproducts
Liquid Fuels E1F 1600 81 83 84 125 160 166
Benzene 723 369 376 380 567 725 750
Ammonia 437 223 228 230 343 439 454
Sulfur 19 010 010 010 015 019 020
SNG pipeline Pumping 332 169 173 1 75 261 333 345
40
MATERIAL lOST IN TRANSPORTATION
II UCUI FUm ELI 4BENZENE EB
01gt AMMONIA EA f-
~SUlFUR ES
Figure 82 Flow diagram for the energy analysis of the sod peat shysynthetic natural gas conversion system
Definitions (1) Total External Energy (EX) = Ea + Eb + Ec + Ed + Ee + Ef + Eh (2) Total Energy Resource (ET ) = ER + EX (3) Extracted Source Energy (ER) (4) Feedstock Energy (EF) ER - ELl (5) Production Energy Output (EO) = EF - EL2 (6) SNG Energy Output (EG) EO - ELF - EB - EA - ES (7) Energy in SNG to Consumers (EC) = EG - Ep
8c Net Energy Analysis Summary for the Hydraulic Peat - Slurry Pipeline - Dewatering - SNG Convershysion Process
The model and definitions for this conversion process are shown in Figure 83
Percent of Reference Energy
Reference Energy--------------Process Component-----------------shy(Description) (Symbol) (106 BTUacre)
Total Energy Resource ET 19820 1000 1032 1449 2162 2765 2859
Extracted Energy ~ 19210 969 1000 1404 2096 2680 2771
Feedstock Energy EF 13680 690 712 1000 1493 1908 1974
Product Energy Output EO 9170 463 477 670 1000 1279 1322
Energy in SNG Output EG 7170 362 373 524 782 1000 1034
Energy in SNG to Consumers Ec 6930 350 361 507 756 967 1000
preparation of Reservoir negligible
Extraction and processing Eb 292 0147 0152 0213 0318 0407 0421
Slurry Pipeline Pumping Ec 536 270 279 392 584 747 773
Second Stage Dewatering Ed 238 0120 0124 0174 0260 0332 0343
Return Water Pumping Ee 131 0066 0068 0095 0142 0182 0188
Third Stage Dewatering Eg 48 0024 0025 0035 0052 0066 0069
Energy Needed in Excess of that in Extracted Peat EX 607 306 316 444 662 847 876
Colloidal Loss ~1 3840 194 200 281 419 536 554
Fuel for Autoclave Furnaces Ef 1690 852 879 123 184 235 243
Gasification Plant Losses 4510 228 235 3330 493 630 651
Energy Content of Byproducts
Liquid Fuels 1150 580 598 840 125 160 166
Benzene 520 262 271 380 567 725 750
Ammonia 315 159 164 230 343 439 454
Sulfur 137 0069 0071 0100 0149 0191 0197
SNG pipeline pumping 237 119 123 173 258 330 341
42
w
LlaUID FUELS ELF
BENZENE Ea ~AMMOHIA EA
~SULFUR ES
Figure 83 Flow diagram for the energy analysis of the hydraulic peat shysynthetic natural gas conversion system
Defini tions (1) Total External Energy (EX) = + Eb + Ec + Ed + + Eh (2) Total Energy Resource (ET ) = ER + + EX (3) Extracted Source Energy (~) (4) Feedstock Energy (EF) = ER - ELl - Ef (5) Production Energy Output (EO) EF - EL2 (6) SNG Energy Output (EG) = EO - ELF - EB - EA - ES (7) Energy in SNG to Consumers (Ee) = EG - Ep
8d Net Energy Analysis Summary for the Cattail Production - Harvest - SNG Conversion Process
The model and definitions for this conversion process are shown in Fig 84 and the calculashytions are summarized in Tables 8d-l and ad-2 They differ in three important ways from the process alternatives shown in Figure 61
(i) Figure 61 shows the leaf and shoot feedstock being used for combustion to cogenerate electricity and hot water for process or district heat while the rhizome feedstock is being fed to a fermentation and distillation plant for the production of alcohol In comparison Figure 84 shows both leaf and rhizome feedstock as input to a gasification reactor so that a comparison with the peat feedstocks may be made
(ii) In Figure 61 part of the alcohol produced is fed back to fuel the production harvestshying and transportation machinery in place of diesel fuel All machinery is assumed to be fueled by diesel in Figure 84 because no alcohol is produced
(iii) In Figure 84 all of the ammonia byproduct (EA) is fed back to supply part of the N fertilizer requirements (~) Part of the liquid fuels output (ELF) could presumably also have been fed back This was not done since the composition of the liquid fuels was not known
The major assumption made in this analysis is that the cattail feedstock will behave identi shycally to peat feedstock to give the same ratio of SNG to byproducts and losses This of course will not be the case but in the absence of any better information this analysis is the best possible with the data that are available Note that the diesel fuel now required for N fertilizer transport is no longer Ed based on a 500 mile transportation distance but Ed = Ed (500 Eb + 30 EA)500 Eb based on the relative quantities of manufactured and fedback anhydrous ammonia transported over distances of 500 and 30 miles respectively
Table ad-l Net energy analysis summary for the low rate of N fertilizer application
Percent of Reference Energy
Reference Energy--------------Process Component----------------- shy(Description) (Symbol) (106 BTUacre)
TOtal Energy Resource ET 21420 1000 1020 1324 2047 2528 2615
Available Biomass Energy Resource ~ 21000 981 1000 1299 2007 2478 2564
Feedstock Energy EF 16170 755 770 1000 1546 1908 1974
Product Energy from plant EO 10830 506 516 670 1036 1279 1323
Product Energy Output EO 10460 489 498 647 1000 1235 1277
Energy in SNG Output EG 8470 396 403 524 810 1000 1034
Energy in SNG to Consumers EC 8190 382 390 507 783 967 1000
Planting and Water Management Ea 427 0199 0203 0264 0408 0504 0521
N Fertilizer Needed
NH3 Fed-back
Et
EA
4844
3719 1 74
231
177
300
230
463
356
572
439
591
454
N Fertilizer Manufacture
P+K Fertilizer Manufacture
Eb
Ec
1125
893
0525
0042
0536
0043
0696
0055
108
0085
133
0105
137
0109
44
Table 8d-l (continued) Net energy analysis summary for the low rate of N fertilizer application
Percent of Reference Energy
Reference Energy--------------Process Component-----------------shy(Description) (Symbol) (106 BTUacre)
N Fertilizer Transport no NH3 Fedback Ed 173 0081 0082 0107 0165 0204 0211
N Fertilizer Transport NH3 Fedback Ed 481 0022 0023 0030 0046 0057 0059
P+K Fertilizer Transport Ee 116 0054 0055 0072 0111 0137 0141
N Fertilizer Application Ef 129 0060 0062 0080 0124 0153 0158
P+K Fertilizer Application Eg 205 0010 0010 0013 0020 0024 0025
Leaf and Shoot Harvest Ei 374 0017 0018 0023 0036 0044 0046
Leaf and Shoot Baling Ek 156 0073 0074 0096 0149 0184 0190
Leaf and Shoot Transport El 494 0231 0235 0305 0472 0583 0603
Rhizome Harvester Em 736 0034 0035 0046 0070 0087 0090
Rhizome Collection Eo 533 0025 0025 0033 0051 0063 0065
Rhizome Chopping Ep 491 0229 0234 0303 0467 0579 0599
Rhizome Transport Eq 889 0415 0423 0550 0850 1049 1085
Ash amp Residue Transport Er 051 0002 0002 0003 0005 0006 0006
Energy Needed in Excess of that in Biomass EX 416 194 198 257 397 490 507
Leaf and Shoot Harvest Loss ELL 1500 700 714 928 143 177 183
Root and Rhizome Harvest Loss 3000 140 143 186 287 354 366
Total Biomass Transport Loss ELl + EL2 330 154 157 204 315 390 403
Total Biomass Loss EBL 4830 226 230 299 462 570 590
Gasification Plant Loss EL3 5340 249 254 330 510 630 652
Energy Content of Byproducts
Liquid Fuels ~F 1360 634 647 840 130 160 166
Benzene 614 287 293 380 587 725 750
Ammonia (Fedback) 372 1 74 177 230 356 484 454
Sulfur 162 0076 0077 0100 0155 0191 0198
SNG pipeline Pumping Epp 282 132 134 1 75 270 333 345
45
Table 8d-2 Net energy analysis summary for the high rate of N fertilizer application
Percent of Reference Energy
Reference Energy--------------process Component----------------- shy(Description) (Symbol) (106 BTUacre)
Total Energy Resource 22880 1000 1089 1415 2187 2700 2793
Available Biomass Energy Resource
-21000 918 1000 1299 2007 2478 2564
Feedstock Energy 16170 707 77 0 1000 1546 1908 1974
Product Energy from Plant 10830 474 516 670 1036 1279 1323
Product Energy Output Eo 10460 457 498 647 1000 1235 1277
Energy in SNG output 8470 370 403 524 810 1000 1034
Energy in SNG to Consumers 8190 358 390 507 783 967 1000
Planting and Water Management 427 0187 0203 0264 0408 0504 0521
N Fertilizer Needed 1896 829 903 11 72 1812 2237 2314
NH3 Fed-back 372 163 177 230 356 439 454
N Fertilizer Manufacture E 1524 666 726 942 1456 1798 1860b
P+K Fertilizer Manufacture 893 0039 0043 0055 0085 0105 0109
N Fertilizer Transport no NH3 Fedback 676 0295 0322 0418 0646 0798 0825
N Fertilizer Transport NH3 Fedback E 551 0241 0262 0341 0527 0650 0673d
P+K Fertilizer Transport 116 0051 0055 0072 0111 0137 0142
N Fertilizer Application 129 0057 0062 0080 0124 0153 0158
P+K Fertilizer Application 205 0009 0010 0013 0020 0024 0025
Leaf and Shoot Harvest 374 0016 0018 0023 0036 0044 0046
Leaf and Shoot Baling 156 0068 0074 0096 0149 0184 0190
Leaf and Shoot Transport 494 0216 0235 0306 0472 0583 0603
Rhizome Harvester 736 0032 0035 0046 0070 0087 0090
Rhizome Collection 533 0023 0025 0033 0051 0063 0065
491 0215 0234 0303 0469 0579 0599Rhizome Chopping
Rhizome Transport 889 0389 0423 0550 0850 1049 1085
Ash amp Residue Transport 051 0002 0002 0003 0005 0006 0006
46
Table 8d-2 (continued) Net energy analysis summary for the high rate of N fertilizer application
Reference Energy--------------Process Component-----------------shy(Description) (Symbol) (106 BTUacre) ET EF E EC0
Energy Needed in Excess of that in Biomass EX 1877 820 894 116 179 222 229
Leaf and Shoot Harvesting Loss ~ 1500 656 714 928 143 177 183
Root and Rhizome Harvest Loss EZL 3000 131 143 186 287 354 366
Total Biomass Transport Loss ~1 + ~2 330 144 157 204 315 390 403
Total Biomass Loss EBL 4830 211 230 299 462 570 590
Gasification Plant Loss ~3 5340 233 254 330 510 630 651
Energy Content of Byproducts
Liquid Fuels ~F 1360 594 647 840 130 160 166
Benzene EB 614 268 292 380 587 725 750
Ammonia (Total) EA 372 163 177 230 356 439 454
Sulfur ES 162 0071 0077 0100 0155 0191 0198
SNG pipeline pumping Epp 282 123 134 175 270 333 345
47
oigt OJ
Eb 10 EZ
FEEDSTOCK BIOMASS GASIFICATION PLANT TO GASIFICATION PLANT Igt yen LOSSES EL3
EF
~ SNG PtPiLM
------lOOO LIQUID FUELS ELF
I IIQsectI BENZENE EB EA
Lshy______()cent SULFUR ES
Figure 84 Flow diagram for the energy analysis of the cattail production shysynthetic natural gas conversion system
Definitions (1) Total External Energy (EX) (E + Eb+ Ec + Ed + Ee + Ef + Eg + Ei + Ek + Em + Eoa + Ep + Eq + Er
(2) Total Energy Resource (ET ) (EL + ELL) + (EZ + EZL + 01 E~) + EX = El + El + EX = El + E
(3) Extractea Source Energy (EL + EZ ) = El - ELL - EZL (4) Feedstock Energy (EF ) El - ~L - EZL - ELI - EL2 (5) Production Energy Output (EO) Ep - - EAEL3 (6) SNG Energy Output (EG) = EO - ELF - EB - ES (7) Energy in SNG to Consumers (EC ) = EG - Epp
9 CONVERSION TO ELECTRICITY ANDOR DISTRICT HEAT
The technology for conversion of peat and cattail feedstocks to electricity o~ district heat by combustion is available The essential steps are
1) Fine grinding to improve combustion efficiency
2) Exhaust fan furnace delivery to blow the finely ground particles directly into the furnace combustion chamber
3) Feedstock combustion to convert chemical energy of the feedstock into thermal energy carried by the flue gases
4) Steam generation accomplished by exchange of thermal energy between the flue gases and water or steam through boilers steam tubes water heaters and economizers
5) Mechanical power output by conversion of thermal energy of the steam into mechanical work by means of a Rankine cycle turbine
6) Electricity generation by conversion of mechanical work to electrical energy in generashytors or alternators
7) Transmission by wire of the electrical power from the generating station to consumer
8) District heating in which part or all of the generated steam is allocated for delivery as thermal energy to consumers either as steam or as hot water and
9) District heat reticulation which is the delivery of steam or hot water under pressure by pipe to the consumer
The assumptions required in application of these individual steps are summarized in the folshylowing six sections
9a Fine Grinding and Exhaust Fan
Fine grinding to approximately 50 to 100 vm is recommended before combustion or briquetting to improve combustion efficiency and aid in the drying and forming of briquettes An exhaust fan is needed to blow the fuel into the combustion chamber
Assumption 91 The energy requirements for the fine grinding of peat and cattail feedshystocks are similar to those for pulverizing coal
The energy requirement for a ballmill with soft coal or lignite is 12 kWhT and for a ballmill with hard coal (eg anthracite) is 17 kWhT (4 33) These figures include 1 kWhT for the feeder and 7 kWhT for the exhaust fan which blows the pulverized powder into the furnace The energy requirement for a bowlmill and feeder is 10 kWhT and for an exhaust fan for delivery from bowlmill to furnace is 5 kWhTo This totals 15 kWhT (4 33)
Alternatively an energy input per unit output including fan of 14 kWhT has been suggested (4) for fibrous materials Fine grinding of 35 H20 peat or cattails might require more energy In the absence of better data we assume that the energy for fine grinding is 10 kWhT and the energy for the exhaust fan is 5 kWhTo
Assumption 92 For Case A electrical generation with or without district heat the fine grinding and exhaust fan energy requirements are satisfied by electricity generated on site For Case B briquetting and district heat only grinding and fan energy requirements are satisfied by remotely generated electricity
Assumption 93 The thermal energy available for combustion conversion processes is based on the lower LHV rather than the HHV The LHV of peat as a function of H20 content was established in Section 5f The LHV of cattails is calculated below
49
Assumption 94 The polymer structure of cattail dry
(H005C6)n
The mole fraction by weight of hydrogen in cattail dry fractional H20 content of the biomass by weight then the HHV
00617[w(H20)W(H2)](1-x)+x = 7500 (l-x) - 10652[00617hfBT31b A graph of these functions is shown in Fig 91
iii 8000 J -7500 7000 6908
~ 6000 al
~ 4000 J ~ 3000
2000Z -~ laquo 1000 W E
5000~------~--~
4117
10 20 30 60 70 80 90 100 ( )
matter can be represented by
matter 10162 = 00617 If x is the == 7500 (l-x) BTUlb The LHV HHVshyx 182(l-x)+x] == 6908 - 7974 x
Figure 91 Higher heating value (HHV) and lower heating value (LVH) of wet cattails as a function of moisture content by weight
For cattails at 35 H20 the HHV = 4875 BTUlb and the LHV 4117 BTUlb The ratio LHVHHV 41174875 = 08445 for cattails For peat at 35 H20 the ratio LHVHHV is 52846000 = 08807
Assumption 95 For Case A the efficiency for converting peat and cattails to electricshyity is 32 without district heat (A-l) and 27 with district heat In the case of cogeneration a further 50 of the peat and cattail energy is used as heat for a total conversion efficiency of 77 (A-2)
Assumption 96 For Case B which uses remotely-generated electricity the coal to elecshytricity conversion efficiency is 30 This efficiency is lower than that for A-l since it includes the line loss associated with transmission from a remote generating point
Case A-l Conversion to Electricity Only
The fuel energy requirement for grinding peat or cattail feedstock for conversion to elecshytricity is 10 kWhT x 1 T2000 lb x 3413 BTUkWh x 1032 == 533 BTUlb Using similar calculashytions the fuel energy requirement for the fan is 267 BTUlb The amount of peat or cattail fuel energy needed for grinding and fan operation depends upon the feedstock type These calculations are summarized in Table 91 for the four types of feedstock
50
Table 91 Grinding and exhaust fan energy requirements for conversion of peat and cattails to electricity
Fine Grinding Exhaust Fan
LHV Fuel HHV Fuel LHV Fuel HHV Fuel Weight of Feedstock
Ener~y Energy Ener~y Energy ( of (104 (10 (106 (10 (106
Feedstock Type Source) lbacre) BTUacre) BTUacre) ( of ER) BTUacre) BTUacre) ( of ER)
Sod Peat 990 317 169 192 0999 845 960 0499
Densified Milled Peat 960 399a 213 242 1259 107 121 0630
Hydraulic Peat (35 H2O)
Cattails
682
770
218
332b
116
1n C
132
209c
0688
0997
582
0884c
661
105c
0344
0499
a Weight of 50 H20 material (320 x 106 x 6550 x 096) lbacre
b Weight of 35 H20 cattails (14 x 2000 x 1065 x 077) lbacre-yr
c Fuel energy in 106 BTUacreyr
Case A-2 Conversion to Electricity and District Heat (Cogeneration)
Using energy analysis based upon the first law of thermodynamics the fuel energy requirement for grinding peat or cattail feedstock is 10 kwhT x 1 T2000 lb x 3413 BTUkWh x 1077 222 BTUlb Similar calculations give a fan fuel requirement = 111 BTUlb However first law acshycounting for this case is grossly misleading since it incorrectly assumes that the electricity and thermal outputs from the cogeneration plant have equal quality Hence for this case we shall employ second law principles to derive more realistic values for grinding and fan fuel requirements
Assumption 97 The temperature of hot water delivered from the cogeneration plant is 2350 F (Section gel and the ambient temperature for space heating is 70oF
The energy quality factor for electricity = 1000 For hot water the quality factor = (TshyTo)T = (235-70)(235 + 460) 0237 From the second law of thermodynamics the efficiency = 027 x 1000 + 50 x 0237 = 0388 (see Assumption 95) Thus the fuel energy requirement for grinding peat and cattail feedstocks 10 x 12000 x 3413 x 103885 = 439 BTUlb The fuel energy requireshyment for the fan = 220 BTUlb In this case as in A-l the amount of feedstock energy needed for grinding and fan operation depends upon the type of feedstock These calculations are summarized in Table 92
51
Table 92 Grinding and exhaust fan energy requirements for cogeneration of electricity and district heat from peat and cattails
Fine Grinding Exhaust Fan
LHV Fuel HHV Fuel LHV Fuel HHV Fuel Weight of
( of
Feedstock
(104 Energy
(106 Ener~y
(10 Energy
(106 Energy
(106
Feeds tock Type Source) Ibacre) BTUacre) BTUacre) ( of ER) BTUacre) BTUacre) ( of ER)
Sod Peat 990 317 139 158 0823 696 790 0411
Densified Milled Peat 960 399 176 199 1037 877 996 0519
Hydraulic Peat (35 H2O)
Cattails
682
77 0
218
332a
959
146b
109
173b
0567
0822
479
0729b
544
0863b
0283
0411
a Weight of cattails in 104 Ibacreyr
b Fuel energy in 106 BTUacremiddot yr
Case B Conversion to District Heat Only (No Electricity) or Briquettes
The fuel energy (coal) = 569 BTUlb for grinding feedstock and 284 BTUlb for fan operashytion Both calculations assume a conversion efficiency of 30 (Assumption 96)
Assumption 98 The overall conversion efficiency of 30 at a remote coal plant includes the LHVHHV ratio for coal
Calculations for the four feedstock types are summarized in Table 93
Table 93 Grinding and exhaust fan energy requirements for conversion of peat and cattails to district heat or briquettes
Weight of Feedstock Fine Grinding Exhaust Fana
Feedstock Type ( of
Source) (104 Ibacre) HHV Fuel Energy
(106 BTUacre) ( of ~)
HHV Fuel Energy (106 BTUacre) ( of ER )
Sod Peat 990 317 180 0938 901 0469
Densified Milled Peat 960 399 227 1183 113 0591
Hydraulic Peat (35 H2O)
Cattails
682
770
218
332b
124
189c
0646
0898
621
0943c
0323
0449
a no exhaust fan energy needed for briquettes
bweight of cattails in 104 Ibacreyr
cfuel energy in 106 BTUacreyr
52
9b Electricity Generation Without District Heating
Assumption 99 The average generation plant using peat or cattails as feedstock will have a 50 megawatt electrical (MWe) output and operate with a 75 load factor The steam turbines are of the condensing type and the expected feedstockshyto-electricity conversion efficiency is 32
The feedstock LHV energy requirement = 50 x 103 kWhhr x 075032 x 24 x 365 hryr x 3413 1012BTUkWh = 350 x BTUyr
The sod hydraulic peat and cattailfeedstocks contain about 35 H20 However the densishyfied milled peat contains -50 H20 Some of the thermal energy from combustion will be required to reduce this to 35 H20 for direct comparison with the other feedstocks
Assumption 910 The thermal energy needed to reduce the H20 content of the densified milled peat from 50 to 35 corresponds to the enthalpy of evaporation of this H20 at 50o P
The weight of water to be evaporated = 320 x 10 6 x [(065050)-lJ x 096 = 922 x 105 lbacre The enthalpy of evaporation at 500 p = 10652 BTUlb Therefore the HHV fuel energy needed (85 combustion efficiency) = 922 x 105 x 10652 x 1085 x 60005284 = 131 x 109 BTUacre This fuel energy = 683 of ERbull After subtraction of the peat fuel energy required for evaporation of H20 960 - 683 = 892 of the source energy is available as feedstock in the form of 35 H20 densified milled peat
The land area requirements to provide sufficient feedstock of each type at 35 H20 to operate a 50 MWe electrical generating facility operating at 75 capacity are summarized in Table 94
Table 94 Land area requirements to provide 35 H20 peat and cattail feedstocks for electricity generation (50 MWe plant 75 load factor 32 conversion efficiency) bull
Energy in Peedstock Peedstock Type Based on HHV Based on LHV Land Area Requirement
(108 BTUacre) (acresyr)
Sod Peat 990 190 167 209
nensified Milled Peat 892 171 151 232
Hydraulic Peat 682 131 115 304
cattails 770 25700b
bIn acres on a continuous basis
9c Electrical Transmission
Assumption 911 Transmission and distribution line losses are 10 of the net electrical energy output from the generating plant (ie 90 of net electrical energy generated reaches the consumer)
9d Electricity Generation with District Heating (Cogeneration)
Assumption 912 The average generating plant using peat or cattails as feedstock will have a 35 MWe output and a 65 load factor Feedstock-to-electricity conversion efficiency is 27 and feedstock to district heat conversion efficiency is 50
53
The district heat thermal output = 35 x 5027 648 megawatt thermal (MWt) Therefore the total output (electrical + thermal) 998 MW
Assumption 913 The generating plant utilizes back pressure turbines exhausting at approxishymately 2500 F and 30 Ibin2 absolute with the thermal energy distributed to the district heating system as hot water under pressure
Assumption 914 There is a constant demand for the thermal energy consistent with the 65 load factor This permits the conversion efficiency of assumption 912
Sundberg (35) advised that the values associated with Assumptions 912 - 914 were realistic However we realize that a district heating load of 648 MWt may not occur within 30 miles of a peat or cattail source
The feedstock LHV energy requirement = 35 x 103 kWhhr x 065027 x 24 x 365 hryr x 3413 BTUkWh = 252 x 1012 BTUyr The land area requirements to provide feedstocks at 35 H20 for cogeneration (35 MWe65 MWt plant operating at 65 load factor) are 150 acresyr for sod peat 167 acresyr for densified milled peat 218 acresyr for hydraulic peat and 18400 acres on a conshytinuous basis for cattails
ge District Heating - Hot Water Reticulation
Assumption 915 The mean effective diameter (d) of hot water reticulation pipes is 18 in
Assumption 916 The effective reticulation length (1) is 15 miles
Assumption 917 The turbine pump efficiency is 75
Assumption 918 The temperature drop across the hot end of the counter-flow heat-exchanger is 150 F and the temperature of the return water in the reticulation system is 1350 F The temperature of the outflow water is 2350 F Table 95 sumshymarizes the physical parameters of outflow and return water used in disshytrict heating
Table 95 Properties of Water for District Heating
Temperature (T) Enthalpy (hf ) Specific Volume (vf) Specific Weight (wf) Viscosi ty (jl) (OF) (BTUlb) (ft31b ) (1bft 3) (1b secft2)
235 20335 001689 5921 0519xlO-5
135 10297 001627 6146 1027xlO-5
From Section 9d the thermal output = 648 MWt 614 x 104 BTUsec Based upon the foreshygoing assumptions and physical properties the flow rate of hot H20 required (Qb) 614 x 104
BTUsec x 1 Ibj[20335 - 10297) BTU x 001689 ft31b = 103 ft 3sec The mean velocity of hot water (V) 103 ft 3sec x 4lr x (1218 ft)2 = 585 ftsec The Reynolds number (Re) = Vdwfig = [585 ftsec x 18 ft12 x 5921 Ibft3][0519 x 10-5 Ib secft2 x 3216 ftsec 2 ] = 311 x 106 bull This value indicates turbulent flow The head loss (hL) = flV22 dg = [00125 x 15 x 5280 ft x 585 ftsec)2)[2 x 18 ft12 x 3216 ftsec 2 ] = 351 ft where f = 00125 for steel pipe (38 Fig 78) bull
Assumption 919 There is an additional actual head differential of 49 feet
Thus the total pumping head = 400 feet The pumping power required 103 ft 3sec x 400 ft x 5921 Ibft3 x 1075 = 326 x 10 5 ftmiddotlbsec
Assumption 920 The electric motor for pumping operates at 95 efficiency
Thus the electric power consumption = 326 x 105 ftmiddotlbsec x 3600 sechr x 3766 x 10-7
kWhftmiddotlb x 1095 = 466 kW
54
Assumption 921 The characteristics of the return water pipes are identical to those for forward flow
The return water flow rate (Qr) = Qh x (WhW r ) = 103 x 59216146 = 996 ft 3sec The return water velocity (Vr ) = 564 ftsec The Re for return flow = [(564 x 1812 x 6146)][(1027 x 10-5 x 3216) = 158 x 106bull This value indicates turbulent flow The return head loss (hLr ) [00135 x 15 x 5280 x (564)2][2 x 1812 x 3216] = 352 feet where f = 00135 (38 Fig 78)
Assumption 922 There is no additional head differential for return flow
The total pumping head = 352 feet The return water pumping power = 996 x 352 x 6146 x 1075 287 x 105 ftlbsec The electric power consumption 287 x 10 5 x 3600 x 3766 x 10-7 x 1095 410 kW Therefore the total electric power consumption for pumping (outflow and return) = 876 kW
The electrical energy for pumping 876 x 027( 35 x 103) x 100 0676 of the total LHV feedstock energy The feedstock energy for pumping 067603885 = 174 of total LHV feedstock energy using the second law efficiency of Assumption 97
There is sensible heat loss through the pipes by conduction in addition to the relatively small pumping energy calculated above This is represented by a temperature drop of the hot water between the plant heat exchanger and the consumer heat exchangers
Assumption 923 The reticulation heat loss is 10 of heat added to water at the conversion plant heat exchanger
The temperature drop due to heat loss in pipes (235-135)10 100F This heat loss is 01 x 050 x 100 500 of LHV feedstock energy
9f District Heating - No Electrical Generation
Assumption 924 The average size of the heating plant is 50 to 100 MW t with a feedstock to thermal energy conversion efficiency of 80 for peat or cattails
Assumption 925 Thermal energy is distributed in the system as hot water under pressure with total reticulation heat losses of 10 as in the cogeneration system
The heat losses in reticulation 800 of LHV feedstock energy For a 648 MWt plant the electric power for hot water reticulation pumping will be the same as for cogeneration in Section ge or 876 kW The electrical energy for pumping = 874 x (080)(648 x 10 3 ) x 100 = 108 of total LHV feedstock energy In this case we assume that the electric power is generated with a convershysion efficiency of 30 at a distance remote from coal (see Assumption 96) The equivalent coal energy for pumping = 1081030 = 360 of total LHV feedstock energy
9g Net Energy Analysis summaries for Conversion of Peat and Cattail Feedstocks to Electricity andor District Heat
The summaries in this section (Tables 96 97 and 98) follow the pattern established in Section e for feedstock conversion to SNG In contrast to Section 8 where each process step was referenced to each of six reference quantities the process steps in this section are referenced only to ER the energy content of the initial resource Summaries are given for Case A-I generashytion of electricity only from each feedstock Case A-2 generation of electricity with district heating (cogeneration) from each feedstock and Case B generation of district heat only from each feedstock These summaries are based upon the first law of thermodynamics and do not account for differences in quality between electrical and thermal energy outputs except where noted earlier (Sections 9a and gel Uniform application of the second law of thermodynamics would have substanshytially reduced the conversion efficiencies of the thermal outputs relative to the electrical outshyputs
55
Table 96 Net energy analysis summary for generation of electricity only All tabulated values are in ER unless otherwise specifieda
Sod Cattails----------- Process Component ------------shy(Description) (Symbol) Peat Milled peat Hydraulic Peat High N Low N
Feedstock delivered to conversion site 990 960 682 77 0
Energy to Reduce H20 from 50 to 35 683
Feedstock at 35 H20 (HHV) EF 990 892 682 77 0
Feedstock at 35 H20 (LHV) EF 872 785 601 650
Difference between Heating Values 118 106 81 120
Conversion Losses (68 EF) 593 534 408 442
Electricity Generated (32 EF) 279 251 192 208
Electricity for Find Grindin~ 0320 0403 0220 0319
Electricity for Exhaust Fanb 0160 0202 0110 0160
Electricity for Grinding + Fan 0480 0605 0330 0479
Electricity for Transmission
EEG-EA 274 245 189 203
Transmission Losses (10 EET) 274 245 189 203
Electricity to Consumers (90 EET) 247 221 170 183
Extra Input Energy (See Section 8) 205 127 316 1077 381
Total Energy Input ER + EX 10205 10127 10316 11077 10381
Electricity to Consumer as of ~ 242 218 165 165 176
aTo obtain absolute energy values multiply by 192 x 1010 BTUacre for peat and 210 x 108 BTUacremiddotyr for cattails
bThese values differ from those in Table 91 by the conversion efficiency 032
56
Table 97 Net energy analysis summary for electricity generation with district heating (cogeneration) All tabulated values are in ER unless otherwise specifieda
----------- Process Component ------------- Sod Cattails (Description) (Symbol) Peat Milled Peat Hydraulic Pea t High N Low N
Feedstock delivered to conversion site
Energy to Reduce H20 from 50 to 35
Feedstock at 35 H20 (HHV) EF
EnFeedstock at 35 H20 (LHV) F
Difference between Heating Values
Conversion Losses (23 Ep) EeL
Electricity Generated (27 Ep)
Thermal Energy for Reticulation (50 Ep) ETG
Electricity for Fine Grindingb
Electricity for Exhaust Fanb
Electricity for pumping as a of Ep
Electricity for pumping
Electricity for Grinding + Fan + Pumping
Electricity for Transmission ~G-EA
Transmission Losses (10 EET)
Electricity to Consumers (90 EET)
HW Reticulation Loss (10 ~G)
Thermal Energy to Consumers (90 ~G) ETC
Total Energy to Consumers (EEC+ETC)
Extra Input Energy (see Section 8)
Total Energy Input ER+Ex
Total (Energy to Consumers as of ET
990
990
872
1l8
201
235
436
0320
0160
0676
0589
107
225
225
202
436
392
595
205
10205
583
960
683
892
785
106
181
212
393
0403
0201
0676
0531
114
201
201
181
393
353
534
127
101 27
527
682
682
601
81
138
162
300
0220
0110
0676
0406
074
155
155
139
300
270
410
316
10316
397
77 0
77 0
650
120
150
176
325
0319
0160
0676
0440
092
166
166
150
325
293
442
1077 381
1l077 10381
399 426
aTo obtain absolute energy values multiply by 192 x 1010 BTDacre for peat and 210 x 108 BTDacreyr for biomass
bThese values differ from those in Table 92 by the conversion efficiency 03885
57
Table 98 Net energy analysis summary for district heating only All tabulated values are in ER unless otherwise specifieda
----------- Process Component ------------- Sod Cattails (Description) (Symbol) Peat Milled Peat Hydraulic Peat High N Low N
Feedstock site
delive~ed to conversion 990 960 682 77 0
Energy to Reduce H20 from 50 to 35 683
Feedstock at 35 H20 (HHV) EF 990 892 682 77 0
Feedstock at 35 H20 (LHV) EF 872 785 601 650
Difference between Heating Values 118 106 81 120
Conversion Losses (20 Epl 174 157 120 130
Thermal Energy for Reticulation (80 Ep) 698 628 481 520
HW Reticulation Loss (10 ETGl ~T 698 628 481 520
Thermal Energy to Consumers (90 ~l
Electricity for Fine Grindingb
Electricity for Exhaust Fanb
628
0282
0141
565
0355
0177
432
0194
0097
468
0270
0135
Electricity for pumping as of of Ep 1081 1081 1081 1081
Electricity for Pumping 0943 0849 0649 0703
Electricity for Grinding + pumping
Fan + 1366 1381 0940 1108
Equivalent Coal Energy for Grinding + Fan + Pumping EA 455 460 313 369
Extra Input energy (See Section 8) 205 127 316 1077 381
Total Energy Input ER+Ex+EA 10661 10588 10629 11446 10750
Thermal Energy to Consumers as of ET 589 534 407 409 436
aTe obtain absolute energy values multiply by 192 x 1010 BTUacre for peat and 210 x 108 BTUacremiddotyr for cattails
bThese values differ from those in Table 93 by the conversion efficiency 030
58
10 BRIQUETTING
Electricity or SNG from peat would have to be produced in a central conversion facility and distributed to users by an electrical grid or pipeline system since production of these energy forms requires technologies not easily adapted to individual households or small commercial or industrial users
Peat briquettes however are higher density lower moisture and more easily handled than finely ground peat Thus briquettes are easier to store and to burn in furnaces stoves and fireplaces This section summarizes the energy requirements for forming briquettes from peat and cattail feedstocks for utilization by consumers or institutions needing a fuel for energy production that is independent of a central conversion facility and distribution network
10a Evaporative Moisture Reduction
Assumption 101 The sod hydraulic peat and cattail feedstocks are 35 H20 The densified milled peat is 50 H20
Assumption 102 Briquettes have a residual moisture content of 10
Assumption 103 The moisture content of the feedstock is reduced to 10 by heating and evaporation using a fraction tlf of the incoming finely ground feedstock to fire a furnace to supply the needed heat
Assumption 104 The oven dry feedstock and moisture are heated from 500 F to 2l2oF for evapshyoration of H20
Assumption 105 The specific heat of oven dry feedstock is half that of water
We analyze two cases corresponding to differences in water content of the feedstock
Case A - 35 H20 feedstock The LHVs (EF) are 5284 BTUlb for peat and 4117 BTUlb for cattails If W lb of finely ground 35 H20 feedstock is delivered the corresponding weight of 10 H20 product = W x 06509 = 0722W lb The weight of water to be evaporated = 0278W (I-f) lb From steam tables 50 = 181 BTUlb 212 = 1802 BTUlb and hfg 212 = 9703 BTUlb Thus thehf hf hea t required for mchs ture reduction = W(I-f) [( 1802 - 181) (065 x (065 x 05 + 035) + 9703 x 0278] = 3792 W(l-f) BTU The fractional energy flows for this case are summarized in Figure 101
EVAPORATIVE LOSS= 085 fEF
EF (1-1) EF
f Ei 015 fE
Figure 101 The fractional energy flows in the briquetting evaporator for 35 H20 peat and cattail feedstocks
Assumption 106 The furnace has 85 thermal efficiency
The feedstock energy input for H20 reduction = 4461 W(l-f) BTU This is fraction f of the total feedstock fuel LHV For peat feedstock 5284 Wf = 4461 W(l-f)BTU and f = 00779 or 779 of EFbull Therefore EF = 9221 of Ep
For cattail feedstock 4117 Wf 4461 W(l-f) BTU and f 00978 or 978 of Ep Therefore En 9022 of E FbullF
59
LOSS -
IEF
Case B - 50 H20 feedstock This applies only to peat for which the LHV for EF = 5284 BTUlb at 35 H20 If W lb of 35 H20 feedstock is delivered then the weight of 50 H20 feedstock = W x 06505 = 1300W lb and weight of 10 H20 feedstock = W x 06509 = 0722W lb The weight of water to to evaporated in main evaporator = 0578 W(l-f) lb The heat required for moisture reduction in the main evaporator = W(1-f)[(1802 - 181) x 1300 x (05 x 05 + 05) + 9703 x 0578] = 7189 W(l-f) These flows are shown in Figure 102
EF (1- I ) E VAPORATI ON lO~~ (~85 -X )fEF-=-=---O_______1____________-M-A-1L---- (1-f) EF E F
N 50 EVAPORATOR
H20 EVAPORATlON_ XIE E FURNACE LOSS
(085-X )fE F=015 fEr ------IE 085f EfF
HEAT
XIEn----------------------------------~F
Figure 102 The fractional energy flows in the briquetting evaporator for 50 H20 peat feedstock
From Assumption 910 the fraction X of LHV fuel energy needed to reduce the feedstock from 50 to 35 H20 in the secondary evaporator is given by (X) (5284 fEF) = (13-10) x 10652 x fEp Thus X = 00605 and the thermal input to the main evaporator = 07895 fEpbull Hence 07895 f x 5284 W= 7189 W(l-f) f = 0147 or 147 of Ep Therefore EF = 853 of Ep lOb Pressing into Briquettes
Assumption 107 Briquette pressing will be carried out with a Fred Hausmann Briquettor Model FH 290200 or its equivalent with a capacity of 5000-6600 lbhr when operating on drywood residue and similar cellulose material of proper particle size not exceeding 12 H20 The recommended motor has a 150 hp rating at 900 rpm A 15 hp motor is used for the screw feeder and 1 hp for hydraulic lubrication
We assume that a capacity of 6600 lbhr of 10 H20 feedstock corresponds to full load at 166 hp The higher heating values at 10 H20 are 8308 BTUlb for peat (Section Sf) and 6750 BTUlb for cattails (Section 9a) The energy throughput for peat = 6600 lbhr x 8308 BTUlb = 548 x 107
BTUhr For cattails the energy throughput = 6600 lbhr x 6750 BTUlb = 446 x 107 BTUhr
Assumption 108 The electric motors have 95 efficiency and electricity is generated from coal at a remote site with an overall conversion efficiency of 30
The electricity consumption for briquetting = 166 hp x 2547 BTUhphr x 1095 = 445 x 105 BTUhr The electricity consumption = 0812 EF for peat and 0999 EF for cattails
lOco Transportation of Briquettes to Consumers
Assumption 109 The briquettes are transported by truck with the same characteristics as those specified in Assumptions 322 and 323
Assumption 1010 The briquettes have a specific weight greater than 1704 lbft3 bull The loads are limited to 46000 lb net
Assumption 1011 The average distance for transporting briquettes from plant to consumer is 100 miles
The fuel consumption = 100(01667 + 1572 x 10-6 x 46000 + 01667) = 406 galsround trip The fuel consumption for delivered briquettes = 406 x 14000046000 = 124 BTUlb
60
The diesel fuel for transportation of peat = 1248308 x 100 149 of EF bull For transportashytion of cattails the diesel fuel 1246750 x 100 = 183 of EF bull
Assumption 1012 There is a loss of 10 H20 material through the briquetting and transshyportation processes to the consumer of 1 (expressed as of EF )
10d Net Energy Analysis Summary for Conversion of Peat and Cattail Feedstocks to Briquettes
Table 101 summarizes the various process components in the briquetting process for the sod milled peat hydraulic peat and cattail feedstocks
Table 101 Net energy analysis summary for conversion of feedstocks to briquettes All tabulated values are in ER unless otherwise specifieda bull
----------- Process Component ------------- Sod Cattails (Description) (symbol) Peat Milled Peat Hydraulic Peat High N Low N
Feedstock as delivered (HHV)
Feedstock as delivered (LHV)shy(35 H20 or equivalent 35 H20 material)
( of Ep) Furnace and Evaporative Loss
Moisture Reduction
( of ER)
Feedstock (10 H2O) to Briquettor (HHV)
Briquetting and ( of Ep) Transportation Loss ( of ~)
Briquettes as delivered to Consumers (HHV)
Electricity for Fine Grindingb
Electricity fOr( of EF) Briquetting ( of ER)
Electricity for Grinding + Briquetting
Equivalent Coal Energy for Grinding + Briquetting
Diesel FUel for( of Ep) Transportation ( of ~)
Extra lPput Energy (See Section 8)
Total Energy Input ~+EX+EA+EBT
Energy in Briquettes ( of ET)
Ep
EF
~T
EC
EA
990
872
779
679
922
100 0922
913
0282
0812 0748
1030
343
149 137
205
10686
854
960
845
147
1243
836
100 0836
827
0355
0812 0678
1033
344
149 124
127
10596
781
682
601
779
468
635
100 0635
629
0194
0812 0516
0710
237
149 094
316
10647
591
77 0
650
978
636
706
100 0706
699
0270
0999 0706
0976
325
183 129
1077 381
11531 10835
607 646
aTe obtain absolute energy values multiply by 192 x 1010 BTUacre for peat and 210 x 108 BTUacreyr -for biomass
bThese values differ from those in Table 93 by the conversion efficiency 030
61
11 ESTIMATES OF PEAT RESOURCE LIFE
Minnesotas peat must be interpreted as a finite resource since it regenerates at only 1-2 romyr The life expectancy of the peat resource was estimated at various rates of use by starting with total available peat (Section 2a) 480 x 1016 BTU (507 x 1019 J)
Assumption 111 All of Minnesotas energ1 will be derived from peat at the current source demand rate of 127 x 10 5 BTUyr (zero energy demand growth)
Therefore the life expectancy of the peat resource ~ (480 x 1016 BTU)(127 x 1015 BTUyr) 378 years
ASSUmption 112 All of Minnesotas energy will be derived from peat but source energy demand will grow at an annual rate of 12 (24)
The life expectancy in this case can be calculated using the formula ~ = Rl x [(l+r)n-llr for n = number of years where RT = total resource Rl resource used in initial year and r = annual growth rate Rearranging (l+r)n = rRTRl + 1 Therefore (1012)n = (0012 x 480 x 1016127 x 1015 ) + 1 1454 or n = 314 years the life expectancy of the resource
Assumption 113 All of Minnesotas natural gas requirements will be met with SNG produced from Minnegascos proposed Peatgas Reactor process (see Section 7) and consumption of natural gas in Minnesota will remain constant at the 1978 rate of 310 x 1014 BTUyr (24) An SNG supply of 310 x 1014 BTUyr corresponds to approximately 850 million cubic feetday
Assumption 114 The same conditions as Assumption 113 except energy demand grows at 12yr
The percentage of the energy in the peat resource actually delivered to the consumer and so the expected resource lifetime depends on the extraction method These are summarized in Tables 111 and 112 for the energy growth rates of Assumptions 113 and 114 respectively
Table 111 Resource lifetime of peat used for SNG production at a constant rate of energy use
Peat Extraction Reference Energy to Consumers (EC) Estimated Resource Lifetime Method Section ( of ER) (1016 BTU) (years)
Densified Milled Peat 8a 486 233 753
Sod 8b 501 241 776
Hydraulic 8c 361 173 559
Table 112 Resource lifetime of peat used for SNG production at an annual energy use growth rate of 12 per year
Peat Extraction Total Ener~~ Available (~) Estimated Resource Lifetime Method (10 BTU) (rRTRl + 1) (years)
Densified Milled 233 190 540
Sod 241 193 552
Hydraulic 173 167 431
62
12 CONCLUSIONS
(a) Hydraulic mlnlng of peat is the least efficient of the three extraction methods analyzed There are three main reasons for this low energy productivity First the material losses associated with hydraulic extraction may reach 20 of the total available resource primarily due to the escape of colloids through the Stage I dewatering filters back to the reservoir Second the pumping of the peat slurry consumes large amounts of energy and of water The energy required for pumping the slurry about 29 of the energy in the available resource increases markedly with more than 2 solids Providing water to maintain a slurry at less than 2 solids may be a problem especially in dry seasons Finally the dewatering of hydraulicalshyly extracted peat may consume up to 15 of the energy in the available resource a marked contrast to the free dewatering of sod and milled peat by sun and wind
(b) Transportation is an energy intensive step in the extraction of peat by all three methods 062 of the available resource for sod peat 079 to 19 for milled peat depending upon density and 29 for hydraulic peat For this reason it is important to consider locating peat covers ion facilities as close to mining operations as possible
(c) The requirement of cattails for nitrogen and other mineral fertilizers has a large impact on the energy efficiency of using this biomass resource The nitrogen fertilizer represented 23 of the energy in the cattails at the low rate of application and 90 at the high rate Lower nitrogen requirements would greatly reduce the amount of energy required for production However for sustained high yields the nitrogen removed in the cattail biomass must be replaced on an annual basis
(d) Peatlands would have a life expectancy of less than 40 years if used as Minnesotas sole energy source under conditions of realistic growth rates of energy usage The renewability of biomass crops such as cattails offers the advantage of extending the useful life of peatlands for many years However the larger amount of land needed for growing energy crops and the resultant land disturbance partly counters this advantage This tradeoff along with the generally lower net energy values for cattails points to a need for further study Efficient equipment for harvesting cattails is required so that losses are minimized
(e) Solar energy can be used to considerable advantage in reducing the energy requirements of peat processing This is most evident in comparing sod and milled peat extraction which use free sunlight with hydraulic extraction where solar drying is not used and so the energy requireshyments are much higher
(f) In comparing energy efficiencies presented here it is important to realize that this analysis only evaluated the efficiencies of the final end-use fuel forms (1st law of thermodynamics) without comparing the differences in usability or quality (2nd law of thermodynamics) of the end-use fuel by the consumer The manufacture of briquettes for example may seem more effi shycient than the production of electricity However electricity can be used immediately for motors or lights while briquettes must be burned entailing another energy-consuming step in conversion The high net energy efficiency gained in producing briquettes may be more than lost in this additional energy conversion process
13 REFERENCES
1 Aiken RG and DS Wilson 1982 Peatland energy options systems analysis University of Minnesota Center for Urban and Regional Affairs Publ No CURA 82-2
2 Alway FJ 1920 Agricultural value and reclamation of Minnesota peat soils Minn Agric Expt Sta Bull 188
3 American Society of Agricultural Engineers 1977 ASAE Yearbook p 331 4 Anonymous 1972 Steam Its generation and use Babcock and Wilcox 38th ed 5 Baker DG Dept of Soil Science University of Minnesota Personal Communication 6 Bjork JS and W Graneli 1978 Energy reeds and the environment Ambio 7150-156 7 carncross C Western Peat Moss Company Vancouver BC Canada Personal Communication 8 Erickson RA AS Robertson DO Barron GF Harms RL Skarie and RH Rust 1980
Minnesota Soil Atlas Roseau Sheet Minn Agric Expt Sta Misc Rept 173 9 Farnham RS 1964 Peat resources of Minnesota W Central Lakes Bog St Louis Co
Minnesota Rept of Inventory No1 Iron Range Resources and Rehabilitation
63
10 Farnham RS 1975 Minnesotas peat as an energy source - quality and quantity Int Peat Soc Proc Comm II Combustion of Peat Kuopio Finland pp 25-33
11 Farnham RS 1978 Wetlands as energy sources Proc Nat Symp Wetlands Am Water Resources Assoc Orlando Florida
12 Farnham RS 1978 Energy from peat Subcommittee 8 report to the Minnesota Energy Agency Alternative Energy Research and Development Formulation Proj p 13 University of Minnesota Soil Science Dept st Paul
13 Farnham RS and HR Finney 1965 Classification and properties of organic soils Adv Agron 17115-160
14 Farnham RS and DN Grubich 1964 Peat resources of Minnesota Cook Bog St Louis Co Minnesota Rept of Inventory No2 Iron Range Resources and Rehabilitation
15 Farnham RS and DN Grubichmiddot 1966 Peat resources of Minnesota Red Lake Bog Beltrami Co Minnesota Rept of Inventory No3 Iron Range Resources and Rehabilitation
16 Farnham RS and DN Grubich 1970 Peat resources of Minnesota potentiality report Fens bog area St Louis Co Minnesota Iron Range Resources and Rehabilitation
17 Glass RL 1980 Chemical compounds in cattails useful as an energy source Final report to the Minnesota Energy Agency on alternative energy research University of Minnesota Dept of Biochemistry St Paul
18 Grubich D and RS Farnham 1972 Inventory of Minnesota peatlands 4th Int Peat Cong Helsinki Finland Vol 1461-469
19 Heichel GH 1976 Agricultural production and energy resources Amer Sci 6464-72 20 Heichel GH 1982 Energy analyses of forage production systems J Anim Sci 54869-876 21 Hirst E 1973 Energy use for food in the United States Rept no 57 Oak Ridge National
Laboratory Tennessee 22 Mesinger MC 1980 Wet carbonization of peat state-of-the-art review proc IGT Symp on
Peat as an Energy Alternative Arlington Virginia 23 Minnesota Dept of Natural Resources 1981 Minnesota peat program Final report State of
Minnesota Dept of Natural Resources Minerals Division 24 Minnesota Energy Agency 1980 Energy policy and conservation biennial report p 4-43 25 Moss DN 1977 Agricultural and wetland sources Subcommittee 5 report to the Minnesota
Energy Agency Alternative Energy Research and Development Policy Formulation Proj p 36 72 University of Minnesota Dept of Agronomy and Plant Genetics St Paul
26 Mundale SM (ed) 1981 Energy from peatlands options and impacts University of Minneshysota Center for Urban and Regional Affairs Publ No CURA 81-2
27 Myreen BM 1979 The peat fuel process Finn energy 79 Finnish Ministry of Trade and Industry
28 Pimentel D (ed) 1980 Handbook of energy utilization in agriculture CRC Press Boca Raton Florida
29 Pratt DC 1978 Cattails as an energy source Final report to the Minnesota Energy Agency program on Alternative Energy Research University of Minnesota Dept of Botany St Paul
30 Pratt DC V Bonnewell NJ Andrews and JH Kim 1980 The potential of cattails as an energy source Final report to the Minnesota Energy Agency University of Minnesota Dept of Botany St Paul
31 Rader A Consultant to Minnesota Gas Company Minneapoljs Personal Communication 32 Rader AM 1979 Synthetic natural gas from peat IampEC Prod Res and Dev 18291-296 33 Rohrer JW and B Myreen 1980 Wet carbonized peat - fuel and feedstock Proc IGT Symp
on Peat as an energy alternative Arlington Virginia 34 Skrotski BGA and WA Vopat 1960 Power station engineering and economy McGraw Hill
Book Company New York 35 Sundberg RE District Heating Projects Manager Minnesota Energy Agency Personal Communishy
cation 36 USDA 1975 Soil Conservation Service Soil Taxonomy Agr Handbook No 436 37 Vanasse R B Coupal and MI Boulos 1979 Hydraulic transport of peat moss suspensions
Can J Chem Eng 57238-241 38 Vennard JK 1947 Elementary fluid mechanics 2nd Edition John Wiley amp Sons New York
p 161
64

Copies of this publication may be obtained from Communication ResourcesDistribution 3 Coffey Hall 1420 Eckles Ave University of Minnesota St Paul MN 55108
2
TABLE OF CONTENTS
ACKNOWLEDGMENTS bullbullbullbullbullbullbullbullbullbullbullbullbullbullbullbullbullbullbullbullbullbullbullbullbullbullbullbullbullbullbullbullbullbullbullbullbullbullbullbullbullbullbullbullbullbullbullbullbullbullbullbullbullbullbullbullbullbullbullbullbullbullbullbullbullbullbullbullbullbullbullbullbullbull 6
o SUMMAAY bullbullbullbullbullbullbullbullbullbullbullbullbullbullbullbullbullbullbullbullbullbullbullbullbullbullbullbullbullbullbullbullbullbullbullbullbullbullbullbullbullbullbullbullbullbullbullbullbullbullbullbullbullbullbullbullbullbullbullbullbullbullbullbullbullbullbullbullbullbullbullbullbullbullbullbullbullbull 7
1 INTRODUCTION bullbullbullbullbullbullbullbullbullbullbullbullbullbullbullbullbullbullbullbullbullbullbullbullbullbullbullbullbullbullbullbullbullbullbullbullbullbullbullbullbullbullbullbullbullbullbullbullbullbullbullbullbullbullbullbullbullbullbullbullbullbullbullbullbullbullbullbullbullbullbullbullbull 9
la Overview of Previous Research bullbullbullbullbullbullbullbullbullbullbullbullbullbullbullbullbullbullbullbullbullbullbullbullbullbullbullbullbullbullbullbullbullbullbullbullbullbullbullbullbullbullbullbullbullbullbull 9
lb Obj ecti yes bullbullbullbullbullbullbullbullbullbullbullbullbullbullbullbullbullbullbullbullbullbullbullbullbullbullbullbullbullbullbullbullbullbullbullbullbullbullbullbullbullbullbullbullbullbullbullbullbullbullbullbullbullbullbullbull 10
lc Methods and Presentation Format bullbullbullbullbullbullbullbullbullbullbullbullbullbullbullbullbullbullbullbullbullbullbullbullbullbullbullbullbullbullbullbullbullbullbullbullbullbullbullbullbullbullbullbullbullbull 10
2 EXTENT AND ENERGY CONTENT OF PEAT AND BIOMASS RESOURCES 11
2a The Total Peat Resource 11
2b Reference Base for peat and Biomass Resources bullbullbullbullbullbullbullbullbullbullbullbullbullbullbullbullbullbullbullbullbullbullbullbullbullbullbullbullbullbullbullbullbullbullbull 11
3 CALCULATIONS FOR EXTRACTION OF MILLED PEAT bullbullbullbullbullbullbullbullbullbullbullbullbullbullbullbullbullbullbullbullbullbullbullbullbullbullbullbullbullbullbullbullbullbullbullbullbullbullbullbullbullbullbull 12
3a primary Land Drainage bullbullbullbullbullbullbullbullbullbullbullbullbullbullbullbullbullbullbullbullbullbullbullbullbullbullbullbullbullbullbullbullbullbullbullbullbullbullbullbullbullbullbullbullbullbullbullbullbullbullbullbullbullbullbullbullbullbull 12
3b Surface vegetation Clearance 13
3c Secondary Land Drainage bullbullbullbullbullbullbullbullbullbullbullbullbullbullbullbullbullbullbullbullbullbullbullbullbullbullbullbullbullbullbullbullbullbullbullbullbullbullbullbullbullbullbullbullbullbullbullbullbullbullbullbullbullbullbullbullbull 13
3d Initial Field Preparation 13
3e Milled Peat Harvest bullbullbullbullbullbullbullbullbullbullbullbullbullbullbullbullbullbullbullbullbullbullbullbullbullbullbullbullbullbullbullbullbullbullbullbullbullbullbullbullbullbullbullbullbullbullbullbullbullbullbullbullbullbullbullbullbullbullbullbull 13
3f Densification of Milled Peat bullbullbullbullbullbullbullbullbullbullbullbullbullbullbullbullbullbullbullbullbullbullbullbullbullbullbullbullbullbullbullbullbullbullbullbullbullbullbullbullbullbullbullbullbullbullbullbullbullbullbullbull 16
3g Transportation of Undensified Milled Peat 16
3h Transportation of Densified Milled Peat bullbullbullbullbullbullbullbullbullbullbullbullbullbullbullbullbullbullbullbullbullbullbullbullbullbullbullbullbullbullbullbullbullbullbull 17
3i Milled Peat Extraction Summary bullbullbullbullbullbullbullbullbullbullbullbullbullbullbullbullbullbullbullbullbullbullbullbullbullbullbullbullbullbullbullbullbullbullbullbullbullbullbullbullbullbullbullbullbullbullbullbull 17
4 CALCULATIONS FOR EXTRACTION OF SOD PEAT bullbullbullbullbullbullbullbullbullbullbullbullbullbullbullbullbullbullbullbullbullbullbullbullbullbullbullbullbullbullbullbullbullbullbullbullbullbullbullbullbullbullbullbullbullbullbull 18
4a Primary Land Drainage 18
4b surface Vegetation Clearance bullbullbullbullbullbullbullbullbullbullbullbullbullbullbullbullbullbullbullbullbullbullbullbullbullbullbullbullbullbullbullbullbullbullbullbullbullbullbullbullbullbullbullbullbullbullbullbullbull 18
4c Sod Peat Extraction and Extrusion bullbullbullbullbullbullbullbullbullbullbullbullbullbullbullbullbullbullbullbullbullbullbullbullbullbullbullbullbullbullbullbullbullbullbullbullbullbullbullbullbullbullbullbullbullbull 18
4d Field Drying of Sods 18
4e Collection of Dried Peat Sod bullbullbullbullbullbullbullbullbullbullbullbullbullbullbullbullbullbullbullbullbullbullbullbullbullbullbullbullbullbullbullbullbullbullbullbullbullbullbullbullbullbullbullbullbullbullbullbullbullbullbullbull 18
4f Sod Peat Transportation bullbullbullbullbullbullbullbullbullbullbullbullbullbullbullbullbullbullbullbullbullbullbullbullbullbullbullbullbullbullbullbullbullbullbullbullbullbullbullbullbullbullbullbullbullbullbullbullbullbullbullbullbullbullbull 19
49 Crushing and Coarse Grinding of Peat Sod bullbullbullbullbullbullbullbullbullbullbullbullbullbullbullbullbullbullbullbullbullbullbullbullbullbullbullbullbullbullbullbullbullbullbullbullbullbullbullbull 19
4h Sod Peat Extraction Summary bullbullbullbullbullbullbullbullbullbullbullbullbullbullbullbullbullbullbullbullbullbullbullbullbullbullbullbullbullbullbullbullbullbullbullbullbullbullbullbullbullbullbullbullbullbullbullbullbullbullbullbullbull 19
3
5 CALCULATIONS FOR HYDRAULIC PEAT EXTRACTION bullbullbullbullbullbullbullbullbullbullbullbullbullbullbullbullbullbullbullbullbullbullbullbullbullbullbullbullbullbullbullbullbullbullbullbullbullbullbullbullbullbullbull 20
5a preparation of a Reservoir for Wet Peat Removal bullbullbullbullbullbullbullbullbullbullbullbullbullbullbullbullbullbullbullbullbullbullbullbullbullbullbullbullbullbull 20
Sh The Hydraulic Extraction Process bullbullbullbullbullbullbullbullbullbullbullbullbullbullbullbullbullbullbullbullbullbullbullbullbullbullbullbullbullbullbullbullbullbullbullbullbullbullbullbullbullbullbullbullbullbull 21
5c Slurry pipeline bullbullbullbullbullbullbullbullbullbullbullbullbullbullbullbullbullbullbullbullbullbullbullbullbullbullbullbullbullbullbullbullbullbullbullbull 22
5d Mechanical Dewatering (Stages I and II) bullbullbullbullbullbullbullbullbullbullbullbullbullbullbullbullbullbullbullbullbullbullbullbullbullbullbullbullbullbullbullbullbullbullbullbullbullbull 22
5e Return Water Pipeline middot 23
5f Autoclave Heat Treatment bullbullbullbullbullbullbullbullbullbullbullbullbullbullbullbullbullbullbullbullbullbullbullbullbullbullbullbullbullbullbullbullbullbullbullbullbullbullbullbullbullbullbullbullbullbullbullbullbullbullbullbullbullbullbull 23
5f Autoclaving to 33SoF (35 H20) 25
5f2 Autoclaving to 2570 F (50 H20) 25
59 Mechanical Dewatering (Stage III) bullbullbullbullbullbullbullbullbullbullbullbullbullbullbullbullbullbullbullbullbullbullbullbullbullbullbullbullbullbullbullbullbullbullbullbullbullbullbullbullbullbullbullbullbullbull 26
Sh Hydraulic Peat Extraction Summary bullbullbullbullbullbullbullbullbullbullbullbullbullbullbullbullbullbullbullbullbullbullbullbullbullbullbullbullbullbullbullbullbullbullbullbullbullbullbullbullbullbullbullbullbullbull 26
6 WETLAND PRODUCTION AND HARVEST OF CATTAILS 27
6a Cattail Planting and Water Management 30
6b Nitrogen Fertilizer Manufacture bullbullbullbullbullbullbullbullbullbullbullbullbullbullbullbullbullbullbullbullbullbullbullbullbullbullbullbullbullbullbullbullbullbullbullbullbullbullbullbullbullbullbullbullbullbullbull 30
6c Phosphorus and Potassium Fertilizer Manufacture bullbullbullbullbullbullbullbullbullbullbullbullbullbullbullbullbullbullbullbullbullbullbullbullbullbullbullbullbullbullbullbullbull 31
6d Nitrogen Fertilizer Transport bullbullbullbullbullbullbullbullbullbullbullbullbullbullbullbullbullbullbullbullbullbullbullbullbullbullbullbullbullbullbullbullbullbullbullbullbullbullbullbullbullbullbullbullbullbullbullbullbull 31
6e phosphorus and potassium Fertilizer Transport bullbullbullbullbullbullbullbullbullbullbullbullbullbullbullbullbullbullbullbullbullbullbullbullbullbullbullbullbullbullbullbullbullbull 32
6pound Nitrogen Fertilizer Application bullbullbullbullbullbullbullbullbullbullbullbullbullbullbullbullbullbullbullbullbullbullbullbullbullbullbullbullbullbullbullbullbullbullbullbullbullbullbullbullbullbullbullbullbullbullbullbull 32
6g Phosphorus and Potassium Fertilizer Application bullbullbullbullbullbullbullbullbullbullbullbullbullbullbullbullbullbullbullbullbullbullbullbullbullbullbullbullbullbullbullbullbull 32
6h Cattail Photosynthesis 32
6i Leaf and Shoot Harvesting 32
6j Leaf and Shoot Drying middot 33
6k Leaf and Shoot Baling middot 33
61 Leaf and Shoot Transportation 33
6m Rhizome Harvesting bullbullbullbullbullbullbullbullbullbullbullbullbullbullbullbullbullbullbullbullbullbullbullbullbullbullbullbullbullbullbullbullbullbullbullbullbullbullbullbullbullbullbullbullbullbullbullbullbullbullbullbullbullbullbullbullbullbullbull 33
6n Root-Rhizome Drying 34
60 Collection of Dried Rhizomes 34
6p Chopping of Rhizomes bullbullbullbullbullbullbullbullbullbullbullbullbullbullbullbullbullbullbullbullbullbullbullbullbullbullbullbullbullbullbullbullbullbullbullbullbullbullbullbullbullbullbullbullbullbullbullbullbullbullbullbullbullbullbullbullbull 34
6q Rhizome Transportation 34
6r Transportation of Ash Residues or Sludge Back to Land bullbullbullbullbullbullbullbullbullbullbullbullbullbullbullbullbullbullbullbullbullbullbullbullbullbull 34
6s Cattail production Harvest and Transportation Summary bullbullbullbullbullbullbullbullbullbullbullbullbullbullbullbullbullbullbullbullbullbullbullbullbull 35
4
7 CONVERSION OF PEAT AND CATTAILS TO SYNTHETIC NATURAL GAS (SNG) 35
7a Peat and Cattails Available for Feedstock Energy bullbullbullbullbullbullbullbullbullbullbullbullbullbullbullbullbullbullbullbullbullbullbullbullbullbullbullbullbullbullbullbull 37
7b Synthetic Natural Gas Pumping Energy bullbullbullbullbullbullbullbullbullbullbullbullbullbullbullbullbullbullbullbullbullbullbullbullbullbullbullbullbullbullbullbullbullbullbullbullbullbullbullbullbullbullbullbull 37
8 NET ENERGY ANALYSES FOR CONVERSION TO SNG USING FOUR TYPES OF FEEDSTOCK bullbullbullbullbullbullbullbullbullbullbullbullbullbull 37
8a Net Energy Analysis Summary for the Densified Milled Peat shySNG Conversion Process bullbullbullbullbullbullbullbullbullbullbullbullbullbullbullbullbullbullbullbullbullbullbullbullbullbullbullbullbullbullbullbullbullbullbullbullbullbullbullbullbullbullbullbullbullbullbullbullbullbullbullbullbullbullbullbullbullbull 38
8b Net Energy Analysis Summary for the Sod Peat - SNG Conversion Process 40
8c Net Energy Analysis Summary for the Hydraulic Peat - Slurry Pipeline -Dewatering - SNG Conversion Process 42
8d Net Energy Analysis Summary for the Cattail Production - Harvest shySNG Conversion Process bullbullbullbullbullbullbullbullbullbullbullbullbullbullbullbullbullbullbullbullbullbullbullbullbullbullbullbullbullbullbullbullbullbullbullbullbullbullbullbullbullbullbullbullbullbullbullbullbullbullbullbullbullbullbullbullbullbull 44
9 CONVERSION TO ELECTRICITY ANDOR DISTRICT HEAT bullbullbullbullbullbullbullbullbullbullbullbullbullbullbullbullbullbullbullbullbullbullbullbullbullbullbullbullbullbullbullbullbullbullbullbullbullbullbull 49
9a Fine Grinding and Exhaust Fan bullbullbullbullbullbullbullbullbullbullbullbullbullbullbullbullbullbullbullbullbullbullbullbullbullbullbullbullbullbullbullbullbullbullbullbullbullbullbullbullbullbullbullbullbullbullbullbull 49
9b Electricity Generation without District Heating bullbullbullbullbullbullbullbullbullbullbullbullbullbullbullbullbullbullbullbullbullbullbullbullbullbullbullbullbullbullbullbullbull 53
ge Electrical Transmission bullbullbullbullbullbullbullbullbullbullbullbullbullbullbullbullbullbullbullbullbullbullbullbullbullbullbullbullbullbullbullbullbullbullbullbullbullbullbullbullbullbullbullbullbullbullbullbullbullbullbullbullbullbullbullbull 53
9d Electricity Generation with District Heating (Cogeneration) 53
ge District Heating Hot water Reticulation bullbullbullbullbullbullbullbullbullbullbullbullbullbullbullbullbullbullbullbullbullbullbullbullbullbullbullbullbullbullbullbullbullbullbullbullbullbullbull 54
9f District Heating - No Electrical Generation bullbullbullbullbullbullbullbullbullbullbullbullbullbullbullbullbullbullbullbullbullbullbullbullbullbullbullbullbullbullbullbullbullbullbullbullbull 55
9g Net Energy Analysis Summaries for Conversion of Peat and Cattail Feedstocks to Electricity andor District Heat bullbullbullbullbullbullbullbullbullbullbullbullbullbullbullbullbullbullbullbullbullbullbullbullbullbullbullbullbullbullbullbullbullbullbullbullbullbullbullbullbullbullbullbullbullbullbull 55
10 BRIQUETTING bullbullbullbullbullbullbullbullbullbullbullbullbullbullbullbullbullbullbullbullbullbullbullbullbullbullbullbullbullbullbullbullbullbullbullbullbullbullbullbullbullbullbullbullbullbullbullbullbullbullbullbullbullbullbullbullbullbullbullbullbullbullbullbullbullbullbullbullbullbullbullbull 59
lOa Evaporative Moisture Reduction 59
lOb Pressing into Briquettes bullbullbullbullbullbullbullbullbullbullbullbullbullbullbullbullbullbullbullbullbullbullbullbullbullbullbullbullbullbullbullbullbullbullbullbullbullbullbullbullbullbullbullbullbullbullbullbullbullbullbullbullbullbull 60
lOc Transportation of Briquettes to Consumers bullbullbullbullbullbullbullbullbullbullbullbullbullbullbullbullbullbullbullbullbullbullbullbullbullbullbullbullbullbullbullbullbullbullbullbullbull 60
lad Net Energy Analysis Summary for Conversion of Peat and Cattail Feedstocks to Briquettes bullbullbullbullbullbullbullbullbullbullbullbullbullbullbullbullbullbullbullbullbullbullbullbullbullbullbullbullbullbullbullbullbullbullbullbullbullbullbullbullbullbullbullbullbullbullbullbullbullbullbullbullbullbullbullbullbullbullbullbullbullbullbullbullbullbullbull 61
11 ESTIMATES OF PEAT RESOURCE LIFE bullbullbullbullbullbullbullbullbullbullbullbullbullbullbullbullbullbullbullbullbullbullbullbullbullbullbullbullbullbullbullbullbullbullbullbullbullbullbullbullbullbullbullbullbullbullbullbullbullbullbullbull 62
12 CONCLUSIONS bullbullbullbullbullbullbullbullbullbullbullbullbullbullbullbullbullbullbullbullbullbullbullbullbullbullbullbullbullbullbullbullbullbullbullbullbullbullbullbullbullbullbullbullbullbullbullbullbullbullbullbullbullbullbullbullbullbullbullbullbullbullbullbullbullbullbullbullbullbullbullbullbull 63
13 REFERENCES bullbullbullbullbullbullbullbullbullbullbullbullbullbullbullbullbullbullbullbullbullbullbullbullbullbullbullbullbullbullbullbullbullbullbullbullbullbullbullbullbullbullbullbullbullbullbullbullbullbullbullbullbullbullbullbullbullbullbullbullbullbullbullbullbullbullbullbullbullbullbullbull 63
5
ACKNOWLEDGMENTS
Assessment of a new source of energy is a task beyond the skill of a single individual with limited expertise Consequently this systems analysis of the energy needs for development of Minnesotas peat and peatland biomass production capabilities was an interdisciplinary research effort supported by the Minnesota Agricultural Experiment Station and the University of Minnesota Center for Urban and Regional Affairs (CURA) Roger G Aiken was a research fellow in the departshyment of mechanical engineering during this analysis with financial support from CURA This support is gratefully acknowledged Gary H Heichel US Dept of Agriculture-Agricultural Research Sershyvice and Department of Agronomy and Plant Genetics Rouse S Farnham Department of Soil Science Douglas C Pratt Department of Botany Cletus E Schertz and Ronald T Schuler Department of Agricultural Engineering contributed expertise in specific areas of peat extraction and processing and biomass (cattail) culture harvesting and processing The Minnesota Agricultural Experiment Station generously supported the publication of this research
We are grateful to numerous individuals for assistance to the authors Drs RK Crookston RV Morey EA Oelke and PJ Starr critically reviewed the manuscript T Anding T Peek and D Wilson of CORA provided counsel on interfacing this research with previous CURA efforts Debra Siegel (CURA) Julie Rinden (Agricultural Engineering) and Kay Welsch (Agronomy and Plant Genetics) typed the early drafts Gail Lotze (Agronomy and Plant Genetics) typed the final draft Kristen Kohn (College of Biological Sciences) executed much of the artwork Mary Hoff (Communication Resources) provided valuable editorial advice
Mention of commercial products or company names in this bulletin does not imply endorsement of individual firms or products The authors alone are responsible for errors or omissions in the text
6
O SUMMARY
This is the first energy systems analysis of Minnesotas peat and peatland biomass (cattail) potential The results are preliminary because of the numerous assumptions that were necessary to surmount the scarcity of data in many areas nevertheless a basic framework of knowledge was developed from which the following conclusions can be drawn
1 There are great differences in production and harvesting parameters energy productivity on a land area basis and life expectancy of resource for energy feedstocks produced by various extraction or harvesting methods (Table 01)
Table 01 A comparison of peat and biomass production and harvesting parameters for various feedstocks on a land area basis
----------------------Feedstock----------------------- shy
------------peata ___________ _ ----Cattail Biomass---shy
Hydraulic Milled Sod Leaves Characteristic Units Peat Peat Peat and Stems Whole plant
Equivalent depth harvested (ft) 50 0033 0083 per pass
Passes per year (no ) Ib 15c 12c 1 1
potential yield per acre ( T) l600d 160d 320d
per year
Harvestable energy per (l08 BTU) 192 128 320 075 210 acre per pass
Harvestable energy per (108 BTU) 192 192 384 075 210 acre per year
Time to exhaust resource (yr) 1 10 5 renewable renewable
Area to potentially yield (acres) 1 10 5 256 914 192 x 1010 BTUyr
Energy for production (t of potential 12-15 13-22 205 4-12 38-107 harvest and transport energy in
feedstock)
potential yield lost in () 20 4 1 12 23 harvest and transport
aAssume extractable peat = 5 ft bcomplete resource extracted in one pass CActual number of passes in anyone year will depend on climatic conditions for that year dAt 15 Ibft3 and 35 H20 e Oven dry basis These numbers are the amounts available for harvesting the actual yield will be smaller due to harvesting losses
2 The energy remaining in a feedstock or a fuel at a specific stage of processing varies with the method of extraction (peat) or with the cultural procedure (cattails) Comparisons of the net energy efficiencies of various feedstocks for producing various end-use fuels are summarized in Table 02
7
Table 02 Net energy analysis comparison of end use fuels for different feedstock types
Net Energy Efficiencya
Feedstock with Extraction (peat) or Cultural (Cattail) Procedure
Feedstock or Fuel Hydraulic Peat
(50 H2O)
Densified Milled Peat
(50 H2O) Sod Peat
(35 H2O) Cattail Biomass High N Low N
Feedstock as delivered to conversion plant
691 948 970 695 742
Gasification plant synthetic natural gas + byproducts
463 635 650 457 489
Synthetic natural gas consumers
to 350 480 491 358 382
Electrici ty to consumers 165 218 242 165 176
Cogeneration (elect + hot H2O) to consumers
397 527 583 399 426
District heat only (hot H2O) to consumers
407 534 589 409 436
Briquettes delivered consumers
to 591 781 854 606 645
aEnergy content in fuel product as a percentage of the potential energy in the resource plus all other (non-solar) energy requirements of extraction or culture
3 Minnesotas peat resource has an estimated life of 40 to 75 years if it is developed to provide 100 of the states total natural gas requirements (about 31 x 1014 BTUyr-l )
4 Hydraulic peat extraction required 5 to 10 times more energy input than either sod or milled peat processes for three reasons First up to 20 of the peat processed by hydraulic methods may be lost as colloids during dewatering Second pumping the peat-water slurry consumes large amounts of energy Finally dewatering consumes large amounts of fossil or peat fuel in contrast to dewatering of sod or milled peat which utilizes sunshine
5 Hydraulic peat extraction requires a ratio of 50 parts water to 1 part dry peat to produce a slurry that can be transported by pipeline More viscous slurries are not easily utilized Availability of water may limit the use of hydraulic peat processing
6 Major biomass losses will occur at harvest The design of wetland biomass harvesting equipment is in its infancy and is an important area for further research
7 water management practices necessary for cattail production in natural stands or on land previously used as a source of peat are poorly understood More information is needed on water management practices that are compatible with the implements used for planting fertilization and harvest of cattails for biomass
8 Methods of propagating cattails are poorly developed Further research is needed to determine whether rhizome residue after harvest will be sufficient for reestablishment of the crop or whether other planting methods must be used
8
9 Dewatering is the most energy-intensive step in the delivery of peat or biomass feedstock to a central conversion facility Methods to effectively use solar energy to dry peat and biomass must be developed
10 Transportation is the second most energy-intensive step in processing peat for energy Locashytion of the conversion facility near the peatland resource would reduce this component
11 Nitrogen fertilization is the second most energy-intensive step in cattail production on peatshyland The optimum method of nitrogen fertilizer application and the optimum rate of applicashytion are unknown The potential for nitrogen losses from wetlands and the role of biological nitrogen fixation in meeting biomass crop needs are also unknown Nitrogen cycling and manageshyment are important research areas for biomass crop production
12 The annual biomass productivity from cattails that can be maintained on a continual basis is unknown because of poor understanding of propagation methods harvesting methods nutrient fertilization requirements and water requirements for season-long flooding of cattail fields
1 INTRODUCTION
lao Overview of previous Research
Minnesota lacks traditional fossil energy resources such as oil and natural gas but has relatively abundant alternative energy resources of undetermined potential such as peat and wetland soils suitable for growth of biomass crops (23) The Minnesota Agricultural Experiment Station has long conducted peatland research because of the size of the resource and the challenges involved in its development Research on peatlands has included characterization and classification of peat soils and the potentials for their utilization (10 11 13) Some of the earliest research (2) was on the agricultural value and reclamation potential of peatlands Comprehensive criteria for classhysification of peat soils were developed in Minnesota (13) and have been widely adopted for organic soils classification by the USDA Soil Conservation Service (36)
Several partial inventories of Minnesota peatlands have been undertaken during the past 20 years (9 14 15 16) The only complete inventory of Minnesota peatlands and wet mineral soils was published as the Minnesota Soil Atlas Project (eg 8) The most recent evaluation (11) of uses of Minnesota peatlands found that 7 were used for agriculture and the balance were undeveloped Environmental impacts reclamation options socioeconomic considerations and policy recommendations associated with peatland utilization have been developed by the Minnesota Department of Natural Resources (DNR) Division of Minerals (23)
Baseline soils data from the Minnesota Soil Atlas Project were incorporated into the Minneshysota Land Management Information System by the State Planning Agency The University of Minnesota Center for Urban and Regional Affairs (CURA) drew upon this data base to conclude that about 8 million acres of wetlands in Minnesota were potentially useful for bioenergy production and the mining of peat for energy (26) CURA also discussed additional options for peatland use and policy implications of the various alternatives The Minnesota Energy Agency (MEA) now the Department of Energy Planning and Development has suggested a rather optimistic future for development of peatshylands as an energy resource because of the states continued dependence upon expensive imported fossil fuels Investments in peat and biomass energy crops might stimulate economic development within the state and lessen its dependence upon traditional fuel sources (24)
In contrast to conventional fossil fuels and food and fiber crops there is a scarcity of knowledge about the quantities of fossil energy resources (oil gas coal) required to produce energy from peat or to produce biomass crops on peatland soils The economic feasibility of proshyducing energy from peat or growing biomass crops on peatlands also is unknown Both energy and economic analyses are required before Minnesota citizens can benefit from the potentials of peatshylands as alternate sources of energy This report addresses only the energy needs of peatland development
9
Development of peatlands for energy and for biomass production has many important similari shyties to the contemporary use of Minnesota farmland for food and fiber production Peat (a plant product) must be extracted processed and transported to a site of utilization Wetland biomass crops must be established nourished harvested processed and transported to a site of utilizashytion Thus this energy analysis of peatland energy and biomass production is built upon principles developed for analyses of energy requirements of U~ agricultural production systems (19 20 21 28) The results address needs for information identified by MEA and CURA The analyses also reveal specific research needs that must be addressed to permit further advances in peatland develshyopment and biomass production
lb Objectives
Peatlands can provide fuel on a non-renewable or renewable basis In the first instance peat is extracted until the recoverable resource is exhausted In the second case peatland soils are used to grow a biomass crop Although the fuels that are produced may be similar in both methods the feedstocks clearly differ The methods of processing the feedstocks to produce the fuels also differ leading to several alternative technologies for extracting and processing peat and biomass to usable fuels This research is an analysis of the energy and research needs for peatland energy development and biomass production on peatlands to
1 Determine the energy inputs for peat extraction by milled sod and hydraulic methods and for transport drying or dewatering before use as a nonrenewable energy feedstock
2 Determine the energy inputs for the establishment production harvesting and transport of cattail biomass on peatlands for use as a renewable energy feedstock
3 Determine the energy inputs for conversion of peat or biomass feedstocks by the following processes conversion to synthetic natural gas direct burning for district heat direct burning for generation of electricity with or without district heat and briquetting for domestic heat
4 Determine the magnitude of the peat energy resource using current estimates of developshyable peatland and
5 Determine the expected lifetime of the peat energy resource based upon current rates of Minnesota energy consumption
lc Methods and Presentation Format
The techniques of energy modeling and net energy analysis based on the first law of thermodyshynamics were used in this research Figures 31 and 61 model the overall energy flows from source to consumer of peat and wetland biomass (cattails) respectively Each figure is divided into two parts a productionharvestingtransportation (PHT) section and a conversion section Each PHT option conceivably could be matched to any conversion method leading to a very large number of possible combinations for energy production Only a limited number were chosen for this analysis
In the case of peat (Figure 31) three extraction methods milled peat (undensified and densified) sod peat and hydraulic peat (Sections 3 4 and 5 respectively) were analyzed For hydraulic peat two different water contents were analyzed 50 (massmass hereafter mm) H20 which is adequate for gasification and 35 (mm) H20 which is about the maximum for efficient conversion by combustion One harvesting method was analyzed for cattail biomass (Figure 61) Aerial leaves and shoots and underground roots and rhizomes were removed in separate successive operations analyzed in Section 6
In Sections 7 through 10 we considered biomass and peat simultaneously as a feedstock for conversion to synthetic natural gas to electricity and district heat and to briquettes for domesshytic heat However it is difficult to make direct comparisons between biomass and peat for energy since their chemical composition H20 content and heating (calorific value) are different Section 11 provides some resource life calculations for peat
Each subsection is labeled with a number and a letter These number and letter labels are found beside the boxes on the flow diagrams and the lower case letters are also used as energy subscripts (eg Ee) on the net energy analysis summaries of Section 8 Each subsection was calculated separately from first principles to enhance the reliability of the results All assumpshy
10
tions have been carefully described and coded with numbers for evaluation and later modification The English foot-pound-second system of units has been used throughout with results given in BTUacre for peat and BTUacremiddotyear for biomass The corresponding meter kilogram Joules per hectare (Jha) and Jhamiddotyear are in parentheses
2 bull EXTENT AND ENERGY CONTENT OF PEAT AND BIOMASS RESOURCES
2a The Total Peat Resource
Assumption 21 There are 59 million acres of peatlands in Minnesota (26) but economic and environmental factors limit peatland availability for energy developshyment to 25 million acres (24)
Assumption 22 The average peat depth is 7 feet However only 5 feet can be extracted and removed without environmental damage or loss of reclamation potential
Assumption 23 Two percent of the peat volume will be lost during ditching and land preparation (12)
Assumption 24 The higher heating value (HHV) of peat is 6000 BTUlb at 35 (mm) H20 and 15 lbft3 specific weight (25)
Assumption 25 The absolute weight per unit volume of oven dry peat is the same as in situ (~ 85 H20 and 624 lbft3) peat
Usable volume per acre ~ (5280)2 ft2mile 2 x 1 mile 2640 acre x 5 ft x 098 ft3acre (149 x 104 m3ha)
Usable weight per acre 213 x 105 ft 3acre x 15 Ibft3 320 x 106 lbacre (359 x 106
kghal bull
Source energy per acre 320 x 106 Ibacre x 6000 BTUlb 192 x 1010 BTUacre (501 x 1013
Jha) bull
Total potentially usable resource available in Minnesota 192 x 1010 BTUacre x 25 x 106
acre 480 x 1016 BTU (507 x 1019 J)
2b Reference Base for Peat and Biomass Resources
To permit comparison of energy intensities and productivities among harvesting and conversion processes and between the peat and biomass resources after conversion to similar end-use fuels a reference base was established
The peat reference base [ER(peat)] is the energy available per acre (hectare) From Section 2a ER (peat) = 192 x 1010 BTUacre (501 x 1013 Jha)
Cattails were the biomass reference source From data collected by Pratt (29) and Pratt et al (30) a total plant (leaves stems rhizomes and roots) dry matter yield of 15 Tacreyr (336 metric Thayr) was assumed Forty percent of this yield (6 Tacreyr) was assumed to be above ground (stems and leaves) and 60 (9 Tacremiddotyr) below ground (roots and rhizomes) To ensure regeneration the following season about 10 (ie ~l Tacreyr) of the below-ground dry matter was assumed to be needed either for rhizome replanting in the spring or as rhizome residue in the soil at fall harvest The net dry matter yield available for energy ~ 140 Tacremiddotyr (314 metric Thamiddotyr) bull
The energy content of terrestial plants varies with species Bjork and Graneli (6) quoted 5 kWhkg (7743 BTUlb) as an average for all terrestial plants Moss (25) quoted a range of 6120-7290 BTUlb for herbaceous plants 8280-8820 BTUlb for woody plants and 15 x 106 BTUT ( 7500 BTUlb) for oven dry cattail biomass We used this latter figure and assumed it represented the calorific
11
value or HHV of the below ground (roots and rhizomes) and above ground (leaves and stems) oven dry biomass We assumed that the energy content of cattail biomass under steady-state managed condishytions = 140 Tacremiddotyr x 2000 lbT x 7500 BTUlb Therefore the biomass reference base ~ (bioshymass) 210 x 108 BTuacreyr (548 x 1011 Jhayr) The ratio shows that the peat reference base is equivalent to about 915 years of potential cattail biomass production for an equivalent land area Alternately 1 acre (hectare) of peat with 5 feet of recoverable depth is equivalent on an energy resource basis to about 915 acres (hectares) of managed cattail biomass available for harvest in 1 year
3 CALCULATIONS FOR EXTRACTION OF MILLED PEAT
Figure 31 is the flow diagram for the energy analyses of peat extraction (Sections 3 4 and 5) and conversion to synthetic natural gas (Sections 7 and 8) electricity andor district heat (Section 9) and briquettes (Section 10) Milled peat extraction involves primary and secondary land drainage surface vegetation clearance field preparation harvest and transportation in a densishyfied or undensified state In the following sections the energy requirements of each step exshypressed as a percent of the reference base ~ will be calculated
3a Primary Land Drainage
Assumption 31 The cross-sectional area of ditch required for peatland drainage is 2106 in2 (Fig 32)
1----60-----j
Figure 32 Dimensions of drainage ditch
Assumption 32 The unit draft or cutting force required for the ditching implement is 6 lbin2 bull
Assumption 33 The cutting speed = 10 mph = 147 ftsec
Assumption 34 The traction efficiency during ditching = 50 Therefore the brake horseshypower (BHP) required by the ditching implement = 6 lbin2 x 2106 in2 x 147 ftsec x 1 hp550 ft Ibsec x 105 = 674 hp
Assumption 35 The ditch spacing for primary land drainage = 120 ft Therefore the time needed to ditch 1 acre = 43560 ft2acre x 1120 ft x 1 secl47 ft = 247 secacre The work expended per acre = 674 hp x 247 secacre x 1 hr3600 sec = 463 hphracre
Assumption 36 The fuel conversion efficiency of the ditch digger 12 hpmiddothrgal of diesel fuel
Assumption 37 The energy content of No 2 diesel fuel 14 x 105 BTUgal
From the foregoing the fractional conversion efficiency of the ditchdigger = 12 hphrgal x 2547 BTUhphr x 1 gall4 x 105 BTU = 0218 A diesel engine has an optimum efficiency of about 25 to 30 However considerable time is spent in starting idling and operating at partial load The figure of 218 efficiency thus appears to be valid
12
The fuel needed for land drainage (Ea) = 463 hphracre x 10218 x 2547 BTUhpmiddothr = 541 x 104 BTUacre (141 x 108 Jha) or 0386 gal diesel fuelacre This is (541 x 104192 x 1010 ) 100 = 000028 of ERbull
3b Surface Vegetation Clearance
Assumption 38 A D9 Caterpillar bulldozer or equivalent with 200 BHP will be used
Assumption 39 The rate of vegetation clearance = 2 acrehr The work expended = 200 hp x 1 hr2 acre x 2547 BTUhphr = 255 x 105 BTUacre The fuel energy needed for surface vegetation clearance (Eb) at a fuel conversion efficiency of 218 = 117 x 106 BTUacre (305 x 109 Jha) This is (117 x 106192 x 1010 ) 100 = 000608 of ERbull
3c Secondary Land Drainage
ASSUmption 310 The interditch spacing is halved to 60 feet
Assumption 311 The ditch cross section is identical to that in assumption 31 Therefore fuel energy needed for secondary land drainage (Ec) = 541 x 104 BTUacre (141 x 108 Jha) or 000028 of ERbull
3d Initial Field Preparation
Field preparation entails leveling cambering and loosening the surface of the exposed peat
Assumption 312 Fields are prepared with a 60 BHP machine at 6 acrehr
Assumption 313 Three separate operations or passes of the above machine are needed for initial field preparation
The total work expended in three operations = 60 hp x 1 hr6 acre x 3 x 2547 BTUhphr = 764 x 104 BTUacre Since the fuel conversion efficiency is 218 the fuel energy needed for initial field preparation (Ed) = 351 x 105 BTUacre (914 x 108 Jha) This is 000182 of ERbull
3e Milled Peat Harvest
There are two operations in the harvesting of milled peat
i) Fluffing The surface centimeter of the peat is scarified and loosened for air drying
ii) Vacuum Harvesting After the fluffed peat has dried sufficiently it is harvested by a machine much like a large vacuum cleaner
Assumption 314 The fluffing operation requires energy equivalent to that of a single pass of the machine described in 3d or 117 x 105 BTUacre
Assumption 315 The vacuum harvester requires 60 BHP to vacuum a 2 m wide strip at 5 mph The work expended for a single pass = 60 hp x 43560 ft2acre x 12m x Im3281 ft x 1 hr5 miles x 1 mile5280 ft 151 hphracre = 384 x 104 BTUacre The fuel energy needed per pass at 218 conversion efficiency 176 x 105 BTUacre Thus the total fuel energy per pass for milled peat harvesting (fluffing + vacuuming) = 293 x 105 BTUacre
Assumption 316 Each fluffing and vacuuming process removes 1 cm of peat from the profile The number of harvest cycles possible over the life of the 5 feet of extractable depth 5 x 12 x 254 = 152
The fuel energy needed for milled peat harvesting over the life of the extractable peat resource (Ee) 293 x 105 x 152 = 446 x 107 BTUacre (116 x lOll Jha) This is 0232 of ERbull
13
PRODUCTION-HARVESTING-TRANSPORTATION MILLED PEAT EXTRACTION -7
G) MILLEDSECONDARY ~ FIELD
DRAINAGE ~ PREPARA1ION
SOD PEAT EXTRACTION
reg reg SOD PEAT Jd~b~G
L-8-5--H-2~Oj EXTRACT ~ TLIRNING EXTRUDE 75 WINDROWING
H20
MAKE UP
PUMP
reg
PREPARA- HYDRAULIC TION OF PEAT JSLURRY 1 _
L---_~ ~Eyen~l~TR 4 EXTRt~JION ) L PIPELINE 1---- REMOVAL PROCESSING
92H0 974 H20
reg _ RETURN
~------E_~-~ WATERPIPEUNE ~--~
Figure 31 Flow diagram for the energy analysis
~
bullbullbulle)
3510 H20
HCIsT
35H20
COLLECTION ~ TRANSshyOF
SODS
--1 WATE R f----- HYDRAULIC ( WET PEAT) EXTRACTION --7
t5d ~ ~ 75yen r---~-J)--- r-M-E-C-H-A-N-IC-A-L~ r7 AU~~i~~VE ~
DEWATERING ~ FURNACE S~E~~S r--~
(if)50 ~~----
H20 DENSIshy-t) FICATION ~- f~5--- I II-----==-= I~ TRANS- 50 ~Oreg ~ PORTATION --- -- shy
reg ~ PORTATION -i
bull
CRUSHING COARSE 35 H20 GRINDING ~-~
rs9~ DJlt~~R 35 H2
0 ~ STAGEm 1
STAGEI+lI _______
( lSO DEWATER ~~-r~-
~ AUTOCLAVE ~ PRESS ~ -I- H20 2570 F STAGEm
CFURNA E
~~----------~~ ~~------------~(
of peat extraction by milled peat sod peat or hydraulic peat processes and conversion to various end-use fuels
The dashed line is the energy flow path for utilization of 50 H20 peat and the dotted line is that for utilization of 35 H20 peat
14
CONVERSION ltsect) ltsectV ELECshy
TRICAL GENERAshy
TION NO DH
9d ELECshy
TRICAL GENERAshy
TION WITH DH
- - ------ - - - - -- - - - -- -reg- ~I~ 1G__II~_~_IN_G- ) DISTRICTI lt1Q) HEATING
I NO ELECshyI TRICALI GENERAshyI I TION I i)I I BRIQUEshy TRANSshyI TYINGbullbullbullbullbullbullbullbullbullbullbullbullbullbullbullbullbullbull- - --ltXgt-4I~t-t
FURNACE
GASIF -ICATlON
FOR SNG
TANKERI LIQUEshy- ----- - --------------reg--- I FACTION r--+---1__ shy
FOR TRUCK1ca1l~E t------~ R9fL
PORTATION I---~
SNG PIPE
PIPE ANDOR 1---iIoI
15
3f oensification of Milled Peat
Assumption 317 Vacuumed milled peat contains 50 H20 (mm)
Assumption 318 About 2 of the usable peat will be lost as dust during harvesting and a further 2 will be lost during the loading and transportation processes (26) The weight of peat recoverable for densification = 320 x 106 x 098 = 314 x 106 Ibacre at 35 H20 (mm) At 50 H20 (mm) the quantity of peat recoverable for densification 314 x 106 x (l - 035)(1 - 050)] = 408 x 106 Ibacre
Assumption 319 The air-dried 50 H20 milled peat will be densified by baling at a comshypaction ratio of about three
Assumption 320 The specific weight of undensified peat = 625 Ibft3 at 50 H20 The specific weight of the densified peat 1875 Ibft3 at 50 H20
Assumption 321 Energy required for baling or densification = 2 hpmiddothrT (3)
The fuel energy re6uired for densification (Ef ) at 218 conversion efficiency 2 h1middothrT x 1 T2000 Ib x 408 x 10 Ibacre x 2547 BTU0218 hphr 477 x 10 7 BTUacre (124 x 10 1
Jha) This is 0248 of ERbull
3g Transportation of Undensified Milled Peat
Assumption 322 The characteristics of the trucks used for transporting peat are empty weight = 27000 Ib (135 T) volume capacity 2700 ft3 maximum permitted gross load = 73000 Ib a limit set by the durability of side roads and maximum net load = 46000 lb Consequently the minimum specific weight bf peat corresponding to a capacity load = 460002700 1704 Ibft3bull
Assumption 323 There is a linear relationship between fuel consumption and net load as shown in Fig 33
E 025 - - - - - shy~020E=~~~-~=-=-=-~=-~-l -015 V) 010 - 01667 i5 005
O~__~~~______~____~~____~______~~~~ 3 4 53 6
LOAD (X 104 Ibs )
Figure 33 Fuel consumption as a function of net load
Assumption 324 The distance for peat transport = 30 miles
From Figure 33 fuel consumption = 025 galmile for a gross design load of 80000 Ib or 53000 Ib net load For an empty 27000 Ib truck the fuel consumption = 01667 galmile Fuel consumption C is given by C = 01667 + 1572 x 10-6 Lnet galmile where Lnet = net load (lb) Loads will be volume limited since the specific weight of undensified peat is 625 Ibft3bull The capacity load for undensified peat 625 Ibft3 x 2700 ft 3trip = 16900 Ibtrip and fuel consumpshytion C = 0193 galmile
16
The total fuel required for one round trip = 30 (0193 + 01667) = 108 gal The total transportation fuel required for undensified peat (Eg) = 408 x 106 Ibacre x 1 trip16900 Ib x 108 galtrip x 140000 BTUgal = 365 x 108 BTUacre (952 x lOll Jha) This is 1901 of ERbull
3h Transportation of Densified Milled Peat
The specific weight of densified peat from Assumption 320 = 1875 Ibft3 at 50 H20 The capacity load = 1875 x 2700 = 50600 Ibtrip This is greater than the maximum allowable load of 46000 lb Hence densified peatloads will be weight-limited at 46000 Ibtrip At a fuel conshysumption C = 0239 galmile the fuel for one round trip = 30 (0239 + 01667) = 122 gal The total transportation fuel required for densified peat (Eb) = 408 x 106 Ibacre x 1 trip46000 Ib x 122 galtrip x 140000 BTUgal Thus Eh 151 x 108 BTUacre (394 x lOll Jha) This is 0786 of ERbull
3i Milled Peat Extraction Summary
Table 31 summarizes the fuel requirements for each step in the harvesting of undensified and densified milled peat Note that no allowance has been made for the energy requirements of machinshyery manufacture maintenance and repair These energy requirements could be as large as 50 of the energy for operation (28)
Energy for transportation is the largest single item in the several harvesting steps Densishyfication before transportation provides a significant reduction in energy use for distances of 30 miles The break-even distance is - 7 miles
Table 31 Fuel energy inputs required for milled peat harvesting
Fuel Required of Source Process Step Symbol BTUacre Jha Energy (ER)
Primary land drainage 541 x 104 000028
Surface vegetation clearance Eb 305 x 109 000608
Secondary land drainage Ec 541 x 104 141 x 108 000028
Initial field preparation Ed 351 x 105 914 x 108 000182
Milled peat harvest Ee 446 x 107 116 x 1011 0232
oensification of milled peat Ef 477 x 107 124 x 1011 0248
Transportation - Undensified Eg 365 x 108 952 x 1011 1901
Transportation - Densified Eb 151 x 108 394 x 1011 0786
1012Total fuel - Undensified peat production- Ex 107 x 214 harvesting-transportation
Total fuel - oensified peat production- Ex 638 x 1011 127 harvesting-transportation
17
4 CALCULATIONS FOR EXTRACTION OF SOD PEAT
Sod peat extraction involves the same preliminary bog preparation used in milled peat producshytion After the surface is cleared sods are produced field-dried collected and transported and ground into a usable form The energy requirements of each step are calculated as a percent of the reference energy ER 4a Primary Land Drainage
See Section 3a The fuel energy needed (Ea) 541 x 104 BTUacre (141 x 108 Jha) which is 000028 of Ea
4b Surface vegetation Clearance
See Section 3b The fuel energy needed (Eb ) 117 x 106 BTUacre (305 x 109 Jha) which is 000608 of source energy
4c Sod Peat Extraction and Extrusion
Sod peat is harvested or extracted by a machine which slices and mixes peat from a cambered surface on the side of a ditch and then extrudes it as sods About 1 inch is ha~vested per pass
Assumption 41 The machine for sod peat extraction develops 60 BHP extrudes sod at a rate of 15 m3hr and operates at a fuel conversion efficiency = 218 Thereshyfore the fuel requirement of the machine = 60 hphr0218 hr x 2547 BTUhp hr = 701 x 105 BTUhr
Assumption 42 The extrusion process reduces the peat moisture content from 85 to 75 H20 (mm) bull
Assumption 43 The compaction ratio (CR) the ratio of the in situ to the extruded peat volume varies with amount of water extracte~by the proportionality [100 shy H20 (extruded peat)IOO - H20 (in situ peatraquo) = 53 Therefore the in situ peat extraction rate = 15 m3hr x 53 x 3531 ft3m3 = 883 ft 3hr From Section 2a the usable volume per acre = 213 x 105 ft 3 bull Therefore the total fuel energy required for extraction (Ec) = 213 x 105 ft 3acre x 1 hr883 ft3 x 701 x 105 BTUhr = 169 x 108 BTUacre (442 x lOll Jha) This is 0882 of ERbull
4d Field Drying of Sods
The extruded sods remain in the field for drying by the sun and wind They are occasionally turned to ensure uniform drying and then windrowed
Assumption 44 The sods can be field dried from 75 H20 down to 35 H20 (mm)
Assumption 45 There is no volume change in the extruded peat sods during air drying to 35 H20
Assumption 46 Turning and windrowing will be performed by a MERI Turner-Windrower powered by a 40 BHP tractor and capable of processing 250-400 m3hr of extruded peat We assume that 400 m3hr corresponds to the full tractor power
The time to process 1 acre of peat = 213 x 105 ft3acre x 35 x 1 m33531 ft3 x 1 hr400 m3
= 907 hracre Therefore the fuel energy needed for turning and windrowing (Ed) 40 hpmiddothr02l8 hr x 2547 BTUhphr x 907 hracre 424 x 106 BTUacre (110 x 1010 Jha) This is 00221 of ER 4e Collection of Dried Peat Sod
Assumption 47 A machine rated at 40kW (536 BHP) will be used to collect transport and load the dried sod into trucks We again assume that this power rating corresponds to a process rate of 400 m3hr
18
The fuel energy needed for collection and loading (Ed) = 536 hphr02l8 hr x 2547 BTUhphr x 907 hracre = 568 x 106 BTUacre (148 x 1010 Jha) This is 00296 of ERbull
4f Sod Peat Transportation
The specific weight of extruded peat at 35 H20 = 15 lbft3 x CR = 15 x 53 = 25 lbft3bull
AsSUmption 48 The truck characteristics are the same as those of Assumptions 322 to 324 At 250 lbft3 the sod peat loads will be weight limited at 46000 lbtrip
From Section 3h fuel requirement per trip = 122 gal Thus the total transportation fuel required (Efl 320 x 106 lbacre x 1 trip46000 lb x 122 galtrip x 140000 BTUgal = 119 x 108
BTUacre (309 x lOll Jha) This is 0617 of ERbull
4g Crushing and Coarse Grinding of Peat Sod
Conceivably the peat sod could be combusted on a stoker type grate for firing a boiler However most boiler furnaces use finely ground material which is blown into the furnace with a fan The resulting combustion is much more even and virtually complete As a first step towards use of sod peat in all conversion processes a crushing-coarse grinding step is needed
Assumption 49 The energy needed for crushing and coarse grinding is 5 kWhTo This is intermediate to that needed for the coarse chopping of cattail rhizomes 35 hphrsT (26 kWhT) and that needed for the fine grinding of peat for combustion or briquetting (10 kWhT) See Assumptions 632 and 91
Assumption 410 Transportation and handling losses equal 1 of the oven dry sod This leaves 320 x 106 x 099 = 317 x 106 lbacre of 35 H20 material for crushing and coarse grinding
Assumption 411 The electric motor efficiency = 95 for crushing and grinding
Assumption 412 The conversion efficiency from coal to electricity 30
The fuel energy (coal) needed for crushing and coarse grinding (Eg) 317 x 106 lbacre x 1 T2000 lb x 5 kWhT x 3413 BTUkWh x 1095 x 103 = 949 x 107 BTUacre (247 x lOll Jha) This is 0494 of ERbull
4h Sod Peat Extraction Summary
Table 41 summarizes the fuel requirements for each step in the harvesting of sod peat Note that the total diesel fuel use for harvesting and transportion of sod peat is between that for densified milled peat and undensified milled peat No allowance has been made for the energy requirements of machinery manufacture maintenance and repair
Energy for extraction and extrusion is the largest item in sod peat harvesting However energy for transportation and crushing and coarse grinding is also large The cumulative energy for extraction extrusion transportation and crushing and coarse grinding is more than 97 of the total fuel needed
No losses have been assumed during sod peat harvesting Any losses are negligible since extrusion requires a very damp raw material with good adhesion characteristics
A 1 loss of sod peat in transportation was assumed For the three harvesting procedures the transported peat as a percentage of total energy inputs is (a) sod peat 9910205 = 970 (b) densified milled peat 9610127 = 948 (c) undensified milled peat 9610214 = 940
19
Table 41 Fuel energy inputs required for sod peat harvesting
Diesel Fuel Required of Source
Process Step Symbol BTUacre Jha Energy (ER)
primary land drainage Ea 541 x 104 141 x 108 000028
Surface vegetation clearance ~ 117 x 106 305 x 109 000608
Extraction and extrusion Ec 169 x 108 442 x 1011 0882
1010Field drying of sods Ed 424 x 106 110 x 00221
106 1010Collection and loading of Ee 568 x 148 x 00296 dried peat sod
Transportation 119 x 108 309 x lOll 0617Ef
Crushingcoarse grindinga Eg 949 x 107 247 x 1011 0494
108 1012Total fuel - Sod peat harvesting Ex 394 x 103 x 205
afuel is coal
5 CALCULATIONS FOR HYDRAULIC PEAT EXTRACTION
Hydraulic peat extraction is a greatly different method than milled and sod peat extraction The peat is removed from an undrained bog and subsequently mixed with additional water from a reservoir for pipeline transport to a facility for dewatering The energy requirements of each step are calculated as a percent of the reference energy ~
Sa preparation of a Reservoir For Wet Peat Removal
Hydraulic peat extraction requires a source of water for addition to freshly removed wet peat to facilitate pumping through a pipeline to a utilization site A reservoir serves as the water source
ASSUmption 51 A 1 acre reservoir is required for every 1000 acres of peatland
Assumption 52 The reservoir will be excavated by removal of 5 acremiddotfeet of wet peat
Assumption 53 The specific weight of wet peat is 624 lbft3 bull
AsSUmption 54 Excavation of peat from the reservoir is equivalent feet to 20 feet above the initial site
to lifting the 5 acre
ASSUmption 55 The fuel to work conversion efficiency 218 is the same as in the sod and milled peat operations
The total mechanical work required to prepare a reservoir for 1000 acres == 43560 ft 2 x 5 ft x 624 lbft3 x 20 ft = 272 x 108 ftlb The mechanical work for 1 acre == 272 x 105 ftmiddotlb Therefore the fuel energy needed for reservoir preparation (Ea) = 272 x 105 ftmiddotlb02l8 acre x 1 BTU7783 ftlb = 160 x 103 BTUacre (418 x 106 Jha) This is 00000083 of ER and is clearly negligible
20
5b The Hydraulic Extraction Process
The peat is extracted by equipment on a raft floating in the reservoir Wet peat is removed by a clamshell at the end of a dragline excavator arm or by a cutter head operating at the end of a suction pipe The wet peat is lifted onto screens and filters to remove the large debris and its water content is increased to at least 97 (3 solids mm) for pumping through a slurry pipeline (7 31)
Assumption 56 The average water content of the peat-water mixture exiting the reservoir is 92 (mm) before addition of water necessary for pipeline transmission
Assumption 57 The average lift of the peat-water mixture is 15 feet
Assumption 58 The average lift plus pressure head of water used for washing and consti shytuting the slurry is 50 feet This is based upon 15 feet lift plus 35 feet head per 15 lbin2 pressure at the nozzles
Assumption 59 A slurry water content of 9725 ie a peat solids concentration (C) of 275 is required for pipeline transmission
Assumptiom 510 The mechanical efficiency of the pumps is 70
Assumption 511 The excavation rate per 8 hour day is 300 T oven dry peat
The mechanical work required to extract the 92 H20 peat = 2601 x 107 lbacre x 15 ft = 390 x 108 ftmiddotlbacre From Table 51 the weight of water for washing and increasing H20 content from 92 to 9725 (pipeline slurry consistency) = (7358 - 2393) x 106 Ibacre = 497 x 107 lbacre The pumping work required = 497 x 107 lbacre x 50 ft x 107 = 355 x 109 ftmiddotlbacre Therefore the total extraction plus pumping work = 394 x 109 ftmiddotlbacre The total extraction plus pumping power = 394 x 109 ftmiddotlbacre x 10-6 acre208 oven dry (OD) lb x 2000 lbT x 300 OD T8 hr x 1 hr3600 sec x 1 hpsec550 ftlb = 717 hp
Table 51 Water and peat solids requirements per acre to constitute wet peat and peat slurries with various water contents
Water Content ( mm)
Peat Solids Content ( mm)
(C) Water Requirement (106 Ibacre)
Total Weight (106 lbacre)
0 100 0 208a
35 65 112 320
50 50 208 416
75 25 624 832
85 15 1179 1387
92 8 2393 2601
955 45 4416 4624
9725 275 7358 7566
aoven dry
Assumption 512 All other work demands associated with the peat extraction such as manshyeuvering the raft turning the dragline controls etc consume 183 hp
21
The total power requirement of the extraction process is 90 hp It follows that the fuel energy for extraction (Eb ) ~ 90 BHP717 hp x 394 x 109 ftmiddotlbacre x 1 BTUj7783 ftmiddotlb x 10218 292 x 107 BTUacre (761 x 1010 Jha) This is 0152 of ERbull
5c Slurry Pipeline
This section was developed from material in references 6 30 and 37
Assumption 513 The slurry pipeline is 18 inches in diameter 3 miles long and operates with 75 pumping efficiency
Assumption 514 The slurry is continuously pumped from a holding tank on or near the floating raft
Assumption 515 The concentration-flow velocity relationships for our peat-water slurry are similar to those of vanasse et al (37) and are characteristic of young peat with a pronounced fibrous structure Old and strongly decomposed peat would probably behave much differently
Assumption 516 Because our pipe diameter (457 mm) is nearly lOx that used by Vanasse et al (37) the Reynolds number is also about lOx larger The resulting flow through the pipe is laminar (37) Our assumptions about flow characterisshytics appear to be justified because the rheological properties of a peat slurry with C = 275 conform to an annular model of flow in which a central peat core moves through a pipe surrounded by an annulus of clear water about 01 mm thick
Assumptions 515 and 516 are conservative and will give estimated pressure drops greater than will actually occur in practice
The pumping rate (Q) = 300 OD Tday x 100 (slurry) T275 OD T x 200 IbT x 1 ft3624 Ib x 1 day24 hr x 1 hr3600 sec = 405 ft 3 sec The average slurry velocity (V) = 405 ft3sec x 4TI ft2 x (1218)2 = 229 ftsec = 070 msec The pressure drop = 005 ft water per foot of pipe when V 07 msec and C = 275 (37) Therefore the pressure drop over the 3 mi pumping distance = 005 x 3 x 5280 = 792 ft H20
Assumption 517 There is a natural head of 108 feet over the 3 mile length of pipeline in addition to the head loss caused by the viscosity of the slurry
The total head differential (h) = 792 + 108 = 900 ft The pumping power needed = 405 ft3sec x 624 Ibft3 x 900 ft x 1075 x 1 hp550 ft Ibsec = 551 hp The fuel (diesel) energy for slurry pumping (Ec) = 550 (pump) hp90 (extract) hp x 24 (pump) hr8 (extract) hr x 292 x 107
BTUacre = 536 x 108 BTUacre (140 x 1012 Jha) This is 279 of ERbull
5d Mechanical Dewatering (Stages I and II)
Mechanical dewatering takes place in two stages The slurry is first passed over primary screens and filters which reduce the water content from 99 to about 965 (7) For a 9725 H20 slurry the primary screens reduce water content a little further The second stage uses an Ingershysoll-Rand TWin Roll Vari-Nip press which reduces water content to about 75
Assumption 518 The primary screens reduce the slurry from 9725 to 955 H20
Assumption 519 The energy consumption of the first stage primary screens and filters is negligible because they are gravity-fed
Assumption 520 The Ingersoll-Rand press operates continuously and requires 32 BHP (avershyage) from an electric motor
Assumption 521 The electric motor conversion efficiency is 95 and coal to electrical energy conversion efficiency is 30
Assumption 522 The loss of colloidal solids through the primary screens and filters is 20 of the total peat on an oven dry basis
22
Carncross (7) advised that as much as one third of the peat is lost as colloidal particles which pass through the primary screens and filters and return to the reservoir with the return water flow This figure is probably too high for the present case for two reasons First a 275 solids slurry is being pumped rather than a 1 to 15 solids slurry (7) Solid loss should be less with a more concentrated slurry Secondly colloids returned to the reservoir are likely to be picked up again with the makeup water resulting in a recycling of some of the same colloids pumped before Unrecycled colloids presumably will eventually settle out at the bottom of the reservoir and the excavated areas The colloidal loss takes place at the primary screens and filters Hence only 80 of the peat enters the mechanical presses
The fuel energy (coal for electric generation) for mechanical dewatering to 75 H~9 (Ed) = 3290 x 248 x 292 x 10 7 BTUacre x 021803 x 1095 = 238 x 10 7 BTUacre (621 x 10l1J Jha) This is 0124 of ERbull
5e Return water Pipeline
The processing of 300 T of 00 peatday in the slurry results in a return of 60 Tday of colshyloids A net 240 Tday of 00 peat reaches the presses and autoclaves The total weight of peat slurry pumped in the process (Table 51) = 300 x 7566208 10910 Tday After autoclaving and pressing to 50 H20 the total Weight of peat left = 240 x 416208 480 Tday The weight of water plus colloids returned 10910 - 480 = 10430 Tday Thus the solids concentration in the return water = 6010430 x 100 0575 After autoclaving and pressing to 35 H20 the total weight of peat left = 240 x 320208 = 370 Tday The weight of water plus colloids returned = 10910 shy370 = 10540 Tday Thus the solids concentration in return water 6010540 x 100 = 0569
Assumption 523 The characteristics of the return water pipeline are the same as those of the slurry pipeline in Assumption 513
Assumption 524 The return water is continuously pumped
Assumption 525 The effect of the colloidal solids suspended in the return water can be neglected
Thus the water viscosity (Il) = 273 x 10-5 Ibsecft2 at 50degF The pumping rate (Q) of the return volume of water = 10430 Tday x 2000 IbT x 1 ft 3624 Ib x 1 day86400 sec = 387 ft3sec The average return water velocity (V) = 387 ft) sec x 4Tf ft2 x (1218) 2 = 219 ftsec The Reynolds number Re = (VdwIlg) for this application 219 ftsec x 18 ft12 x 624 Ibft3 x 105 ft2273 lb sec x 1 sec23216 ft = 233 x 105 This value indicates a turbulent flow for which the friction factor (f) = 0017 (38) The head loss (h) = flV22 dg 0017 x 3 x 5280 ft x (219)2 ft2sec 2 x 12 x 1218 ft x 1 sec3216 ft = 134 ft
Assumption 526 There is an additional natural head difference of 166 feet for a total pumping head of 30 feet This requires a pumping power Qwhn 387 ft 3sec x 624 Ibft3 x 30 ft x 1075 x 1 hp550 ftlbsec = 176 hp
Assumption 527 The pump is driven by an electric motor with efficiency = 95 and coal to
electricity conversion efficiency 30
The fuel energy for return water pumping (E) = 17690 x 248 x 292 x 107 BTUacre x 021803 x 1095 = 131 x 10 7 BTUacre (341 x 10 0 Jha) This is 00680 of ERbull
Sf Autoclave Heat Treatment
At 75 H20 the peat is still too wet for combustion (ideal moisture content = 35 H20) or gasification ( -50 H20) The physical structure of the peat can be altered to release water more readily if it is autoclaved under pressure This process is similar to wet carbonization (22 33) except that we assume only physical (vs chemical) changes take place in the peat In wet carbonishyzation benefication of the carbon portion takes place at the expense of oxygen and nitrogen thus increasing the calorific value of the remaining solids Simple pressing after autoclaving to 1250 C (257degF) will reduce the peat to 50 H20 and to 25 H20 after autoclaving to 200degC (392oF) (30)
Assumption 528 The autoclaving temperatures corresponding to 35 H20 (for combustion) or 50 H20 (for gasification) are 170degC (338degF) and 1250 C (257oF) respecshytively
23
Assumption 529 The energy for autoclaving the water-peat mixture is given by the total change in enth~lpy between an assumed initial ambient temperature of 500 F and its final temperature of either 3380 F or 257oF We assume that there is no heat feedback or reutilization through heat exchangers
Assumption 530 The specific heat of oven dry peat is one-half that of water Because we are working with a 75-25 (mm) water-peat mixture the enthalpy values from steam tables should be multiplied by (10 x 075 + 05 x 025) = 0875
Assumption 531 The heat for autoclaving is supplied by a furnace with 85 combustion efficiency burning 35 H20 peat with a HHV = 6000 BTUlb
Assumption 532 The average hydrogen content of peat is 55 (mm) Knowledge of this value allows calculation of the lower heating value (LHV) or the practical upper limit for energy release by combustion for peat
The higher heating value (HHV) = 9231(1-x) BTUlb where x = H20 fraction (mm) of the peat The LHV = HHV - hfg [0055 x W(H20)W(H2 ) (l-xl+x] where = latent heat of H20 vapor (10652hfgBTUlb at 50oF) and W(H201 and W(H2 ) are the molecular weights of water and hydrogen respectively Hence LHV = 9231 (1 - xl - 10652 [0055 x 182 (1 - xl + x] = 8704 - 9769xBTUlb (Figure 51) For 35 H20 peat the HHV 6000 BTUlb and the LHV 5284 BTUlb
---
~
~
m ~
W ~ ~
~ 0Z ~ w
8000m 7000
6000 ~ 6000
5284
5000
4000
3000
2000
1000
0 0 10
Figure 51 Higher heating value (HHV) and lower heating value (LHV) of wet peat as a function of moisture content by weight
The enthalpy values for autoclaving a 75 H20 - 25 00 peat mixture that have been derived from steam tables and Assumption 530 are summarized in Table 52 Corresponding enthalpy differshyences for 35 H20 peat used as fuel for the autoclaves are determined by multiplying by [(100shy35)(100-75)] xl085 = 3959 (see Assumption 531) This results in values of 779 BTUlb for conversion by combustion and 556 BTUlb for conversion by gasification These numbers should be compared with the HHV (6000 BTUlb) and LHV (5284 BTUlb) of 35 H20 peat
24
Table 52 Enthalpy values for autoclaving a 75 H20 - 25 peat mixture before combustion or gasification
-----Conversion Process---shyUnits Combustion Gasification
Final H2O Content
Autoclave Temperature
Enthalpy of Water at 500 hfl
Enthalpy of Water at 2570 F hf2
Enthalpy of Water at 3380 F hf2
Enthalpy Difference for Water (hf2 -hfl )
Enthalpy Difference for 75 H20 Mixture [0875 (hf2-hfl raquo)
Fuel Energy Needed [per lb of 35 H20 peat)
degCoF
BTUlb
BTUlb
BTUlb
BTUlb
BTUlb
BTUlb
35 50
170338 125257
181 181
2257
3092
2911 2076
255 182
779 556
5fl Autoclaving to 3380 F (35 H20)
After autoclaving and pressing the peat has 35 H20 for use as fuel in the autoclave furshynace The energy flows in this operation are shown in Figure 52
68280ER 80 I PRESS1 (75 H2O) 35 H20
I 118
AUTOCLAVE 338degF
FURNACE
Figure 52 Percent ER flows for reduction of peat to 35 H20 with autoclave and press treatment
The energy needed to fuel the autoclave = 7795284 x 100 = 1474 of that in the peat fed into the autoclave However only 80 of ER gets to the autoclave with the rest lost as colloids Thus the energy needed for the autoclave furnace = 1180 of ER (Figure 52) The energy required
1012 per acre (Efl ) = 227 x 109 BTUacre (591 x Jha)
5f2 Autoclaving to 2570 F (50 H20)
The peat has 50 H20 after autoclaving and pressing Because this is too wet for efficient furnace firing a fraction X must be siphoned off for processing to 35 H20 for furnace firing as shown in Figure 53
25
AUTOCLAVE 80ER 80(1-X) r 257 OF h 80(1-X) J PR ESS I 712
75 H20) 712 FURNACE 712 (50 H20)
662X 75 AUTOCLAVE
80X 88
338degF
FURNACE
80X 88
I L1 PRESS J
88~o
(35 H2O)
I 118X =13
Figure 53 Percent ER flows for reduction of peat to 50 H20 with autoclave and press treatment
Figure 53 shows that 80X of ER is fed to the 3380 F autoclave of which 118X of ER becomes fuel for the 3380 F autoclave and the remaining 682X of ER fuel for the 2570 F autoclave From Table 52 556 BTUlb of 35 H20 peat is needed for the 2570 F autoclave Therefore the fuel energy
5565284 x 100 = 1052 of that fed to the 2570 autoclave Solving the equation 01052 x 80 (I-X) = 682X yields X = 01098 Thus the energy needed for the autoclave furnaces = 80X = (80)(01098)
1012= 88 of ER (Figure 53) The energy required per acre (Ef2 ) = 169 x 109 BTUacre (440 x Jha) bull
5g Mechanical Dewatering (Stage III)
Assumption 533 The final dewatering of the autoclaved peat is performed in an IngersollshyRand Twin Roll vari-Nip Press with the same characteristics as that used for the Stage II dewatering to 75 H20 (Assumptions 520 and 521) The total weight of 955 H20 peat fed to the presses in Stage II = (80 of 4624 x 106 Ibacre) and total weight of 75 H20 peat fed to the presses in Stage III is (80 of 832 x 106 Ibacre) This is an 82 reduction in weight
Assumption 534 The energy required to operate the presses for Stage III dewatering is only 020 that of stage II
From Section 5d and Assumption 534 the fuel energy needed for Stage III mechanical dewatershying to 50 or 35 H20 (Eg) = 238 x 107 x 020 BTUacre = 476 x 106 BTUacre (124 x 1010 Jha) This is 00248 of ERbull
5h Hydraulic Peat Extraction Summary
Table 53 summarizes the fuel requirements for each step in the hydraulic extraction of peat The energy needed for autoclaving is the largest and that for pumping the peat slurry through a pipeline the second largest The energy for autoclaving and slurry pipeline pumping together is 971 of the total fuel needs for hydraulic extraction of 50 H20 peat and 977 of the fuel needs for extracting 35 H20 peat No allowance has been made for the energy requirements of machinery manufacture maintenance and repair
No allowance has been made for the significant energy requirements of land reclamation Reclamation energy inputs following hydraulic peat extraction are likely to be substantially higher than those following sod or milled peat harvesting since hydraulic extraction results in uneven removal of peat from one area to the next so that leveling is required as the first step towards reclamation The energy requirements of reclamation will be partly affected by whether wetland biomass is produced on the reclaimed land if it is part of the reclamation energy could be discounted to the subsequent biomass production
26
For the hydraulic extraction of peat at two water contents the energy in the transported peat as a percentage of total energy inputs is
(a) Hydraulic Peat (50 H20) 712110316 690
(b) Hydraulic Peat (35 H20) 682010316 661
Table 53 Fuel energy inputs required for hydraulic peat extraction
of Source Process Step symbol Fuel Required Fuel Type Energy (ER)
03TUacre) (Jha)
Preparation of Reservoir 160 x 103 418 x 106 Diesel Negligible
1010Hydraulic Extraction Eb 292 x 107 761 x Diesel 0152
1012Slurry pipeline Pumping Ec 536 x 108 140 x Diesel 279
Mechanical Dewatering I Gravity Negligible
1010Mechanical Dewatering II Ed 238 x 107 621 x Coal 0124
1010Return Water Pumping Ee 131 x 107 341 x Coal 0068
109 1012Autoclaving to 3380 F (35) Efl 227 x 591 x Peat 1180
1012Autoclaving to 2570 F (50) Ef2 169 x 109 440 x Peat 879
Mechanical Dewatering III Eg 476 x 106 124 x 1010 Coal 00248
1012Total Fuel (Diesel) 565 x 108 147 x Diesel 294
1010TOtal Fuel (Coal) 417 x 106 109 x Coal 022
1012TOtal Fuel (Diesel + Coal) Ex 607 x 108 158 x 316
Total Fuel (35 H2O peat) Ex+Efl 288 x 109 749 x 1012 1495
109 1012TOtal Fuel (50 H2O Peat) Ex+Ef2 230 x 598 x 1194
6 WETLAND PRODUCTION AND HARVEST OF CATTAILS
Cattails have been chosen as a species for analysis of biomass production on land previously used as a peat source for two reasons first they appear to be a more prolific producer of dry biomass (and hence of energy) than other species such as phragmites sedges and woody plants Second there is an extensive body of information available on their growth and productivity in Minnesota We calculated in Section 2b that cattails may be grown to provide 140 Tacremiddotyr (314 metric Thayr) of dry matter (00) We also calculated that the Biomass Reference Base [ER(biomass)] 210 x 108 BTUacreyr (548 x lOll Jhayr)
Cattails can be used to generate electricity to generate heat as hot H20 or to produce alcohol by fermentation (Figure 61) Cattails can also be processed into briquettes using proshycedures similar to those for peat (Figure 31) Although the calculations for making briquettes from cattails are shown for the sake of completeness in Section 11 the process is excluded from Figure 61 because cattail briquettes yield less heat than those from peat
27
PRODUCTION-HARVESTING - TRANSPOR74TION
PJT MANAGE
WATER
APPLY
N FERTILIZER
I J I
ER f6i r-~------ ~~-------1
PHOTO - ~ LEAF AND SYNTHESIS SHOOT (CAllAI LS) HARVESTER
------shy~I f6I~
~ - - - - shy
TRANSPORT LEAVES
TRANSPORT 1OSS
- --t-- - HARVESTING - - -~ - - -- - ---- - TRANSPORT - - 1gt- - - - - - - -- shy I t ___ lt___ __-P~~_~IL- ~~~2_0___ -- -- -- ArSlDUEsd 1
N P+K OPTION B RHIZOME Z DRY ~ _______I
FERTlUZER FERTILIZER HARVESTING HARVESTER RHIZOMES I TRANSPORT I TRANSPORT LOSS EZL ~ I
I I I I EZ ~ I middot jl___ _J)---EQfT~I~-~---4-l---- l
L- _~____ - ___~ ______ -_ ____ lt_____ _~
_1010 EZ L I EL1 ~
N FERTIUZER MANUFACshy
TURE
I
P+K FERTILIZER
MANUFACTURE
L _ ~__ - - - - - shy
Figure 61 Flow diagram for the energy analysis of cattail production and harvesting and the conversion of cattail leaves (shoots) and rhizomes to
various end-use fuels The dotted line in the production-harvesting-transportation section of this figure identifies the flow path for replanting harvested
rhizomes (Option A) The dotted line in the conversion section of this figure identifies the uses of electricity generated by the conversion process The dashed lines in both sections of the figure identify flow paths for use of
products (eg alcohol) and byproducts (eg ash and sludge) of the conversion processes in earlier steps
28
CONVERSION
6--shy- shy E~middot-middot----------v----shy
LOSSES
---- -----------------(Y- -- - ltipound--- - --- -I
I I
FINEF~ND ~FERMENTATION FERMENTATION L_ ---l -
DISTillATION
--SLUDGE -- j r e---_ ----------------------------0----- ---lt-----~- ------ CK LCOHOL
l KER TRU - - - - - - - shy
29
6a Cattail Planting and water Management
Cattail stands can be established by either seeding or planting rhizome stock (30) It takes about 3 years for a stand to reach full maturity from seed A stand will completely regenershyate in a single year if the equivalent of 10 of the rhizomes harvested are allowed to remain this might be achieved by replanting 10 (1 Tacre) of a fully harvested rhizome crop This replanting is identified as Option A in Figure 61 and would require energy E Regeneration could also be achieved by deliberately leaving behind 10 of the rhizomes in the soil at time of harvest This is identified as Option B in Figure 61
Because ER as defined previously excludes the biomass required for regeneration of cattails E (ER + 1 Tacreyr of rhizomes for regeneration) will be used here to designate the total cattail biomass per acre
Assumption 61 Option B was chosen for this analysis because it involves no extra planting beyond establishment of the stand Amortized over many years of successful harvest the fuel energy needed for initial planting will become negligibly small
The intensive growth of cattails in natural stands or on land previously used as a source of peat will require careful water management Fossil fuels may be needed to install water control structures construct and maintain dikes install drain tile and to periodically clean perimeter drainage ditches proper drainage of the fields may be necessary to establish fertilize and harvest the stands Little information is available on the types of water management practices that may be required since they vary with the kind of implements used for each cultural practice In the absence of established principles several assumptions are necessary although they are insufshyficient to deal with all water management variables
Assumption 62 One acrefoot of water is needed to flood all areas of a cattail field to at least 1 inch depth during the growing season This allows for a level variation of about 2 feet over each flooded field New leveling technolshyogies using laser beams can achieve variations of less than 1 inch per mile hence this assumption is quite conservative unless the field is very large
Assumption 63 A total pumping head of 10 feet is needed to overcome the natural water level difference plus the head loss due to flow friction in the pipe pumping would occur in two stages First the initial flooding of the fields is required in the spring Second pumping is needed to make up the difference between evaporation and transpiration losses and normal precipishytation during the summer
Assumption 64 Evapotranspiration losses during the middle 120 days of the growing season average 020 inchday and normal precipitation during the same period is 12 inches (5)
The excess of evapotranspiration over precipitation = (120 x 02) - 12 = 12 inches The total volume of water to be pumped = 2 acre ftacreyr The work required to pump the water = 10 ft x 2 acremiddotftacreyr x 43560 ft 2acre x 624 Ibft 3 = 544 x 10 7 ftmiddotlbacremiddotyr
Assumption 65 pumping efficiency is 75 and fuel to work conversion efficiency is 218
The fuel energy needed for water management of cattail fields (Ea) = 544 x 107 ftmiddotlbacreyr x 1 BTU7783 ftmiddotlb x 1075 x 10218 = 427 x 105 BTUacreyr (111 x 109 Jhamiddotyr) This is [(427 x 105 )(210 x 108 )]100 = 0203 of ERbull
6b Nitrogen Fertilizer Manufacture
The annual nutrient uptake of cattails producing 178 oven dry Tacremiddotyr (40 oven dry metric Thayrl is 736 Ibacre (825 kghal of nitrogen (N) 108 Ibacre (121 kghal of phosphorus (P) and 496 Ibacre (556 kghal of potassium (K) (29) The actual fertilizer application needed to maintain productivity at a certain level depends on the availability of nutrients in the soil and water The
30
biological N fixation potential of the cattail ecosystem is an important variable for which we have no information
Peat soils contain about 2 N by weight (13) or 8000 lbacremiddotft Most of this N is imshymobilized and not readily available for plant uptake In agricultural soils recovery of applied N fertilizer by grain crops is about 50 to 60 due to losses by leaching and denitrification Howshyever the extent of these processes in wetlands is unknown The nutrient inflow from surrounding watershed andor ecosystem fixation is also unknown Since the energy requirement for manufacture of N fertilizers is high research on the fertilizer requirement of biomass production is needed
Assumption 66 Two values will be taken for the N fertilizer application rate A lower limit of 230 lb Nacreyr and an upper limit of 900 lb N acreyr correshysponding to the removal of 11 Tacreyr of dry matter
We assume (Sections 6i and 6m) that 11 oven dry T (5 T of leaves and 6 T of rhizomes)acreyr of the 14 tons produced are removed This corresponds to an N uptake of 455 Ibacremiddotyr If the recovery of applied N is only SO 910 Ibacremiddotyr of N would be required for production of 11 T dry matter This would appear to be an upper limit
For a lower limit we shall assume that half of the required N uptake is made available by biological fixation and release of N from the soil and all of the applied N fertilizer is utilized The lower limit is then 230 Ibacreyr of N fertilizer
Anhydrous ammonia (NH3) is the N fertilizer form requ~r~ng the least energy (21060 BTUlb N) for manufacture (28) This form will be used in our analysis The energy required for N fertilizer manufacture (lower rate) Eb (low) 21060 BTUlb x 230 Ibacre middotyr 484 x 106 BTUacreyr 1126 x 1010 Jhayr) This is 231 of ERbull The energy required for N fertilizer manufacture at the upper rate of application Eb (high) 189S x 106 BTUacreyr (494 x 10 10 Jhamiddotyr) This is 903 of
ERbull
6c Phosphorus and Potassium Fertilizer Manufacture
Assumption 67 The P and K requirements of an 11 Tacremiddotyr dry matter removal rate of cattail biomass can be met by the application of 275 lbacreyr of P20S and 301 Ibacremiddotyr of K20
Recent research suggests that P may be the limiting nutrient for cattail growth (30) The application rates corresponding to the removal of 11 Tacremiddotyr of dry matter are 120 lbacreyr of P and 2S0 lbacreyr of K These rates are equivalent to 27S lbacremiddotyr of P20S and 301 Ibacre yr of K20
Assumption 68 Ash or sludge will be trucked back from the conversion plant for reapplicashytion to the soil We assume that this recycling of inorganic material will supply 90 of the above P+K nutrient requirements needed for growth Thus the rates of fertilizer needed are reduced to 27S Ibacremiddotyr of P20S and 301 Ibacreyr of K20
Assumption 69 P20 S and K20 will be provided as normal super phosphate (0-20-0) and muriate of potash (0-0-60)
The energy requirements for the manufacture of these fertilizers are 1080 BTUlb (600 kcalkg) of P20S and 1980 BTUlb (1100 kcalkg) of K20 (28) The energy required for P+K fertilizer manufacture (Ec) = 1080 x 27S + 1980 x 301 BTUacre yr = 893 x 10 4 BTUacreyr (233 x 108 Jha yr) This is 0042S of ERbull
6d Nitrogen Fertilizer Transport
Assumption 610 N fertilizer will be transported as liquid anhydrous NH3 in tanker trucks The NH~ is 82 N The weight of NH3 transported at the lower rate of fertil~zation = 280 lbacreyr 1094 lbacremiddotyr is transported at the upper rate of fertilization
Assumption 611 The transportation distance from the NH3 manufacturing plant to the point of application is SOO miles
31
Assumption 612 Tanker trucks will be limited to 73000 lb gross weight and have other characteristics as in Assumptions 322 and 323 Therefore the net load per trip = 46000 lb and the fuel consumption per round trip = 500 (02390 + 01667) = 203 gal
For the lower rate of fertilization the fuel energy for transportation of fertilizer [Ed (low)] = 203 ~altrip x 280 lbacreyr x 1 trip46000 lb x 140000 BTUgal = 173 x 105 BTUacre yr (450 x 10 Jhayr) This is 00822 of ERbull Using similar procedures at the high rate of fertilization the fuel energy for transportation of fertilizer [Ed (high)] = 676 x 105 BTUacreyr (176 x 109 Jhayr) This is 0322 of ERbull
6e phosphorus and potassium Fertilizer Transport
Normal superphosphate (0-20-0) has 20 P205 by weight Since 275 lb P205acreyr are required (Assumption 68) 27502 1375 lbacre middotyr of superphosphate must be transported Similarly 502 lbacreyr of muriate of potash (0-0-60) must be transported to provide 301 lb K20acreyr The total P+K fertilizer weight to be transported = 188 lbacreyr
Assumption 613 The transportation assumptions used for N fertilizer Assumptions 611 and 612 apply for P and K ferti lizer
Therefore transportation fuel required (Ee) = 203 galtrip x 188 Ibacremiddotyr x 1 trip46000 lb x 140000 BTUgal 116 x 105 BTUacreyr (302 x 108 Jhamiddotyr) This is 00552 of ERbull
6f Nitrogen Fertilizer Application
Assumption 614 All N P and K fertilizer will be applied to soil in the fall
Assumption 615 N fertilizer as liquid anhydrous NH3 is applied separately from P and K and is injected directly into the soil
Assumption 616 N fertilizer is applied annually This is the rule in all other continuous monocultures such as corn wheat and sorghum
Assumption 617 The NH3 injection implement requires 420 lb pull per injection knife has a 20 inch knife spacing a 50 traction efficiency and a 218 fuel convershysion efficiency
The fuel energy required for N fertilizer in~ection (Ef) 43560 ft 2acreyr x 1220 ft x 420 Ib x 1 BTU7783 ftlb x 105 x 10218 = 129 x 10 BTUacreyr (337 x 108 Jhamiddotyr) This is 00616 of ERbull
6g Phosphorus and Potassium Fertilizer Application
Assumption 618 The spreader for P K and ash or sludge requires a tow bar force of 80 Ibft width has 50 traction efficiency and a 218 fuel conversion efficiency Assumption 614 applies as before but application of P+K is only once every 2 years at double the annual rate instead of an annual application as for N This fertilizer will be surface-applied although incorporation into the soil would promote efficiency of use
The fuel energy for P+K fertilizer application (Eg) = 43560 ft22 acreyr x 80 lbft x 1 BTUj7783 ftmiddotlb x 105 x 10218 = 205 x 104 BTUacreyr (535 x 10 7 Jhayr) This is 00978 of
ERbull
6h Cattail Photosynthesis
The total solar energy received (~) ~ 20 x 1010 BTUacremiddotyr (52 x 1013 Jha yr) for northshycentral Minnesota
The percentage of solar energy captured by the cattail biomass (14 Tacremiddotyr of dry matter) is 105 This is free energy in our analysis and does not enter further into our calculations
6i Leaf and Shoot Harvesting
32
Assumption 619 The energy requirement for leaf and shoot harvesting is 16 hphracre with a traction efficiency of 50 and fuel to work conversion efficiency of 218 (12 hphrgal)
The fuel energy requirement for leaf and shoot harvesting (Ei ) = 16 hpmiddothracremiddotyr x 2547 BTUhphr x 105 x 10218 374 x 104 BTUacreyr (975 x 107 Jhamiddotyr) This is 00178 of ERbull
Assumption 620 Of the 6 T of leaf dry matter and 8 T of rhizome dry matter available for harvesting only 5 T of leaves (833) and 6 T of rhizomes (75) are actually harvested
The leaf and shoot harves ting loss (ELL) 114 x 210 x 10 8 = 150 x 10 7 BTUacreyr (391 x 1010 Jhamiddotyr) This is 714 of ERbull
6j Leaf and Shoot Drying
Assumption 621 Growing leaves and shoots contain 85 H20 (mm) Air drying primarily before harvesting in the fall reduces this to 25 H20 For a moisture reduction from 85 to 25 H20 the drying energy per acre (from steam tables) for harvested leaves and shoots (Ej ) 568 x 107 BTUacremiddotyr (148 x lOll Jhamiddotyr) This is 2705 of ERbull Tllis drying energy is free from the sun and therefore does not enter fUrther into the analysis
6k Leaf and Shoot Baling
The weight of leaves (25 H20) for baling 5 Tacremiddotyr x 2000 IbT x 43 = 133 x 104
Ibacremiddotyr
Assumption 622 Energy required for baling 2 hpmiddothrT (3) at 218 fuel conversion efficiency
The fuel energy needed for leaf and shoot baling (~) 2 hpmiddothrT x 133 x 104 T2000 acre yr x 2547 BTUhpmiddotyr x 10218 = 156 x 105 BTUacreyr (406 x 108 Jhamiddotyr) This is 00742 of ERbull
61 Leaf and Shoot Transportation
Assumption 623 The truck characteristics are the same as those of Assumptions 322 and 323
Assumption 624 The transportation distance is 30 miles
Assumption 625 The compaction ratio during baling results in a baled specific weight greater than 1704 Ibft3bull This corresponds to a weight limited load
The transportation fuel (El ) = 133 x 104 Ibacremiddotyr x 1 trip46OOO Ib x 122 galtrip x 140000 BTUgal = 494 x 105 BTUacreyr (129 x 109 Jhamiddotyr) This is 0235 of ERbull
The transportation loss (see ASSUmption 637) is 2 for both leaves (and shoots) and rhizomes (and roots) Therefore the leaf and shoot transportation loss (~l) = 150 x 106 BTUacreyr (391 x 109 Jhamiddotyr) This is 0714 of ERbull
6m Rhizome Harvesting
Assumption 626 The energy requirement for rhizome harvesting is 7 hpmiddothracre of mechanical energy
Assumption 627 Ten percent of the rhizomes (-1 Tacremiddotyr of dry matter) is left behind as undisturbed strips for the regeneration of next years growth
The fuel energy required for rhizome harvesting (Em) 7 hphracre x 2547 BTUhpmiddothr x 10218 x 09 736 x 104 BTUacreyr (192 x 108 Jhamiddotyr) This is 00351 of ERbull
33
In Assumption 620 we assumed that an average of 6 of the 8 T dry matter of potentially harvestable rhizomes would be harvested Therefore the root and rhizome harvesting loss (EZL) 214 x 210 x 108 300 x 107 BTUacreyr (782 x 1010 Jhamiddotyr) This is 1429 of ERbull
6n Root-Rhizome Drying
Assumption 628 Rhizomes will be stacked after harvesting at the side of the field tc air dry to about 50 H20
Assumption 629 The initial H20 content of the freshly harvested rhizomes is 875
For a reduction from 875 to 50 H20 the drying energy for roots and rhizomes (En) 767 x 107 BTUacreyr (200 x lOll Jhayr) This is 3652 of ERbull As in Section 6j this drying energy is free from the sun and does not enter further into the analysis
60 Collection of Dried Rhizomes
Assumption 630 Rhizomes have a specific weight at 50 H20 (mm) of 20 Ibft3 excluding voids The rhizome biomass volume 6 x 2000 x 2 Ibacremiddotyr x 1 ft320 Ib 1200 ft3acreyr
Assumption 631 The machine described in Assumption 47 is used for collection and transshyport of rhizomes to the chopper The process rate is 400 m3hr and the machine power rating is 40 kW (536 BHP)
The fuel energy needed for collection and transportation to chopper (Eo) 1200 ft3acreyr x 1 m33531 ft 3 x 1 hr400 m3 x 536 hp0218 x 2547 BTUhphr 533 x 104 BTUacreyr (139 x 108
Jhamiddotyr) This is 00254 of ERbull
6p Chopping of Rhizomes
Assumption 632 The chopper has an energy requirement of 35 hp bull hrT with 218 fuel conversion efficiency
The fuel energy required for chopping (E ) 35 hphrT x 1 T2000 Ib x 2547 BTUhphr x 10218 x 240 x 104 Ibacremiddotyr = 491 x 105 BTJacreyr (128 x 109 Jhamiddotyr) This is 0234 of ~
6q Rhizome Transportation
Assumption 633 The chopped rhizomes are loaded directly into trucks from the chopper
Assumption 634 The truck characteristics are the same as those of Assumptions 322 and 323
Assumption 635 The specific weight of the chopped rhizomes is gt 1704 Ibft3 loads are weight limited at 46000 lb
ASSUmption 636 Transportation distance is 30 miles
The transportation fuel required (E ) = 240 x 104 Ibacreyr x 1 trip46000 Ib x 122 galtrip x 140000 BTUgal = 889 x 105 Byenuacreyr (232 x 109 Jhayr) This is 0423 of ERbull
The transportation loss (See Assumption 637) is 2 Therefore the root and rhizome transshyportation loss (EL2 ) 180 x 106 BTUacremiddotyr (469 x 109 Jhamiddotyr) This is 0857 of ERbull
The total transportation loss (BTL) ELI + EL2 330 x 106 BTUacremiddotyr (860 x 109 Jhamiddot yr) This is 157 of ERbull
6r Transportation of Ash Residues or Sludge Back to Land
Cattail leaves contain about 47 ash and rhizomes 32 ash on a dry matter basis at harvest (16) The total ash weight 2000 [5 x 0047 + 6 x 0032] 854 Ibacremiddotyr
34
Assumption 637 The loss of biomass in transportation to the conversion plant is 2 loss of ash at plant and in transportation back to land is 8 Thus potential ash loss is 10 The ash or residue actually transported bland 854 x 09 = 769 lbacremiddotyr
The the
ack to
Assumption 638 The specific weight of ash and residue is greater than 1704 lbft3bull
The ash will be transported back in some of the empty trucks returning from the conversion plants Only the difference in fuel consumption between a fully loaded and an empty truck is relevant The extra fuel consumption = 30 [02390 - 01667) = 217 galtrip Therefore the fuel energy needed for residue transportation (Er ) 769 lbacremiddotyr x 1 trip46OOO lb x 217 galtrip x 140000 BTUgal = 508 x 10 3 BTUacreyr (132 x 107 Jhamiddotyr) This is 00024 of ERbull
6s Cattail Production Harvest and Transportation Summary
Table 61 summarizes the fuel requirement for each process step in the production harVest and transportation of cattails grown for biomass on wetland This analysis shows that the energy required to manufacture N fertilizer which ranges from 23 to 90 of source energy is the largest of any of the steps The energy in cattails delivered to the conversion facility expressed as a percentage of total energy inputs depends upon the rate of N fertilization At the low rate of fertilization this value is 7710381 = 742 and 7711077 = 695 at the high rate The uncertainty about the N fertilization rates needed to sustain cattail production at 14 Tacreyr dry matter and the dependence of energy inputs on N fertilization rate suggest that research on N management and cycling in wetland biomass production deserves urgent attention
Note from Sections 6j and 6n that free solar energy used for drying would have made this step the most energy intensive with N fertilization a distant second
As in previous sections we have made no allowances for the energy requirements of machinery manufacture maintenance or repair Energy requirements of land reclamation have also been exshycluded
7 CONVERSION OF PEAT AND CATTAILS TO SYNTHETIC NATURAL GAS (SNG)
Peat and cattail feedstocks can potentially be converted into a number of different fuels and energy forms such as SNG alcohols hydrocarbon liquids electricity or steam or hot water for district heating Analysis of all of the possible combinations of feedstock types conversion methods and end-use fuels is not justified at this time Since interest is high in the potential use of peat and cattails for SNG production four specific flow paths have been analyzed in this section with SNG for home commercial and industrial use as the end product The analyses of the four specific paths correspond to four different feedstock types densified milled peat sod peat hydraulic peat (50 H20) and cattail leaves and rhizomes
This section presents calculations of the energy available from peat or cattails for use as feedstock energy (EF) as a percentage of source energy (ER) for the four different types of feedshystocks The pumping energy required for delivery of SNG from reactor to consumer is also calculated However all feedstock energy is not converted to SNG Figure 71 illustrates how EF divides among output products and losses in a peat gas reactor
PEAT GAS REACTOR COMPLEX
L_=-S~~~BENZENE-38 EB
PEAT FEEDSTOCK SNG - 524 EG
EF LIQUID - 84 ELF100 FUELS
(50 H20 Content) AMMONIA-23 EA ~----(=- SULFUR - 01 ES
Figure 71 Energy distribution and flow for the peat gas reactor
35
Table 61 Fuel energy inputs required for wetland biomass production at high (Hl and low (Ll levels of N fertilization
Fuel Required of Source Process Step Symbol BTUacreyr Jhamiddotyr Fuel Type Energy (ERl
Planting and water Management Diesel 0203
107 1010N Fertilizer (Hl 1B95 x 494 x Natural Gas 903 Manufacture (Ll 4B4 x 106 126 x 1010 Natural Gas 231
P+K Fertilizer Manufacture B93 x 104 233 x 108 Coal 0043
N Fertilizer (Hl 676 x 105 176 x 109 Diesel 0322 Transportation (Ll 173 x 105 450 x 108 Diesel 0OB2
P+K Fertilizer Transportation 302 x 108 Diesel 0055
N Fertilizer Application 337 x lOB Diesel 0062
P+K Fertilizer Application 205 x 104 535 x 107 Diesel 0010
Leaf and Shoot Harvesting 374 x 104 975 x 107 Diesel OOlB
Leaf and Shoot Baling 156 x 105 406 x 108 Diesel 0074
Leaf and Shoot Transportation 494 x 105 129 x 109 Diesel 0235
Rhizome Lifting and Cutting 192 x lOB Diesel 0035
Collection of Dried Rhizomes 533 x 104 139 x lOB Diesel 0025
Chopping of Rhizomes 491 x 105 12B x 109 Diesel 0234
Rhizome Transportation BB9 x 105 232 x 109 Diesel 0423
Ash and Residue Transportation 50B x 103 132 x 107 Diesel 0002
Total for N+P+K Fertilizer (Hl Eb(H) + Ec 190 x 107 497 x 1010 Natural Gas 907 x 1010Manufacture (Ll Eb(L) + Ec 493 x 106 129 + Coal 235
Total N+P+K Fertilizer Manufacture (H) 200 x 107 521 x 1010 Natural GasJ952 1010Transportation and Application (Ll 53B x 106 140 x Coal + Diese 256
Leaf and Shoot Harvest and Transportation 6B7 x 105 180 x 109 Diesel 0327
Rhizome and Root Harvest and Transportation 393 x 109 Diesel 0717
Total Harvest Transportation Diesel 1045
Total Nonsolar EXternal Inputs (H) 226 x 107 590 x 1010 1077 106 1010(Ll BOO x 209 x 381
Growth - Photosynthesis 210 x lOB 548 x lOll Solar 10000
Total Solar + Nonsolar Energy (Hl 233 x lOB 606 x 1011 11077 Inputs All Sources Except (Ll 21B x lOB 56B x 1011 10381 Solar Drying
107 1010Leaf and Shoot Harvesting Loss 150 x 391 x 714
1010Root and Rhizome Harvesting Loss 300 x 107 782 x 1429
Biomass Loss in Transportation ETL 330 x 106 B60 x 109 157
Total Biomass Loss 4B3 x 107 126 x lOll 2300
Biom=assEn=er 162Xl08 4 2 2 10 11 g~y--=inFeedstockfor--=Conversion=--_-=EIF-____ _ x 77 00
36
7a Peat and Cattails Available for Feedstock Energy
The energy potentially available for conversion to feedstock is given by the source energy (ER) As calculated in section 2b ER (peat) = 192 x 1010 BTUacre and ER biomass = 210 x 108
BTUacre yr The energy available as feedstock for conversion to SNG depends on the particular harvesting method
Assumption 71 Sod peat contains 35 H20 (mm) as delivered This is less than the 50 H20 feedstock for which the peatgas reactor (Figure 71) was designed However we assu~e that the percentages shown in Figure 71 will not be significantly different between 50 and 35 H20 feedstocks Water can be added if necessary to increase the H20 content
Assumption 72 The cattail feedstock will contain between 35 and 50 H20 and will conshyform to the model in Figure 71 during gasification
The amount of feedstock energy derived from each of the four feedstocks varies with the harshyvesting and transportation losses and the amount of the input feedstock used as fuel in these earlier stages The results derived using the model in Figure 71 are summarized in Table 71
Table 71 Feedstock energy (EF) as a percentage of source energy (ER) for different feedstocks
Harvesting and Transportation
Feedstock Losses Fedback Fuel Actual (Harvest Method) () (II) (BTUacre)
1010Peat (Sod) 10 990 190 x
1010Peat (Milled) 40 960 184 x
1010Peat (Hydraulic) 200 88 712 137 x
108aCattails 230 77 0 162 x
aBTUacreyr
7b Synthetic Natural Gas pumping Energy
Part of the SNG produced is consumed by the pumps required to move the SNG through the pipelines from the conversion plant to consumers According to Rader (31 32) transportation of SNG over long distances uses only about one-third as much energy as electric energy transportation which typically has a 10 dissipation loss
Assumption 73 SNG pumping energy is 333 of the energy in the gas produced or 333 x 0524 = 174 of the energy in the peat or cattail feedstock
8 NET ENERGY ANALYSES FOR CONVERSION TO SNG USING FOUR TYPES OF FEEDSTOCK
In this section energy requirements and net energy balances for conversion of the four feedstock types described above (sod peat milled peat hydraulic peat and cattails) to SNG are calculated These analyses exclude consideration of the appliance or device in which the SNG will be used and the quality matching of the end-use energy form (heat light work) to the end-use fuel (SNG in this case)
Each analysis consists of a flow chart and a tabular summary of process components in the conversion of the raw fuel source to SNG via each of the four feedstock production pathways The
37
summaries express each process component (energy input output flow or loss) as a percentage of six different base quantities Total Energy Resource (ET) Extracted or Resource Energy (ER) Feedstock Energy (EF) Product Energy Output (EO) Energy in SNG Output (EG) and Energy in SNG to Consumers (EC) Comparison of each process component with six reference quantities aids in interpretation of the results since all are currently in use and there is little unanimity among researchers on which reference base is most appropriate
8a Net Energy Analysis summary for the Densified Milled Peat - SNG Conversion Process
The model and definitions for this conversion process are shown in Figure 81
Percent of Reference Energy
Reference Energy--------------Process Component-----------------shy(Description) (Symbol) (106 BTUacre)
Total Energy Resource ~ 19460 1000 1013 1055 1575 2013 2083
EXtracted Energy ER 19210 987 1000 1042 1555 1988 2056
Feedstock Energy EF 18440 948 960 1000 1493 1908 1974
Product Energy Output EO 12360 635 643 670 1000 1279 1323
Energy in SNG Output EG 9660 497 503 524 782 1000 1034
Energy in SNG to Consumers EC 9340 480 486 507 756 967 1000
Primary Land Drainage Ea 005 00003 00003 00003 00004 00005 00005
Surface vegetation Clearance Eb 117 0006 0006 0006 0009 0012 0013
Secondary Drainage Ec 005 00003 00003 00003 00004 00005 00005
Field Preparation Ed 035 00018 00018 00019 00028 00036 00037
Milled Peat Harvest 446 0299 0232 0242 0361 0461 0477
Densification Ef 477 0245 0248 0258 0386 0493 0510
Densified Transport Eh 1511 0777 0786 0819 122 156 162
Energy Needed in Excess of that in EXtracted Peat EX 245 126 127 133 198 254 262
Harvest Dusting Loss ~1 384 197 200 208 311 397 411
Transportation Loss ~2 384 197 200 208 311 397 411
Gasification Plant Loss ~3 6090 313 317 330 493 630 651
Energy Contents of Byproducts
Liquid Fuels 1550 80 81 84 125 160 166
Benzene 701 360 365 380 567 725 750
Ammonia 424 218 221 230 343 439 454
Sulfur ES 18 009 010 010 015 019 020
SNG pipeline Pumping 322 166 168 175 261 333 345
38
PEAT GASIF1~AT10N ttO~ES lJ ELl
SQILEH 20-GASIFshy
ICATION REACTOR Ii _
FEEDSTOCK TO GASIFICATION
MATERIAL LOST IN PLANT EF TRANSPORTATION
EL2 50
----- I------~M
ESEL FUEL Ell lIOUID FUELS ELFreg BENZENE EB
W ~AMMONIA EA ~SULFUR ES
10
Figure 81 Flow diagram for the energy analysis of the densified milled peat shysynthetic natural gas conversion process
Definitions (1) Total External Energy (EX) Ea + Eb + Ec + Ed + Ee + Ef + Eh (2) Total Energy Resource (ET ) ER + EX (3) Extracted Source Energy (ER) (4) Feedstock Energy (EF ) ER - ELI - EL2 (5) Production Energy Output (EO) EF shy EL3 (6) SNG Energy Output (EG) Eo - ~F - EB - EA - ES (7) Energy on SNG to Consumers (EC) EG - Ep
8b Net Energy Analysis Summary for the Sod Peat - SNG Conversion Process
The model and definitions for this conversion process are shown in Fig 82
Percent of Reference Energy
Reference Energy--------------Process Component-----------------shy(Description) (symbol) (106 BTUacre)
Total Energy Resource ET 19600 1000 1021 1031 1539 1967 2035
Extracted Energy ER 19210 980 1000 1010 1508 1928 1994
Feedstock Energy EF 19020 970 990 1000 1493 1908 1974
Product Energy Output EO 12740 650 663 670 1000 1279 1323
Energy in SNG Output EG 9970 508 519 524 782 1000 1034
Energy in SNG to Consumers EC 9630 491 501 507 756 967 1000
primary Land Drainage Ea 005 00003 00003 00003 00004 00005 00005
Surface Vegetation Clearance Eb 117 0006 0006 0006 0009 0012 0012
Sod Peat ExtractEXtrude Ec 1695 0865 0882 0891 133 1 70 176
TurningWindrowing Ed 424 0022 0022 0022 0033 0043 0044
Collection of Sods Ee 568 0029 0030 0030 0045 0057 0059
Transportation Ef 1186 0605 0617 0624 0931 119 123
CrushingCoarse Grinding Eg 949 0484 0494 0499 0745 0952 0985
Energy Needed in EXcess of that in Extracted Peat EX 3941 201 205 207 309 395 409
Transportation Loss ELl 1921 098 100 101 151 193 199
Gasification plant Loss EL2 6280 320 327 330 493 630 651
Energy Content of Byproducts
Liquid Fuels E1F 1600 81 83 84 125 160 166
Benzene 723 369 376 380 567 725 750
Ammonia 437 223 228 230 343 439 454
Sulfur 19 010 010 010 015 019 020
SNG pipeline Pumping 332 169 173 1 75 261 333 345
40
MATERIAL lOST IN TRANSPORTATION
II UCUI FUm ELI 4BENZENE EB
01gt AMMONIA EA f-
~SUlFUR ES
Figure 82 Flow diagram for the energy analysis of the sod peat shysynthetic natural gas conversion system
Definitions (1) Total External Energy (EX) = Ea + Eb + Ec + Ed + Ee + Ef + Eh (2) Total Energy Resource (ET ) = ER + EX (3) Extracted Source Energy (ER) (4) Feedstock Energy (EF) ER - ELl (5) Production Energy Output (EO) = EF - EL2 (6) SNG Energy Output (EG) EO - ELF - EB - EA - ES (7) Energy in SNG to Consumers (EC) = EG - Ep
8c Net Energy Analysis Summary for the Hydraulic Peat - Slurry Pipeline - Dewatering - SNG Convershysion Process
The model and definitions for this conversion process are shown in Figure 83
Percent of Reference Energy
Reference Energy--------------Process Component-----------------shy(Description) (Symbol) (106 BTUacre)
Total Energy Resource ET 19820 1000 1032 1449 2162 2765 2859
Extracted Energy ~ 19210 969 1000 1404 2096 2680 2771
Feedstock Energy EF 13680 690 712 1000 1493 1908 1974
Product Energy Output EO 9170 463 477 670 1000 1279 1322
Energy in SNG Output EG 7170 362 373 524 782 1000 1034
Energy in SNG to Consumers Ec 6930 350 361 507 756 967 1000
preparation of Reservoir negligible
Extraction and processing Eb 292 0147 0152 0213 0318 0407 0421
Slurry Pipeline Pumping Ec 536 270 279 392 584 747 773
Second Stage Dewatering Ed 238 0120 0124 0174 0260 0332 0343
Return Water Pumping Ee 131 0066 0068 0095 0142 0182 0188
Third Stage Dewatering Eg 48 0024 0025 0035 0052 0066 0069
Energy Needed in Excess of that in Extracted Peat EX 607 306 316 444 662 847 876
Colloidal Loss ~1 3840 194 200 281 419 536 554
Fuel for Autoclave Furnaces Ef 1690 852 879 123 184 235 243
Gasification Plant Losses 4510 228 235 3330 493 630 651
Energy Content of Byproducts
Liquid Fuels 1150 580 598 840 125 160 166
Benzene 520 262 271 380 567 725 750
Ammonia 315 159 164 230 343 439 454
Sulfur 137 0069 0071 0100 0149 0191 0197
SNG pipeline pumping 237 119 123 173 258 330 341
42
w
LlaUID FUELS ELF
BENZENE Ea ~AMMOHIA EA
~SULFUR ES
Figure 83 Flow diagram for the energy analysis of the hydraulic peat shysynthetic natural gas conversion system
Defini tions (1) Total External Energy (EX) = + Eb + Ec + Ed + + Eh (2) Total Energy Resource (ET ) = ER + + EX (3) Extracted Source Energy (~) (4) Feedstock Energy (EF) = ER - ELl - Ef (5) Production Energy Output (EO) EF - EL2 (6) SNG Energy Output (EG) = EO - ELF - EB - EA - ES (7) Energy in SNG to Consumers (Ee) = EG - Ep
8d Net Energy Analysis Summary for the Cattail Production - Harvest - SNG Conversion Process
The model and definitions for this conversion process are shown in Fig 84 and the calculashytions are summarized in Tables 8d-l and ad-2 They differ in three important ways from the process alternatives shown in Figure 61
(i) Figure 61 shows the leaf and shoot feedstock being used for combustion to cogenerate electricity and hot water for process or district heat while the rhizome feedstock is being fed to a fermentation and distillation plant for the production of alcohol In comparison Figure 84 shows both leaf and rhizome feedstock as input to a gasification reactor so that a comparison with the peat feedstocks may be made
(ii) In Figure 61 part of the alcohol produced is fed back to fuel the production harvestshying and transportation machinery in place of diesel fuel All machinery is assumed to be fueled by diesel in Figure 84 because no alcohol is produced
(iii) In Figure 84 all of the ammonia byproduct (EA) is fed back to supply part of the N fertilizer requirements (~) Part of the liquid fuels output (ELF) could presumably also have been fed back This was not done since the composition of the liquid fuels was not known
The major assumption made in this analysis is that the cattail feedstock will behave identi shycally to peat feedstock to give the same ratio of SNG to byproducts and losses This of course will not be the case but in the absence of any better information this analysis is the best possible with the data that are available Note that the diesel fuel now required for N fertilizer transport is no longer Ed based on a 500 mile transportation distance but Ed = Ed (500 Eb + 30 EA)500 Eb based on the relative quantities of manufactured and fedback anhydrous ammonia transported over distances of 500 and 30 miles respectively
Table ad-l Net energy analysis summary for the low rate of N fertilizer application
Percent of Reference Energy
Reference Energy--------------Process Component----------------- shy(Description) (Symbol) (106 BTUacre)
TOtal Energy Resource ET 21420 1000 1020 1324 2047 2528 2615
Available Biomass Energy Resource ~ 21000 981 1000 1299 2007 2478 2564
Feedstock Energy EF 16170 755 770 1000 1546 1908 1974
Product Energy from plant EO 10830 506 516 670 1036 1279 1323
Product Energy Output EO 10460 489 498 647 1000 1235 1277
Energy in SNG Output EG 8470 396 403 524 810 1000 1034
Energy in SNG to Consumers EC 8190 382 390 507 783 967 1000
Planting and Water Management Ea 427 0199 0203 0264 0408 0504 0521
N Fertilizer Needed
NH3 Fed-back
Et
EA
4844
3719 1 74
231
177
300
230
463
356
572
439
591
454
N Fertilizer Manufacture
P+K Fertilizer Manufacture
Eb
Ec
1125
893
0525
0042
0536
0043
0696
0055
108
0085
133
0105
137
0109
44
Table 8d-l (continued) Net energy analysis summary for the low rate of N fertilizer application
Percent of Reference Energy
Reference Energy--------------Process Component-----------------shy(Description) (Symbol) (106 BTUacre)
N Fertilizer Transport no NH3 Fedback Ed 173 0081 0082 0107 0165 0204 0211
N Fertilizer Transport NH3 Fedback Ed 481 0022 0023 0030 0046 0057 0059
P+K Fertilizer Transport Ee 116 0054 0055 0072 0111 0137 0141
N Fertilizer Application Ef 129 0060 0062 0080 0124 0153 0158
P+K Fertilizer Application Eg 205 0010 0010 0013 0020 0024 0025
Leaf and Shoot Harvest Ei 374 0017 0018 0023 0036 0044 0046
Leaf and Shoot Baling Ek 156 0073 0074 0096 0149 0184 0190
Leaf and Shoot Transport El 494 0231 0235 0305 0472 0583 0603
Rhizome Harvester Em 736 0034 0035 0046 0070 0087 0090
Rhizome Collection Eo 533 0025 0025 0033 0051 0063 0065
Rhizome Chopping Ep 491 0229 0234 0303 0467 0579 0599
Rhizome Transport Eq 889 0415 0423 0550 0850 1049 1085
Ash amp Residue Transport Er 051 0002 0002 0003 0005 0006 0006
Energy Needed in Excess of that in Biomass EX 416 194 198 257 397 490 507
Leaf and Shoot Harvest Loss ELL 1500 700 714 928 143 177 183
Root and Rhizome Harvest Loss 3000 140 143 186 287 354 366
Total Biomass Transport Loss ELl + EL2 330 154 157 204 315 390 403
Total Biomass Loss EBL 4830 226 230 299 462 570 590
Gasification Plant Loss EL3 5340 249 254 330 510 630 652
Energy Content of Byproducts
Liquid Fuels ~F 1360 634 647 840 130 160 166
Benzene 614 287 293 380 587 725 750
Ammonia (Fedback) 372 1 74 177 230 356 484 454
Sulfur 162 0076 0077 0100 0155 0191 0198
SNG pipeline Pumping Epp 282 132 134 1 75 270 333 345
45
Table 8d-2 Net energy analysis summary for the high rate of N fertilizer application
Percent of Reference Energy
Reference Energy--------------process Component----------------- shy(Description) (Symbol) (106 BTUacre)
Total Energy Resource 22880 1000 1089 1415 2187 2700 2793
Available Biomass Energy Resource
-21000 918 1000 1299 2007 2478 2564
Feedstock Energy 16170 707 77 0 1000 1546 1908 1974
Product Energy from Plant 10830 474 516 670 1036 1279 1323
Product Energy Output Eo 10460 457 498 647 1000 1235 1277
Energy in SNG output 8470 370 403 524 810 1000 1034
Energy in SNG to Consumers 8190 358 390 507 783 967 1000
Planting and Water Management 427 0187 0203 0264 0408 0504 0521
N Fertilizer Needed 1896 829 903 11 72 1812 2237 2314
NH3 Fed-back 372 163 177 230 356 439 454
N Fertilizer Manufacture E 1524 666 726 942 1456 1798 1860b
P+K Fertilizer Manufacture 893 0039 0043 0055 0085 0105 0109
N Fertilizer Transport no NH3 Fedback 676 0295 0322 0418 0646 0798 0825
N Fertilizer Transport NH3 Fedback E 551 0241 0262 0341 0527 0650 0673d
P+K Fertilizer Transport 116 0051 0055 0072 0111 0137 0142
N Fertilizer Application 129 0057 0062 0080 0124 0153 0158
P+K Fertilizer Application 205 0009 0010 0013 0020 0024 0025
Leaf and Shoot Harvest 374 0016 0018 0023 0036 0044 0046
Leaf and Shoot Baling 156 0068 0074 0096 0149 0184 0190
Leaf and Shoot Transport 494 0216 0235 0306 0472 0583 0603
Rhizome Harvester 736 0032 0035 0046 0070 0087 0090
Rhizome Collection 533 0023 0025 0033 0051 0063 0065
491 0215 0234 0303 0469 0579 0599Rhizome Chopping
Rhizome Transport 889 0389 0423 0550 0850 1049 1085
Ash amp Residue Transport 051 0002 0002 0003 0005 0006 0006
46
Table 8d-2 (continued) Net energy analysis summary for the high rate of N fertilizer application
Reference Energy--------------Process Component-----------------shy(Description) (Symbol) (106 BTUacre) ET EF E EC0
Energy Needed in Excess of that in Biomass EX 1877 820 894 116 179 222 229
Leaf and Shoot Harvesting Loss ~ 1500 656 714 928 143 177 183
Root and Rhizome Harvest Loss EZL 3000 131 143 186 287 354 366
Total Biomass Transport Loss ~1 + ~2 330 144 157 204 315 390 403
Total Biomass Loss EBL 4830 211 230 299 462 570 590
Gasification Plant Loss ~3 5340 233 254 330 510 630 651
Energy Content of Byproducts
Liquid Fuels ~F 1360 594 647 840 130 160 166
Benzene EB 614 268 292 380 587 725 750
Ammonia (Total) EA 372 163 177 230 356 439 454
Sulfur ES 162 0071 0077 0100 0155 0191 0198
SNG pipeline pumping Epp 282 123 134 175 270 333 345
47
oigt OJ
Eb 10 EZ
FEEDSTOCK BIOMASS GASIFICATION PLANT TO GASIFICATION PLANT Igt yen LOSSES EL3
EF
~ SNG PtPiLM
------lOOO LIQUID FUELS ELF
I IIQsectI BENZENE EB EA
Lshy______()cent SULFUR ES
Figure 84 Flow diagram for the energy analysis of the cattail production shysynthetic natural gas conversion system
Definitions (1) Total External Energy (EX) (E + Eb+ Ec + Ed + Ee + Ef + Eg + Ei + Ek + Em + Eoa + Ep + Eq + Er
(2) Total Energy Resource (ET ) (EL + ELL) + (EZ + EZL + 01 E~) + EX = El + El + EX = El + E
(3) Extractea Source Energy (EL + EZ ) = El - ELL - EZL (4) Feedstock Energy (EF ) El - ~L - EZL - ELI - EL2 (5) Production Energy Output (EO) Ep - - EAEL3 (6) SNG Energy Output (EG) = EO - ELF - EB - ES (7) Energy in SNG to Consumers (EC ) = EG - Epp
9 CONVERSION TO ELECTRICITY ANDOR DISTRICT HEAT
The technology for conversion of peat and cattail feedstocks to electricity o~ district heat by combustion is available The essential steps are
1) Fine grinding to improve combustion efficiency
2) Exhaust fan furnace delivery to blow the finely ground particles directly into the furnace combustion chamber
3) Feedstock combustion to convert chemical energy of the feedstock into thermal energy carried by the flue gases
4) Steam generation accomplished by exchange of thermal energy between the flue gases and water or steam through boilers steam tubes water heaters and economizers
5) Mechanical power output by conversion of thermal energy of the steam into mechanical work by means of a Rankine cycle turbine
6) Electricity generation by conversion of mechanical work to electrical energy in generashytors or alternators
7) Transmission by wire of the electrical power from the generating station to consumer
8) District heating in which part or all of the generated steam is allocated for delivery as thermal energy to consumers either as steam or as hot water and
9) District heat reticulation which is the delivery of steam or hot water under pressure by pipe to the consumer
The assumptions required in application of these individual steps are summarized in the folshylowing six sections
9a Fine Grinding and Exhaust Fan
Fine grinding to approximately 50 to 100 vm is recommended before combustion or briquetting to improve combustion efficiency and aid in the drying and forming of briquettes An exhaust fan is needed to blow the fuel into the combustion chamber
Assumption 91 The energy requirements for the fine grinding of peat and cattail feedshystocks are similar to those for pulverizing coal
The energy requirement for a ballmill with soft coal or lignite is 12 kWhT and for a ballmill with hard coal (eg anthracite) is 17 kWhT (4 33) These figures include 1 kWhT for the feeder and 7 kWhT for the exhaust fan which blows the pulverized powder into the furnace The energy requirement for a bowlmill and feeder is 10 kWhT and for an exhaust fan for delivery from bowlmill to furnace is 5 kWhTo This totals 15 kWhT (4 33)
Alternatively an energy input per unit output including fan of 14 kWhT has been suggested (4) for fibrous materials Fine grinding of 35 H20 peat or cattails might require more energy In the absence of better data we assume that the energy for fine grinding is 10 kWhT and the energy for the exhaust fan is 5 kWhTo
Assumption 92 For Case A electrical generation with or without district heat the fine grinding and exhaust fan energy requirements are satisfied by electricity generated on site For Case B briquetting and district heat only grinding and fan energy requirements are satisfied by remotely generated electricity
Assumption 93 The thermal energy available for combustion conversion processes is based on the lower LHV rather than the HHV The LHV of peat as a function of H20 content was established in Section 5f The LHV of cattails is calculated below
49
Assumption 94 The polymer structure of cattail dry
(H005C6)n
The mole fraction by weight of hydrogen in cattail dry fractional H20 content of the biomass by weight then the HHV
00617[w(H20)W(H2)](1-x)+x = 7500 (l-x) - 10652[00617hfBT31b A graph of these functions is shown in Fig 91
iii 8000 J -7500 7000 6908
~ 6000 al
~ 4000 J ~ 3000
2000Z -~ laquo 1000 W E
5000~------~--~
4117
10 20 30 60 70 80 90 100 ( )
matter can be represented by
matter 10162 = 00617 If x is the == 7500 (l-x) BTUlb The LHV HHVshyx 182(l-x)+x] == 6908 - 7974 x
Figure 91 Higher heating value (HHV) and lower heating value (LVH) of wet cattails as a function of moisture content by weight
For cattails at 35 H20 the HHV = 4875 BTUlb and the LHV 4117 BTUlb The ratio LHVHHV 41174875 = 08445 for cattails For peat at 35 H20 the ratio LHVHHV is 52846000 = 08807
Assumption 95 For Case A the efficiency for converting peat and cattails to electricshyity is 32 without district heat (A-l) and 27 with district heat In the case of cogeneration a further 50 of the peat and cattail energy is used as heat for a total conversion efficiency of 77 (A-2)
Assumption 96 For Case B which uses remotely-generated electricity the coal to elecshytricity conversion efficiency is 30 This efficiency is lower than that for A-l since it includes the line loss associated with transmission from a remote generating point
Case A-l Conversion to Electricity Only
The fuel energy requirement for grinding peat or cattail feedstock for conversion to elecshytricity is 10 kWhT x 1 T2000 lb x 3413 BTUkWh x 1032 == 533 BTUlb Using similar calculashytions the fuel energy requirement for the fan is 267 BTUlb The amount of peat or cattail fuel energy needed for grinding and fan operation depends upon the feedstock type These calculations are summarized in Table 91 for the four types of feedstock
50
Table 91 Grinding and exhaust fan energy requirements for conversion of peat and cattails to electricity
Fine Grinding Exhaust Fan
LHV Fuel HHV Fuel LHV Fuel HHV Fuel Weight of Feedstock
Ener~y Energy Ener~y Energy ( of (104 (10 (106 (10 (106
Feedstock Type Source) lbacre) BTUacre) BTUacre) ( of ER) BTUacre) BTUacre) ( of ER)
Sod Peat 990 317 169 192 0999 845 960 0499
Densified Milled Peat 960 399a 213 242 1259 107 121 0630
Hydraulic Peat (35 H2O)
Cattails
682
770
218
332b
116
1n C
132
209c
0688
0997
582
0884c
661
105c
0344
0499
a Weight of 50 H20 material (320 x 106 x 6550 x 096) lbacre
b Weight of 35 H20 cattails (14 x 2000 x 1065 x 077) lbacre-yr
c Fuel energy in 106 BTUacreyr
Case A-2 Conversion to Electricity and District Heat (Cogeneration)
Using energy analysis based upon the first law of thermodynamics the fuel energy requirement for grinding peat or cattail feedstock is 10 kwhT x 1 T2000 lb x 3413 BTUkWh x 1077 222 BTUlb Similar calculations give a fan fuel requirement = 111 BTUlb However first law acshycounting for this case is grossly misleading since it incorrectly assumes that the electricity and thermal outputs from the cogeneration plant have equal quality Hence for this case we shall employ second law principles to derive more realistic values for grinding and fan fuel requirements
Assumption 97 The temperature of hot water delivered from the cogeneration plant is 2350 F (Section gel and the ambient temperature for space heating is 70oF
The energy quality factor for electricity = 1000 For hot water the quality factor = (TshyTo)T = (235-70)(235 + 460) 0237 From the second law of thermodynamics the efficiency = 027 x 1000 + 50 x 0237 = 0388 (see Assumption 95) Thus the fuel energy requirement for grinding peat and cattail feedstocks 10 x 12000 x 3413 x 103885 = 439 BTUlb The fuel energy requireshyment for the fan = 220 BTUlb In this case as in A-l the amount of feedstock energy needed for grinding and fan operation depends upon the type of feedstock These calculations are summarized in Table 92
51
Table 92 Grinding and exhaust fan energy requirements for cogeneration of electricity and district heat from peat and cattails
Fine Grinding Exhaust Fan
LHV Fuel HHV Fuel LHV Fuel HHV Fuel Weight of
( of
Feedstock
(104 Energy
(106 Ener~y
(10 Energy
(106 Energy
(106
Feeds tock Type Source) Ibacre) BTUacre) BTUacre) ( of ER) BTUacre) BTUacre) ( of ER)
Sod Peat 990 317 139 158 0823 696 790 0411
Densified Milled Peat 960 399 176 199 1037 877 996 0519
Hydraulic Peat (35 H2O)
Cattails
682
77 0
218
332a
959
146b
109
173b
0567
0822
479
0729b
544
0863b
0283
0411
a Weight of cattails in 104 Ibacreyr
b Fuel energy in 106 BTUacremiddot yr
Case B Conversion to District Heat Only (No Electricity) or Briquettes
The fuel energy (coal) = 569 BTUlb for grinding feedstock and 284 BTUlb for fan operashytion Both calculations assume a conversion efficiency of 30 (Assumption 96)
Assumption 98 The overall conversion efficiency of 30 at a remote coal plant includes the LHVHHV ratio for coal
Calculations for the four feedstock types are summarized in Table 93
Table 93 Grinding and exhaust fan energy requirements for conversion of peat and cattails to district heat or briquettes
Weight of Feedstock Fine Grinding Exhaust Fana
Feedstock Type ( of
Source) (104 Ibacre) HHV Fuel Energy
(106 BTUacre) ( of ~)
HHV Fuel Energy (106 BTUacre) ( of ER )
Sod Peat 990 317 180 0938 901 0469
Densified Milled Peat 960 399 227 1183 113 0591
Hydraulic Peat (35 H2O)
Cattails
682
770
218
332b
124
189c
0646
0898
621
0943c
0323
0449
a no exhaust fan energy needed for briquettes
bweight of cattails in 104 Ibacreyr
cfuel energy in 106 BTUacreyr
52
9b Electricity Generation Without District Heating
Assumption 99 The average generation plant using peat or cattails as feedstock will have a 50 megawatt electrical (MWe) output and operate with a 75 load factor The steam turbines are of the condensing type and the expected feedstockshyto-electricity conversion efficiency is 32
The feedstock LHV energy requirement = 50 x 103 kWhhr x 075032 x 24 x 365 hryr x 3413 1012BTUkWh = 350 x BTUyr
The sod hydraulic peat and cattailfeedstocks contain about 35 H20 However the densishyfied milled peat contains -50 H20 Some of the thermal energy from combustion will be required to reduce this to 35 H20 for direct comparison with the other feedstocks
Assumption 910 The thermal energy needed to reduce the H20 content of the densified milled peat from 50 to 35 corresponds to the enthalpy of evaporation of this H20 at 50o P
The weight of water to be evaporated = 320 x 10 6 x [(065050)-lJ x 096 = 922 x 105 lbacre The enthalpy of evaporation at 500 p = 10652 BTUlb Therefore the HHV fuel energy needed (85 combustion efficiency) = 922 x 105 x 10652 x 1085 x 60005284 = 131 x 109 BTUacre This fuel energy = 683 of ERbull After subtraction of the peat fuel energy required for evaporation of H20 960 - 683 = 892 of the source energy is available as feedstock in the form of 35 H20 densified milled peat
The land area requirements to provide sufficient feedstock of each type at 35 H20 to operate a 50 MWe electrical generating facility operating at 75 capacity are summarized in Table 94
Table 94 Land area requirements to provide 35 H20 peat and cattail feedstocks for electricity generation (50 MWe plant 75 load factor 32 conversion efficiency) bull
Energy in Peedstock Peedstock Type Based on HHV Based on LHV Land Area Requirement
(108 BTUacre) (acresyr)
Sod Peat 990 190 167 209
nensified Milled Peat 892 171 151 232
Hydraulic Peat 682 131 115 304
cattails 770 25700b
bIn acres on a continuous basis
9c Electrical Transmission
Assumption 911 Transmission and distribution line losses are 10 of the net electrical energy output from the generating plant (ie 90 of net electrical energy generated reaches the consumer)
9d Electricity Generation with District Heating (Cogeneration)
Assumption 912 The average generating plant using peat or cattails as feedstock will have a 35 MWe output and a 65 load factor Feedstock-to-electricity conversion efficiency is 27 and feedstock to district heat conversion efficiency is 50
53
The district heat thermal output = 35 x 5027 648 megawatt thermal (MWt) Therefore the total output (electrical + thermal) 998 MW
Assumption 913 The generating plant utilizes back pressure turbines exhausting at approxishymately 2500 F and 30 Ibin2 absolute with the thermal energy distributed to the district heating system as hot water under pressure
Assumption 914 There is a constant demand for the thermal energy consistent with the 65 load factor This permits the conversion efficiency of assumption 912
Sundberg (35) advised that the values associated with Assumptions 912 - 914 were realistic However we realize that a district heating load of 648 MWt may not occur within 30 miles of a peat or cattail source
The feedstock LHV energy requirement = 35 x 103 kWhhr x 065027 x 24 x 365 hryr x 3413 BTUkWh = 252 x 1012 BTUyr The land area requirements to provide feedstocks at 35 H20 for cogeneration (35 MWe65 MWt plant operating at 65 load factor) are 150 acresyr for sod peat 167 acresyr for densified milled peat 218 acresyr for hydraulic peat and 18400 acres on a conshytinuous basis for cattails
ge District Heating - Hot Water Reticulation
Assumption 915 The mean effective diameter (d) of hot water reticulation pipes is 18 in
Assumption 916 The effective reticulation length (1) is 15 miles
Assumption 917 The turbine pump efficiency is 75
Assumption 918 The temperature drop across the hot end of the counter-flow heat-exchanger is 150 F and the temperature of the return water in the reticulation system is 1350 F The temperature of the outflow water is 2350 F Table 95 sumshymarizes the physical parameters of outflow and return water used in disshytrict heating
Table 95 Properties of Water for District Heating
Temperature (T) Enthalpy (hf ) Specific Volume (vf) Specific Weight (wf) Viscosi ty (jl) (OF) (BTUlb) (ft31b ) (1bft 3) (1b secft2)
235 20335 001689 5921 0519xlO-5
135 10297 001627 6146 1027xlO-5
From Section 9d the thermal output = 648 MWt 614 x 104 BTUsec Based upon the foreshygoing assumptions and physical properties the flow rate of hot H20 required (Qb) 614 x 104
BTUsec x 1 Ibj[20335 - 10297) BTU x 001689 ft31b = 103 ft 3sec The mean velocity of hot water (V) 103 ft 3sec x 4lr x (1218 ft)2 = 585 ftsec The Reynolds number (Re) = Vdwfig = [585 ftsec x 18 ft12 x 5921 Ibft3][0519 x 10-5 Ib secft2 x 3216 ftsec 2 ] = 311 x 106 bull This value indicates turbulent flow The head loss (hL) = flV22 dg = [00125 x 15 x 5280 ft x 585 ftsec)2)[2 x 18 ft12 x 3216 ftsec 2 ] = 351 ft where f = 00125 for steel pipe (38 Fig 78) bull
Assumption 919 There is an additional actual head differential of 49 feet
Thus the total pumping head = 400 feet The pumping power required 103 ft 3sec x 400 ft x 5921 Ibft3 x 1075 = 326 x 10 5 ftmiddotlbsec
Assumption 920 The electric motor for pumping operates at 95 efficiency
Thus the electric power consumption = 326 x 105 ftmiddotlbsec x 3600 sechr x 3766 x 10-7
kWhftmiddotlb x 1095 = 466 kW
54
Assumption 921 The characteristics of the return water pipes are identical to those for forward flow
The return water flow rate (Qr) = Qh x (WhW r ) = 103 x 59216146 = 996 ft 3sec The return water velocity (Vr ) = 564 ftsec The Re for return flow = [(564 x 1812 x 6146)][(1027 x 10-5 x 3216) = 158 x 106bull This value indicates turbulent flow The return head loss (hLr ) [00135 x 15 x 5280 x (564)2][2 x 1812 x 3216] = 352 feet where f = 00135 (38 Fig 78)
Assumption 922 There is no additional head differential for return flow
The total pumping head = 352 feet The return water pumping power = 996 x 352 x 6146 x 1075 287 x 105 ftlbsec The electric power consumption 287 x 10 5 x 3600 x 3766 x 10-7 x 1095 410 kW Therefore the total electric power consumption for pumping (outflow and return) = 876 kW
The electrical energy for pumping 876 x 027( 35 x 103) x 100 0676 of the total LHV feedstock energy The feedstock energy for pumping 067603885 = 174 of total LHV feedstock energy using the second law efficiency of Assumption 97
There is sensible heat loss through the pipes by conduction in addition to the relatively small pumping energy calculated above This is represented by a temperature drop of the hot water between the plant heat exchanger and the consumer heat exchangers
Assumption 923 The reticulation heat loss is 10 of heat added to water at the conversion plant heat exchanger
The temperature drop due to heat loss in pipes (235-135)10 100F This heat loss is 01 x 050 x 100 500 of LHV feedstock energy
9f District Heating - No Electrical Generation
Assumption 924 The average size of the heating plant is 50 to 100 MW t with a feedstock to thermal energy conversion efficiency of 80 for peat or cattails
Assumption 925 Thermal energy is distributed in the system as hot water under pressure with total reticulation heat losses of 10 as in the cogeneration system
The heat losses in reticulation 800 of LHV feedstock energy For a 648 MWt plant the electric power for hot water reticulation pumping will be the same as for cogeneration in Section ge or 876 kW The electrical energy for pumping = 874 x (080)(648 x 10 3 ) x 100 = 108 of total LHV feedstock energy In this case we assume that the electric power is generated with a convershysion efficiency of 30 at a distance remote from coal (see Assumption 96) The equivalent coal energy for pumping = 1081030 = 360 of total LHV feedstock energy
9g Net Energy Analysis summaries for Conversion of Peat and Cattail Feedstocks to Electricity andor District Heat
The summaries in this section (Tables 96 97 and 98) follow the pattern established in Section e for feedstock conversion to SNG In contrast to Section 8 where each process step was referenced to each of six reference quantities the process steps in this section are referenced only to ER the energy content of the initial resource Summaries are given for Case A-I generashytion of electricity only from each feedstock Case A-2 generation of electricity with district heating (cogeneration) from each feedstock and Case B generation of district heat only from each feedstock These summaries are based upon the first law of thermodynamics and do not account for differences in quality between electrical and thermal energy outputs except where noted earlier (Sections 9a and gel Uniform application of the second law of thermodynamics would have substanshytially reduced the conversion efficiencies of the thermal outputs relative to the electrical outshyputs
55
Table 96 Net energy analysis summary for generation of electricity only All tabulated values are in ER unless otherwise specifieda
Sod Cattails----------- Process Component ------------shy(Description) (Symbol) Peat Milled peat Hydraulic Peat High N Low N
Feedstock delivered to conversion site 990 960 682 77 0
Energy to Reduce H20 from 50 to 35 683
Feedstock at 35 H20 (HHV) EF 990 892 682 77 0
Feedstock at 35 H20 (LHV) EF 872 785 601 650
Difference between Heating Values 118 106 81 120
Conversion Losses (68 EF) 593 534 408 442
Electricity Generated (32 EF) 279 251 192 208
Electricity for Find Grindin~ 0320 0403 0220 0319
Electricity for Exhaust Fanb 0160 0202 0110 0160
Electricity for Grinding + Fan 0480 0605 0330 0479
Electricity for Transmission
EEG-EA 274 245 189 203
Transmission Losses (10 EET) 274 245 189 203
Electricity to Consumers (90 EET) 247 221 170 183
Extra Input Energy (See Section 8) 205 127 316 1077 381
Total Energy Input ER + EX 10205 10127 10316 11077 10381
Electricity to Consumer as of ~ 242 218 165 165 176
aTo obtain absolute energy values multiply by 192 x 1010 BTUacre for peat and 210 x 108 BTUacremiddotyr for cattails
bThese values differ from those in Table 91 by the conversion efficiency 032
56
Table 97 Net energy analysis summary for electricity generation with district heating (cogeneration) All tabulated values are in ER unless otherwise specifieda
----------- Process Component ------------- Sod Cattails (Description) (Symbol) Peat Milled Peat Hydraulic Pea t High N Low N
Feedstock delivered to conversion site
Energy to Reduce H20 from 50 to 35
Feedstock at 35 H20 (HHV) EF
EnFeedstock at 35 H20 (LHV) F
Difference between Heating Values
Conversion Losses (23 Ep) EeL
Electricity Generated (27 Ep)
Thermal Energy for Reticulation (50 Ep) ETG
Electricity for Fine Grindingb
Electricity for Exhaust Fanb
Electricity for pumping as a of Ep
Electricity for pumping
Electricity for Grinding + Fan + Pumping
Electricity for Transmission ~G-EA
Transmission Losses (10 EET)
Electricity to Consumers (90 EET)
HW Reticulation Loss (10 ~G)
Thermal Energy to Consumers (90 ~G) ETC
Total Energy to Consumers (EEC+ETC)
Extra Input Energy (see Section 8)
Total Energy Input ER+Ex
Total (Energy to Consumers as of ET
990
990
872
1l8
201
235
436
0320
0160
0676
0589
107
225
225
202
436
392
595
205
10205
583
960
683
892
785
106
181
212
393
0403
0201
0676
0531
114
201
201
181
393
353
534
127
101 27
527
682
682
601
81
138
162
300
0220
0110
0676
0406
074
155
155
139
300
270
410
316
10316
397
77 0
77 0
650
120
150
176
325
0319
0160
0676
0440
092
166
166
150
325
293
442
1077 381
1l077 10381
399 426
aTo obtain absolute energy values multiply by 192 x 1010 BTDacre for peat and 210 x 108 BTDacreyr for biomass
bThese values differ from those in Table 92 by the conversion efficiency 03885
57
Table 98 Net energy analysis summary for district heating only All tabulated values are in ER unless otherwise specifieda
----------- Process Component ------------- Sod Cattails (Description) (Symbol) Peat Milled Peat Hydraulic Peat High N Low N
Feedstock site
delive~ed to conversion 990 960 682 77 0
Energy to Reduce H20 from 50 to 35 683
Feedstock at 35 H20 (HHV) EF 990 892 682 77 0
Feedstock at 35 H20 (LHV) EF 872 785 601 650
Difference between Heating Values 118 106 81 120
Conversion Losses (20 Epl 174 157 120 130
Thermal Energy for Reticulation (80 Ep) 698 628 481 520
HW Reticulation Loss (10 ETGl ~T 698 628 481 520
Thermal Energy to Consumers (90 ~l
Electricity for Fine Grindingb
Electricity for Exhaust Fanb
628
0282
0141
565
0355
0177
432
0194
0097
468
0270
0135
Electricity for pumping as of of Ep 1081 1081 1081 1081
Electricity for Pumping 0943 0849 0649 0703
Electricity for Grinding + pumping
Fan + 1366 1381 0940 1108
Equivalent Coal Energy for Grinding + Fan + Pumping EA 455 460 313 369
Extra Input energy (See Section 8) 205 127 316 1077 381
Total Energy Input ER+Ex+EA 10661 10588 10629 11446 10750
Thermal Energy to Consumers as of ET 589 534 407 409 436
aTe obtain absolute energy values multiply by 192 x 1010 BTUacre for peat and 210 x 108 BTUacremiddotyr for cattails
bThese values differ from those in Table 93 by the conversion efficiency 030
58
10 BRIQUETTING
Electricity or SNG from peat would have to be produced in a central conversion facility and distributed to users by an electrical grid or pipeline system since production of these energy forms requires technologies not easily adapted to individual households or small commercial or industrial users
Peat briquettes however are higher density lower moisture and more easily handled than finely ground peat Thus briquettes are easier to store and to burn in furnaces stoves and fireplaces This section summarizes the energy requirements for forming briquettes from peat and cattail feedstocks for utilization by consumers or institutions needing a fuel for energy production that is independent of a central conversion facility and distribution network
10a Evaporative Moisture Reduction
Assumption 101 The sod hydraulic peat and cattail feedstocks are 35 H20 The densified milled peat is 50 H20
Assumption 102 Briquettes have a residual moisture content of 10
Assumption 103 The moisture content of the feedstock is reduced to 10 by heating and evaporation using a fraction tlf of the incoming finely ground feedstock to fire a furnace to supply the needed heat
Assumption 104 The oven dry feedstock and moisture are heated from 500 F to 2l2oF for evapshyoration of H20
Assumption 105 The specific heat of oven dry feedstock is half that of water
We analyze two cases corresponding to differences in water content of the feedstock
Case A - 35 H20 feedstock The LHVs (EF) are 5284 BTUlb for peat and 4117 BTUlb for cattails If W lb of finely ground 35 H20 feedstock is delivered the corresponding weight of 10 H20 product = W x 06509 = 0722W lb The weight of water to be evaporated = 0278W (I-f) lb From steam tables 50 = 181 BTUlb 212 = 1802 BTUlb and hfg 212 = 9703 BTUlb Thus thehf hf hea t required for mchs ture reduction = W(I-f) [( 1802 - 181) (065 x (065 x 05 + 035) + 9703 x 0278] = 3792 W(l-f) BTU The fractional energy flows for this case are summarized in Figure 101
EVAPORATIVE LOSS= 085 fEF
EF (1-1) EF
f Ei 015 fE
Figure 101 The fractional energy flows in the briquetting evaporator for 35 H20 peat and cattail feedstocks
Assumption 106 The furnace has 85 thermal efficiency
The feedstock energy input for H20 reduction = 4461 W(l-f) BTU This is fraction f of the total feedstock fuel LHV For peat feedstock 5284 Wf = 4461 W(l-f)BTU and f = 00779 or 779 of EFbull Therefore EF = 9221 of Ep
For cattail feedstock 4117 Wf 4461 W(l-f) BTU and f 00978 or 978 of Ep Therefore En 9022 of E FbullF
59
LOSS -
IEF
Case B - 50 H20 feedstock This applies only to peat for which the LHV for EF = 5284 BTUlb at 35 H20 If W lb of 35 H20 feedstock is delivered then the weight of 50 H20 feedstock = W x 06505 = 1300W lb and weight of 10 H20 feedstock = W x 06509 = 0722W lb The weight of water to to evaporated in main evaporator = 0578 W(l-f) lb The heat required for moisture reduction in the main evaporator = W(1-f)[(1802 - 181) x 1300 x (05 x 05 + 05) + 9703 x 0578] = 7189 W(l-f) These flows are shown in Figure 102
EF (1- I ) E VAPORATI ON lO~~ (~85 -X )fEF-=-=---O_______1____________-M-A-1L---- (1-f) EF E F
N 50 EVAPORATOR
H20 EVAPORATlON_ XIE E FURNACE LOSS
(085-X )fE F=015 fEr ------IE 085f EfF
HEAT
XIEn----------------------------------~F
Figure 102 The fractional energy flows in the briquetting evaporator for 50 H20 peat feedstock
From Assumption 910 the fraction X of LHV fuel energy needed to reduce the feedstock from 50 to 35 H20 in the secondary evaporator is given by (X) (5284 fEF) = (13-10) x 10652 x fEp Thus X = 00605 and the thermal input to the main evaporator = 07895 fEpbull Hence 07895 f x 5284 W= 7189 W(l-f) f = 0147 or 147 of Ep Therefore EF = 853 of Ep lOb Pressing into Briquettes
Assumption 107 Briquette pressing will be carried out with a Fred Hausmann Briquettor Model FH 290200 or its equivalent with a capacity of 5000-6600 lbhr when operating on drywood residue and similar cellulose material of proper particle size not exceeding 12 H20 The recommended motor has a 150 hp rating at 900 rpm A 15 hp motor is used for the screw feeder and 1 hp for hydraulic lubrication
We assume that a capacity of 6600 lbhr of 10 H20 feedstock corresponds to full load at 166 hp The higher heating values at 10 H20 are 8308 BTUlb for peat (Section Sf) and 6750 BTUlb for cattails (Section 9a) The energy throughput for peat = 6600 lbhr x 8308 BTUlb = 548 x 107
BTUhr For cattails the energy throughput = 6600 lbhr x 6750 BTUlb = 446 x 107 BTUhr
Assumption 108 The electric motors have 95 efficiency and electricity is generated from coal at a remote site with an overall conversion efficiency of 30
The electricity consumption for briquetting = 166 hp x 2547 BTUhphr x 1095 = 445 x 105 BTUhr The electricity consumption = 0812 EF for peat and 0999 EF for cattails
lOco Transportation of Briquettes to Consumers
Assumption 109 The briquettes are transported by truck with the same characteristics as those specified in Assumptions 322 and 323
Assumption 1010 The briquettes have a specific weight greater than 1704 lbft3 bull The loads are limited to 46000 lb net
Assumption 1011 The average distance for transporting briquettes from plant to consumer is 100 miles
The fuel consumption = 100(01667 + 1572 x 10-6 x 46000 + 01667) = 406 galsround trip The fuel consumption for delivered briquettes = 406 x 14000046000 = 124 BTUlb
60
The diesel fuel for transportation of peat = 1248308 x 100 149 of EF bull For transportashytion of cattails the diesel fuel 1246750 x 100 = 183 of EF bull
Assumption 1012 There is a loss of 10 H20 material through the briquetting and transshyportation processes to the consumer of 1 (expressed as of EF )
10d Net Energy Analysis Summary for Conversion of Peat and Cattail Feedstocks to Briquettes
Table 101 summarizes the various process components in the briquetting process for the sod milled peat hydraulic peat and cattail feedstocks
Table 101 Net energy analysis summary for conversion of feedstocks to briquettes All tabulated values are in ER unless otherwise specifieda bull
----------- Process Component ------------- Sod Cattails (Description) (symbol) Peat Milled Peat Hydraulic Peat High N Low N
Feedstock as delivered (HHV)
Feedstock as delivered (LHV)shy(35 H20 or equivalent 35 H20 material)
( of Ep) Furnace and Evaporative Loss
Moisture Reduction
( of ER)
Feedstock (10 H2O) to Briquettor (HHV)
Briquetting and ( of Ep) Transportation Loss ( of ~)
Briquettes as delivered to Consumers (HHV)
Electricity for Fine Grindingb
Electricity fOr( of EF) Briquetting ( of ER)
Electricity for Grinding + Briquetting
Equivalent Coal Energy for Grinding + Briquetting
Diesel FUel for( of Ep) Transportation ( of ~)
Extra lPput Energy (See Section 8)
Total Energy Input ~+EX+EA+EBT
Energy in Briquettes ( of ET)
Ep
EF
~T
EC
EA
990
872
779
679
922
100 0922
913
0282
0812 0748
1030
343
149 137
205
10686
854
960
845
147
1243
836
100 0836
827
0355
0812 0678
1033
344
149 124
127
10596
781
682
601
779
468
635
100 0635
629
0194
0812 0516
0710
237
149 094
316
10647
591
77 0
650
978
636
706
100 0706
699
0270
0999 0706
0976
325
183 129
1077 381
11531 10835
607 646
aTe obtain absolute energy values multiply by 192 x 1010 BTUacre for peat and 210 x 108 BTUacreyr -for biomass
bThese values differ from those in Table 93 by the conversion efficiency 030
61
11 ESTIMATES OF PEAT RESOURCE LIFE
Minnesotas peat must be interpreted as a finite resource since it regenerates at only 1-2 romyr The life expectancy of the peat resource was estimated at various rates of use by starting with total available peat (Section 2a) 480 x 1016 BTU (507 x 1019 J)
Assumption 111 All of Minnesotas energ1 will be derived from peat at the current source demand rate of 127 x 10 5 BTUyr (zero energy demand growth)
Therefore the life expectancy of the peat resource ~ (480 x 1016 BTU)(127 x 1015 BTUyr) 378 years
ASSUmption 112 All of Minnesotas energy will be derived from peat but source energy demand will grow at an annual rate of 12 (24)
The life expectancy in this case can be calculated using the formula ~ = Rl x [(l+r)n-llr for n = number of years where RT = total resource Rl resource used in initial year and r = annual growth rate Rearranging (l+r)n = rRTRl + 1 Therefore (1012)n = (0012 x 480 x 1016127 x 1015 ) + 1 1454 or n = 314 years the life expectancy of the resource
Assumption 113 All of Minnesotas natural gas requirements will be met with SNG produced from Minnegascos proposed Peatgas Reactor process (see Section 7) and consumption of natural gas in Minnesota will remain constant at the 1978 rate of 310 x 1014 BTUyr (24) An SNG supply of 310 x 1014 BTUyr corresponds to approximately 850 million cubic feetday
Assumption 114 The same conditions as Assumption 113 except energy demand grows at 12yr
The percentage of the energy in the peat resource actually delivered to the consumer and so the expected resource lifetime depends on the extraction method These are summarized in Tables 111 and 112 for the energy growth rates of Assumptions 113 and 114 respectively
Table 111 Resource lifetime of peat used for SNG production at a constant rate of energy use
Peat Extraction Reference Energy to Consumers (EC) Estimated Resource Lifetime Method Section ( of ER) (1016 BTU) (years)
Densified Milled Peat 8a 486 233 753
Sod 8b 501 241 776
Hydraulic 8c 361 173 559
Table 112 Resource lifetime of peat used for SNG production at an annual energy use growth rate of 12 per year
Peat Extraction Total Ener~~ Available (~) Estimated Resource Lifetime Method (10 BTU) (rRTRl + 1) (years)
Densified Milled 233 190 540
Sod 241 193 552
Hydraulic 173 167 431
62
12 CONCLUSIONS
(a) Hydraulic mlnlng of peat is the least efficient of the three extraction methods analyzed There are three main reasons for this low energy productivity First the material losses associated with hydraulic extraction may reach 20 of the total available resource primarily due to the escape of colloids through the Stage I dewatering filters back to the reservoir Second the pumping of the peat slurry consumes large amounts of energy and of water The energy required for pumping the slurry about 29 of the energy in the available resource increases markedly with more than 2 solids Providing water to maintain a slurry at less than 2 solids may be a problem especially in dry seasons Finally the dewatering of hydraulicalshyly extracted peat may consume up to 15 of the energy in the available resource a marked contrast to the free dewatering of sod and milled peat by sun and wind
(b) Transportation is an energy intensive step in the extraction of peat by all three methods 062 of the available resource for sod peat 079 to 19 for milled peat depending upon density and 29 for hydraulic peat For this reason it is important to consider locating peat covers ion facilities as close to mining operations as possible
(c) The requirement of cattails for nitrogen and other mineral fertilizers has a large impact on the energy efficiency of using this biomass resource The nitrogen fertilizer represented 23 of the energy in the cattails at the low rate of application and 90 at the high rate Lower nitrogen requirements would greatly reduce the amount of energy required for production However for sustained high yields the nitrogen removed in the cattail biomass must be replaced on an annual basis
(d) Peatlands would have a life expectancy of less than 40 years if used as Minnesotas sole energy source under conditions of realistic growth rates of energy usage The renewability of biomass crops such as cattails offers the advantage of extending the useful life of peatlands for many years However the larger amount of land needed for growing energy crops and the resultant land disturbance partly counters this advantage This tradeoff along with the generally lower net energy values for cattails points to a need for further study Efficient equipment for harvesting cattails is required so that losses are minimized
(e) Solar energy can be used to considerable advantage in reducing the energy requirements of peat processing This is most evident in comparing sod and milled peat extraction which use free sunlight with hydraulic extraction where solar drying is not used and so the energy requireshyments are much higher
(f) In comparing energy efficiencies presented here it is important to realize that this analysis only evaluated the efficiencies of the final end-use fuel forms (1st law of thermodynamics) without comparing the differences in usability or quality (2nd law of thermodynamics) of the end-use fuel by the consumer The manufacture of briquettes for example may seem more effi shycient than the production of electricity However electricity can be used immediately for motors or lights while briquettes must be burned entailing another energy-consuming step in conversion The high net energy efficiency gained in producing briquettes may be more than lost in this additional energy conversion process
13 REFERENCES
1 Aiken RG and DS Wilson 1982 Peatland energy options systems analysis University of Minnesota Center for Urban and Regional Affairs Publ No CURA 82-2
2 Alway FJ 1920 Agricultural value and reclamation of Minnesota peat soils Minn Agric Expt Sta Bull 188
3 American Society of Agricultural Engineers 1977 ASAE Yearbook p 331 4 Anonymous 1972 Steam Its generation and use Babcock and Wilcox 38th ed 5 Baker DG Dept of Soil Science University of Minnesota Personal Communication 6 Bjork JS and W Graneli 1978 Energy reeds and the environment Ambio 7150-156 7 carncross C Western Peat Moss Company Vancouver BC Canada Personal Communication 8 Erickson RA AS Robertson DO Barron GF Harms RL Skarie and RH Rust 1980
Minnesota Soil Atlas Roseau Sheet Minn Agric Expt Sta Misc Rept 173 9 Farnham RS 1964 Peat resources of Minnesota W Central Lakes Bog St Louis Co
Minnesota Rept of Inventory No1 Iron Range Resources and Rehabilitation
63
10 Farnham RS 1975 Minnesotas peat as an energy source - quality and quantity Int Peat Soc Proc Comm II Combustion of Peat Kuopio Finland pp 25-33
11 Farnham RS 1978 Wetlands as energy sources Proc Nat Symp Wetlands Am Water Resources Assoc Orlando Florida
12 Farnham RS 1978 Energy from peat Subcommittee 8 report to the Minnesota Energy Agency Alternative Energy Research and Development Formulation Proj p 13 University of Minnesota Soil Science Dept st Paul
13 Farnham RS and HR Finney 1965 Classification and properties of organic soils Adv Agron 17115-160
14 Farnham RS and DN Grubich 1964 Peat resources of Minnesota Cook Bog St Louis Co Minnesota Rept of Inventory No2 Iron Range Resources and Rehabilitation
15 Farnham RS and DN Grubichmiddot 1966 Peat resources of Minnesota Red Lake Bog Beltrami Co Minnesota Rept of Inventory No3 Iron Range Resources and Rehabilitation
16 Farnham RS and DN Grubich 1970 Peat resources of Minnesota potentiality report Fens bog area St Louis Co Minnesota Iron Range Resources and Rehabilitation
17 Glass RL 1980 Chemical compounds in cattails useful as an energy source Final report to the Minnesota Energy Agency on alternative energy research University of Minnesota Dept of Biochemistry St Paul
18 Grubich D and RS Farnham 1972 Inventory of Minnesota peatlands 4th Int Peat Cong Helsinki Finland Vol 1461-469
19 Heichel GH 1976 Agricultural production and energy resources Amer Sci 6464-72 20 Heichel GH 1982 Energy analyses of forage production systems J Anim Sci 54869-876 21 Hirst E 1973 Energy use for food in the United States Rept no 57 Oak Ridge National
Laboratory Tennessee 22 Mesinger MC 1980 Wet carbonization of peat state-of-the-art review proc IGT Symp on
Peat as an Energy Alternative Arlington Virginia 23 Minnesota Dept of Natural Resources 1981 Minnesota peat program Final report State of
Minnesota Dept of Natural Resources Minerals Division 24 Minnesota Energy Agency 1980 Energy policy and conservation biennial report p 4-43 25 Moss DN 1977 Agricultural and wetland sources Subcommittee 5 report to the Minnesota
Energy Agency Alternative Energy Research and Development Policy Formulation Proj p 36 72 University of Minnesota Dept of Agronomy and Plant Genetics St Paul
26 Mundale SM (ed) 1981 Energy from peatlands options and impacts University of Minneshysota Center for Urban and Regional Affairs Publ No CURA 81-2
27 Myreen BM 1979 The peat fuel process Finn energy 79 Finnish Ministry of Trade and Industry
28 Pimentel D (ed) 1980 Handbook of energy utilization in agriculture CRC Press Boca Raton Florida
29 Pratt DC 1978 Cattails as an energy source Final report to the Minnesota Energy Agency program on Alternative Energy Research University of Minnesota Dept of Botany St Paul
30 Pratt DC V Bonnewell NJ Andrews and JH Kim 1980 The potential of cattails as an energy source Final report to the Minnesota Energy Agency University of Minnesota Dept of Botany St Paul
31 Rader A Consultant to Minnesota Gas Company Minneapoljs Personal Communication 32 Rader AM 1979 Synthetic natural gas from peat IampEC Prod Res and Dev 18291-296 33 Rohrer JW and B Myreen 1980 Wet carbonized peat - fuel and feedstock Proc IGT Symp
on Peat as an energy alternative Arlington Virginia 34 Skrotski BGA and WA Vopat 1960 Power station engineering and economy McGraw Hill
Book Company New York 35 Sundberg RE District Heating Projects Manager Minnesota Energy Agency Personal Communishy
cation 36 USDA 1975 Soil Conservation Service Soil Taxonomy Agr Handbook No 436 37 Vanasse R B Coupal and MI Boulos 1979 Hydraulic transport of peat moss suspensions
Can J Chem Eng 57238-241 38 Vennard JK 1947 Elementary fluid mechanics 2nd Edition John Wiley amp Sons New York
p 161
64
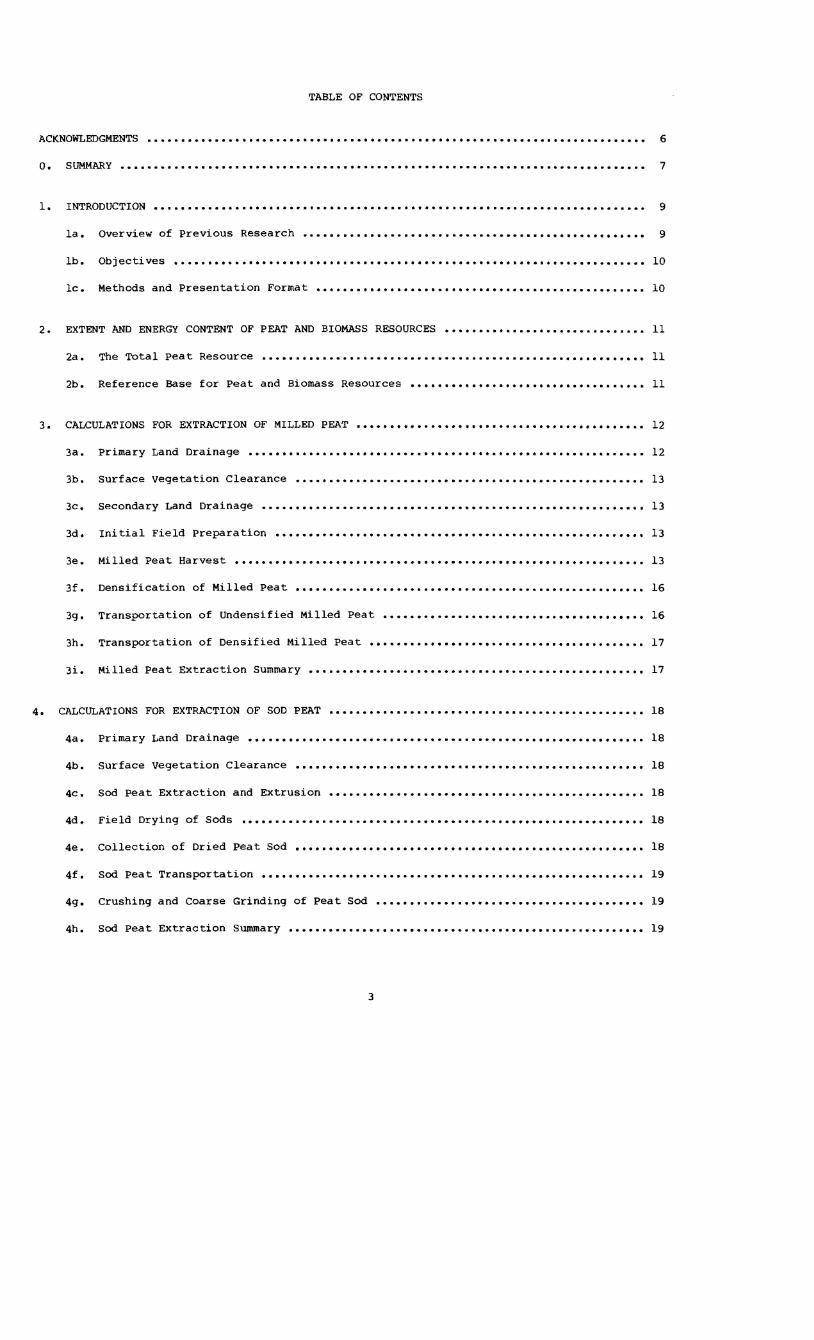
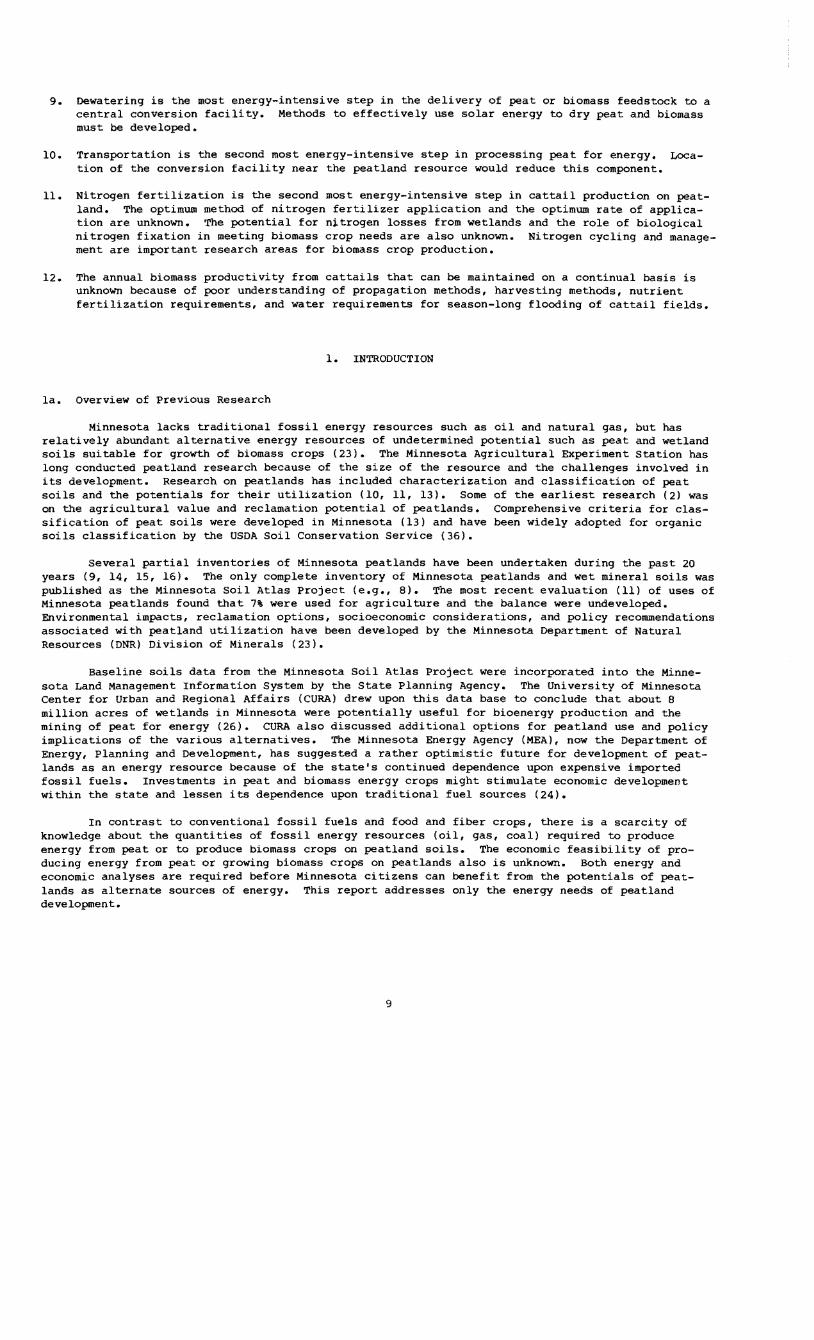