Embed Size (px)
Citation preview
ORNL/TM-2017/246
Analysis of Electric Power Board of Chattanooga Smart Grid Investment
Michael Starke Ben Ollis Jim Glass Alex Melin Guodong Liu Isha Sharma
June 2017 Approved for public release. Distribution is unlimited.

DOCUMENT AVAILABILITY
Reports produced after January 1, 1996, are generally available free via US Department of Energy (DOE) SciTech Connect. Website http://www.osti.gov/scitech/ Reports produced before January 1, 1996, may be purchased by members of the public from the following source: National Technical Information Service 5285 Port Royal Road Springfield, VA 22161 Telephone 703-605-6000 (1-800-553-6847) TDD 703-487-4639 Fax 703-605-6900 E-mail [email protected] Website http://www.ntis.gov/help/ordermethods.aspx Reports are available to DOE employees, DOE contractors, Energy Technology Data Exchange representatives, and International Nuclear Information System representatives from the following source: Office of Scientific and Technical Information PO Box 62 Oak Ridge, TN 37831 Telephone 865-576-8401 Fax 865-576-5728 E-mail [email protected] Website http://www.osti.gov/contact.html
This report was prepared as an account of work sponsored by an agency of the United States Government. Neither the United States Government nor any agency thereof, nor any of their employees, makes any warranty, express or implied, or assumes any legal liability or responsibility for the accuracy, completeness, or usefulness of any information, apparatus, product, or process disclosed, or represents that its use would not infringe privately owned rights. Reference herein to any specific commercial product, process, or service by trade name, trademark, manufacturer, or otherwise, does not necessarily constitute or imply its endorsement, recommendation, or favoring by the United States Government or any agency thereof. The views and opinions of authors expressed herein do not necessarily state or reflect those of the United States Government or any agency thereof.

ORNL/TM-2017/246
Electrical and Electronics Systems Research Division
ANALYSIS OF ELECTRIC POWER BOARD OF CHATTANOOGA
SMART GRID INVESTMENT
Michael Starke
Ben Ollis
Jim Glass*
Alex Melin
Guodong Liu
Isha Sharma
_______________
*EPB Electric Power, Chattanooga, Tennessee
Date Published: May 2017
Prepared by
OAK RIDGE NATIONAL LABORATORY
Oak Ridge, TN 37831-6283
managed by
UT-BATTELLE, LLC
for the
US DEPARTMENT OF ENERGY
under contract DE-AC05-00OR22725

iii
CONTENTS
LIST OF FIGURES ...................................................................................................................................... v LIST OF TABLES ...................................................................................................................................... vii ACRONYMS ............................................................................................................................................... ix 1. INTRODUCTION ................................................................................................................................ 1 2. BACKGROUND .................................................................................................................................. 2
2.1 ABOUT CHATTANOOGA ELECTRIC POWER BOARD ..................................................... 3 2.2 UNDERSTANDING THE VALUE ........................................................................................... 3
3. SMART GRID MANAGEMENT SYSTEM ....................................................................................... 5 3.1 SUMMARY ................................................................................................................................ 5 3.2 PRE–SMART GRID ................................................................................................................... 5 3.3 SMART GRID MANAGEMENT SYSTEM.............................................................................. 5
3.3.1 Introduction .................................................................................................................... 5 3.3.2 The Technology ............................................................................................................. 5
3.4 COST ........................................................................................................................................ 10 3.5 BENEFIT .................................................................................................................................. 10
4. DISTRIBUTION MANAGEMENT SYSTEM .................................................................................. 12 4.1 SUMMARY .............................................................................................................................. 13 4.2 PRE–SMART GRID ................................................................................................................. 13 4.3 POST–SMART GRID .............................................................................................................. 14
4.3.1 Distribution Power Flow .............................................................................................. 14 4.3.2 Voltage/VAR Control .................................................................................................. 15 4.3.3 Fault Location, Isolation, and Service Restoration ...................................................... 16 4.3.4 Feeder Reconfiguration ................................................................................................ 19 4.3.5 Planned Switching ....................................................................................................... 19
4.4 COST ........................................................................................................................................ 20 4.5 BENEFIT .................................................................................................................................. 20
5. DEMAND MANAGEMENT SYSTEM ............................................................................................ 21 5.1 SUMMARY .............................................................................................................................. 21 5.2 PRE–SMART GRID ................................................................................................................. 21 5.3 POST–SMART GRID .............................................................................................................. 21
5.3.1 Utility Programs ........................................................................................................... 22 5.3.2 Customer Demand Programs ....................................................................................... 23
5.4 COST ........................................................................................................................................ 26 5.5 BENEFIT .................................................................................................................................. 26
6. SUPERVISORY CONTROL AND DATA ACQUISITION ............................................................. 28 6.1 SUMMARY .............................................................................................................................. 29 6.2 PRE–SMART GRID ................................................................................................................. 29 6.3 POST–SMART GRID .............................................................................................................. 29
6.3.1 EPB SCADA system .................................................................................................... 29 6.3.2 Communication ............................................................................................................ 30 6.3.3 Data Acquisition and Supervisory Control .................................................................. 30 6.3.4 User Interfaces ............................................................................................................. 31 6.3.5 Alarming ...................................................................................................................... 32
6.4 COST ........................................................................................................................................ 32 6.5 BENEFIT .................................................................................................................................. 32
7. AUTOMATION ................................................................................................................................. 33 7.1 SUMMARY .............................................................................................................................. 33 7.2 PRE–SMART GRID ................................................................................................................. 34

iv
7.3 POST–SMART GRID .............................................................................................................. 34 7.3.1 Smart-Grid Fault Response Overview ......................................................................... 34 7.3.2 12 kV Smart-Grid Automation .................................................................................... 35 7.3.3 46 kV Automation........................................................................................................ 36 7.3.4 Device Timing and Coordination ................................................................................. 37 7.3.5 Benefits of Communication and Sensing ..................................................................... 38
7.4 COST ........................................................................................................................................ 40 7.5 BENEFIT .................................................................................................................................. 40
8. OUTAGE MANAGEMENT .............................................................................................................. 42 8.1 SUMMARY .............................................................................................................................. 43 8.2 PRE–SMART GRID ................................................................................................................. 43 8.3 POST–SMART GRID .............................................................................................................. 45 8.4 COST ........................................................................................................................................ 47 8.5 BENEFIT .................................................................................................................................. 47
9. CAPACITY PLANNING AND PROTECTION................................................................................ 50 9.1 SUMMARY .............................................................................................................................. 51 9.2 PRE–SMART GRID ................................................................................................................. 51 9.3 POST–SMART GRID .............................................................................................................. 52
9.3.1 Capacity Planning ........................................................................................................ 52 9.3.2 Protection Settings ....................................................................................................... 54
9.4 COST ........................................................................................................................................ 55 9.4.1 Capacity Planning ........................................................................................................ 55 9.4.2 Protection Settings ....................................................................................................... 55
9.5 BENEFIT .................................................................................................................................. 55 9.5.1 Capacity Planning ........................................................................................................ 55 9.5.2 Protection Settings ....................................................................................................... 55
10. ASSET MANAGEMENT .................................................................................................................. 56 10.1 SUMMARY .............................................................................................................................. 57 10.2 PRE-SMART GRID ................................................................................................................. 57 10.3 POST–SMART GRID .............................................................................................................. 58 10.4 COST ........................................................................................................................................ 59 10.5 BENEFIT .................................................................................................................................. 59
11. CUSTOMER INFORMATION SYSTEM ......................................................................................... 60 11.1 SUMMARY .............................................................................................................................. 61 11.2 PRE–SMART GRID ................................................................................................................. 61 11.3 POST–SMART GRID .............................................................................................................. 61 11.4 COST ........................................................................................................................................ 62 11.5 BENEFIT .................................................................................................................................. 62
12. Fiber Optic system .............................................................................................................................. 64 12.1 Summary ................................................................................................................................... 65 12.2 Pre-Smart Grid .......................................................................................................................... 65 12.3 POST–Smart Grid ..................................................................................................................... 65 12.4 Cost ........................................................................................................................................... 66 12.5 Benefit ....................................................................................................................................... 66
13. CONCLUSION ................................................................................................................................... 68 14. ACKNOWLEDGMENTS .................................................................................................................. 70 15. References ........................................................................................................................................... 72
v
LIST OF FIGURES
Figure 1. AMI deployment timetable. ........................................................................................................... 6 Figure 2. Data collection to local convergence points. ................................................................................. 7 Figure 3. Large commercial and industrial metering. ................................................................................... 8 Figure 4. Data flow in EPB systems. ............................................................................................................ 9 Figure 5. Screenshot of the DMS. ............................................................................................................... 14 Figure 6. Screenshot of DPF in real-time control mode. ............................................................................ 15 Figure 7. CVR applied on a feeder. ............................................................................................................ 16 Figure 8. FLISR work flow diagram. .......................................................................................................... 17 Figure 9. Example of fault location results. ................................................................................................ 19 Figure 10. EPB system power factor since 2011. ....................................................................................... 20 Figure 11. The webDistribute dashboard. ................................................................................................... 23 Figure 12. Voltage profile with and without regulators. ............................................................................. 23 Figure 13. Aggragated DR process and communications. .......................................................................... 25 Figure 14. Example of aggragated DR. ....................................................................................................... 26 Figure 15. SCADA system hierarchy. ........................................................................................................ 30 Figure 17. Number of status, analog (measurement), and control points for SCADA
communications. ............................................................................................................................ 31 Figure 18. One-line example user interface. ............................................................................................... 32 Figure 19. Single substation tie Smart Grid feeder configuration............................................................... 35 Figure 20. Fault scenario for a feeder with a single substation connection. ............................................... 36 Figure 21. Fault scenario for a feeder with two substation connections. .................................................... 36 Figure 22. Reduction in the frequency of outages for a single feeder with two substation tie-ins. ............ 36 Figure 23. Example time current characteristic curves. .............................................................................. 38 Figure 24. EPB SAIDI metric from June 2009 to April 2015. ................................................................... 39 Figure 25. EPB SAIFI metric from June 2009 to April 2015. .................................................................... 39 Figure 26. OMS outage prediction. ............................................................................................................. 44 Figure 27. Screenshot of OMS. ................................................................................................................... 45 Figure 28. AMI outage notification. ........................................................................................................... 46 Figure 29. Load growth of EPB system from 1999 to 2015. ...................................................................... 52 Figure 30. Loading on feeders as a percentage. .......................................................................................... 53 Figure 31. Load provided by Feeder 1. ....................................................................................................... 53 Figure 32. Load provided by Feeder 2, Feeder 3, and Feeder 4. ................................................................ 54 Figure 33. Screenshot of CASCADE. ......................................................................................................... 58 Figure 34. EPB fiber optic distribution. ...................................................................................................... 66


vii
LIST OF TABLES
Table 1. Cost of SGMS implementation ..................................................................................................... 10 Table 2. Savings due to automatic meter reading and RDUGs ................................................................... 11 Table 3. Savings due to theft detection ....................................................................................................... 11 Table 4. TVA rate structure for EPB .......................................................................................................... 21 Table 5. TOU tariff offered by EPB ........................................................................................................... 24 Table 6. Payments for trial program (2016) ................................................................................................ 26 Table 7. Cost of demand management ........................................................................................................ 26 Table 8. Estimated benefits of demand management system ..................................................................... 27 Table 9. Cost for OMS/CAD ...................................................................................................................... 47 Table 10. Results from the ICE tool analysis of the three outages ............................................................. 49 Table 11. Change in audit requests and tampering investigations from before and after Smart Grid
implementation .............................................................................................................................. 62 Table 13. EPB Data reporting ..................................................................................................................... 66

ix
ACRONYMS
AMI advanced metering infrastructure
CAD computer-aided dispatch
CEC Communication Enhanced Coordination
CIS customer information system
CPN central processing node
CVR Conservation Voltage Reduction
DMS distribution management system
DPF distribution power flow
DR demand response
EID effective interruptible demand
EPB Electric Power Board
EQL equipment loading reduction
FLISR Fault Location, Isolation and Service Restoration
FR feeder reconfiguration
GIS Geographic Information System
ICCP inter-control center communications protocol
ICE interruption cost estimate
IPC Internet protocol collector
IVR interactive voice response
LAN local area network
LB load balancing
LCP local convergence point
LOV loss of voltage
LTC load tap changing
LVR loading violation remediation
MOS motor-operated switch
OMS outage management system
ONT optical network terminal
OOB out-of-band
OPT optimization
OSI Open Systems International, Inc.
PCR pulse closing recloser
PF power factor
QC reactive power control
RDUG Remote Disconnect Under Glass
RTU remote terminal unit
SAIDI system average interruption duration index
SAIFI system average interruption frequency index
SCADA Supervisory Control and Data Acquisition
SGMS Smart Grid Management System
TCC time current characteristic or time current curve
TOU time of use
TVA Tennessee Valley Authority
VC Voltage Control
VVC Volt/VAR Control
VVR voltage violation remediation

x

1
1. INTRODUCTION
Electricity, once a commodity, is now a requisite for economic growth and quality of life. Ironically, the
delivery system responsible for providing electricity to the end customers has largely been forgotten or
overlooked by these same customers, unless it is no longer available. Utilities across the United States have
done their best to continue to invest and maintain these systems even under tighter scrutiny from their
customers. After all, the key purpose of the electric utility is delivery of electricity to its customers even
under the challenge of aging infrastructure, increasing generation cost, and potential distributed generation.
As a result, additional risk associated with the addition of new technologies to the distribution system is
typically not deemed worthwhile.
The deployment of a smart grid within the Electric Power Board (EPB) of Chattanooga has been the
exception to the convention. Today, the EPB electric system has automated reconfiguration capabilities and
fault isolation, automatic data collection and billing, and identification of system challenges with fast truck
rolls, to name a few. These capabilities have not only led to increased value to electricity customers but
also reduced operating costs. Other utilities, having seen the innovation of the EPB Smart Grid, are looking
for guidance to achieve similar success. This report hopes to not only identify the advanced features
deployed by EPB, but also establish that technology is not the only requirement for success.
A large challenge to improving a utility baseline is the development of a long-term plan or vision of
reducing cost while improving the customer relationship with the utility. It is relatively easy to create short-
term fixes to ensure continued operation, but it is difficult to create the needed vision to revolutionize the
way the system currently operates. As an example, Elon Musk created a plan 10 years ago to revolutionize
the way we travel and integrate solar into our homes.1 His plan is now coming to fruition with the anticipated
arrival of the low-cost Tesla Model 3 and the acquisition of SolarCity. However, the journey has been long
and not without risks.
Similarly, EPB made a conscious decision to look beyond the typical approach of operations almost a
decade ago. A long-term goal for EPB was developed requiring a dedicated team of management,
engineering, and staff to ensure that the plan could be carried out. The US Department of Energy (DOE) in
2010 reduced the time required to implement this plan with a significant investment. Nevertheless, the
critical plan and the direction EPB sought were the true reasons for success. This report is primarily focused
on the process of evaluation, the timeline, and the technologies EPB has acquired and deployed. This report
is organized so that each section contains a summary of the technology, the existing state of EPB before
any technology was implemented as part of the Smart Grid deployment, and the final result. Section 2 is
the exception; it contains details regarding the background of EPB, the development of a plan, and the
associated timeline of the plan.
1Elon Musk, Master Plan, Part Deux, https://www.tesla.com/blog/master-plan-part-deux.

2

3
2. BACKGROUND
2.1 ABOUT CHATTANOOGA ELECTRIC POWER BOARD
In 1935, the city of Chattanooga established the Electric Power Board (EPB) as a nonprofit agency to
provide electric power to the greater Chattanooga area. Today, EPB remains one of the largest municipally
owned electric power distributors in the country, serving approximately 175,000 homes and businesses in
a 600 m2 area that includes greater Chattanooga and Hamilton County, portions of surrounding Tennessee
counties, and areas of northern Georgia.
EPB purchases power from the Tennessee Valley Authority (TVA) at 14 delivery points. From there, the
power is transformed to either a 46 kV sub-transmission system (seven locations) or directly to 12 kV
distribution feeders (seven locations). The 46 kV sub-transmission system consists of 61 circuits composed
of 308 circuit miles. There are 3,600 circuit miles of distribution and 309 distribution feeders. EPB’s peak
load of 1,328 MW occurred on the morning of January 7, 2014. EPB’s annual electricity sales approximate
to 6,000,000 MWh.
The city of Chattanooga has experienced quite a transformation over the last 25 years. The downtown
riverfront area has changed from dilapidated industrial facilities to a family destination for tourists and local
residents alike. As a municipally owned distributor of electricity, EPB has a mission to improve the quality
of life for the local community. One of the ways EPB seeks to improve the local community is through
economic development. Listening closely to the needs of the commercial/industrial customers, EPB
recognized that reliable electric power was an essential component. This community need became the basis
for EPB to begin evaluating Smart Grid technologies.
As EPB engineers and executives began to analyze Smart Grid technologies, the communications
infrastructure was realized as the key component of the success of initial Smart Grid applications. This was
not only true for using the technology available today, but also for future applications that would require
faster and more reliable communication. EPB’s analysis led to the selection of a fiber-optic communication
system. EPB also recognized that the capabilities of the fiber could benefit the community beyond the Smart
Grid.
Today, EPB of Chattanooga is something of an anomaly in the electric utility industry. Having built the
largest and fastest “Fiber to the Home” network in North America, and having used that network to develop
a highly automated distribution network, EPB now has staff that exhibit skills beyond those of the typical
utility employee.
2.2 UNDERSTANDING THE VALUE
EPB has built a reputation for good service upon three foundational elements: (1) heavy automation of all
back-office and operational processes, (2) tight integration of all important software systems, and (3) an
effective transformation of EPB’s corporate culture.
The initial concept of an integrated electrical system began with planning meetings and discussions of the
future of EPB. EPB staff realized early on that one strategy for integrating more advanced systems was a
high-bandwidth communication system, or fiber-optic communication network. At the time, EPB
developed a plan for integrating this type of communication over a period of 10 to 12 years. The actual
implementation of the timeline for the Smart Grid is shown in Figure 1. In the fall of 2009, EPB began the
first installations of fiber optic cable to begin investigating the necessary system and architecture needs.
Shortly afterward, in 2010, EPB won a DOE Smart Grid Investment Grant to move forward with an

4
implementation of Smart Grid technologies. This grant provided a needed boost in funding for a more rapid
turnaround on the deployment of the fiber network.
5
3. SMART GRID MANAGEMENT SYSTEM
3.1 SUMMARY
The EPB Smart Grid Management System (SGMS), developed in partnership with Alcatel-Lucent, collects
and evaluates data from the end-user meter systems and distributes information to various EPB systems.
These include the customer information system (CIS), outage management system (OMS), computer-aided
dispatch (CAD), and distribution management system (DMS). The EPB SGMS provides a much more
comprehensive data exchange, beyond the typical CIS, OMS, and CAD. SGMS performs bidirectional
communication with the meters and can process and analyze high volumes of information expeditiously. In
this section, the SGMS and the interacting systems will be discussed, along with the net benefits and costs
associated with this system.
3.2 PRE–SMART GRID
Before 2006, the SGMS was purely a hypothetical tool that EPB aspired to own. The meter infrastructure
at that time was composed of analog meters that required EPB employees, known as meter readers, to
collect the readings using handheld recording devices. Readings were collected once every month; but in
some cases, collecting the data could be a challenge, as locked gates, heavy foliage, unrestrained dogs, or
inclement weather could delay readings. The average time for meter reading was 0–60 seconds per premise.
Meter reader staff were maintained at the levels necessary to read one energy usage data point per billing
cycle.
Without the SGMS, information on other deployed systems was also lacking. Load forecasting, theft
detection, lower customer count outages, and demand response (DR) were impossible. A set of customers
at the end of a feeder could be without power for an extended period without EPB’s knowledge until the
utility received a phone call or obtained information about the outage. This situation has changed with the
deployment of the SGMS and use of advanced metering infrastructure (AMI).
3.3 SMART GRID MANAGEMENT SYSTEM
3.3.1 Introduction
Today, the EPB SGMS collects, processes, transfers, and stores meter data automatically at a resolution of
15 minutes per meter (configurable up to a 5-minute resolution). This means that EPB collects just under
17 million meter readings per day. The infrastructure of advanced meters, fiber communication, and
software have provided EPB with the ability to automatically and rapidly pull customer billing information
without the need of meter readers. Other more advanced features have been added to this functionality,
including identifying outages automatically by recognizing clusters of outages, detecting potential theft,
and giving customers feedback on potential electrical consumption.
3.3.2 The Technology
The technology that makes up the SGMS consists of many systems. They include systems that read the data
pushed by the meters for residential, commercial, and industrial customers; convert the data to the correct
format; and transfer the information to a centralized location where it is stored, protected, processed at high
volumes at high rates of speed, and made available for interface with other EPB systems. These data are
interlinked with other systems such as OMS, which provides automatic identification of potential issues.
6
3.3.2.1 Single-Phase Meter Residential Data
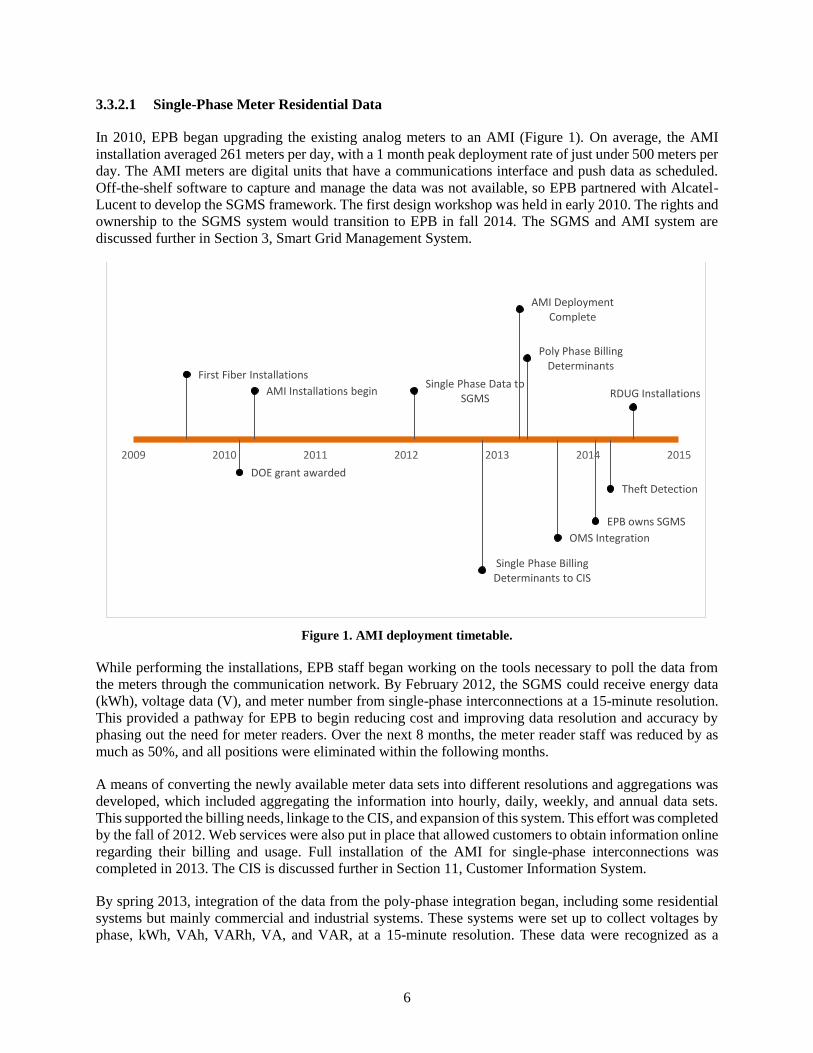
In 2010, EPB began upgrading the existing analog meters to an AMI (Figure 1). On average, the AMI
installation averaged 261 meters per day, with a 1 month peak deployment rate of just under 500 meters per
day. The AMI meters are digital units that have a communications interface and push data as scheduled.
Off-the-shelf software to capture and manage the data was not available, so EPB partnered with Alcatel-
Lucent to develop the SGMS framework. The first design workshop was held in early 2010. The rights and
ownership to the SGMS system would transition to EPB in fall 2014. The SGMS and AMI system are
discussed further in Section 3, Smart Grid Management System.
Figure 1. AMI deployment timetable.
While performing the installations, EPB staff began working on the tools necessary to poll the data from
the meters through the communication network. By February 2012, the SGMS could receive energy data
(kWh), voltage data (V), and meter number from single-phase interconnections at a 15-minute resolution.
This provided a pathway for EPB to begin reducing cost and improving data resolution and accuracy by
phasing out the need for meter readers. Over the next 8 months, the meter reader staff was reduced by as
much as 50%, and all positions were eliminated within the following months.
A means of converting the newly available meter data sets into different resolutions and aggregations was
developed, which included aggregating the information into hourly, daily, weekly, and annual data sets.
This supported the billing needs, linkage to the CIS, and expansion of this system. This effort was completed
by the fall of 2012. Web services were also put in place that allowed customers to obtain information online
regarding their billing and usage. Full installation of the AMI for single-phase interconnections was
completed in 2013. The CIS is discussed further in Section 11, Customer Information System.
By spring 2013, integration of the data from the poly-phase integration began, including some residential
systems but mainly commercial and industrial systems. These systems were set up to collect voltages by
phase, kWh, VAh, VARh, VA, and VAR, at a 15-minute resolution. These data were recognized as a
First Fiber Installations
DOE grant awarded
AMI Installations begin Single Phase Data to
SGMS
Single Phase Billing Determinants to CIS
AMI Deployment Complete
Poly Phase Billing Determinants
OMS Integration
Theft Detection
EPB owns SGMS
RDUG Installations
2009 2010 2011 2012 2013 2014 2015
7
potential key diagnostic component of outage awareness. By fall 2013, integration of the SGMS into the
OMS was conducted. It provided the capability for greater outage awareness and a much more rapid
response to outages than previously available. This effort is discussed in more detail in Section 8, Outage
Management.
Using the data, algorithms were embedded into SGMS that could detect unusual activity in consumption.
Theft detection, implemented in spring 2014, was one of the first results gained from the algorithms. Studies
estimated that the cost of energy theft to EPB exceeded $5 million per year. Provisions for SGMS to send
information down to individual meters were also integrated, providing EPB the ability to send remote
disconnection signals to those with the most frequent field visits.
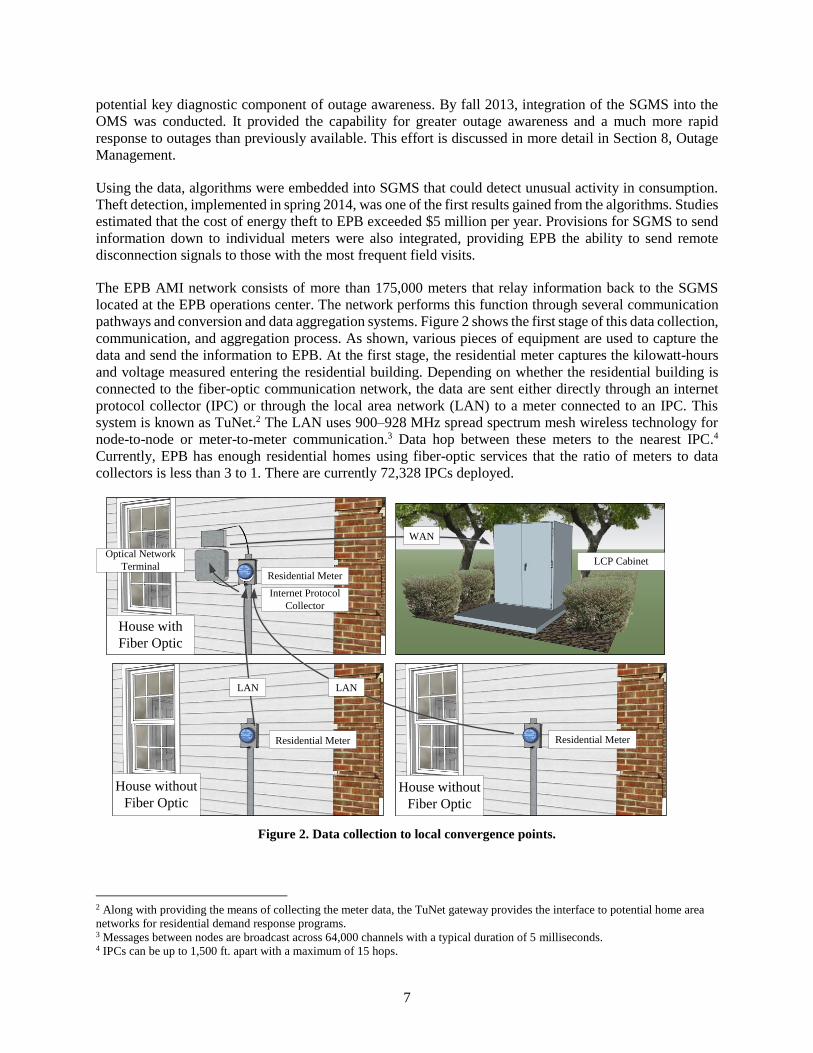
The EPB AMI network consists of more than 175,000 meters that relay information back to the SGMS
located at the EPB operations center. The network performs this function through several communication
pathways and conversion and data aggregation systems. Figure 2 shows the first stage of this data collection,
communication, and aggregation process. As shown, various pieces of equipment are used to capture the
data and send the information to EPB. At the first stage, the residential meter captures the kilowatt-hours
and voltage measured entering the residential building. Depending on whether the residential building is
connected to the fiber-optic communication network, the data are sent either directly through an internet
protocol collector (IPC) or through the local area network (LAN) to a meter connected to an IPC. This
system is known as TuNet.2 The LAN uses 900–928 MHz spread spectrum mesh wireless technology for
node-to-node or meter-to-meter communication.3 Data hop between these meters to the nearest IPC.4
Currently, EPB has enough residential homes using fiber-optic services that the ratio of meters to data
collectors is less than 3 to 1. There are currently 72,328 IPCs deployed.
Figure 2. Data collection to local convergence points.
2 Along with providing the means of collecting the meter data, the TuNet gateway provides the interface to potential home area
networks for residential demand response programs. 3 Messages between nodes are broadcast across 64,000 channels with a typical duration of 5 milliseconds. 4 IPCs can be up to 1,500 ft. apart with a maximum of 15 hops.
Residential Meter
Internet Protocol
Collector
Optical Network
Terminal
Residential Meter
Residential Meter
House without
Fiber Optic
House without
Fiber Optic
House with
Fiber Optic
LANLAN
LCP Cabinet
WAN
8
At this stage, the IPC sends the data to the optical network terminal (ONT). The IPCs are the main power
source for the ONT. These data are collected and then sent through the fiber network to local convergence
points, which then relay the data back to another aggregation data point known as a Supernode and finally
to the EPB operations center.
Many key features are used in the meters and support the advanced capabilities.
• Active outage notification immediately identifies a potential outage and sends the information to
SGMS.
• Outages are time-stamped at the time of occurrence rather than at the time of message receipt, thereby
allowing an accurate capture of outage history.
• A supercapacitor is available that allows continued communication up to 5 minutes after power is lost
in the IPC.
• The time is broadcast to the nodes daily to verify all nodes are time-synced.
• The system is designed as a “push” network, meaning that intelligence is embedded in the endpoint
device which allows the node to initiate communication for an event. It does not have to be “polled”
from the server.
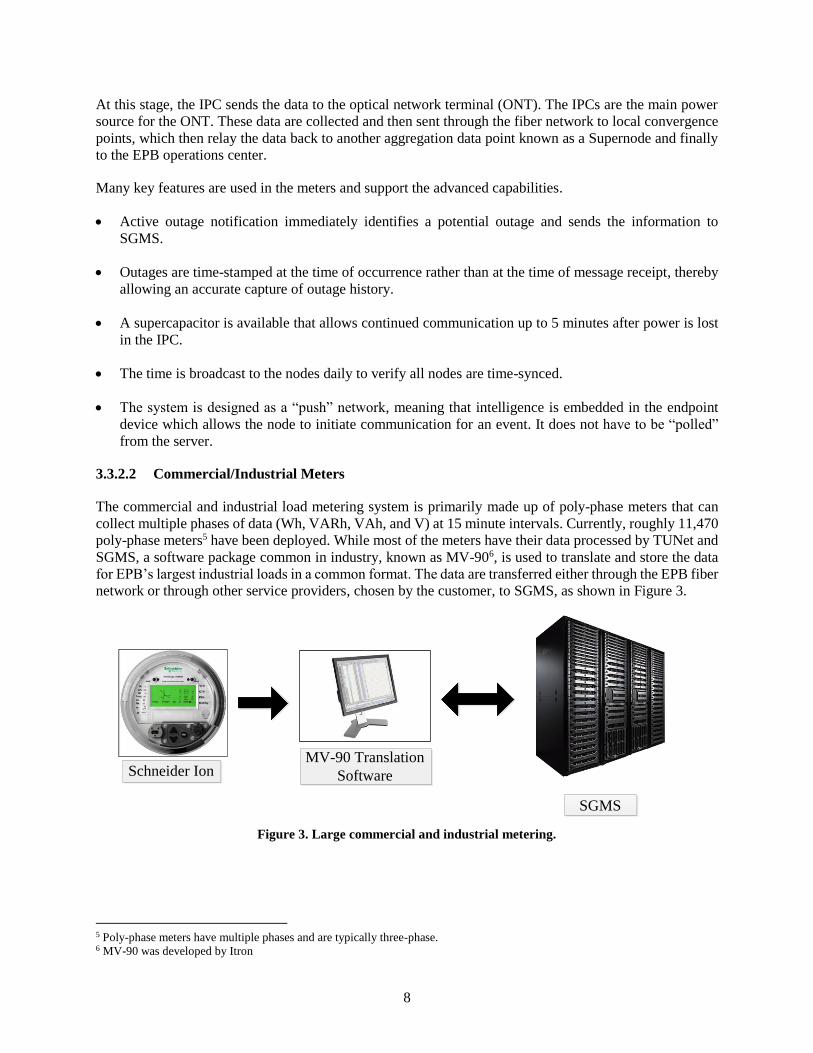
3.3.2.2 Commercial/Industrial Meters
The commercial and industrial load metering system is primarily made up of poly-phase meters that can
collect multiple phases of data (Wh, VARh, VAh, and V) at 15 minute intervals. Currently, roughly 11,470
poly-phase meters5 have been deployed. While most of the meters have their data processed by TUNet and
SGMS, a software package common in industry, known as MV-906, is used to translate and store the data
for EPB’s largest industrial loads in a common format. The data are transferred either through the EPB fiber
network or through other service providers, chosen by the customer, to SGMS, as shown in Figure 3.
Figure 3. Large commercial and industrial metering.
5 Poly-phase meters have multiple phases and are typically three-phase. 6 MV-90 was developed by Itron
Schneider IonMV-90 Translation
Software
SGMS
9
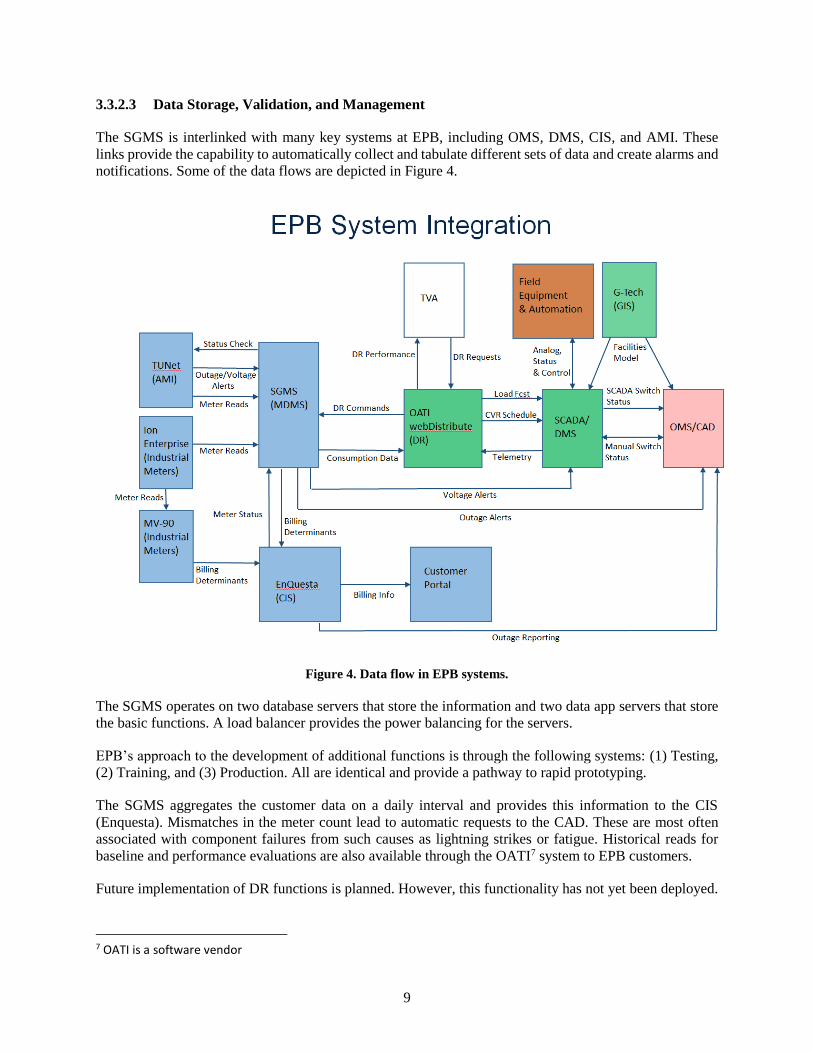
3.3.2.3 Data Storage, Validation, and Management
The SGMS is interlinked with many key systems at EPB, including OMS, DMS, CIS, and AMI. These
links provide the capability to automatically collect and tabulate different sets of data and create alarms and
notifications. Some of the data flows are depicted in Figure 4.
Figure 4. Data flow in EPB systems.
The SGMS operates on two database servers that store the information and two data app servers that store
the basic functions. A load balancer provides the power balancing for the servers.
EPB’s approach to the development of additional functions is through the following systems: (1) Testing,
(2) Training, and (3) Production. All are identical and provide a pathway to rapid prototyping.
The SGMS aggregates the customer data on a daily interval and provides this information to the CIS
(Enquesta). Mismatches in the meter count lead to automatic requests to the CAD. These are most often
associated with component failures from such causes as lightning strikes or fatigue. Historical reads for
baseline and performance evaluations are also available through the OATI7 system to EPB customers.
Future implementation of DR functions is planned. However, this functionality has not yet been deployed.
7 OATI is a software vendor

10
3.3.2.4 Advanced Analytics
With the available data in the SGMS, additional analytics have been constructed to identify aspects of
potential theft and system concerns at the customer location. The 15-minute resolution of data in the SGMS,
along with active outage notification, provide key indicators of potential theft. Currently, the SGMS is used
to detect combinations of operational states and electricity consumption to flag potential thefts. About 75
different operational states exist for the meters, including disconnected, outage, active, and others. For
example, if a meter is in the operational state “disconnected” and is measuring load, the CIS flags the
account for potential theft, and a work order is placed in CAD to investigate.
Historical trending data and baseline calculations provide basic performance information to customers on
their electricity consumption. Flags can be set to identify sudden abnormal consumption behavior for a
customer. For example, a customer electricity consumption profile may significantly exceed previous year
patterns because of the activation of HVAC strip heating instead of the heat pump. This could indicate a
failure in the activation of the heat pump due to mechanical issues. Historical data can also be used to
determine transformer failure by looking for voltage increases at the meter.
3.4 COST
The cost of SGMS implementation and hardware mostly comes in the form of servers and engineering time
(Table 1). However, the AMI infrastructure paved the way for much of this development, along with the
fiber communication backbone.
Table 1. Cost of SGMS implementation
Cost
Product licensing, vendor services and
integration
$4,966,056
EPB internal labor $888,000
Total cost $5,854,056
3.5 BENEFIT
Automatic Meter Reading: The ability to automatically collect and send data to the SGMS and distribute
the information to billing has provided EPB significant cost savings. Meter readers were no longer needed,
and the system was designed to automatically dispatch trucks as necessary. By 2014, a consistent savings
of approximately $2 million per year was realized, as shown in Table 2.
Remote Disconnect Under Glass: The AMI has also improved EPB’s ability to respond to customers who
are having difficulty paying their bills. Before the Smart Grid technologies were implemented, the time
lapse between a customer’s paying a delinquent bill and their power being restored could range from
minutes to hours. Now EPB can restore power 10 minutes after a customer pays a delinquent bill. EPB can
accomplish this by using Remote Disconnect Under Glass (RDUG) meters, a new smart meter that has
remote connect and disconnect ability. The RDUGs have improved EPB’s responsiveness to its customers
while also reducing the number of truck rolls required to activate a meter. EPB has installed 10,000 of these
RDUG meters, starting with customers who received a large number of truck rolls over a 3-year period.
EPB’s 10,000 RDUG meters were installed at every house receiving more than three truck rolls per year.
Power can be restored to the RDUGs within minutes of a customer’s paying a delinquent bill, and the meters
11
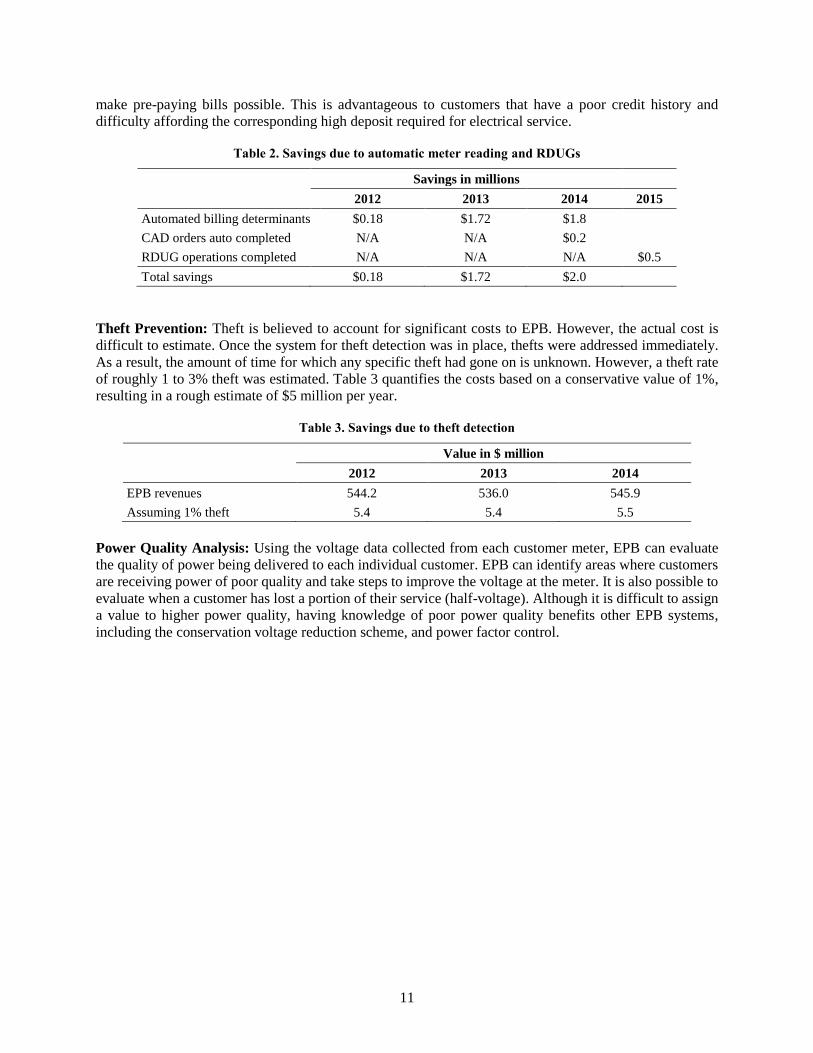
make pre-paying bills possible. This is advantageous to customers that have a poor credit history and
difficulty affording the corresponding high deposit required for electrical service.
Table 2. Savings due to automatic meter reading and RDUGs
Savings in millions
2012 2013 2014 2015
Automated billing determinants $0.18 $1.72 $1.8
CAD orders auto completed N/A N/A $0.2
RDUG operations completed N/A N/A N/A $0.5
Total savings $0.18 $1.72 $2.0
Theft Prevention: Theft is believed to account for significant costs to EPB. However, the actual cost is
difficult to estimate. Once the system for theft detection was in place, thefts were addressed immediately.
As a result, the amount of time for which any specific theft had gone on is unknown. However, a theft rate
of roughly 1 to 3% theft was estimated. Table 3 quantifies the costs based on a conservative value of 1%,
resulting in a rough estimate of $5 million per year.
Table 3. Savings due to theft detection
Value in $ million
2012 2013 2014
EPB revenues 544.2 536.0 545.9
Assuming 1% theft 5.4 5.4 5.5
Power Quality Analysis: Using the voltage data collected from each customer meter, EPB can evaluate
the quality of power being delivered to each individual customer. EPB can identify areas where customers
are receiving power of poor quality and take steps to improve the voltage at the meter. It is also possible to
evaluate when a customer has lost a portion of their service (half-voltage). Although it is difficult to assign
a value to higher power quality, having knowledge of poor power quality benefits other EPB systems,
including the conservation voltage reduction scheme, and power factor control.

12
13
4. DISTRIBUTION MANAGEMENT SYSTEM
4.1 SUMMARY
The DMS implemented at EPB was developed by Open Systems International Inc. (OSI). The software
suite being used is OSI’s DMS, Spectra suite. It is a powerful set of tools that allows utility operators to
view and manage their distribution networks, from topology and power flow to automation and switch order
management. The OSI Spectra suite consists of several useful products. Spectra Distribution Power Flow
(DPF) is a three-phase distribution network power flow calculation tool. Spectra Voltage/VAR Control
(VVC) is a voltage and VAR control tool for loss reduction, conservation voltage reduction (CVR) and
power factor improvement. Spectra Fault Location, Isolation and Service Restoration (FLISR) is used to
manage faults and restore service. And Spectra Feeder Reconfiguration (FR) enables loss reduction and
voltage profile improvement.
Currently, seven functions have been fully implemented at EPB:
• Unbalanced three-phase power flow (basic model and tool)
• VVC (voltage reduction as a special case)
• Fault location
• Fault analysis
• Service restoration
• FR
• Planned switching
These functions work together to automatically manage the distribution network operation, improve
reliability, and reduce operational costs for EPB and its electricity customers. This section discusses the
DMS, the functions it supports, and the associated benefits and costs.
4.2 PRE–SMART GRID
Before the implementation of the EPB DMS, the distribution network was not as fully instrumented as it is
today. EPB had full telemetry and control of all substation circuit breakers and voltage regulating devices
(load tap changers and line side voltage regulators). EPB also had control of approximately 230 devices
beyond the substation fences (approximately 110 sub-transmission motor-operated switches [MOSs] and
20 reclosers). At the time, operators were often notified too late to take preventative actions for a violation
in voltage or power flow limits. This would lead to a system fault and cause customer outages, reducing
EPB reliability figures. The capabilities of analysis and decision making were mostly dependent on the
experience and intelligence of the operators.
Without the availability of power flow models and limited telemetry, visualization of the system status for
system operators was not possible. Thus, during an event, an operator could know which devices saw the
event, but pinpointing the event location was difficult. Customer calls would then be used to narrow down
the search area for the event. Voltage regulators and capacitors did provide some VVC capability. CVR
functionality was available, but maintenance of the system was more complex. Locating a fault and
restoring electricity service was based on the dispatch crew performance. This was both a time-consuming
and expensive proposition. Furthermore, planned switching for maintenance was normally done manually,
and feeder reconfiguration was performed only as part of an annual capacity planning process.
14
4.3 POST–SMART GRID
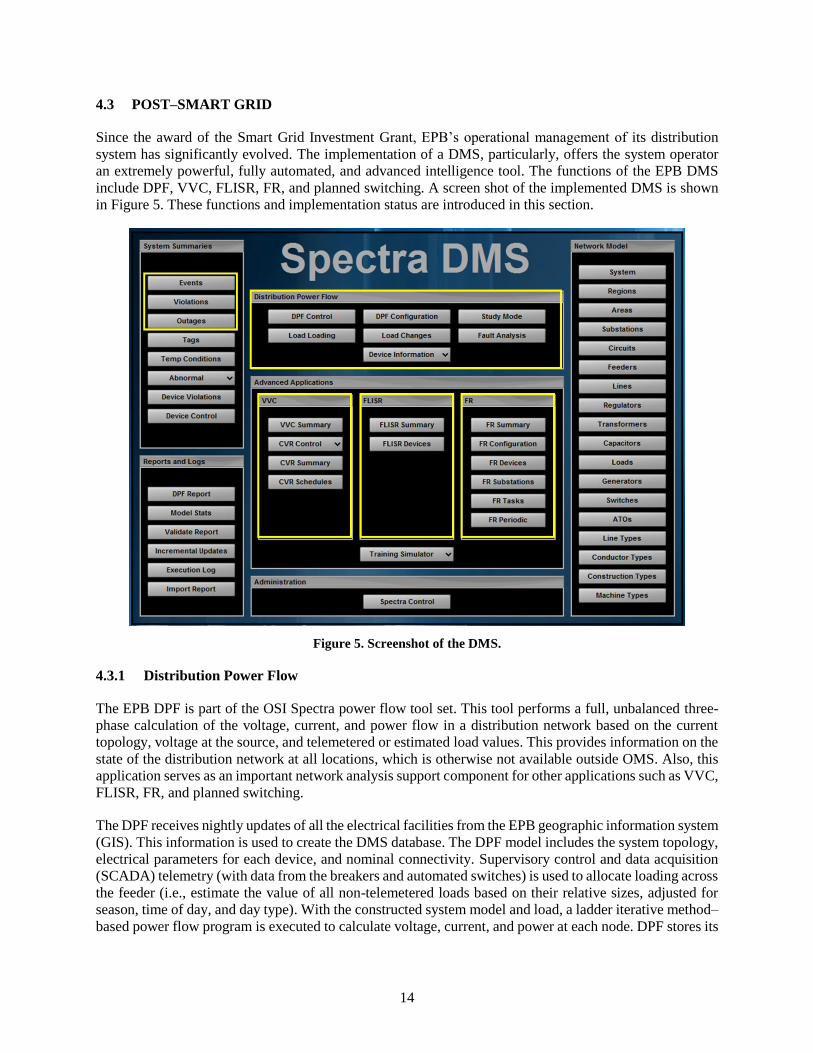
Since the award of the Smart Grid Investment Grant, EPB’s operational management of its distribution
system has significantly evolved. The implementation of a DMS, particularly, offers the system operator
an extremely powerful, fully automated, and advanced intelligence tool. The functions of the EPB DMS
include DPF, VVC, FLISR, FR, and planned switching. A screen shot of the implemented DMS is shown
in Figure 5. These functions and implementation status are introduced in this section.
Figure 5. Screenshot of the DMS.
4.3.1 Distribution Power Flow
The EPB DPF is part of the OSI Spectra power flow tool set. This tool performs a full, unbalanced three-
phase calculation of the voltage, current, and power flow in a distribution network based on the current
topology, voltage at the source, and telemetered or estimated load values. This provides information on the
state of the distribution network at all locations, which is otherwise not available outside OMS. Also, this
application serves as an important network analysis support component for other applications such as VVC,
FLISR, FR, and planned switching.
The DPF receives nightly updates of all the electrical facilities from the EPB geographic information system
(GIS). This information is used to create the DMS database. The DPF model includes the system topology,
electrical parameters for each device, and nominal connectivity. Supervisory control and data acquisition
(SCADA) telemetry (with data from the breakers and automated switches) is used to allocate loading across
the feeder (i.e., estimate the value of all non-telemetered loads based on their relative sizes, adjusted for
season, time of day, and day type). With the constructed system model and load, a ladder iterative method–
based power flow program is executed to calculate voltage, current, and power at each node. DPF stores its
15
calculation results in the eMap database. These results can be viewed using any number of Advanced
Tabulars™ displays, as well as a one-line display that is linked to these results.
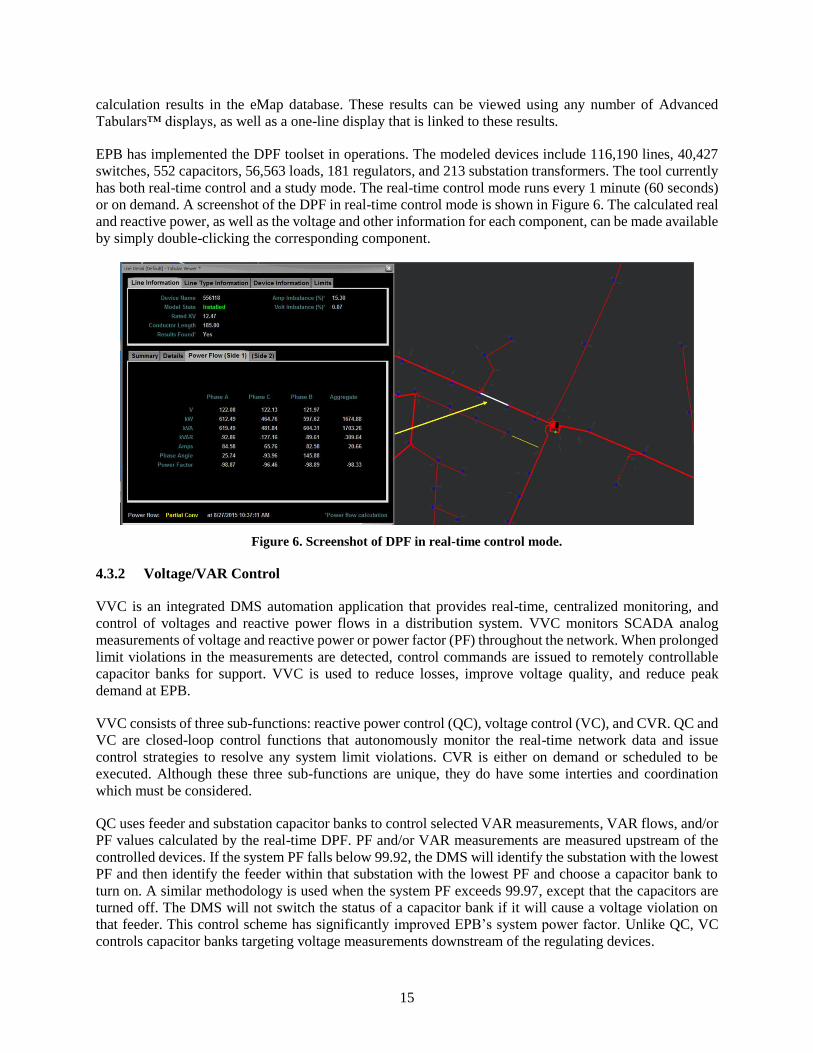
EPB has implemented the DPF toolset in operations. The modeled devices include 116,190 lines, 40,427
switches, 552 capacitors, 56,563 loads, 181 regulators, and 213 substation transformers. The tool currently
has both real-time control and a study mode. The real-time control mode runs every 1 minute (60 seconds)
or on demand. A screenshot of the DPF in real-time control mode is shown in Figure 6. The calculated real
and reactive power, as well as the voltage and other information for each component, can be made available
by simply double-clicking the corresponding component.
Figure 6. Screenshot of DPF in real-time control mode.
4.3.2 Voltage/VAR Control
VVC is an integrated DMS automation application that provides real-time, centralized monitoring, and
control of voltages and reactive power flows in a distribution system. VVC monitors SCADA analog
measurements of voltage and reactive power or power factor (PF) throughout the network. When prolonged
limit violations in the measurements are detected, control commands are issued to remotely controllable
capacitor banks for support. VVC is used to reduce losses, improve voltage quality, and reduce peak
demand at EPB.
VVC consists of three sub-functions: reactive power control (QC), voltage control (VC), and CVR. QC and
VC are closed-loop control functions that autonomously monitor the real-time network data and issue
control strategies to resolve any system limit violations. CVR is either on demand or scheduled to be
executed. Although these three sub-functions are unique, they do have some interties and coordination
which must be considered.
QC uses feeder and substation capacitor banks to control selected VAR measurements, VAR flows, and/or
PF values calculated by the real-time DPF. PF and/or VAR measurements are measured upstream of the
controlled devices. If the system PF falls below 99.92, the DMS will identify the substation with the lowest
PF and then identify the feeder within that substation with the lowest PF and choose a capacitor bank to
turn on. A similar methodology is used when the system PF exceeds 99.97, except that the capacitors are
turned off. The DMS will not switch the status of a capacitor bank if it will cause a voltage violation on
that feeder. This control scheme has significantly improved EPB’s system power factor. Unlike QC, VC
controls capacitor banks targeting voltage measurements downstream of the regulating devices.
16
Except for the possible interaction caused by using capacitor banks as regulating devices, the VC function
runs independently of QC. EPB has set VC to be a higher priority than QC during off-peak (non-summer)
months for the devices controlled by the DMS. During on-peak months, QC receives higher priority. This
is based upon the fact that a voltage violation is a location-specific issue that needs to be addressed by a
specific device. The system PF can be corrected by operating many devices. In some cases, a correction for
a voltage violation also corrects the system PF.
As a special case of VC, CVR can be used to reduce the peak demand by lowering the voltage at the load
tap changing transformers and regulators close to the lower limit of ANSI standard C84.1. CVR can be
used as a completely stand-alone application (that is, with closed-loop control functions disabled) or can be
used in conjunction with either or both closed-loop control functions. When CVR, VC, and QC are all
implemented, QC functions more or less independently of CVR. However, VC is coordinated with CVR
and remediates any low-voltage violations that occur because of CVR actions.
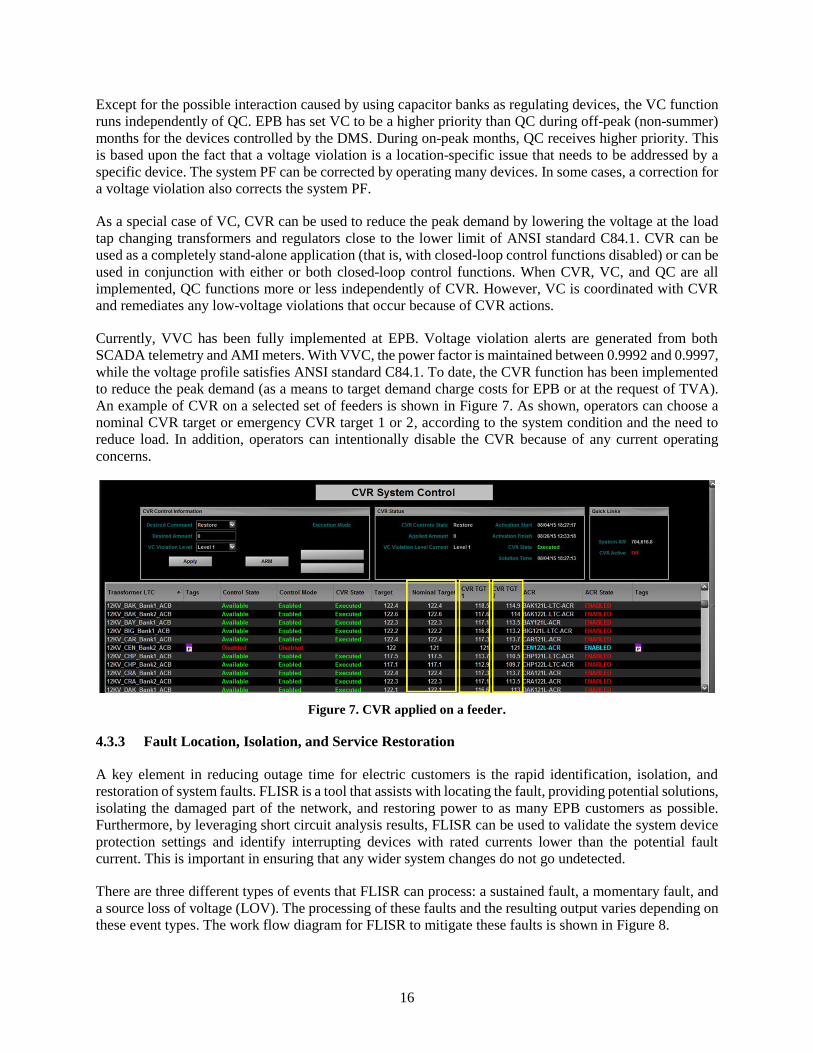
Currently, VVC has been fully implemented at EPB. Voltage violation alerts are generated from both
SCADA telemetry and AMI meters. With VVC, the power factor is maintained between 0.9992 and 0.9997,
while the voltage profile satisfies ANSI standard C84.1. To date, the CVR function has been implemented
to reduce the peak demand (as a means to target demand charge costs for EPB or at the request of TVA).
An example of CVR on a selected set of feeders is shown in Figure 7. As shown, operators can choose a
nominal CVR target or emergency CVR target 1 or 2, according to the system condition and the need to
reduce load. In addition, operators can intentionally disable the CVR because of any current operating
concerns.
Figure 7. CVR applied on a feeder.
4.3.3 Fault Location, Isolation, and Service Restoration
A key element in reducing outage time for electric customers is the rapid identification, isolation, and
restoration of system faults. FLISR is a tool that assists with locating the fault, providing potential solutions,
isolating the damaged part of the network, and restoring power to as many EPB customers as possible.
Furthermore, by leveraging short circuit analysis results, FLISR can be used to validate the system device
protection settings and identify interrupting devices with rated currents lower than the potential fault
current. This is important in ensuring that any wider system changes do not go undetected.
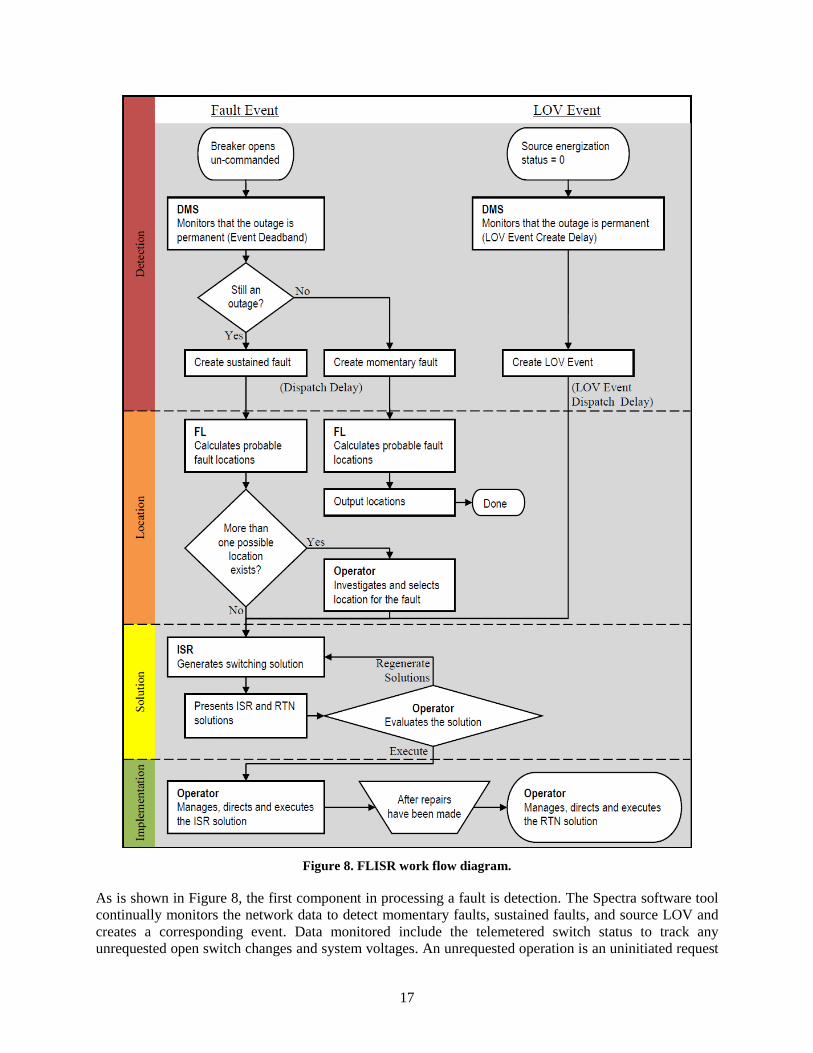
There are three different types of events that FLISR can process: a sustained fault, a momentary fault, and
a source loss of voltage (LOV). The processing of these faults and the resulting output varies depending on
these event types. The work flow diagram for FLISR to mitigate these faults is shown in Figure 8.
17
Figure 8. FLISR work flow diagram.
As is shown in Figure 8, the first component in processing a fault is detection. The Spectra software tool
continually monitors the network data to detect momentary faults, sustained faults, and source LOV and
creates a corresponding event. Data monitored include the telemetered switch status to track any
unrequested open switch changes and system voltages. An unrequested operation is an uninitiated request

18
by the SCADA for an open switch control (that is, a switch is opened in the field without a SCADA control
request). It is associated with momentary and sustained fault events. An LOV event is created when the
Spectra eMap source energization goes to zero.
After detection, the Spectra FLISR tool automatically attempts to locate the momentary and sustained faults
using the wide set of information available. As an example, for momentary faults, the fault currents on the
protective devices are pulled into SCADA and processed in FLISR. The FLISR tool runs and processes
distribution lines in the network and compares the calculated fault current values of the network with the
captured values to determine the fault location. Typically, the developed fault currents are unique
throughout the network, since they are based purely on the impedance between the fault and the source.
However, depending on how the feeder is designed, there is the possibility that more than one location will
have the same impedance between the fault and source. During such an occurrence, FLISR identifies each
possible location with a relative probability highlighted in the geographic display.
For sustained faults, additional fault indicators are also used to help establish the faulted phase as well as
to exclude distribution feeder sections from analysis. An example of fault location is shown in Figure 9.
The purple section on the line has been identified as the highest-probability location of a fault, with orange
and yellow colors representing lower probabilities. Once a fault has been detected and the location
determined, FLISR attempts to output a set of recommended switching actions to isolate the faulted device
and restore the service to the downstream customers. Finding a recommended switching action for an LOV
condition is identical to the process for finding a sustained fault.
Once the system has been repaired (by replacing damaged equipment), a typical action is to restore the
system to the pre-faulted configuration. The FLISR tool can provide the switching output steps to place the
network back into this configuration.
Currently at EPB, the FLISR fault location function has been fully implemented to identify the location of
both momentary and sustained faults. Although the fault isolation and service restoration is available in the
EPB DMS, a separate distributed automation platform currently performs this function autonomously (see
Section 7, Automation). In addition, the fault current analysis methods have been fully implemented to
validate the device protection settings, as well as the ratings of interrupting devices.

19
Figure 9. Example of fault location results.
4.3.4 Feeder Reconfiguration
FR is used to support a reduction in losses, improve voltage, and reduce loading on facilities that results
from system changes. For example, a new, more optimal configuration may be available because of a fault
that creates an outage or creates anticipated system fluctuations that place a strain on equipment. FR
provides switching procedures to support these changes. Five sub-functions are included: loading violation
remediation (LVR), voltage violation remediation (VVR), load balancing (LB), optimization (OPT), and
equipment loading reduction (EQL).
The LVR and VVR functions autonomously operate to handle emerging DMS events. LVR specifically
targets device overloading, while VVC is focused on high/low voltage conditions. LB, OPT, and EQL are
usually scheduled to run periodically or on demand. The LB function is mainly used to balance the load
between feeders and substations. OPT is primarily for reducing the system losses, and EQL is used to reduce
loading on devices expected to experience overloading conditions in the future. These functions are realized
by reconfiguration of the distribution feeders.
FR can be operated in a closed-loop mode (automatically make decisions) to remotely control automated
switches as needed. However, EPB currently uses FR for long-term topology-recommended changes.
Currently, implementation of this closed-loop function is challenged by a conflict with the automated
protection systems currently deployed.
4.3.5 Planned Switching
For events requiring maintenance or routine fixes, the DMS uses load flow results and equipment ratings
to provide switching actions required to isolate a selected portion of a circuit or piece of equipment and
maintain service to customers. In addition, the DMS has look-ahead functionality (using load forecast for
the next several hours) to ensure the recommended switch actions will provide sufficient capacity to
customers during the time of planned maintenance. Selection of the automated switches precedes selection
of any manual switches.
20
EPB currently uses this functionality on a limited basis but has plans to use it more widely when a new
feature for managing switching/clearance orders becomes available.
4.4 COST
In 2012, EPB purchased the Spectra suite for $1,500,000. The DMS was implemented at EPB in 2013.
The annual maintenance cost that EPB pays is approximately $120,000 per year (for both SCADA and
DMS).
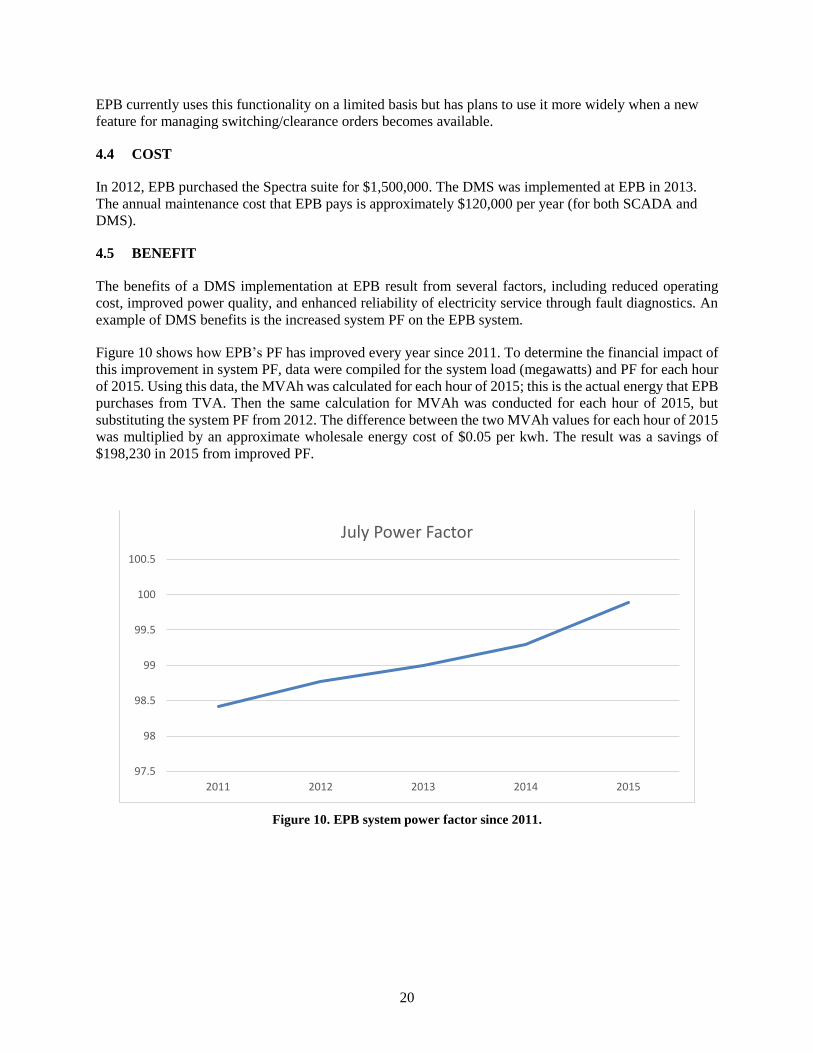
4.5 BENEFIT
The benefits of a DMS implementation at EPB result from several factors, including reduced operating
cost, improved power quality, and enhanced reliability of electricity service through fault diagnostics. An
example of DMS benefits is the increased system PF on the EPB system.
Figure 10 shows how EPB’s PF has improved every year since 2011. To determine the financial impact of
this improvement in system PF, data were compiled for the system load (megawatts) and PF for each hour
of 2015. Using this data, the MVAh was calculated for each hour of 2015; this is the actual energy that EPB
purchases from TVA. Then the same calculation for MVAh was conducted for each hour of 2015, but
substituting the system PF from 2012. The difference between the two MVAh values for each hour of 2015
was multiplied by an approximate wholesale energy cost of $0.05 per kwh. The result was a savings of
$198,230 in 2015 from improved PF.
Figure 10. EPB system power factor since 2011.
97.5
98
98.5
99
99.5
100
100.5
2011 2012 2013 2014 2015
July Power Factor
21
5. DEMAND MANAGEMENT SYSTEM
5.1 SUMMARY
This section discusses the DMS at EPB. The DMS is composed of both DR programs and CVR mechanisms
to meet both EPB and TVA needs.
5.2 PRE–SMART GRID
The initial implementation of a DR management system at EPB came in the form of CVR. This service
allowed reduction of the overall demand through a reduction in voltage, although no specific software
package was available. Instead, CVR was custom programmed and provided as a feature of the previous
SCADA system. The CVR program was quite effective; however, without measurements of voltage at the
customer locations, voltages were more likely to be unknowingly outside ANSI standards. Before
implementation of the Smart Grid, the EPB DMS had not been created, and there was a limited quantity of
regulators and capacitors. Implementation of CVR control functions was performed at the substations.
Without the implementation of voltage controls along a feeder, the maximum amount of voltage reduction
supported was limited to the full voltage drop of the feeder line. In many cases, this could be significant
and would eliminate feeders from supporting CVR services and demand reduction.
Furthermore, the benefits of implementing any type of demand management did not exist at the time. The
transmission authority providing EPB electricity, TVA, accommodated only pay-for-energy service until
April 2011. Before that date, a utility could create an extremely large peak without being penalized, so
managing peak or high-consumption periods had little value for EPB. There was a period of approximately
1 year before the commissioning of the DMS when EPB paid a peak demand charge. The demand reduction
was primarily provided by using CVR through SCADA.
5.3 POST–SMART GRID
In 2010, EPB was awarded a grant from TVA to boost its CVR capability. This included the installation of
approximately 75 regulators, 80 capacitors, and additional line improvements. The grant also paid for the
software package webDistribute from OATI that carries out much of the DR management services for EPB
today. DR management became a more important consideration when, in 2011, TVA modified the sale of
electricity to a demand charge and energy wholesale time of use (TOU) rate. The demand charge is a
function of the highest electricity consumption during an hour during a given time window (usually a
calendar month.) The rates are provided in Table 4.
Table 4. TVA rate structure for EPB
Wholesale pricing Summer Winter Transition
Demand charge ($/kW) $10.13 $9.27 $9.27
Onpeak energy1 ($/kWh) $0.05285 $0.4281 $0.3358
Offpeak energy ($/kWh) $0.03085 $.03281
1Onpeak summer is June through September, Monday through Friday, 1 to 9 p.m. EST. Onpeak winter is December through
March, Monday through Friday, 5 to 11 a.m. EST.
The webDistribute application performs many functions related to DR. First, the tool provides estimates of
the load forecast and demand-side savings of CVR to the DMS/SCADA system. This provides a baseline
that the DMS uses to perform voltage reduction determinations and send them to SCADA for execution.

22
OATI webDistribute provides visibility and control capabilities to individual and aggregated demand-side
resources.
DR programs offered by EBP and TVA provide an opportunity for customers to play a significant role in
the operation of the electric grid by reducing or shifting their electricity usage during peak periods in
response to time-based rates or other forms of financial incentives. Such programs can lower the cost of
electricity in wholesale markets and, in turn, lead to lower retail rates. EPB offers various forms of DR
programs to its customers, as is discussed in Section 5.3.1.
5.3.1 Utility Programs
5.3.1.1 Voltage Reduction
EPB has the option with webDistribute of reducing overall demand through adjusting the distribution
system voltage to be lower (delivered voltage not to be outside 5% of the nominal voltage, ANSI C84.1).
For a nominal 120 V, the minimum and maximum allowed voltage is 114 and 126 V, respectively. The
objective demand reduction, CVR factor, and total demand are used to estimate the targeted voltage for
DR. The CVR is a function of the ratio of the typical change in power to change in voltage.
EPB performs voltage reduction typically under two case scenarios. A contract with TVA allows TVA to
request voltage reduction by 10 a.m. for the following day, and TVA pays for any lost energy revenue. This
process is currently initiated by phone call and executed in the DMS. The reductions are limited to a
maximum of 100 hours per year and could be requested for either economic or reliability reasons. EPB may
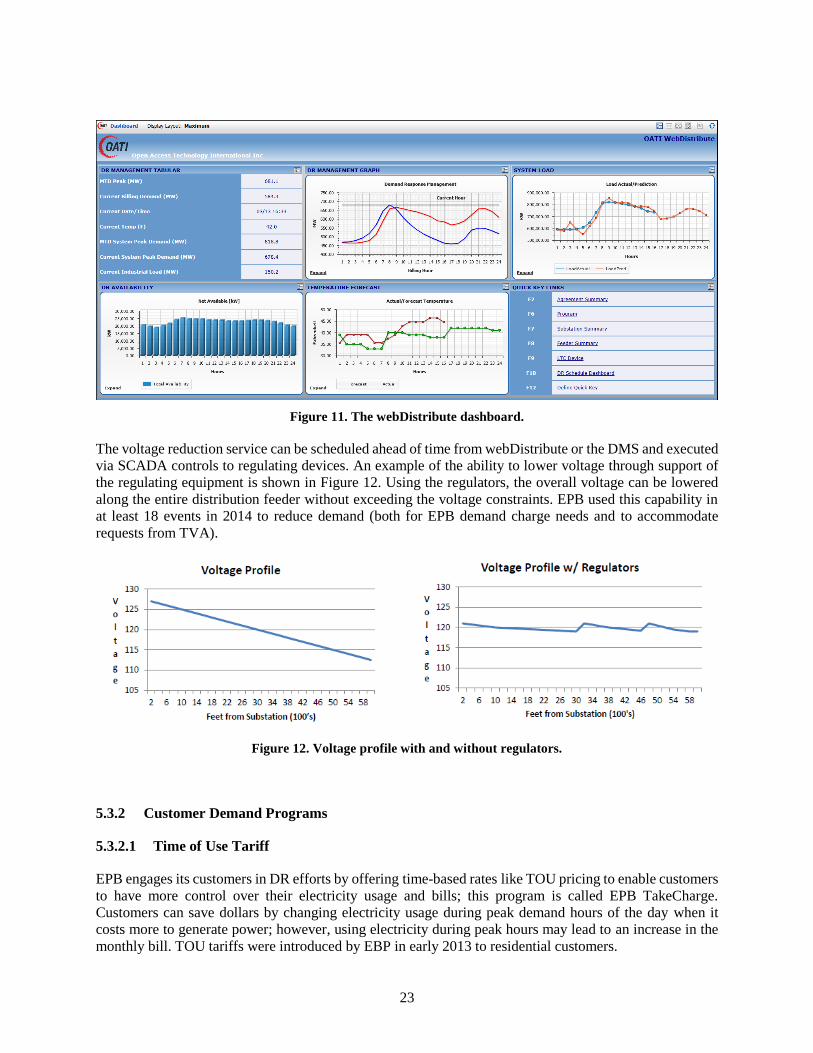
also perform this reduction to manage its own demand charge costs. An example of the webDistribute
interface is shown in Figure 11.
Example:
An example of voltage reduction benefits for DR is shown. The reduced voltage target is 116 V with
a CVR factor of 0.7 (industry average).
𝑘𝑊 𝑆𝑎𝑣𝑖𝑛𝑔𝑠 =(𝑁𝑜𝑟𝑚𝑎𝑙 𝑣𝑜𝑙𝑡𝑎𝑔𝑒 − 𝑇𝑎𝑟𝑔𝑒𝑡 𝑣𝑜𝑙𝑡𝑎𝑔𝑒)
𝑁𝑜𝑟𝑚𝑎𝑙 𝑣𝑜𝑙𝑡𝑎𝑔𝑒∗ 𝐶𝑉𝑅 𝑓𝑎𝑐𝑡𝑜𝑟 ∗ 𝑇𝑜𝑡𝑎𝑙 𝐷𝑒𝑚𝑎𝑛𝑑
=(121 − 116)
121∗ 0.7 ∗ 6145𝑘𝑊 = 177𝑘𝑊 .
23
Figure 11. The webDistribute dashboard.
The voltage reduction service can be scheduled ahead of time from webDistribute or the DMS and executed
via SCADA controls to regulating devices. An example of the ability to lower voltage through support of
the regulating equipment is shown in Figure 12. Using the regulators, the overall voltage can be lowered
along the entire distribution feeder without exceeding the voltage constraints. EPB used this capability in
at least 18 events in 2014 to reduce demand (both for EPB demand charge needs and to accommodate
requests from TVA).
Figure 12. Voltage profile with and without regulators.
5.3.2 Customer Demand Programs
5.3.2.1 Time of Use Tariff
EPB engages its customers in DR efforts by offering time-based rates like TOU pricing to enable customers
to have more control over their electricity usage and bills; this program is called EPB TakeCharge.
Customers can save dollars by changing electricity usage during peak demand hours of the day when it
costs more to generate power; however, using electricity during peak hours may lead to an increase in the
monthly bill. TOU tariffs were introduced by EBP in early 2013 to residential customers.

24
Large commercial and industrial customers also have the option of TOU rates. EPB designed the tariffs for
its residential customers with the intent that it would have no impact on EPB revenue. For example, if too
many customers enroll for TOU tariffs, EPB revenues should not be affected; at the same time, customers
should not be punished for switching to TOU tariffs. TOU rates were designed by EPB and approved by
TVA. Currently, only 117 residential customers (~0.1%) are enrolled in TOU tariffs (Table 5). EPB
suggests a few benefits for customers from the TakeCharge program, for example
• setting thermostats up by a few degrees during peak summer electricity usage hours and down a few
degrees during peak winter hours
• operating dishwashers, washers, dryers at night
• using the oven light at night
• taking hot showers and baths during non-peak hours
EPB TakeCharge requires a 1 year commitment. The rates shown in Table 5 apply.
Table 5. TOU tariff offered by EPB
On-peak vs off-peak times
Rate On-peak rates
(13.5¢ per kWh)
Off-peak rates
(6¢ per kWh)
April–October 3:00–7:00 p.m.
Monday through Friday
12:00 a.m. – 3:00 p.m. and
7:00 p.m. – 12:00 a.m.
Monday through Friday
All day Saturday and Sunday and certain federal
holidays
November–March 6:00–10:00 a.m.
Monday through Friday
12:00 a.m. – 6:00 p.m. and
10:00–12:00 a.m.
Monday through Friday
All day Saturday and Sunday and certain federal
holidays
5.3.2.2 Demand Response Programs
Curtailment programs such as 5-minute response power (5 MR) and 60-minute response power (60 MR)
are offered to commercial and industrial customers; these programs are managed by TVA. The 5 MR
program allows participating commercial and industrial customers to qualify for credits on their power bills
in exchange for giving TVA the right to suspend the availability of 5 MR power to address reliability needs
of the TVA system. The following are the eligibility requirements to participate in the 5 MR program:
1. Total contract demand greater than at least 1,000 kW at a single delivery point.
2. Minimum effective interruptible demand (EID) of at least 500 kW. EID is the amount of demand
reduction that TVA expects the customer to deliver if suspended during TVA’s highest 200 hours of
system demand each year. The 5 MR program is limited to a maximum EID of 1,500 MW.
3. Minimum average load factor greater than 40%.
25
4. An adequate plan for meeting 5 MR suspension requirements.
Other factors do impact the value associated with the DR program, and participants can be penalized for
poor performance.8
5.3.2.3 Aggregated Demand Response
An aggregated DR program has also been initiated and is currently in the pilot phase. This program allows
for distribution companies to aggregate the load to curtail as needed by TVA. The aggregated load is used
only for TVA DR economic reasons and is limited to 12 hours a year with a 30-minute notification. The
Tennessee Valley Public Power Association (TVPPA) Research and Development Committee approved
this program in December 2012, and it was approved for deployment in July 2013 by TVPPA. In July 2013,
the DR Management System algorithm was developed. Finally, contracts between TVA and TVPPA and
between TVPPA and local power companies like EPB were signed in August 2013. Contracts for the
program have been extended to September 2016.
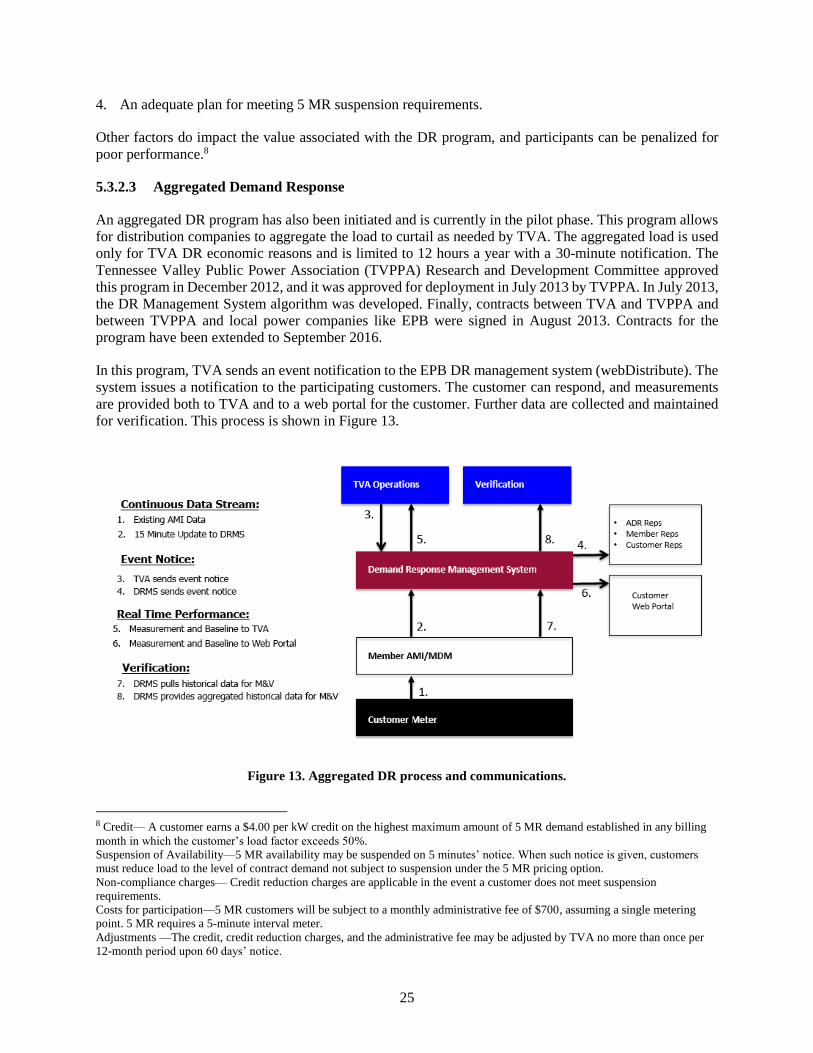
In this program, TVA sends an event notification to the EPB DR management system (webDistribute). The
system issues a notification to the participating customers. The customer can respond, and measurements
are provided both to TVA and to a web portal for the customer. Further data are collected and maintained
for verification. This process is shown in Figure 13.
Figure 13. Aggregated DR process and communications.
8 Credit— A customer earns a $4.00 per kW credit on the highest maximum amount of 5 MR demand established in any billing
month in which the customer’s load factor exceeds 50%.
Suspension of Availability—5 MR availability may be suspended on 5 minutes’ notice. When such notice is given, customers
must reduce load to the level of contract demand not subject to suspension under the 5 MR pricing option.
Non-compliance charges— Credit reduction charges are applicable in the event a customer does not meet suspension
requirements.
Costs for participation—5 MR customers will be subject to a monthly administrative fee of $700, assuming a single metering
point. 5 MR requires a 5-minute interval meter.
Adjustments —The credit, credit reduction charges, and the administrative fee may be adjusted by TVA no more than once per
12-month period upon 60 days’ notice.
26
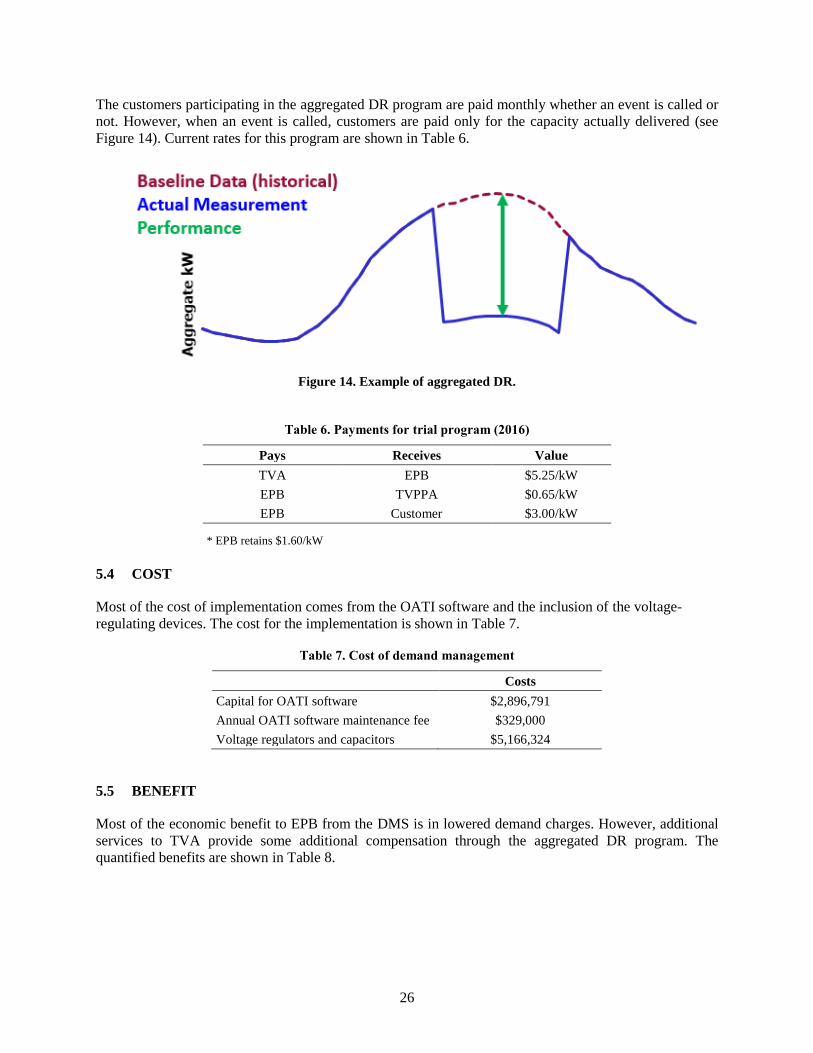
The customers participating in the aggregated DR program are paid monthly whether an event is called or
not. However, when an event is called, customers are paid only for the capacity actually delivered (see
Figure 14). Current rates for this program are shown in Table 6.
Figure 14. Example of aggregated DR.
Table 6. Payments for trial program (2016)
Pays Receives Value
TVA EPB $5.25/kW
EPB TVPPA $0.65/kW
EPB Customer $3.00/kW
* EPB retains $1.60/kW
5.4 COST
Most of the cost of implementation comes from the OATI software and the inclusion of the voltage-
regulating devices. The cost for the implementation is shown in Table 7.
Table 7. Cost of demand management
Costs
Capital for OATI software $2,896,791
Annual OATI software maintenance fee $329,000
Voltage regulators and capacitors $5,166,324
5.5 BENEFIT
Most of the economic benefit to EPB from the DMS is in lowered demand charges. However, additional
services to TVA provide some additional compensation through the aggregated DR program. The
quantified benefits are shown in Table 8.

27
Table 8. Estimated benefits of demand management system
Benefit Estimated value Notes
Demand charge
reduction through
CVR
$2,434,140 to $2,681,014
FY 2013–2014 (July 2013 – June 2014) FY 2014–2015 (July 2014 – June 2015)
Time of use Negligible Number of customers is too small to make a
substantial impact on peak reduction at this stage.
Compensation for
aggregated DR
$272,794.124 FY 2014 – 2015 (October 2014 – September 2015)

28

29
6. SUPERVISORY CONTROL AND DATA ACQUISITION
6.1 SUMMARY
EPB’s SCADA system performs some core capabilities required for electric grid operation. SCADA’s main
responsibility is to communicate to and gather data from field devices and report the most important grid
and device data back to a user in a simple, fast, effective manner. It allows operators to glimpse the current
state of the power system and informs them when abnormal conditions arise. It also allows operators to
remotely control certain devices, such as breakers, voltage regulators, and capacitor banks.
6.2 PRE–SMART GRID
Before the Smart Grid implementation, EPB’s SCADA system primarily monitored and controlled devices
within its 117 substations, including circuit breakers, transformers, voltage regulators, MOSs, and capacitor
banks. The system also monitored and controlled approximately 230 line devices outside the substations—
MOSs, reclosers, capacitor banks, and a small number of voltage regulators.
Remote terminal units (RTUs) reported various parameters such as voltage, current, and switch status,
depending on the type of device. A total of around 22,000 analog data points and 23,000 statuses were
collected by the SCADA system on an as-fast-as-possible basis.
SCADA communicated with RTUs over a 900 MHz radio system. Overall, the system was quite robust,
but there were some inherent limitations. The radios required line-of-sight, challenging in Chattanooga’s
hilly terrain, and signal strength would fade during rain. These issues manifested into frequent “loss of
communication” alarms in SCADA. The system was also limited in its ability to quickly gather data from
the large number of RTUs that would soon be required for the Smart Grid, as SCADA was not designed
for IP communication and had a limited number of channels over which it could serially communicate with
RTUs and field devices.
Although it was limited by communication type and availability of devices, the SCADA system nonetheless
performed its necessary functions for EPB. The system would report the various grid and device parameters
it received and display the data to the operators in the form of one-line diagrams, tabular displays, and alarm
annunciation. Besides typical SCADA functions allowing operators to control switches, capacitor banks,
and regulators remotely, the SCADA system also had the ability to automatically switch on and off
capacitor banks in response to changes in system PF and to programmatically perform voltage reduction or
VVC as initiated by the operator. However, at the time, EPB had many fewer capacitor banks and regulators
than it operates currently. The system also had several custom programs to automatically isolate and restore
outages on the 46 kV sub-transmission system, although development and maintenance of these programs
was quite labor intensive.
6.3 POST–SMART GRID
6.3.1 EPB SCADA system
To accommodate the demands of the Smart Grid, EPB replaced its aging SCADA system with OSI’s
Monarch platform, a collection of applications and servers that act as a centralized system for controlling
and monitoring the EPB distribution system. Besides adding several new features, the updated system is
better able to communicate with the large number of devices that make up the EPB Smart Grid.
The SCADA hierarchy is depicted in Figure 15. The master/primary station is the main SCADA
application; this system communicates to devices or RTUs in a master/slave configuration. A similar
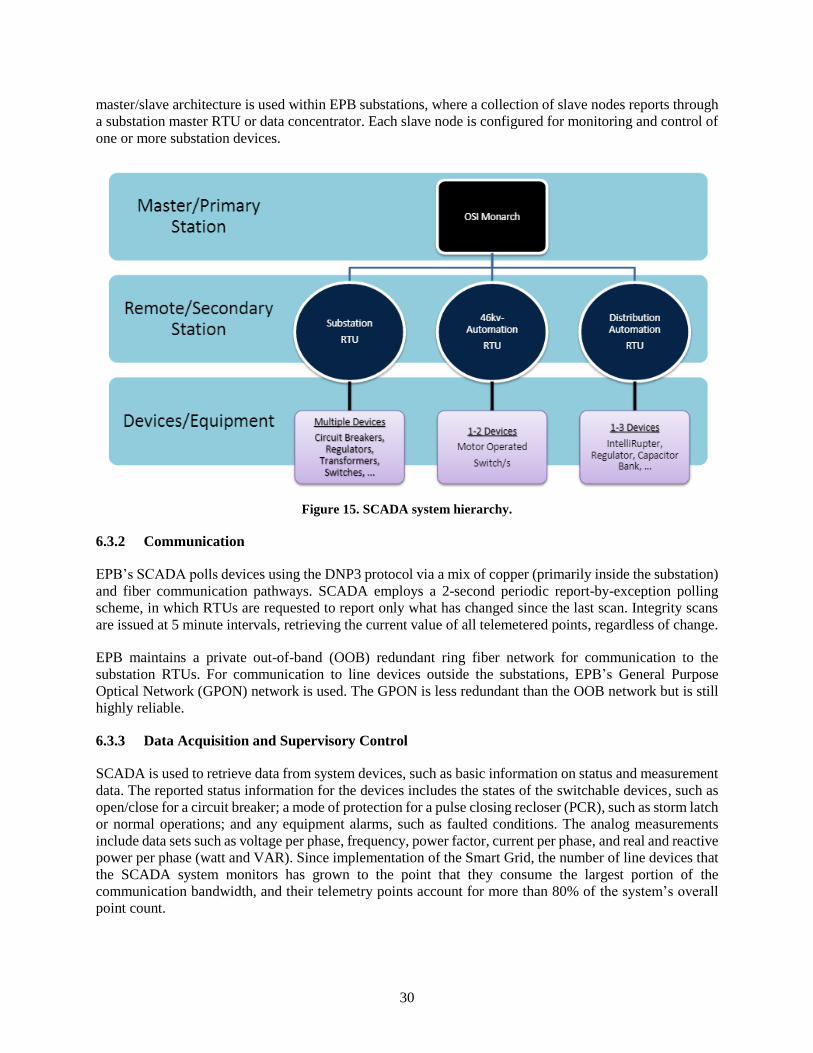
30
master/slave architecture is used within EPB substations, where a collection of slave nodes reports through
a substation master RTU or data concentrator. Each slave node is configured for monitoring and control of
one or more substation devices.
Figure 15. SCADA system hierarchy.
6.3.2 Communication
EPB’s SCADA polls devices using the DNP3 protocol via a mix of copper (primarily inside the substation)
and fiber communication pathways. SCADA employs a 2-second periodic report-by-exception polling
scheme, in which RTUs are requested to report only what has changed since the last scan. Integrity scans
are issued at 5 minute intervals, retrieving the current value of all telemetered points, regardless of change.
EPB maintains a private out-of-band (OOB) redundant ring fiber network for communication to the
substation RTUs. For communication to line devices outside the substations, EPB’s General Purpose
Optical Network (GPON) network is used. The GPON is less redundant than the OOB network but is still
highly reliable.
6.3.3 Data Acquisition and Supervisory Control
SCADA is used to retrieve data from system devices, such as basic information on status and measurement
data. The reported status information for the devices includes the states of the switchable devices, such as
open/close for a circuit breaker; a mode of protection for a pulse closing recloser (PCR), such as storm latch
or normal operations; and any equipment alarms, such as faulted conditions. The analog measurements
include data sets such as voltage per phase, frequency, power factor, current per phase, and real and reactive
power per phase (watt and VAR). Since implementation of the Smart Grid, the number of line devices that
the SCADA system monitors has grown to the point that they consume the largest portion of the
communication bandwidth, and their telemetry points account for more than 80% of the system’s overall
point count.
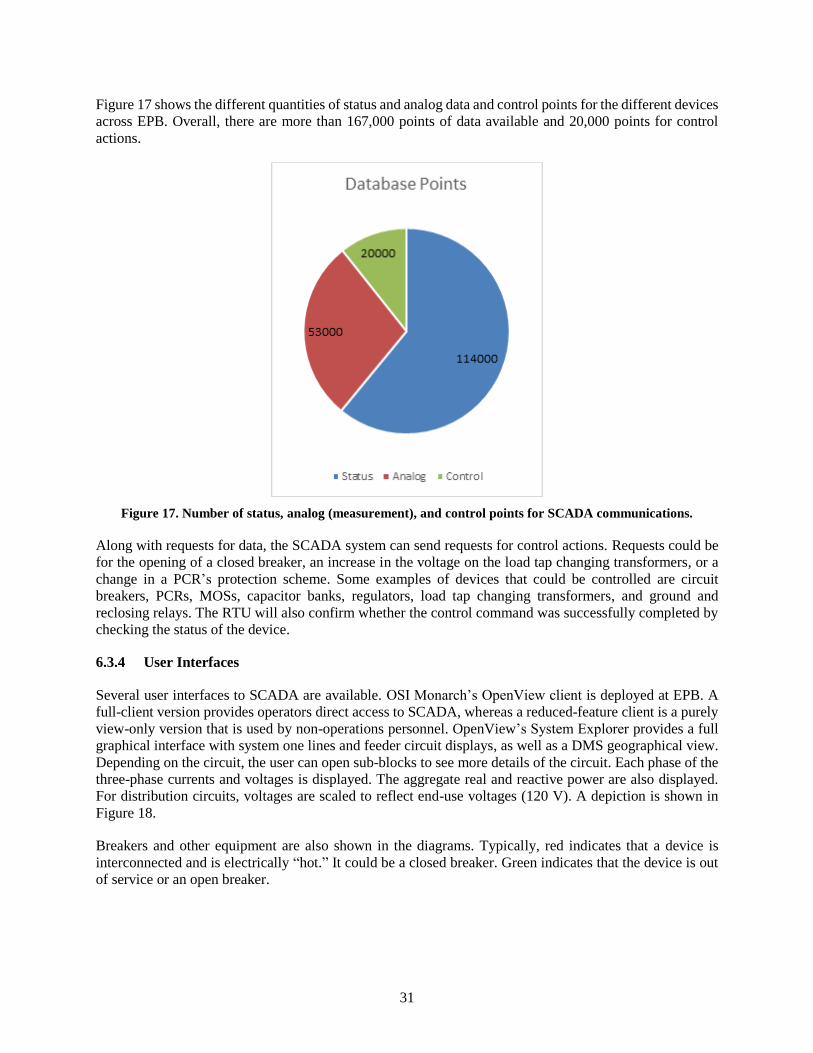
31
Figure 17 shows the different quantities of status and analog data and control points for the different devices
across EPB. Overall, there are more than 167,000 points of data available and 20,000 points for control
actions.
Figure 17. Number of status, analog (measurement), and control points for SCADA communications.
Along with requests for data, the SCADA system can send requests for control actions. Requests could be
for the opening of a closed breaker, an increase in the voltage on the load tap changing transformers, or a
change in a PCR’s protection scheme. Some examples of devices that could be controlled are circuit
breakers, PCRs, MOSs, capacitor banks, regulators, load tap changing transformers, and ground and
reclosing relays. The RTU will also confirm whether the control command was successfully completed by
checking the status of the device.
6.3.4 User Interfaces
Several user interfaces to SCADA are available. OSI Monarch’s OpenView client is deployed at EPB. A
full-client version provides operators direct access to SCADA, whereas a reduced-feature client is a purely
view-only version that is used by non-operations personnel. OpenView’s System Explorer provides a full
graphical interface with system one lines and feeder circuit displays, as well as a DMS geographical view.
Depending on the circuit, the user can open sub-blocks to see more details of the circuit. Each phase of the
three-phase currents and voltages is displayed. The aggregate real and reactive power are also displayed.
For distribution circuits, voltages are scaled to reflect end-use voltages (120 V). A depiction is shown in
Figure 18.
Breakers and other equipment are also shown in the diagrams. Typically, red indicates that a device is
interconnected and is electrically “hot.” It could be a closed breaker. Green indicates that the device is out
of service or an open breaker.

32
Figure 18. One-line example user interface.
The system also leverages OSI’s Advanced Tabulars application for displaying data in a tabular format,
providing the user the ability to easily sort and filter data.
6.3.5 Alarming
EPB’s SCADA system has a great number of customization options for alarming and notifications. The
SCADA system typically defaults to showing all alarms to operators, including communication loss to a
device, device-specific alarms (e.g., backup battery voltage low), analog measurement out of range (e.g.,
low voltage, over current), and status changes (e.g., switch operation). Having these alarms can prove to be
quite distracting, so the SCADA system has built-in options to prioritize alarms, to filter out certain alarms
that may be unimportant, or to direct alarms to a specific group of users. The system also allows for color-
coding of alarms, which enables users to quickly distinguish between separate types of alarms (breaker
operation vs. loss of communication). The alarms that come through SCADA are archived for 5 years, along
with any status changes from devices, analog data, and operator actions.
6.4 COST
The cost of purchasing the OSI SCADA software that provides interface between the SCADA and other
EPB systems (including DMS, OMS) was $1.5 million.
6.5 BENEFIT
One of the major benefits of the SCADA upgrade is the speed and resolution of the measurements that
come into SCADA from the field, allowing EPB to paint a more complete picture of the status of its
electrical system at any given point in time. SCADA also interfaces with other EPB systems. This enables
some other EPB systems—such as OMS outage reporting, capacity planning modelling, and DMS voltage
reduction—to operate more effectively than they could have with the old system. Although these
capabilities to enabling other systems are critical to EPB operations, they are an indirect benefit and have
no direct monetary impact on EPB.
33
7. AUTOMATION
7.1 SUMMARY
The EPB automation system is tasked with automating the control and protection of the power distribution
network. This system is made up of three major subsystems: 46 kV automation, 12 kV automation, and
anomaly evaluation and reporting. The combination of the communications, sensors, and automated
hardware that compose the Smart Grid has enabled the inclusion of new functionality in the automation
system that simplifies the distribution network management, improves reliability, and reduces costs for
EPB and their customers.
The automation system uses a combination of hardware, sensors, software, communications, and control
algorithms to automate its FLISR. The hardware devices used consist of circuit breakers, MOSs, and
intelligent reclosers. The reclosers contain sensors that measure the voltage and current waveforms and
analyze them at high speed for fault detection. The software and firmware for control, communication, and
interfacing between other EPB systems are located both in field devices and in the control center.
Structurally, the EPB automation system interfaces closely with the OMS, the SCADA system, the DMS,
the GIS, and the facilities management system.
When a fault occurs on the distribution system, the first goal of the automation system is to isolate the
sections of power lines where the fault occurred to protect customers, line personnel, and equipment. The
second goal of the automation system is to reroute power around the fault, if possible, to minimize the
number of customers who experience a loss of power due to the fault.
EPB’s electricity arrives from the TVA transmission system at EPB substations that convert the
transmission-level voltage into 46 kV sub-transmission lines. The 46 kV lines distribute power to local
substations that convert the electricity into 12 kV distribution lines, which then serve distribution
transformers that further step down the voltage to usable household levels. EPB has implemented
automation and sensing on both the 46 kV and 12 kV systems. The 46 kV system automation consists of
circuit breakers and MOSs that can be operated remotely. The circuit breakers disconnect power when
faults occur, and the MOSs are used to reconfigure circuits. The MOSs are not capable of interrupting a
fault condition. The 12 kV automation also uses circuit breakers, with the addition of intelligent reclosers
instead of MOSs. The reclosers can interrupt faults, and they have logic within them to enable
reconfiguration. The circuit breaker sensors can measure and report waveform data; the MOSs can measure
voltage and current; and the intelligent reclosers measure waveform data when a fault occurs, and voltage
and current during normal operation. EPB has approximately one 12 kV intelligent recloser for every 150
customers and one 46 kV MOS for every 810 customers.
Access to detailed abundant sensor data from everywhere in the distribution network as a direct
consequence of Smart Grid technologies has allowed the creation of new tools to analyze these data for
anomalous behaviors and patterns. The PCRs provide a resolution of 64 samples per cycle on the current
and voltage waveforms when a fault occurs. These data allow for detailed classification of faults, which
was previously impossible, and have revealed new fault types and validated theories about the underlying
causes of some faults. Data analysis reveals parts of the distribution system with a high probability of future
faults so that preemptive maintenance can be performed. This is particularly useful for faults that occur
only during extreme events and are therefore harder to detect and analyze because of their infrequency. The
high level of detail in the sensor data for faults has the advantage of more precisely predicting the physical
causes of faults, such as too much wire sag or a broken cross-arm on a pole, shortening the time and expense
needed to find and repair problems.

34
7.2 PRE–SMART GRID
Before the installation of automated switches, EPB relied on reclosers, manual switches, and passive
protection devices like fuses for fault protection. When a fault occurred, either a fuse would blow and open,
or the circuit breaker at the substation would trip. To repair the fault, a repair crew would be dispatched to
drive along the line and physically inspect it for the fault. Once the fault location was known, manual
switches on either side of the fault would be opened and then the circuit breakers at the substations would
be reclosed. Finally, the repair crew would fix the actual fault. This method involved miles of driving and
large amounts of time per fault. (Section 8, Outage Management, provides more details for the procedure.)
7.3 POST–SMART GRID
The union of active automation components and distribution-network-wide communication has led to
improvements in performance and reliability while reducing costs to EPB and its customers. The new
features of the Smart Grid system are
1. an increase in the number and fidelity of sensors
2. an increase in the number of reclosers and MOSs
3. intelligence and automation of the system (i.e., in the devices)
4. inter-device communication
5. remote operation
This combination of new features has improved performance and reliability while streamlining operations.
Although automation provides substantial benefits, they come at the cost of new challenges in data
management and security. The increased concentration of sensors in the distribution system has also
exposed previously unseen dynamic behavior in the distribution system, such as conductor slap, that needs
to be accounted for in designing the automation.
7.3.1 Smart-Grid Fault Response Overview
The automation hardware used in the EPB 46 kV sub-transmission Smart Grid system consists of circuit
breakers and MOSs. Both devices have automation on a platform from Schweitzer Electronic Laboratory
(SEL) and can also be controlled remotely by the system operators through the SCADA system. During a
fault in a 46 kV circuit, a circuit breaker automatically trips to isolate that line, while all the substations and
customers that draw power from that circuit experience a loss of power.
Next, the automation on the 12 kV circuits that draw power from the substations reconfigures in 1 to
2 seconds to draw power from substations that are not affected by the fault. Finally, in 1 to 2 minutes, the
MOSs reconfigure to isolate the subsection of the 46 kV circuit where the fault occurred and restore power
to the rest of the circuit until a repair crew can fix the cause of the fault. The decision was made to use the
12 kV automation hardware to restore power before the 46 kV automation, because the 12 kV automation
can operate more quickly and can reconfigure under load, whereas the MOSs cannot operate under load.
When a fault occurs on a 12 kV feeder, intelligent PCRs known as IntelliRupters® sense the fault and test
to see if the fault is momentary or sustained. If the fault is sustained, the PCRs around the fault open to
isolate that section of the feeder. Other PCRs that are fed from other substations then close to restore power
to the remaining unfaulted sections of the feeder. The PCRs then analyze waveform data and use time-of-
flight data to determine the physical location of the fault, which is then communicated to the repair crews
so that they can find and fix the fault more quickly.
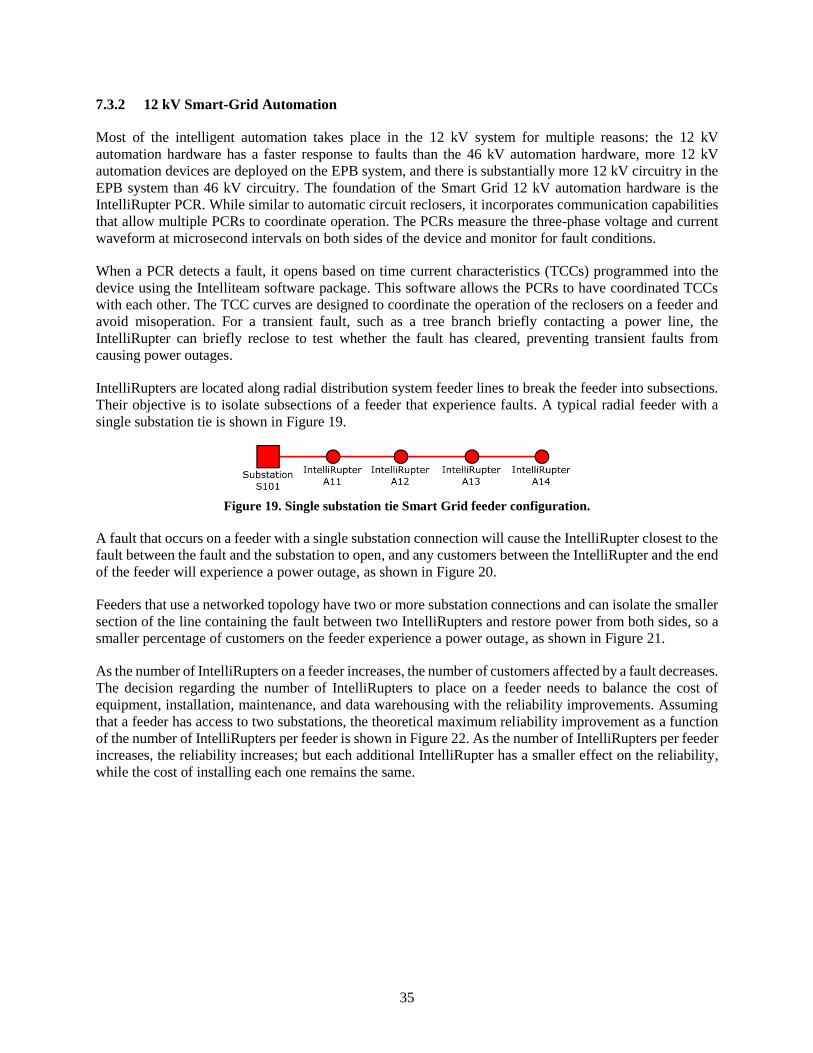
35
7.3.2 12 kV Smart-Grid Automation
Most of the intelligent automation takes place in the 12 kV system for multiple reasons: the 12 kV
automation hardware has a faster response to faults than the 46 kV automation hardware, more 12 kV
automation devices are deployed on the EPB system, and there is substantially more 12 kV circuitry in the
EPB system than 46 kV circuitry. The foundation of the Smart Grid 12 kV automation hardware is the
IntelliRupter PCR. While similar to automatic circuit reclosers, it incorporates communication capabilities
that allow multiple PCRs to coordinate operation. The PCRs measure the three-phase voltage and current
waveform at microsecond intervals on both sides of the device and monitor for fault conditions.
When a PCR detects a fault, it opens based on time current characteristics (TCCs) programmed into the
device using the Intelliteam software package. This software allows the PCRs to have coordinated TCCs
with each other. The TCC curves are designed to coordinate the operation of the reclosers on a feeder and
avoid misoperation. For a transient fault, such as a tree branch briefly contacting a power line, the
IntelliRupter can briefly reclose to test whether the fault has cleared, preventing transient faults from
causing power outages.
IntelliRupters are located along radial distribution system feeder lines to break the feeder into subsections.
Their objective is to isolate subsections of a feeder that experience faults. A typical radial feeder with a
single substation tie is shown in Figure 19.
Figure 19. Single substation tie Smart Grid feeder configuration.
A fault that occurs on a feeder with a single substation connection will cause the IntelliRupter closest to the
fault between the fault and the substation to open, and any customers between the IntelliRupter and the end
of the feeder will experience a power outage, as shown in Figure 20.
Feeders that use a networked topology have two or more substation connections and can isolate the smaller
section of the line containing the fault between two IntelliRupters and restore power from both sides, so a
smaller percentage of customers on the feeder experience a power outage, as shown in Figure 21.
As the number of IntelliRupters on a feeder increases, the number of customers affected by a fault decreases.
The decision regarding the number of IntelliRupters to place on a feeder needs to balance the cost of
equipment, installation, maintenance, and data warehousing with the reliability improvements. Assuming
that a feeder has access to two substations, the theoretical maximum reliability improvement as a function
of the number of IntelliRupters per feeder is shown in Figure 22. As the number of IntelliRupters per feeder
increases, the reliability increases; but each additional IntelliRupter has a smaller effect on the reliability,
while the cost of installing each one remains the same.
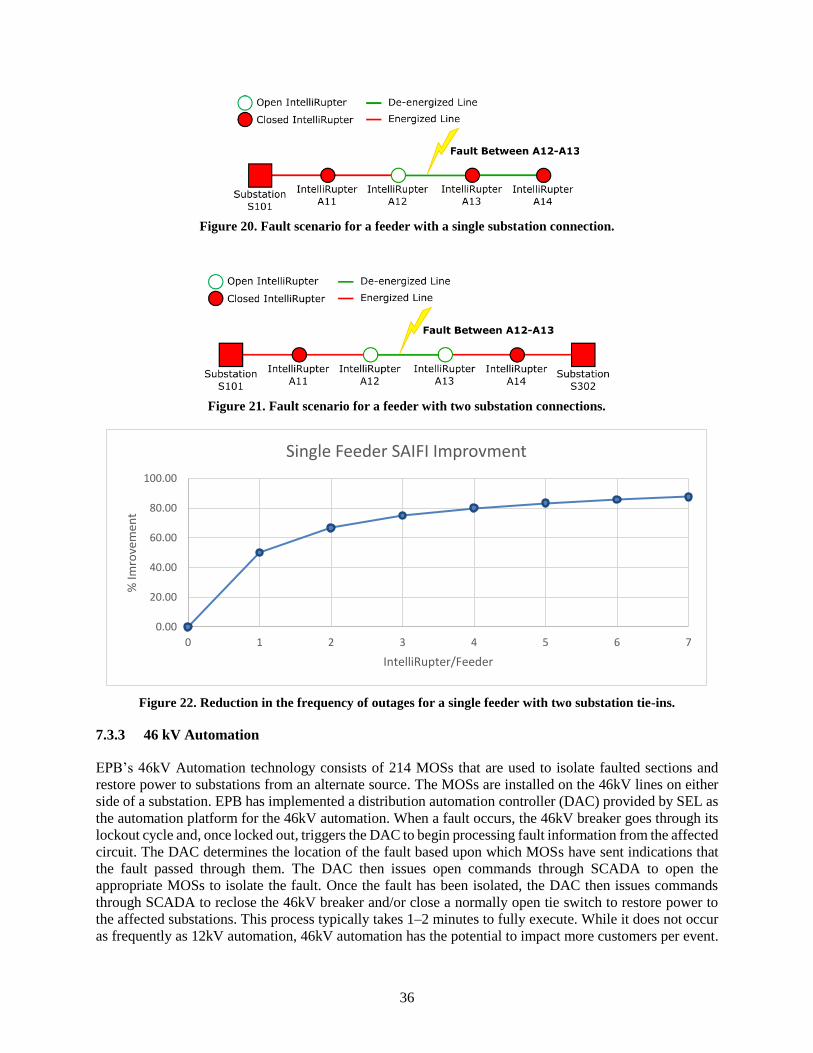
36
Figure 20. Fault scenario for a feeder with a single substation connection.
Figure 21. Fault scenario for a feeder with two substation connections.
Figure 22. Reduction in the frequency of outages for a single feeder with two substation tie-ins.
7.3.3 46 kV Automation
EPB’s 46kV Automation technology consists of 214 MOSs that are used to isolate faulted sections and
restore power to substations from an alternate source. The MOSs are installed on the 46kV lines on either
side of a substation. EPB has implemented a distribution automation controller (DAC) provided by SEL as
the automation platform for the 46kV automation. When a fault occurs, the 46kV breaker goes through its
lockout cycle and, once locked out, triggers the DAC to begin processing fault information from the affected
circuit. The DAC determines the location of the fault based upon which MOSs have sent indications that
the fault passed through them. The DAC then issues open commands through SCADA to open the
appropriate MOSs to isolate the fault. Once the fault has been isolated, the DAC then issues commands
through SCADA to reclose the 46kV breaker and/or close a normally open tie switch to restore power to
the affected substations. This process typically takes 1–2 minutes to fully execute. While it does not occur
as frequently as 12kV automation, 46kV automation has the potential to impact more customers per event.
0.00
20.00
40.00
60.00
80.00
100.00
0 1 2 3 4 5 6 7
% Im
rove
men
t
IntelliRupter/Feeder
Single Feeder SAIFI Improvment

37
7.3.4 Device Timing and Coordination
Having multiple reclosers or IntelliRupters on a feeder introduces new engineering challenges. Device
behaviors need to be coordinated to prevent unintended operation. When a fault occurs, the desired behavior
is that only the device closest to the fault, between the substation and the fault, opens. If the devices are not
coordinated properly, unintended behaviors can result. For example, a fault could cause multiple devices
between the fault and the substation to open, resulting in unnecessary outages for some customers. The
sensing and communication capabilities of IntelliRupters simplify coordination among devices and reduce
the possibility of unwanted behavior. As stated earlier, EPB uses TCC curves to define the basic
coordination behavior of the protection system devices (Figure 23). These curves tell each device how long
to wait in the event of a fault before tripping. Using TCC curves also allows the IntelliRupters to be
coordinated with static protection devices like fuses. Fuses have predefined operational characteristics that
can be represented by a TCC curve, whereas the IntelliRupters implement virtual TCC curves, which can
be moved in relationship to the fixed fuse curves to modify the behavior of the feeder protection during a
fault. The ability to define TCC curves for IntelliRupters has enabled EPB to implement a new operational
feature in its automation system called intelligent fuse savings. During major events, the frequency of low-
current faults, such as tree branch contact with power lines, increases. These faults can cause fuses to melt,
so that they need to be physically replaced. Intelligent fuse savings allows the IntelliRupters to absorb most
of the stress from low-current faults during major events and open before the fuse has had a chance to open.
This is accomplished by changing the IntelliRupter TCC curves so that the IntelliRupters trip before fuses
do for low-current faults.
Coordinating multiple protection devices for each feeder requires that each device have a unique TCC
curve. Developing these unique TCC curves entails a significant engineering effort. Inter-device
communication capabilities have allowed EPB to deploy a communications-based system that simplifies
the coordination of multiple protection devices on a feeder. This system, included in the Intelliteam
Automation Software provided by S&C Electric, is known as communication enhanced coordination
(CEC). CEC takes advantage of the network topology and inter-device communication so that the same
TCC curve can be used for multiple IntelliRupters on the feeder. CEC accomplishes the goal of activating
only the protection device closest to the fault by using shift messages. Any IntelliRupter that sees a fault
sends a shift command to the devices on its source side. The shift commands cause the IntelliRupters to
shift their TCC curves slightly so that the time-over-current is increased slightly. This has the effect of
allowing the device closest to the fault to trip first because it has the shortest time-over-current. For
example, IntelliRupter A and IntelliRupter B see a fault current of 100 A, giving a time-over-current value
of 1 second. IntelliRupter A, being closest to the fault, sends a shift message to IntelliRupter B, which is
closer to the source. IntelliRupter B now has a time-over-current value of 2 seconds, so IntelliRupter A will
trip at 1 second, and IntelliRupter B will not trip because the fault current will no longer exist after
IntelliRupter A trips.
Increasing the number of IntelliRupters on a given feeder decreases the physical distance between devices,
which makes locating faults quicker for repair crews and is likely to reduce outage times, particularly during
major events when the distribution system is stressed beyond its design and faults exceed the repair crew
capacity.
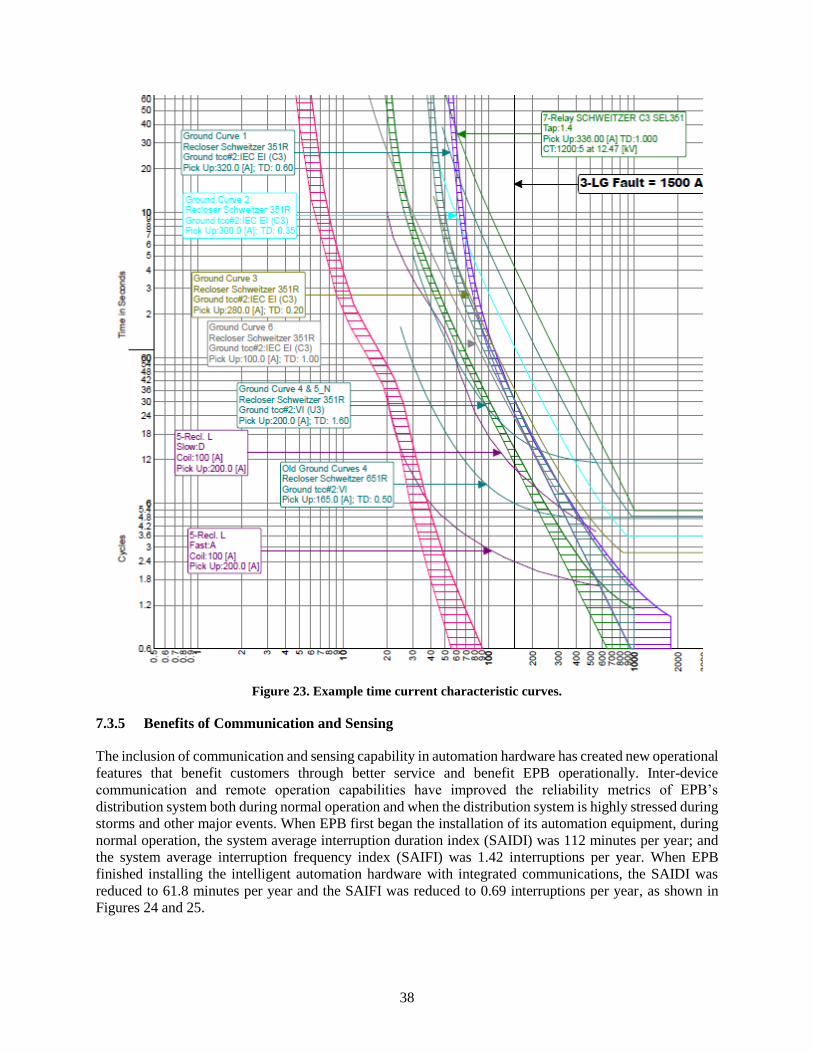
38
Figure 23. Example time current characteristic curves.
7.3.5 Benefits of Communication and Sensing
The inclusion of communication and sensing capability in automation hardware has created new operational
features that benefit customers through better service and benefit EPB operationally. Inter-device
communication and remote operation capabilities have improved the reliability metrics of EPB’s
distribution system both during normal operation and when the distribution system is highly stressed during
storms and other major events. When EPB first began the installation of its automation equipment, during
normal operation, the system average interruption duration index (SAIDI) was 112 minutes per year; and
the system average interruption frequency index (SAIFI) was 1.42 interruptions per year. When EPB
finished installing the intelligent automation hardware with integrated communications, the SAIDI was
reduced to 61.8 minutes per year and the SAIFI was reduced to 0.69 interruptions per year, as shown in
Figures 24 and 25.
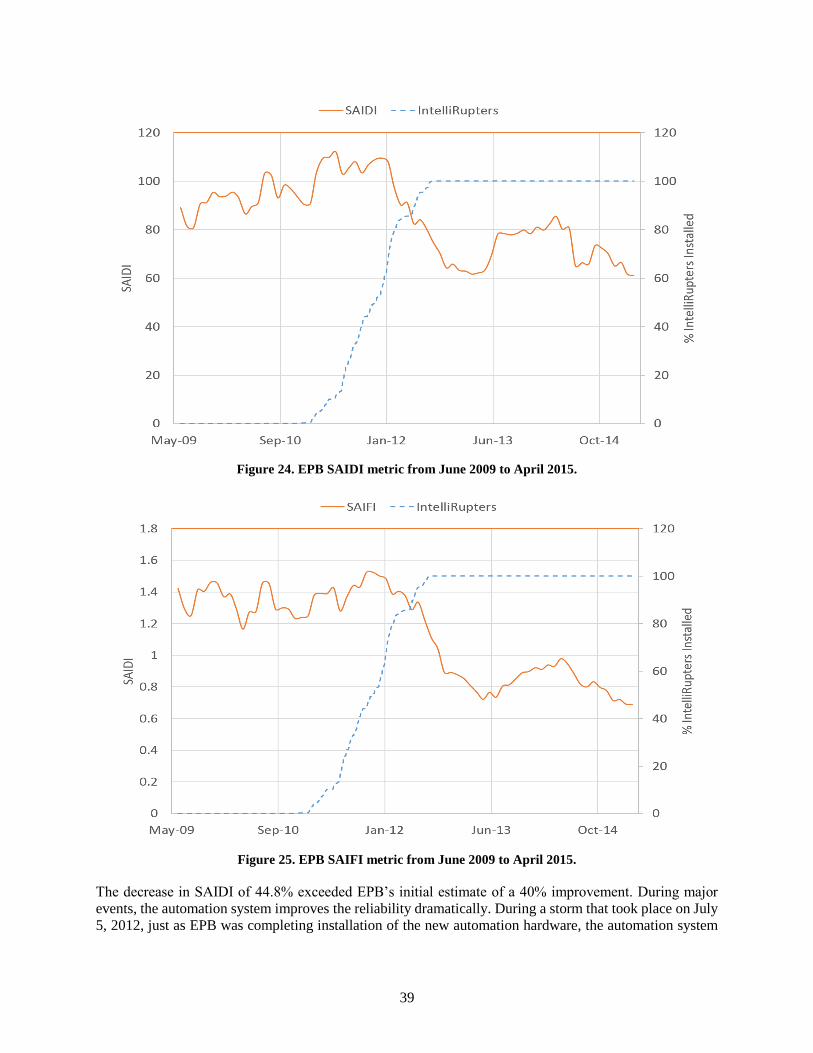
39
Figure 24. EPB SAIDI metric from June 2009 to April 2015.
Figure 25. EPB SAIFI metric from June 2009 to April 2015.
The decrease in SAIDI of 44.8% exceeded EPB’s initial estimate of a 40% improvement. During major
events, the automation system improves the reliability dramatically. During a storm that took place on July
5, 2012, just as EPB was completing installation of the new automation hardware, the automation system

40
reduced the number of customers who experienced outages by 55.8%9 [1]. This reliability improvement
prevented $23.2 million in customer costs, more than 40,000 customer outages, and 4.9 million customer
outage minutes during a single storm event.
Communication and sensing have also improved the response times of maintenance crews. When a fault
occurs, each IntelliRupter on the feeder takes detailed waveform data of the event with GPS timestamp
information. Using information about the feeder topology and IntelliRupter physical locations, the
geographic location of the fault can be calculated. This information is used to send repair crews to quickly
locate and repair faults. The waveform data is then warehoused so that the fault can be analyzed later.
The intelligent automation devices have also improved the reporting and data analytics capabilities of EPB.
A device can track its own health, report problems to the SCADA system, and request maintenance. Devices
also record and report on faults, including fault types and waveforms of fault events. These data, along with
improved data analytics tools, can be used to proactively improve system reliability in an intelligent manner.
Analyzing data from the automation system helps identify and distinguish between momentary faults from
lightning strikes, pole shake, or vegetation, as well as permanent faults, improper device settings, incorrect
information about devices in the device management system, and device mis-coordination, to name a few.
Analyzing fault frequency and type can also expose over-stressed portions of the distribution system. These
data analytics tools can be used for proactive maintenance, post-event analysis, and preemptive reliability
improvements.
The improved data collection and analytics have also exposed new dynamic behaviors during faults that
were previously unseen. One example is a fault-induced conductor slap. When a fault occurs, the fault
current generates electromagnetic forces between two-phase and three-phase conductors, creating a
repelling force between the conductors. When an IntelliRupter opens, this repelling force disappears,
causing the conductors to swing like pendulums. Under certain temperature-induced sag conditions,
combined with the reclosing time, this phenomenon will cause the conductors to swing into each other,
creating a second fault. If improperly accounted for in the automation logic, this conductor slap in turn can
cause the IntelliRupter closer to the substation to operate, which in turn can cause more conductor slaps.
The series of conductor slaps, known as a “marching fault,” and will propagate from the original fault
location toward the substation, until eventually the substation breaker operates and locks out the circuit.
These events are not common and can occur in systems with reclosers that do not have the same
communication capabilities as the IntelliRupters. The rarity of their occurrence and the lack of high-fidelity
sensing meant that they mostly went undiagnosed. Using the improved sensing and data analytics tools in
the new intelligent automation system, EPB has been able to identify portions of feeders that are particularly
susceptible to conductor slap so that risk can be mitigated. The coordination between IntelliRupters has
also allowed EPB to introduce logic into the behavior of the automation system that identifies when a
conductor slap has occurred and prevents a marching fault.
7.4 COST
Beginning in the spring of 2011 and continuing until the spring of 2012, EPB installed approximately 1,200
automated reclosers on its 12 kV system and 220 automated switches on its 46 kV system. The average
cost for EPB to build its automation system was $280 per customer served.
7.5 BENEFIT
These automation capabilities resulted in a 44.8% reduction in EPB’s SAIDI metric and a 51.4% reduction
in its SAIFI metric. During normal operation, this translates to an annual savings to EPB’s customers of
9

41
$26.8 million in outage interruption costs, or $154 per customer each year. The improved reliability of
EPB’s distribution network has a large financial impact on commercial and industrial customers and has
been a factor in attracting new businesses to locate in Chattanooga. Large commercial and industrial
customers saw a $19.535 million reduction in outage costs, or $3,680 per customer per year: and small
commercial and industrial customers were saved $8.825 million, or $500 per customer per year.

42
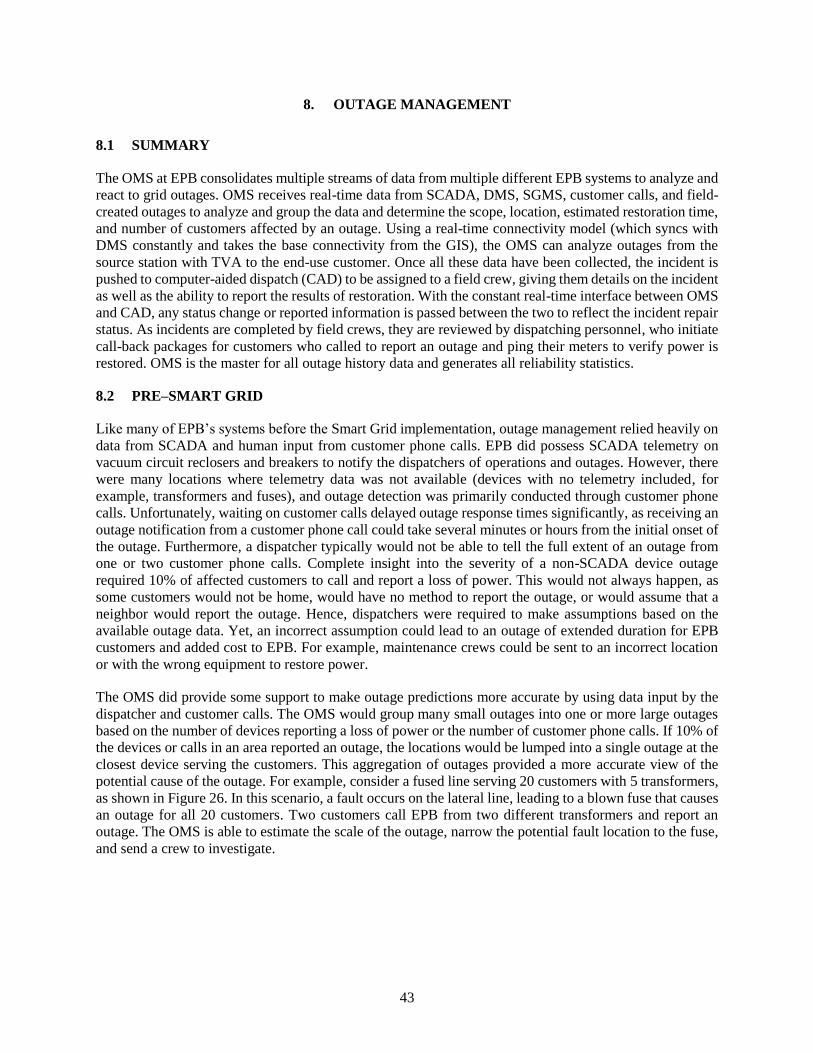
43
8. OUTAGE MANAGEMENT
8.1 SUMMARY
The OMS at EPB consolidates multiple streams of data from multiple different EPB systems to analyze and
react to grid outages. OMS receives real-time data from SCADA, DMS, SGMS, customer calls, and field-
created outages to analyze and group the data and determine the scope, location, estimated restoration time,
and number of customers affected by an outage. Using a real-time connectivity model (which syncs with
DMS constantly and takes the base connectivity from the GIS), the OMS can analyze outages from the
source station with TVA to the end-use customer. Once all these data have been collected, the incident is
pushed to computer-aided dispatch (CAD) to be assigned to a field crew, giving them details on the incident
as well as the ability to report the results of restoration. With the constant real-time interface between OMS
and CAD, any status change or reported information is passed between the two to reflect the incident repair
status. As incidents are completed by field crews, they are reviewed by dispatching personnel, who initiate
call-back packages for customers who called to report an outage and ping their meters to verify power is
restored. OMS is the master for all outage history data and generates all reliability statistics.
8.2 PRE–SMART GRID
Like many of EPB’s systems before the Smart Grid implementation, outage management relied heavily on
data from SCADA and human input from customer phone calls. EPB did possess SCADA telemetry on
vacuum circuit reclosers and breakers to notify the dispatchers of operations and outages. However, there
were many locations where telemetry data was not available (devices with no telemetry included, for
example, transformers and fuses), and outage detection was primarily conducted through customer phone
calls. Unfortunately, waiting on customer calls delayed outage response times significantly, as receiving an
outage notification from a customer phone call could take several minutes or hours from the initial onset of
the outage. Furthermore, a dispatcher typically would not be able to tell the full extent of an outage from
one or two customer phone calls. Complete insight into the severity of a non-SCADA device outage
required 10% of affected customers to call and report a loss of power. This would not always happen, as
some customers would not be home, would have no method to report the outage, or would assume that a
neighbor would report the outage. Hence, dispatchers were required to make assumptions based on the
available outage data. Yet, an incorrect assumption could lead to an outage of extended duration for EPB
customers and added cost to EPB. For example, maintenance crews could be sent to an incorrect location
or with the wrong equipment to restore power.
The OMS did provide some support to make outage predictions more accurate by using data input by the
dispatcher and customer calls. The OMS would group many small outages into one or more large outages
based on the number of devices reporting a loss of power or the number of customer phone calls. If 10% of
the devices or calls in an area reported an outage, the locations would be lumped into a single outage at the
closest device serving the customers. This aggregation of outages provided a more accurate view of the
potential cause of the outage. For example, consider a fused line serving 20 customers with 5 transformers,
as shown in Figure 26. In this scenario, a fault occurs on the lateral line, leading to a blown fuse that causes
an outage for all 20 customers. Two customers call EPB from two different transformers and report an
outage. The OMS is able to estimate the scale of the outage, narrow the potential fault location to the fuse,
and send a crew to investigate.
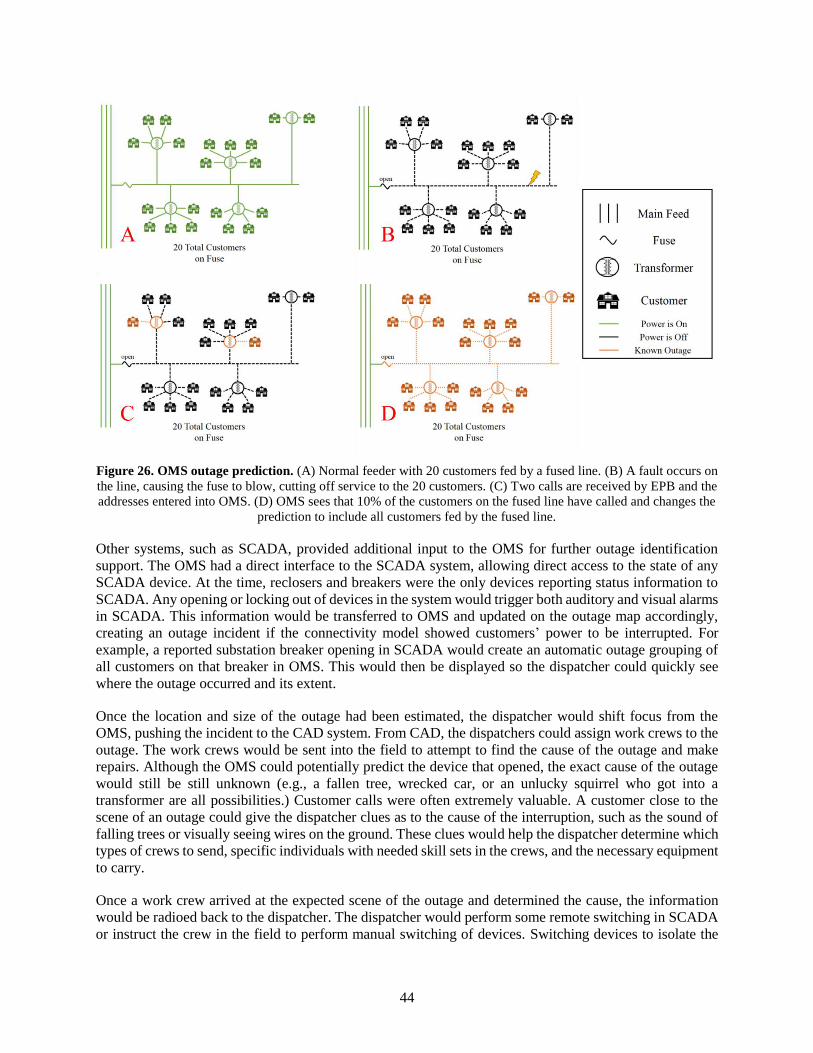
44
Figure 26. OMS outage prediction. (A) Normal feeder with 20 customers fed by a fused line. (B) A fault occurs on
the line, causing the fuse to blow, cutting off service to the 20 customers. (C) Two calls are received by EPB and the
addresses entered into OMS. (D) OMS sees that 10% of the customers on the fused line have called and changes the
prediction to include all customers fed by the fused line.
Other systems, such as SCADA, provided additional input to the OMS for further outage identification
support. The OMS had a direct interface to the SCADA system, allowing direct access to the state of any
SCADA device. At the time, reclosers and breakers were the only devices reporting status information to
SCADA. Any opening or locking out of devices in the system would trigger both auditory and visual alarms
in SCADA. This information would be transferred to OMS and updated on the outage map accordingly,
creating an outage incident if the connectivity model showed customers’ power to be interrupted. For
example, a reported substation breaker opening in SCADA would create an automatic outage grouping of
all customers on that breaker in OMS. This would then be displayed so the dispatcher could quickly see
where the outage occurred and its extent.
Once the location and size of the outage had been estimated, the dispatcher would shift focus from the
OMS, pushing the incident to the CAD system. From CAD, the dispatchers could assign work crews to the
outage. The work crews would be sent into the field to attempt to find the cause of the outage and make
repairs. Although the OMS could potentially predict the device that opened, the exact cause of the outage
would still be still unknown (e.g., a fallen tree, wrecked car, or an unlucky squirrel who got into a
transformer are all possibilities.) Customer calls were often extremely valuable. A customer close to the
scene of an outage could give the dispatcher clues as to the cause of the interruption, such as the sound of
falling trees or visually seeing wires on the ground. These clues would help the dispatcher determine which
types of crews to send, specific individuals with needed skill sets in the crews, and the necessary equipment
to carry.
Once a work crew arrived at the expected scene of the outage and determined the cause, the information
would be radioed back to the dispatcher. The dispatcher would perform some remote switching in SCADA
or instruct the crew in the field to perform manual switching of devices. Switching devices to isolate the
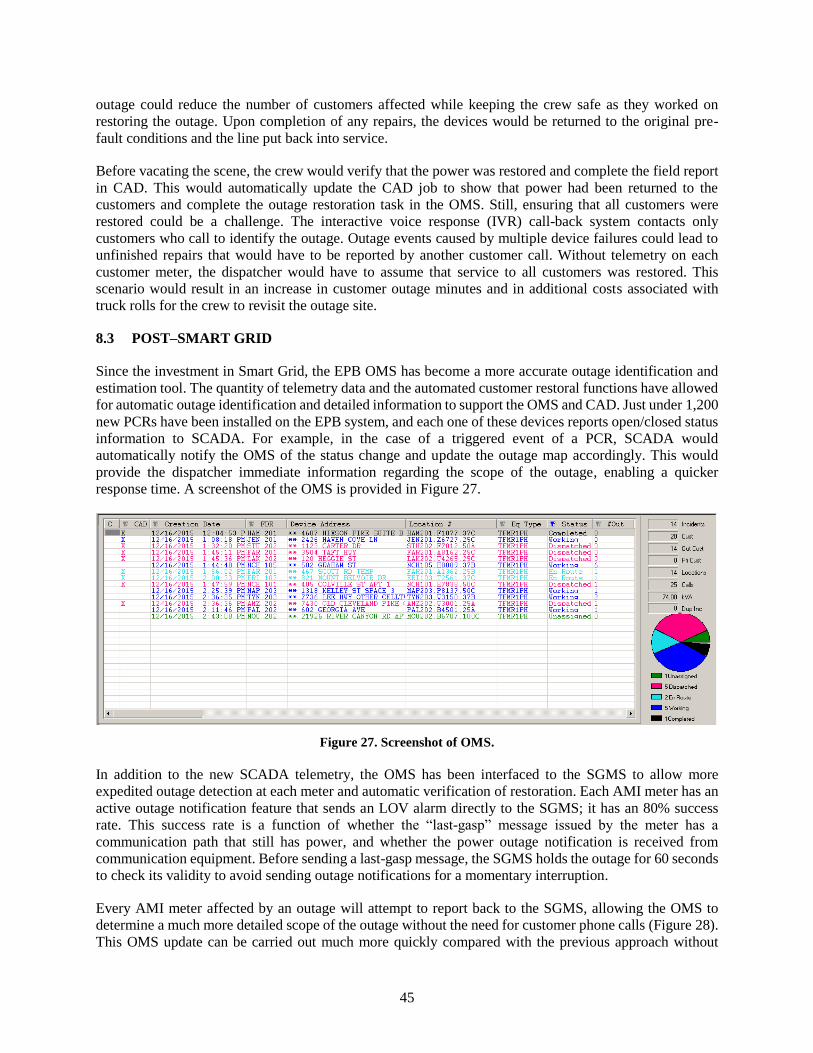
45
outage could reduce the number of customers affected while keeping the crew safe as they worked on
restoring the outage. Upon completion of any repairs, the devices would be returned to the original pre-
fault conditions and the line put back into service.
Before vacating the scene, the crew would verify that the power was restored and complete the field report
in CAD. This would automatically update the CAD job to show that power had been returned to the
customers and complete the outage restoration task in the OMS. Still, ensuring that all customers were
restored could be a challenge. The interactive voice response (IVR) call-back system contacts only
customers who call to identify the outage. Outage events caused by multiple device failures could lead to
unfinished repairs that would have to be reported by another customer call. Without telemetry on each
customer meter, the dispatcher would have to assume that service to all customers was restored. This
scenario would result in an increase in customer outage minutes and in additional costs associated with
truck rolls for the crew to revisit the outage site.
8.3 POST–SMART GRID
Since the investment in Smart Grid, the EPB OMS has become a more accurate outage identification and
estimation tool. The quantity of telemetry data and the automated customer restoral functions have allowed
for automatic outage identification and detailed information to support the OMS and CAD. Just under 1,200
new PCRs have been installed on the EPB system, and each one of these devices reports open/closed status
information to SCADA. For example, in the case of a triggered event of a PCR, SCADA would
automatically notify the OMS of the status change and update the outage map accordingly. This would
provide the dispatcher immediate information regarding the scope of the outage, enabling a quicker
response time. A screenshot of the OMS is provided in Figure 27.
Figure 27. Screenshot of OMS.
In addition to the new SCADA telemetry, the OMS has been interfaced to the SGMS to allow more
expedited outage detection at each meter and automatic verification of restoration. Each AMI meter has an
active outage notification feature that sends an LOV alarm directly to the SGMS; it has an 80% success
rate. This success rate is a function of whether the “last-gasp” message issued by the meter has a
communication path that still has power, and whether the power outage notification is received from
communication equipment. Before sending a last-gasp message, the SGMS holds the outage for 60 seconds
to check its validity to avoid sending outage notifications for a momentary interruption.
Every AMI meter affected by an outage will attempt to report back to the SGMS, allowing the OMS to
determine a much more detailed scope of the outage without the need for customer phone calls (Figure 28).
This OMS update can be carried out much more quickly compared with the previous approach without
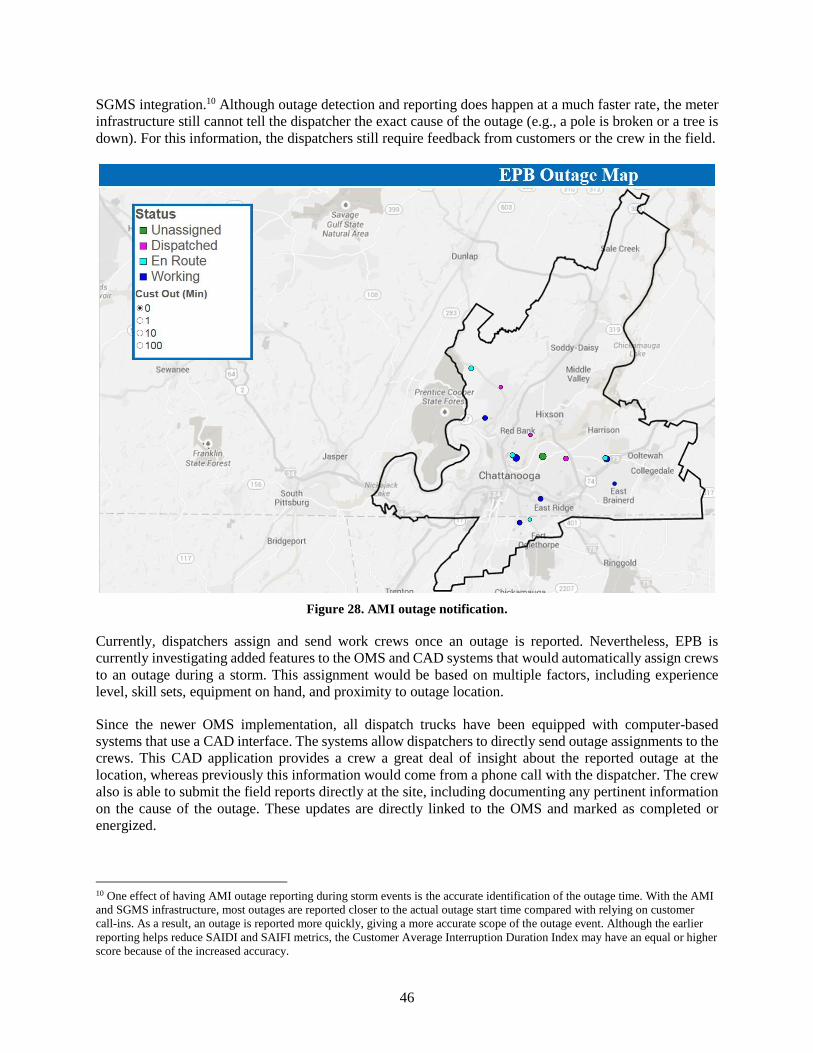
46
SGMS integration.10 Although outage detection and reporting does happen at a much faster rate, the meter
infrastructure still cannot tell the dispatcher the exact cause of the outage (e.g., a pole is broken or a tree is
down). For this information, the dispatchers still require feedback from customers or the crew in the field.
Figure 28. AMI outage notification.
Currently, dispatchers assign and send work crews once an outage is reported. Nevertheless, EPB is
currently investigating added features to the OMS and CAD systems that would automatically assign crews
to an outage during a storm. This assignment would be based on multiple factors, including experience
level, skill sets, equipment on hand, and proximity to outage location.
Since the newer OMS implementation, all dispatch trucks have been equipped with computer-based
systems that use a CAD interface. The systems allow dispatchers to directly send outage assignments to the
crews. This CAD application provides a crew a great deal of insight about the reported outage at the
location, whereas previously this information would come from a phone call with the dispatcher. The crew
also is able to submit the field reports directly at the site, including documenting any pertinent information
on the cause of the outage. These updates are directly linked to the OMS and marked as completed or
energized.
10 One effect of having AMI outage reporting during storm events is the accurate identification of the outage time. With the AMI
and SGMS infrastructure, most outages are reported closer to the actual outage start time compared with relying on customer
call-ins. As a result, an outage is reported more quickly, giving a more accurate scope of the outage event. Although the earlier
reporting helps reduce SAIDI and SAIFI metrics, the Customer Average Interruption Duration Index may have an equal or higher
score because of the increased accuracy.
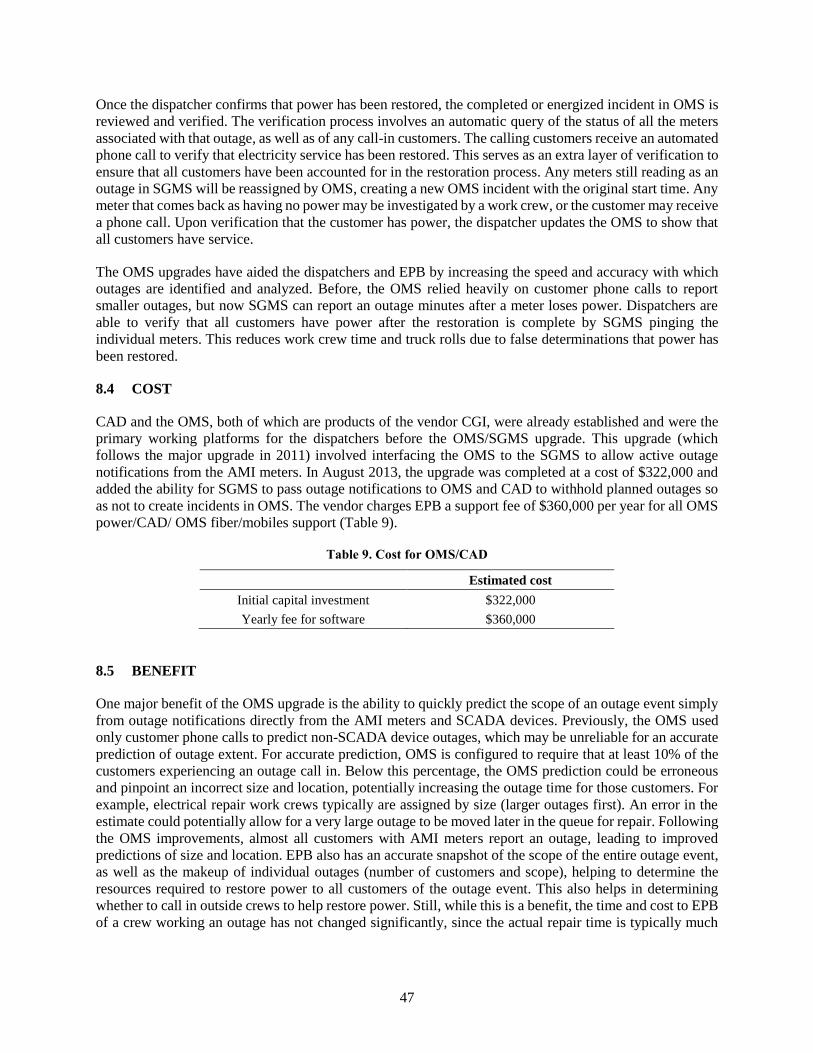
47
Once the dispatcher confirms that power has been restored, the completed or energized incident in OMS is
reviewed and verified. The verification process involves an automatic query of the status of all the meters
associated with that outage, as well as of any call-in customers. The calling customers receive an automated
phone call to verify that electricity service has been restored. This serves as an extra layer of verification to
ensure that all customers have been accounted for in the restoration process. Any meters still reading as an
outage in SGMS will be reassigned by OMS, creating a new OMS incident with the original start time. Any
meter that comes back as having no power may be investigated by a work crew, or the customer may receive
a phone call. Upon verification that the customer has power, the dispatcher updates the OMS to show that
all customers have service.
The OMS upgrades have aided the dispatchers and EPB by increasing the speed and accuracy with which
outages are identified and analyzed. Before, the OMS relied heavily on customer phone calls to report
smaller outages, but now SGMS can report an outage minutes after a meter loses power. Dispatchers are
able to verify that all customers have power after the restoration is complete by SGMS pinging the
individual meters. This reduces work crew time and truck rolls due to false determinations that power has
been restored.
8.4 COST
CAD and the OMS, both of which are products of the vendor CGI, were already established and were the
primary working platforms for the dispatchers before the OMS/SGMS upgrade. This upgrade (which
follows the major upgrade in 2011) involved interfacing the OMS to the SGMS to allow active outage
notifications from the AMI meters. In August 2013, the upgrade was completed at a cost of $322,000 and
added the ability for SGMS to pass outage notifications to OMS and CAD to withhold planned outages so
as not to create incidents in OMS. The vendor charges EPB a support fee of $360,000 per year for all OMS
power/CAD/ OMS fiber/mobiles support (Table 9).
Table 9. Cost for OMS/CAD
Estimated cost
Initial capital investment $322,000
Yearly fee for software $360,000
8.5 BENEFIT
One major benefit of the OMS upgrade is the ability to quickly predict the scope of an outage event simply
from outage notifications directly from the AMI meters and SCADA devices. Previously, the OMS used
only customer phone calls to predict non-SCADA device outages, which may be unreliable for an accurate
prediction of outage extent. For accurate prediction, OMS is configured to require that at least 10% of the
customers experiencing an outage call in. Below this percentage, the OMS prediction could be erroneous
and pinpoint an incorrect size and location, potentially increasing the outage time for those customers. For
example, electrical repair work crews typically are assigned by size (larger outages first). An error in the
estimate could potentially allow for a very large outage to be moved later in the queue for repair. Following
the OMS improvements, almost all customers with AMI meters report an outage, leading to improved
predictions of size and location. EPB also has an accurate snapshot of the scope of the entire outage event,
as well as the makeup of individual outages (number of customers and scope), helping to determine the
resources required to restore power to all customers of the outage event. This also helps in determining
whether to call in outside crews to help restore power. Still, while this is a benefit, the time and cost to EPB
of a crew working an outage has not changed significantly, since the actual repair time is typically much

48
longer than pinpointing the outage scope. Most of the benefit goes to the customer in the form of faster
restoration.
Customers who receive the highest benefit from the OMS improvement are those who experience an outage
with high visibility in AMI reporting and low customer call-in counts. Without the AMI reporting, those
customers would have been grouped into one or more smaller outages, causing the outage response time of
a repair crew to be slower. To determine the benefit of the OMS upgrades in terms of dollars saved for the
customer, an investigation was done of a storm that moved through the EPB service territory on June 8,
2015. For this investigation, a search was performed of outages that were reported by fewer than 10% of
the total affected customers. The sizes of these outages would have been predicted incorrectly without AMI
reporting to OMS. Any outages to a SCADA device were ignored because any operation of those devices
would immediately report the outage to OMS, regardless of customer calls. The remaining outages were
caused by non-communicating elements being opened, such as fuses or transformers, which do not report
their status to SCADA. Based on these non-SCADA devices, 2,925 total customers experienced an outage.
Of these passive element outages, three incidents (affecting 202 customers) were discovered to have had
too few callers report the outage to make an accurate prediction.
The three outages were inspected to determine the number of customers that lose power, the types of
customers losing power (residential, small commercial and industrial, or large commercial and industrial),
those customers’ average energy usages, and the durations of the outages. With this information, the cost
of the outages could be estimated using the Department of Energy’s Interruption Cost Estimate (ICE)
calculator11. Using the previously mentioned parameters as inputs, the ICE tool estimates the total cost of
the outages to those customers, as well as the cost to each individual customer type.
For the analysis, data were collected and showed that during the entire period of the outage, there was a
lack of customer call-ins. Without the AMI reporting, the potential was high for crews to take longer to
restore power in these outages. The crew would have to respond to the scene, recognize the incorrect outage
prediction, evaluate the outage size, report the updated outage to the dispatchers, gather any additionally
required tools for restoration, and restore power to the customers. Based on this knowledge, to make a
reasonable estimate of outage time, the outage time was doubled. This assumption is based on the fact that,
by the end of the outage, not enough customers had called to make an accurate outage prediction. If enough
customer calls to ensure an accurate prediction had come in as soon as the outage was created, then it is
assumed that it would have taken the same amount of time to restore power to them as the actual restoration
took. Going forward with this assumption, the customer type, size, and outage duration were put in the ICE
calculator, and the results are in Table 10.
11 The ICE calculator is a tool designed for electric reliability planners at utilities, government organizations, or
other entities that are interested in estimating interruption costs and/or the benefits associated with reliability
improvements. http://www.icecalculator.com/
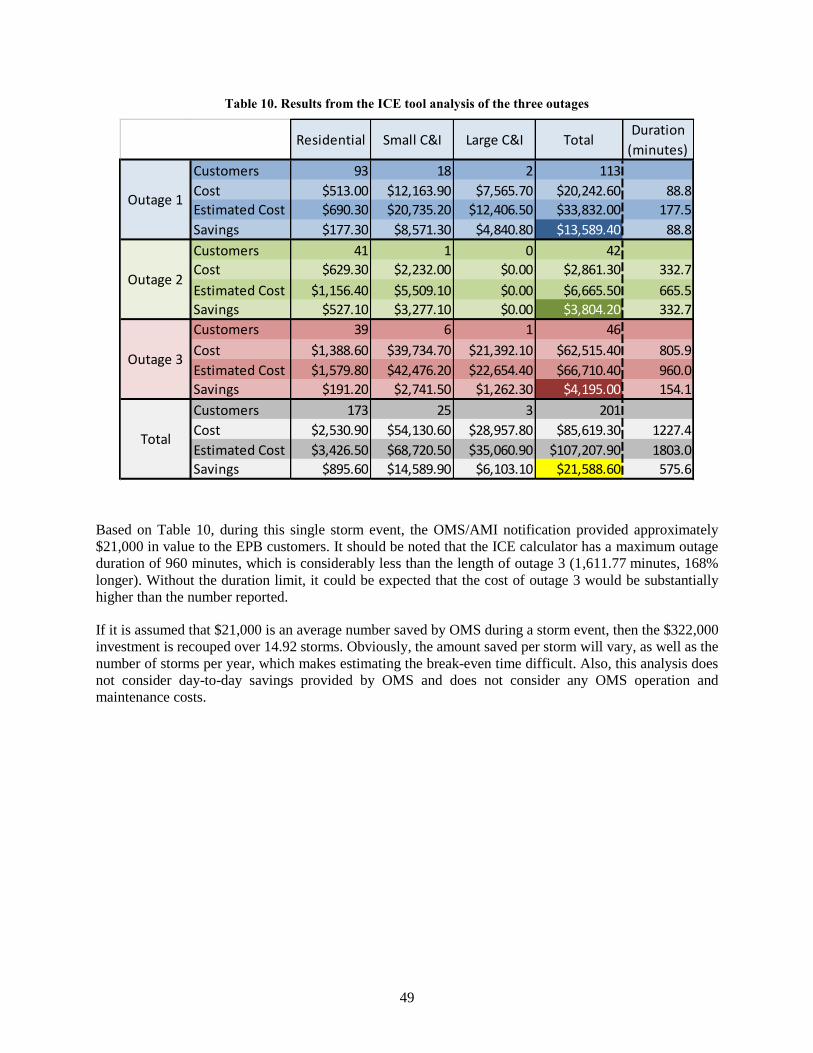
49
Table 10. Results from the ICE tool analysis of the three outages
Based on Table 10, during this single storm event, the OMS/AMI notification provided approximately
$21,000 in value to the EPB customers. It should be noted that the ICE calculator has a maximum outage
duration of 960 minutes, which is considerably less than the length of outage 3 (1,611.77 minutes, 168%
longer). Without the duration limit, it could be expected that the cost of outage 3 would be substantially
higher than the number reported.
If it is assumed that $21,000 is an average number saved by OMS during a storm event, then the $322,000
investment is recouped over 14.92 storms. Obviously, the amount saved per storm will vary, as well as the
number of storms per year, which makes estimating the break-even time difficult. Also, this analysis does
not consider day-to-day savings provided by OMS and does not consider any OMS operation and
maintenance costs.
Residential Small C&I Large C&I TotalDuration
(minutes)
Customers 93 18 2 113
Cost $513.00 $12,163.90 $7,565.70 $20,242.60 88.8
Estimated Cost $690.30 $20,735.20 $12,406.50 $33,832.00 177.5
Savings $177.30 $8,571.30 $4,840.80 $13,589.40 88.8
Customers 41 1 0 42
Cost $629.30 $2,232.00 $0.00 $2,861.30 332.7
Estimated Cost $1,156.40 $5,509.10 $0.00 $6,665.50 665.5
Savings $527.10 $3,277.10 $0.00 $3,804.20 332.7
Customers 39 6 1 46
Cost $1,388.60 $39,734.70 $21,392.10 $62,515.40 805.9
Estimated Cost $1,579.80 $42,476.20 $22,654.40 $66,710.40 960.0
Savings $191.20 $2,741.50 $1,262.30 $4,195.00 154.1
Customers 173 25 3 201
Cost $2,530.90 $54,130.60 $28,957.80 $85,619.30 1227.4
Estimated Cost $3,426.50 $68,720.50 $35,060.90 $107,207.90 1803.0
Savings $895.60 $14,589.90 $6,103.10 $21,588.60 575.6
Outage 3
Total
Outage 1
Outage 2

50

51
9. CAPACITY PLANNING AND PROTECTION
9.1 SUMMARY
When planning system upgrades, EPB uses CYME software and a host of data sets for comparison of the
considered upgrades. These, along with some developed metrics, provide EPB with an approach to choose
new locations for upgrades that could impact reliability.
9.2 PRE–SMART GRID
Before the Smart Grid implementation, EPB had only breakers, reclosers, and fuses in the distribution
system. Thus, EPB planners had to examine Time-current curves (TCCs to plan when devices on the system
would trip under different fault conditions. For capacity planning and protection analysis, EPB has
traditionally used the software package CYME. CYME has multiple modules that provide flexibility in
analysis. CYCMDIST contains electrical models of the system and provides power flow solutions based on
a single snapshot of the system. CYMETCC is used to perform protection coordination by generating TCCs
for analyzing relay and fuse coordination. CYMETCC directly connects to CYMEDIST for system
analysis. Both these modules have been actively used at EPB for planning purposes.
Specifically, CYMEDIST has been used at EPB to carry out the following.
• Power flow and voltage drop analysis
• Short-circuit analysis
• Load balancing and load allocation/estimation
• Steady state analysis with load profiles
• Network configuration optimization
• Voltage/VAR optimization
• Single contingency assessment and restoration
• Substation and sub-network modeling
• Secondary network analysis
• Arc flash hazard assessment
• Protective device coordination verification
Information from this analysis provides key indicators for potential system upgrades and future reliability
challenges. For each case, data are entered manually by the planning engineer and settings must be adjusted
(for example, changing transformer taps). The electrical models do not encompass individual loads but
instead cover the most near-load SCADA devices, such as reclosers. The load models are based on peak
consumption captured by SCADA on the feeder. Using this process to estimate the load was often labor-
intensive and resulted in inaccuracies because of the need to use aggregate load information. Furthermore,
planning engineers would have to run a series of reports through GIS and convert these reports to the correct
format to build models in CYME.
Contingency and protection analysis were also manual processes. Protection placement on feeders was
performed using a rule-of-thumb methodology. For example, reclosers were placed at points on the feeder
where the fault current was not high enough to operate the substation breaker or where the fault current was
too high for fuses. The TCC curves for the breakers and reclosers were programmed manually into
CYMETCC. Contingency analysis was performed through manual runs of simulation including
(1) removing the transformers and varying load pickup by other circuits, (2) examining switching routines,
and (3) comparing recorded fault data.

52
9.3 POST–SMART GRID
Many of the EPB approaches to planning before the implementation of the Smart Grid have not changed.
For example, the softwares CYMEDIST and CYMETCC are still used. However, the availability of new,
higher-resolution data sets has increased the accuracy of and approaches for evaluating system upgrades.
The protection systems have also shifted to the use of PCRs, which have changed the method and quantity
of protection settings.
9.3.1 Capacity Planning
As a result of the availability of new regulators and capacitors to support the DMS functions for voltage
regulation, EPB now uses “optimal capacitor placement and sizing” and “optimal voltage regulator
placement” functions in the CYMEDIST module. This analysis tool set supported determination of the
locations for automated switching/regulators and capacitors.
The availability of AMI and PCR data provides more accurate information on system loading used for
operation and planning analysis. The load data now have resolution down to the distribution transformer
level on 15 minute intervals. Load data now replace the data previously pulled from SCADA and GIS.
For system improvement project decisions, the three main criteria used for deciding project locations
include improved switching flexibility, outages due to device failures, and risk and cost associated with
new equipment and repair time.
Overall, the load growth for EPB has not been significant over the past decade, as shown in Figure 29. This
can be attributed to the relatively flat growth in industrial load and to energy-efficiency measures. Instead
of growth, load has shifted from one location to another.
Figure 29. Load growth of EPB system from 1999 to 2015.

53
9.3.1.1 Improved Switching Flexibility
To ensure that the system is not overloaded during a system reconfiguration, EPB looks to limit the
maximum loading on a feeder to 75%. This limit is to ensure that other interconnected feeders can absorb
some percentage of the load in case of an outage or switch reconfiguration. The planning engineer
prioritizes upgrades to the feeders that exceed 75% of capacity. In 2014, only a couple of the feeders
exceeded 75% loading, as shown in Figure 30.
Figure 30. Loading on feeders as a percentage.
Figure 31. Load provided by Feeder 1.
Example:
Feeder 1 is mainly responsible for powering loads, as shown in Figure 31. Feeder 1 is normally closed
and is at 75% of its maximum capacity. If an outage occurs on Feeder 1, i.e., a switch opens, it results
in power loss. To avoid such circumstances, EPB changes the configuration of the system now
powering these loads via neighboring feeders (Feeder 2, Feeder 3, and Feeder 4), as shown in
Figure 32, to provide interrupted service. This practice has helped EPB to provide reliable service to
its customers.
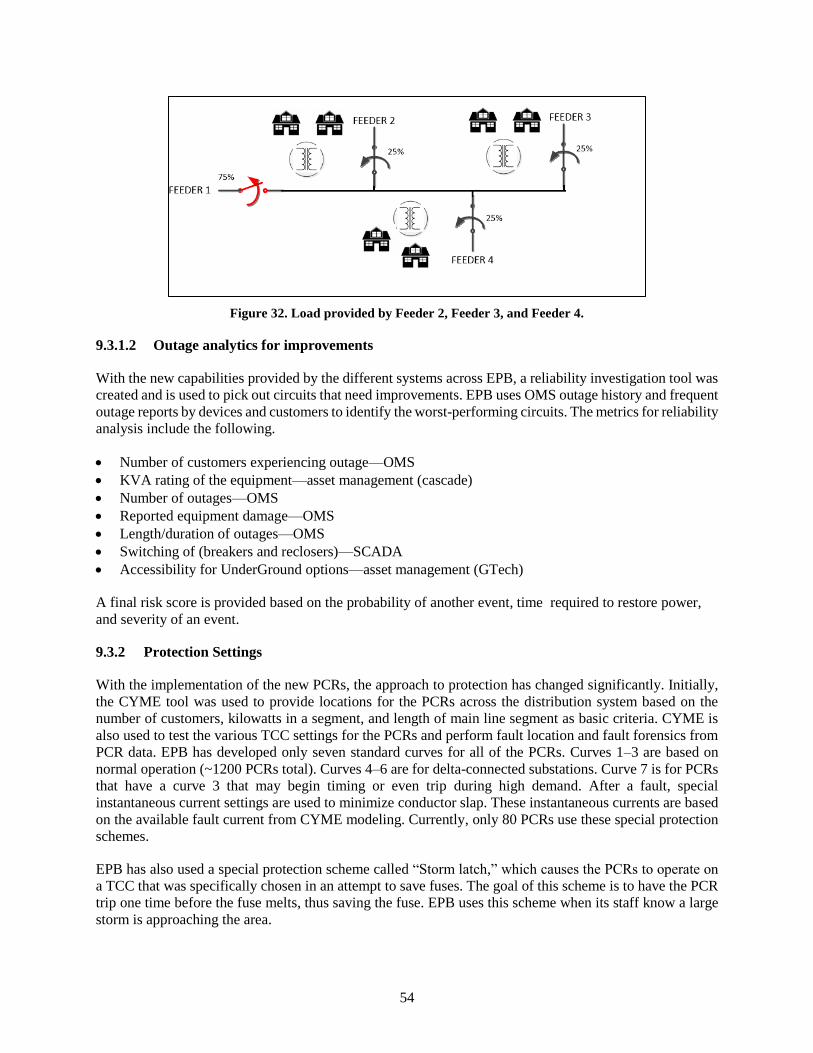
54
Figure 32. Load provided by Feeder 2, Feeder 3, and Feeder 4.
9.3.1.2 Outage analytics for improvements
With the new capabilities provided by the different systems across EPB, a reliability investigation tool was
created and is used to pick out circuits that need improvements. EPB uses OMS outage history and frequent
outage reports by devices and customers to identify the worst-performing circuits. The metrics for reliability
analysis include the following.
• Number of customers experiencing outage—OMS
• KVA rating of the equipment—asset management (cascade)
• Number of outages—OMS
• Reported equipment damage—OMS
• Length/duration of outages—OMS
• Switching of (breakers and reclosers)—SCADA
• Accessibility for UnderGround options—asset management (GTech)
A final risk score is provided based on the probability of another event, time required to restore power,
and severity of an event.
9.3.2 Protection Settings
With the implementation of the new PCRs, the approach to protection has changed significantly. Initially,
the CYME tool was used to provide locations for the PCRs across the distribution system based on the
number of customers, kilowatts in a segment, and length of main line segment as basic criteria. CYME is
also used to test the various TCC settings for the PCRs and perform fault location and fault forensics from
PCR data. EPB has developed only seven standard curves for all of the PCRs. Curves 1–3 are based on
normal operation (~1200 PCRs total). Curves 4–6 are for delta-connected substations. Curve 7 is for PCRs
that have a curve 3 that may begin timing or even trip during high demand. After a fault, special
instantaneous current settings are used to minimize conductor slap. These instantaneous currents are based
on the available fault current from CYME modeling. Currently, only 80 PCRs use these special protection
schemes.
EPB has also used a special protection scheme called “Storm latch,” which causes the PCRs to operate on
a TCC that was specifically chosen in an attempt to save fuses. The goal of this scheme is to have the PCR
trip one time before the fuse melts, thus saving the fuse. EPB uses this scheme when its staff know a large
storm is approaching the area.

55
9.4 COST
9.4.1 Capacity Planning
Because EPB was using the same CYME software before and after the Smart Grid implementation, there
was no cost for purchasing new software to accommodate all the new hardware. The main cost associated
with the upgrade can be attributed to the engineering time it took to determine the criteria for PCR
placement, adding the PCRs into the CYME models, and testing those models. There was also engineering
time associated with making sure that, after a fault and a reconfiguration, none of the newly formed feeders
became overloaded. The cost associated with these tasks is approximately $8,000, mostly for engineering
time.
9.4.2 Protection Settings
With the purchase of the PCRs, EPB planning engineers had to program each PCR with appropriate TCC
to avoid unintended switching, which accounted for some of the engineering cost. EPB also purchased the
Intelliteam software to help deploy settings and TCC curves to PCRs in the field. The total cost of these
activities was approximately $2,500 in engineering time.
9.5 BENEFIT
9.5.1 Capacity Planning
Although capacity planning changed with the introduction of PCRs and enhanced-resolution data, it has not
benefited monetarily from the Smart Grid investment. Operators have more flexibility in feeder
configuration and more resolute load models, but this is an indirect monetary benefit.
9.5.2 Protection Settings
Like capacity planning, protection planning and coordination have not seen a direct monetary benefit from
the Smart Grid upgrades to the EPB system. Planners now have more protection devices on the system and
a more standard method of assigning TCCs, but these benefits cannot be directly converted into monetary
savings.

56

57
10. ASSET MANAGEMENT
10.1 SUMMARY
While not a part of EPB’s Smart Grid implementation, one of the fundamental elements of managing an
electric system is managing the assets that make up the system. The primary components of asset
management at EPB consist of the inventory system (Cascade) and the GIS. Cascade allows EPB to keep
track of its current supply of equipment, as well as equipment location, age, and maintenance schedules. It
can interact with EPB’s modeling systems to provide accurate operating parameters. The GIS specifies the
connectivity between pieces of equipment in the field geographically and is the basis for the DMS and OMS
facility models.
10.2 PRE-SMART GRID
Asset management was and still is a critical piece of operating and maintaining a reliable electric grid.
Maintenance, inspections, and detailed inventory all contribute to grid reliability. EPB has two major
systems that assist in managing most of its physical assets; those systems are mostly unchanged from the
systems EPB had before the Smart Grid implementation.
Historically, Cascade has been used to maintain a digital history and to determine the status of spare and
in-use equipment. Each piece of equipment is described in great detail, including parameters such as a
unique identifier, the type of equipment, the equipment physical characteristics, geospatial coordinates of
the location, and maintenance intervals. All EPB electrical equipment has been included in this system.
One valuable feature of Cascade has been its ability to predict maintenance needs and set alerts for
scheduled maintenance. At the start of the fiscal year, EPB could view all equipment due for maintenance
in the following 12 months and schedule the maintenance for the least inconvenient time of the year,
typically in spring or fall, when power demand is low. The system could also alert EPB when it was time
to inspect a line for damage, vegetation growth, or general repairs. On top of scheduling, the inventory
system could send alerts to engineers in advance to inform them that necessary upkeep is forthcoming. The
system would also keep track of the status of work orders and notes and archives orders, once they were
complete, as maintenance records.
Another vital component of asset management before the Smart Grid update was the GIS. It acted as the
master system model, on which many other EPB systems depended for electrical connections, demand
modeling, protection schemes, and several other functions. The GIS was used for EPB’s 46 kV, 12 kV, and
4 kV circuits, as well as any fiber lines operated by the utility had before the Smart Grid implementation.
Before any non-outage work was done in the field, the job would be designed in the GIS. New poles, lines,
and equipment would be designed in the GIS and tested in other software before they were added to a jo
and given to a crew to perform the work. Once the job was complete, any field changes made to the design
would be entered into the GIS and submitted as complete. The EPB electrical model would then be updated
for all dependent software (e.g., OMS) at midnight on the following day. Before the updated model was
used in other systems, a validity check was performed by EPB personnel on the model updates to verify
accuracy. Once verified, the model would be fully available for all dependent software and available for
download by field vehicles.
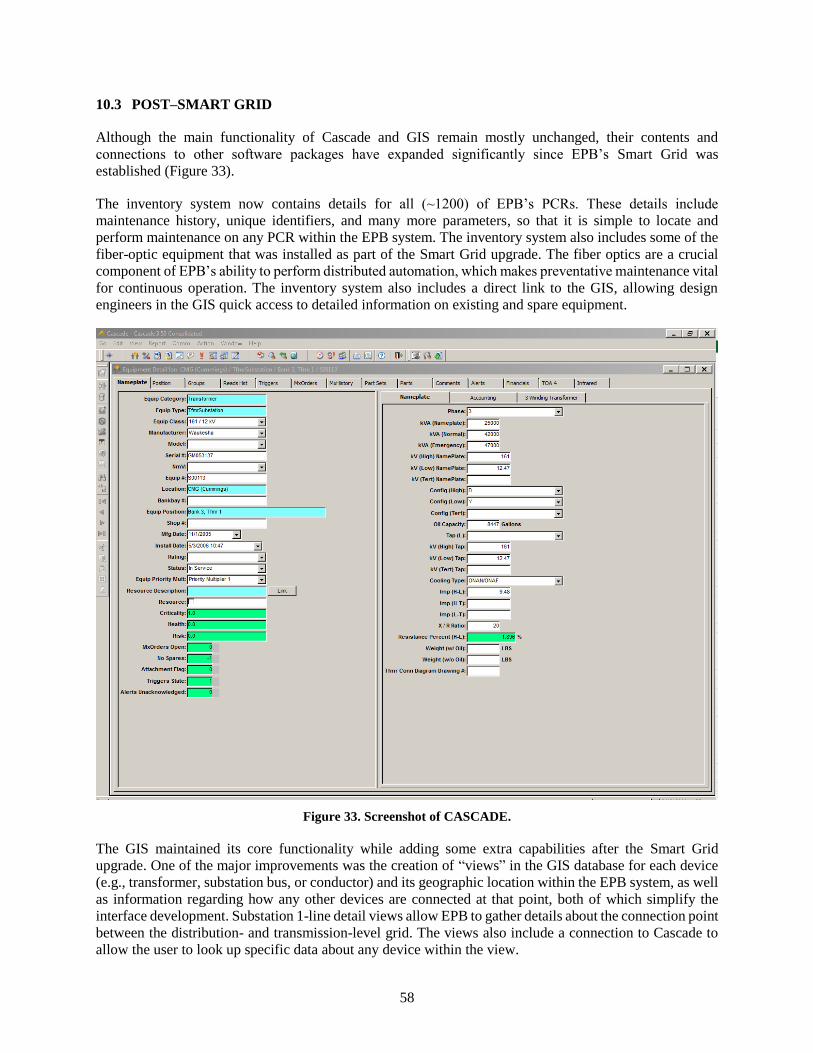
58
10.3 POST–SMART GRID
Although the main functionality of Cascade and GIS remain mostly unchanged, their contents and
connections to other software packages have expanded significantly since EPB’s Smart Grid was
established (Figure 33).
The inventory system now contains details for all (~1200) of EPB’s PCRs. These details include
maintenance history, unique identifiers, and many more parameters, so that it is simple to locate and
perform maintenance on any PCR within the EPB system. The inventory system also includes some of the
fiber-optic equipment that was installed as part of the Smart Grid upgrade. The fiber optics are a crucial
component of EPB’s ability to perform distributed automation, which makes preventative maintenance vital
for continuous operation. The inventory system also includes a direct link to the GIS, allowing design
engineers in the GIS quick access to detailed information on existing and spare equipment.
Figure 33. Screenshot of CASCADE.
The GIS maintained its core functionality while adding some extra capabilities after the Smart Grid
upgrade. One of the major improvements was the creation of “views” in the GIS database for each device
(e.g., transformer, substation bus, or conductor) and its geographic location within the EPB system, as well
as information regarding how any other devices are connected at that point, both of which simplify the
interface development. Substation 1-line detail views allow EPB to gather details about the connection point
between the distribution- and transmission-level grid. The views also include a connection to Cascade to
allow the user to look up specific data about any device within the view.

59
The GIS was upgraded with an interface to the DMS, allowing the DMS to have the most accurate and up-
to-date models of EPB’s power system. The models include PCR models, locations, and settings, which are
critical to the design of automated switching schemes.
10.4 COST
The inventory system for EPB, CASCADE, was provided by Digital Inspections (KEMA Inc.) and was the
vendor for both the pre- and post-Smart Grid inventory system.
The GIS software GTECH was provided by Intergraph/Hexagon both before and after the Smart Grid
installation. The main cost associated with upgrading the GIS was the development of the interface between
the GIS and the DMS. These integration costs are captured in Section 4, Distribution Management System.
10.5 BENEFIT
EPB was benefitting from asset management long before it established the Smart Grid. The inventory
system would schedule and remind engineers about maintenance needs of equipment, which prolonged the
life of the equipment and helped maintain equipment efficiency. The GIS allowed engineers to design line
upgrades geospatially while maintaining an accurate power system model that can be used by other software
systems for analysis.

60
61
11. CUSTOMER INFORMATION SYSTEM
11.1 SUMMARY
The EPB CIS incorporates all customer-related processes and information, including customer billing
information, consumption, work orders, and meter locations. EPB bills approximately 152,000 residential
customers, 21,000 small commercial and industrial customers, and 3,100 large commercial and industrial
customers. EPB’s customer service currently receives over 2 million calls per year for both its fiber-optic
internet service and electrical distribution service and 90,000 online requests for consumption data by
customers.
11.2 PRE–SMART GRID
Before the implementation of smart meters and fiber-optic communication, EPB’s CIS relied on manual
monthly meter readings to obtain customer consumption data. The customer consumption data were entered
into a database, and at the end of the billing cycle, customers’ bills were created and mailed. Customers
then had the option of paying in person, by mail, or online.
Maintenance requests by customers for tree trimming or streetlight outages were dealt with by the EPB call
center. The call center would create service requests and send them to EPB Dispatch, from which trucks
were manually scheduled to fulfill the service requests.
EPB implemented some sensing capabilities allowing outage detection at substations before large-scale
implementation of distribution system automation. However, the great majority of outages were reported
by customers who contacted the EPB call center. The call center would then create a service request and
send it to EPB Dispatch. Often multiple customers would call and report an outage, making it difficult to
distinguish between multiple outages and multiple reports of a single outage. EPB would then dispatch a
maintenance truck to the feeder that experienced the outage. The repair crew would need to drive along the
route of the feeder to pinpoint the location of the fault and fix it. Residential outages occurring during
business hours would occasionally go unreported until customers returned from work in the evening.
11.3 POST–SMART GRID
The implementation of Smart Grid technologies allowed EPB to improve the interface of its CIS with other
EPB systems and implement new technologies in the CIS. The Smart Grid CIS communicates with the
SGMS, OMS, and the CAD system. CIS integration with SGMS provides the CIS with 15-minute interval
meter data that are used for bill creation, customer access to their power consumption data, customer service
access to power consumption to help customers with questions about their bills, and access to the remote
disconnect and reconnect capabilities of some smart meters. In addition to billing questions, customer
service handles power outage reports, tree trimming requests, and streetlight maintenance requests from
customers. The CIS interfaces with the OMS and provides it with data for customer- or meter-reported
outages. This allows the OMS to make better outage predictions for the system operators and line crews.
The CIS also interfaces with CAD to automate and optimize the issuing of work orders for power
restoration, maintenance requests, and connect/disconnect orders for customers who have failed to pay their
bills or are moving.
The Smart Grid technologies have allowed EPB to implement new technologies in its CIS, particularly in
the area of data reporting to customers. EPB uses the DOE green button data specification to make smart
meter consumption data available to its customers through an online portal.

62
11.4 COST
The CIS software is provided by enQuesta, the provider both before and after the Smart Grid
implementation. The software includes a web portal that customers can access and populate with their
personal electricity usage history. The cost of integrating enQuesta with other software packages at EPB
was included in the costs specified in the SGMS and AMI sections.
11.5 BENEFIT
The largest Smart Grid benefits to EPB and its customers related to CIS arise from the technological and
business model changes enabled by the availability of 15-minute-interval customer consumption data. The
high-resolution data give EPB the ability to provide more information to its customers, allowing them to
make more educated decisions regarding their electricity usage and potential home inefficiencies. EPB has
also been able to develop a new time-of-use rate structure for its customers. If customers choose this rate
structure, they take a more active role in controlling their electricity usage by paying a discounted price
during off-peak hours and a premium during on-peak hours. Additionally, improved integration of the CIS
with other EPB systems, remote disconnect and reconnect capabilities, and improved reliability also made
possible by the Smart Grid have allowed EPB to be more flexible in its business models and improve its
customer service.
EPB has seen both economic benefits and improved customer relations because of the new CIS
technologies. The installation of smart meters by EPB had the immediate effect of eliminating the need to
manually read electric meters. Eliminating the labor costs associated with manual meter readings reduced
EPB’s annual operating costs (this effect is described in more detail in Section 3, Smart Grid Management
System).
EPB has also seen a reduction in the number of requests for bill audits, as shown in Table 11, which reduces
the labor-intensive process of manually verifying customer energy consumption. Consumer access to 15-
minute consumption data has improved communication between EPB and customers who have billing
questions. The number of requests for bill audits has decreased because detailed consumption data are
available to the customer, making it easier for them to correlate their behavior with their electrical
consumption. Customers can see the one-to-one impact of weather and other events, such as houseguests,
on their power consumption for the dates when those events occurred, rather than trying to analyze data
aggregated over a month.
Table 11. Change in audit requests and tampering investigations from before and after Smart Grid
implementation
Smart Grid implementation
2011 2014 % Change
Energy audit requests 1490 394 −73.56%
Tampering investigations 1091 1789 63.98%
Closely coupling the CIS with the CAD system has also improved EPB’s ability to respond to customers
who are having difficulty paying their bills. EPB can respond quickly using the RDUG meters, covered in
more detail in the SGMS section.
When a customer is moving within the service area, the Smart Grid allows EPB to quickly transfer service
to a new meter and provide flexibility on the bill start and end dates. Access to 15-minute consumption data
has also allowed EPB to deploy three technologies for reducing customer costs. First, by correlating weather

63
and other factors with consumption, and using thermodynamic models of homes, EPB can provide energy
audits of a home and flag residences that are exhibiting signs of low thermodynamic efficiency. Second,
during extremes of heat and cold, EPB can alert customers to high power usage so that they are not surprised
by a large bill. Third, EPB can detect a large, anomalous consumption surge during cold weather that may
signal a heat pump failure and a switch to less efficient, more expensive backup heating and can quickly
alert the customer.
Interfacing the CIS with the OMS and CAD system has also improved customer service during major events
like storms. The CIS can report any outage reports or meter disconnections to the OMS, allowing it to more
easily find the corresponding physical fault that caused an outage. Knowing the locations of power outages
also allows EPB to more precisely estimate the amount of time that it will take to restore a customer’s
power and can share that information with the customer during an outage.
Smart Grid technologies have improved EPB’s ability to quickly respond to customer needs, reduce its
operational costs, reduce economic losses from theft, detect residences that are thermodynamically
inefficient or have experienced equipment failure that is causing excess power usage, improve transparency
during major events, increase its ability to manage demand, and introduce innovative new billing structures
that are beneficial to EPB and its customers.

64
65
12. FIBER OPTIC SYSTEM
12.1 SUMMARY
One of the core components of the EPB Smart Grid was installation of fiber optic cable throughout the EPB
service territory. EPB staff realized early on during the planning of the Smart Grid that an enabling
technology for integrating more advanced systems is a high-bandwidth communication system. EPB
examined multiple options for the communication infrastructure. Wireless communication was the most
widely deployed communication option for Smart Grid applications. However, the main driver in the choice
of communication medium was that fiber has a huge advantage over wireless from a latency and bandwidth
perspective, and that is before you consider the upside of how quickly fiber technologies are increasing the
available bandwidth for future applications. Physical security is also a factor, since the fiber medium is a
point-to-point technology with encryption within the protocols being used in the fiber network, as well as
within the actual equipment being deployed for Smart Grid. As seen in Figure 1, installation of the fiber
began in 2009 and was completed in 2012. The fiber system was developed in rings, forming the backbone
of EPB’s communication network and extending throughout all of EPB’s electrical service territory. In all,
the fiber system consists of over 8,000 miles of cable with over 1.3 Tbps of active capacity. The more than
75,000 customers using EPB internet account for over 76 Gbps of traffic.
12.2 PRE-SMART GRID
EPB’s distribution equipment before the fiber installation primarily used radio communication to return
various data points to SCADA. The radio communication strength would fade in bad weather and was
unreliable at times. There were few devices that could perform distribution automation operations using
only the radio communications. The electrical meters did not have communication capabilities, so meter
readers were required to visit every customer to obtain usage data. Outage prediction was limited and relied
mostly on SCADA device operation and customer phone calls. Electricity theft was hard to detect quickly,
and customers had very little information available to them regarding their electricity usage.
12.3 POST–SMART GRID
After receiving a Smart Grid Investment Grant in 2010, EPB could accelerate its fiber optic system
deployment in its service territory. The system was designed as a series of two large transport fiber rings,
with smaller “distribution” fibers going out to individual customers. In all, EPB installed 92 miles of
transport fiber optic cable, 784 miles of feeder fiber, 3,300 miles of distribution fiber, and 4,000 miles of
drop fiber. All of EPB’s substations connect to either the transport or feeder fiber, allowing for SCADA
and other substation data to use the speed and reliability of the fiber optic cables. EPB’s electrical
infrastructure uses its own reserved section of fiber for the distribution automation, AMI, and substation
communication.
For fiber service to customers, the main transport fiber goes to an optical line terminal (OLT), which then
converts to the smaller feeder fiber, which tends to share the same poles as the main electrical feeder lines
(Figure 34). Then the fiber hits a pole-mounted splitter, which converts the single feeder fiber into up to 32
distribution fibers. The distribution fiber runs to a midline network access point (NAP), which converts the
fiber to drop fiber that goes the rest of the way to the customer’s optical network terminal (ONT). At the
ONT, the customer has access to EPB’s 2.4 Gbps downstream and 1.2 Gbps upstream fiber optic services.
The AMI meters also use the fiber optic system to return their measurements to the SGMS once every 15
minutes. The high bandwidth provided by the fiber enables all of the more than 175,000 AMI meters to
provide data without causing congestion on the communication lines. This benefits the SGMS, OMS, DMS,
and CIS by providing 15-minute-resolution data for analysis and action. More details about how this data
is used are provided in previous sections of this report.
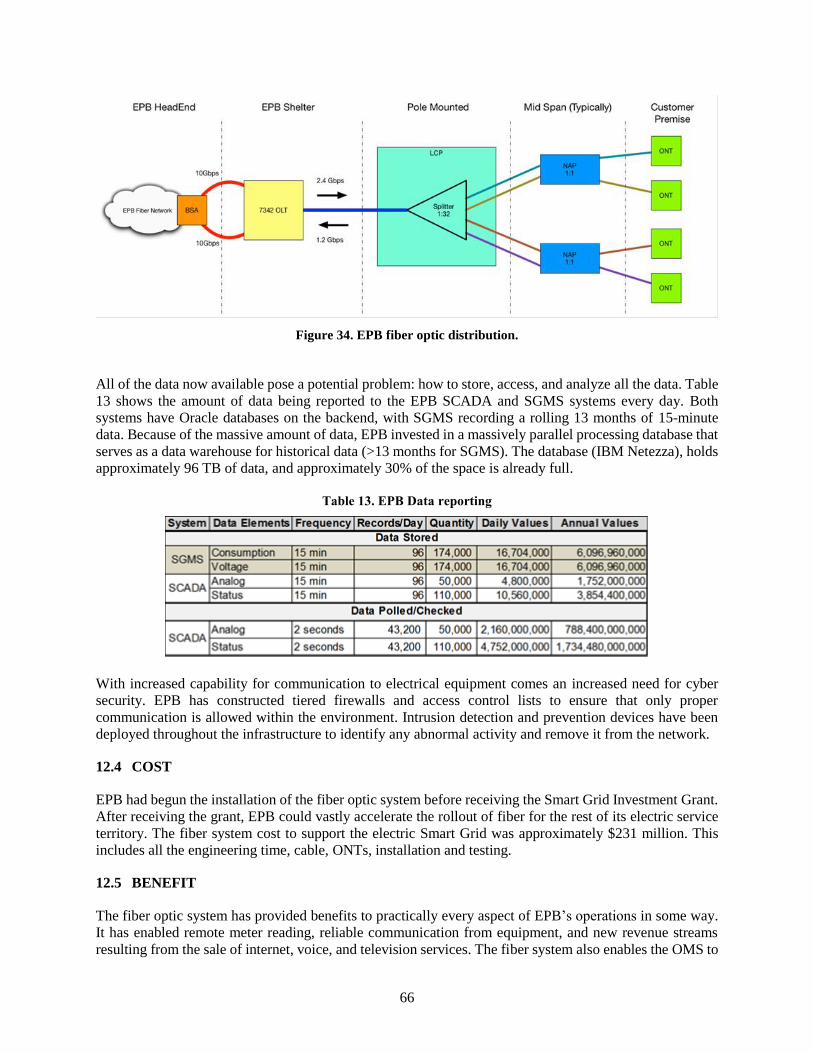
66
Figure 34. EPB fiber optic distribution.
All of the data now available pose a potential problem: how to store, access, and analyze all the data. Table
13 shows the amount of data being reported to the EPB SCADA and SGMS systems every day. Both
systems have Oracle databases on the backend, with SGMS recording a rolling 13 months of 15-minute
data. Because of the massive amount of data, EPB invested in a massively parallel processing database that
serves as a data warehouse for historical data (>13 months for SGMS). The database (IBM Netezza), holds
approximately 96 TB of data, and approximately 30% of the space is already full.
Table 13. EPB Data reporting
With increased capability for communication to electrical equipment comes an increased need for cyber
security. EPB has constructed tiered firewalls and access control lists to ensure that only proper
communication is allowed within the environment. Intrusion detection and prevention devices have been
deployed throughout the infrastructure to identify any abnormal activity and remove it from the network.
12.4 COST
EPB had begun the installation of the fiber optic system before receiving the Smart Grid Investment Grant.
After receiving the grant, EPB could vastly accelerate the rollout of fiber for the rest of its electric service
territory. The fiber system cost to support the electric Smart Grid was approximately $231 million. This
includes all the engineering time, cable, ONTs, installation and testing.
12.5 BENEFIT
The fiber optic system has provided benefits to practically every aspect of EPB’s operations in some way.
It has enabled remote meter reading, reliable communication from equipment, and new revenue streams
resulting from the sale of internet, voice, and television services. The fiber system also enables the OMS to

67
make more accurate predictions about outage locations, which cuts down on the time linemen spend in the
field attempting to identify outage failure points. One of the largest benefits is the performance
improvements of the Intellirupters and their ability to autonomously reconfigure the grid in case of a fault.
EPB has seen improvements in its reliability metrics as a direct result of the distribution automation. The
estimated benefit to each of these systems is examined in previous sections of this report.
Because the fiber optic system has benefitted EPB’s operations as a whole, it is difficult to quantify the
monetary benefit of the system. One could argue that many of the Smart Grid investments covered in
previous sections of this report would offer much smaller benefits if not for the fiber system, which is now
the backbone of EPB’s electric system. A separate study has been performed to estimate the value of the
fiber optic system. [2]

68

69
13. CONCLUSION
The deployment of a Smart Grid within the EPB electrical system has brought significant value to EPB
customers and to EPB operations. The Smart Grid implementation has permitted the capability to automate
many of the existing systems, increasing the overall efficiency and decreasing round trip time for many
required operation functions. This has both reduced the cost of operations and increased the reliability of
customer service. This boost in performance can be primarily linked to two main components: the
communication network and the availability of data.
The existence of a fiber communication backbone has opened numerous opportunities for EPB. Large data
sets from remote devices can be continuously polled and used to compute numerous metrics. The speed of
communication has provided a pathway to sophisticated distribution automation that would not otherwise
be possible. The data have been shown to provide a much broader view of the actual electrical system that
was not previously available, opening many new opportunities in data analytics.
This report documents many of the existing systems and operational features of the EPB system. Many of
these systems have seen significant improvement with the deployment of Smart Grid technologies. The
research behind this report found that in some cases, the value was directly computable or estimable for
these enhancements.
Currently, several ongoing research topics are under investigation within EPB. Through a grant from
TVA, EPB is currently installing a 1.3MW solar photovoltaic system, which will be the first-generation
asset owned by EPB.

70

71
14. ACKNOWLEDGMENTS
This material is based upon work supported by DOE’s Office of Science, Office of Electricity Delivery
and Energy Reliability, under contract number DE-AC05-00OR22725.
The authors would like to thank Jim Glass, Jim Ingram, Lilian Bruce, and the rest of the EPB team for
being available for interviews and for providing all data that were requested during the writing of this
report.

72
15.

73
16. REFERENCES
[1] Starke, Michael R, T Ben Ollis, Jim Glass, and Alexander M Melin. 2016. Chattanooga Electric
Power Board Case Study—Distribution Automation. ORNL/LTR-2015444, Oak Ridge National
Laboratory.
[2] Lobo, Bento J. 2015. “The Realized Value of Fiber Optic and Smart Grid Infrastructure in Hamilton
County, Tennessee, 2011–2015,” mimeograph from the University of Tennessee at Chattanooga.
Retrieved from http://ftpcontent2.worldnow.com/wrcb/pdf/091515EPBFiberStudy.pdf