Embed Size (px)
Citation preview

Scientific Papers (www.scientificpapers.org) Journal of Knowledge Management, Economics and Information Technology
1
Vol. IV, Issue 6 December 2014
Analysis of Economic Liberalization and
Telecommunication Sector Performance in Nigeria
Authors: Bosede Esther Akanbi, Department of Economics, Osun
State University, PMB 4494, Osogbo, Osun State, Nigeria,
[email protected]; Abayomi Ayinla
Adebayo, Department of Economics, Obafemi Awolowo
University, Ile-Ife, Osun State, Nigeria; Phillip Akanni
Olomola , Department of Economics, Obafemi Awolowo
University, Ile-Ife, Osun State, Nigeria
In this paper, we examined the empirical relationship between economic
liberalization and telecommunication sector performance in Nigeria between
1986 and 2010 using the Stock and Watson (1993) Dynamic Ordinary Least
Square (DOLS) technique. The study utilized secondary data and they were
sourced from Nigeria Communication Commission (NCC), Central Bank of
Nigeria (CBN) Statistical Bulletin and World Development Indicator (WDI)
Database.
The study found that a positive and significant relationship exists
between telecommunication sector performance which is proxied by employee
per telecommunication subscribers and the parameter of the dummy variable
for economic liberalization (LIDUM) (t= 4.6400, p-value<0.01) and
competition in the telecommunication market (t-value = 2.7889, p<0.05). The
study concluded that economic liberalization enhanced performance of
telecommunication sector positively.
Keywords: Telecommunication Sector Performance, Economic
Liberalization, Dynamic OLS, Nigeria

Analysis of Economic Liberalization and Telecommunication Sector Performance in Nigeria
2
Vol. IV, Issue 6 December 2014
Introduction
The growth, development and expansion of telecommunications, alongside
large-scale technological development, have yielded many benefits for
communities in countries, although not to the same degree for everyone,
and not in all aspects of general welfare (ITU, 1998). In today’s increasingly
globalised environment, developing countries are being encouraged to
liberalize their economies, under the notion that these would lead to greater
development thereby promoting sustained economic growth. Like elsewhere
in the world, Nigeria embarked on a liberalization program of its different
sectors including telecommunication industry during the mid-1990. The
decision to reform Nigeria telecommunications sector was based on the goal
to improve its quality and quantity of services by way of strategic investors
who will bring in additional technical know-how, managerial skills and
necessary capital in narrowing the gap between supply and demand.
The liberalization and de-regulation of the nation’s
telecommunication sector and the economy as a whole has promoted the
entry of many new players into this sector (Oyedijo, 2012). Thus, the level of
activities in this sector has increased tremendously for over a decade. This
was based on the aspiration to expand and to rapidly develop the
telecommunication network to a level comparable to any other countries of
the world with a view to expand the services enjoyed by all. On the other
hand, it has been emphasized that the rapid development of Nigeria’s
telecommunications sector in recent years has not only been the result of
reform policies introduced by the government, but also the outcome of a
technological “leapfrogging” process (Ndukwe, 2008). This development
strategy has allowed the country to skip the intermediate stages of copper
wire and analogue telephone systems and has facilitated the rapid expansion
in Nigeria’s telecommunications sector.
Indeed, literature has provided evidence that liberalization
involving removal of restrictions on the operation of communication
systems can help countries to leapfrog several stages of development based
on the of effective regulatory frameworks. Although, studies have been
conducted on the impact of deregulation and liberalization on
telecommunication investment in Nigeria, relatively little empirical work
has been done on how economic liberalization affects the performance of
telecommunication sector in Nigeria. Therefore, this paper examined the

Analysis of Economic Liberalization and Telecommunication Sector Performance in Nigeria
3
Vol. IV, Issue 6 December 2014
empirical relationship between economic liberalization and
telecommunication sector performance in Nigeria is examined using the
Stock and Watson (1993) dynamic ordinary least square (DOLS) technique
which are primarily chosen because of the relatively small size of the sample
under review.
Literature Review
In the early 1980s, many developed countries started to privatize and
liberalize the telecommunications sector. A number of studies were
conducted to evaluate the performance of the telecommunications sector
before and after the reform. Empirical results have shown that privatization
and liberalization have improved the productivity and efficiency of
telecommunication sector (Lam and Shiu, 2008).
In general, high-income developed countries have achieved a higher
degree of privatization and liberalization than low-income developing
countries. Therefore, the former have better productivity performance than
the latter (Ros, 1999). Besides, the growth in TFP was also found to be the
result of innovation (i.e. technological change) rather than improved
efficiency (i.e. efficiency change). A wider use of mobile technology has
improved the efficiency and productivity of the telecommunication sector.
For instance Jha and Majumdar (1999) used panel data and the stochastic
production frontier estimation approach to measure the productivity of the
telecommunications sector for 23 OECD countries for the period 1980-1995.
They found that mobile technology diffusion had a positive and significant
impact on the productivity of the telecommunications sector. Since mobile
technology diffusion is important to telecommunications productivity, the
results of Jha and Majumdar (1999)’s study implied that developing
countries and transition economies should develop their wireless or mobile
systems local loops, since this can allow them to buy pass investments in
fixed lines completely and “leapfrog” into the information age.
Ros (1999) examined the effect of privatization and competition on
network expansion and efficiency, 1986-1995, in the 110 countries (including
developed countries). He found that countries with majority privatized PTO
have higher mainline penetration and mainlines per employee. While
competition was not found to affect network expansion, it was found to
positively affect efficiency. Wallsten (2001) explored the effect of

Analysis of Economic Liberalization and Telecommunication Sector Performance in Nigeria
4
Vol. IV, Issue 6 December 2014
privatization, competition and regulation on telecommunications
performance in 30 African and Latin American Countries from 1984 through
1997. He found that competition was significantly correlated with increased
mainline penetration, connection capacity, payphone penetration, and a
decrease in local calling prices. Privatization alone, however, was associated
with few benefits, and was negatively correlated with connection capacity.
Fink, Mattoo, and Rathindran (2003) analysed the impact of policy reform
in basic telecommunications on sector performance in 86 developing
countries over the period 1985 to 1999. They found that countries with
complete liberalization have higher teledensity and labor productivity
relative to those with no or only partial reform.
Both privatization and competition improved performance and the
latter reinforces the former. Wallsten (2004) investigated the impact of
exclusivity rights of newly privatized telecommunications firms in
developing countries. Exclusivity rights tended to increase price and reduce
investment and penetration. As a result, turning a public monopoly into a
private monopoly may not necessarily generate the improvements reformers
had envisioned. In addition, introducing competition after privatizing
incumbent operators led to fewer mainlines per population compared to a
simultaneous introduction of the two policies. Li and Xu (2004) suggested
that privatization and competition were important factors in the
development and expansion of both fixed and mobile telecommunications.
Full privatization, which gave private owners control rights, contributed
substantially to improving the allocation of labor and capital, expanding
service output and network penetration, and improving labor and total
factor productivities. But partial privatization, which retained the state’s
control rights, showed no significant impact.
In summary, empirical evidence showed that privatization and
liberalization have improved the productivity performance in
telecommunications. However, many of these studies stem from cross-
country studies and were not sufficiently recent in order to allow for an
assessment of the specific situation in each of these countries. Also, in most
developing countries like Nigeria, telecommunication started only a decade
ago, hence the need to examine a country level study that depicts a special
case for Nigeria.

Analysis of Economic Liberalization and Telecommunication Sector Performance in Nigeria
5
Vol. IV, Issue 6 December 2014
Methodology
Model
In order to measure the performance of telecommunication sector, the
paper adapted Li and Xu (2004). The dependent variable performance is
measured as a function of a variable for liberalization, LIDUM. This is used
traditionally since a priori, liberalization is supposed to crate room for new
entrants (Wallsten, 1999). Therefore,
= ……………………………………………3.1
Where yt is a measure of telecommunication sector performance
and LIDUM is a variable proxied by liberalization
In order to capture the actual impact of liberalization, the level of
Competition was introduced into the model. The level of competition
(Compt) is expected to influence penetration rate positively. Thus,
)
The need to examine the influence of other factors which are
considered to have impact on the demand for telecommunication services in
the country and as such are expected that they will influence performance
indicator positively (Garbaz and Thompson, 2004). Some of these variables
are income, total population and urban population. Equation (3.2)
becomes:
Variable et is introduced to capture the model’s disturbance or error
term.
Two of the identified indicators as provided by International
Telecommunication Union (ITU) for assessing telecommunication sector
performance were used (Li and Xu, 2004; Arawomo, 2007). The two
dependent variables that were used are Penetration rate (Pen) and Employee
per Subscribers (EMPS). Since performance was measured by two sub
dependent variables, which are Penetration rate and employee per telecom
(EMPS), equation (4) is sub-divided into (5) and (6) respectively:

Analysis of Economic Liberalization and Telecommunication Sector Performance in Nigeria
6
Vol. IV, Issue 6 December 2014
Where Pent = Penetration rate, EMPSt = Employee per telecom
subscribers, POPt = Total Population, URPOPt = Urban Population,
LIDUMt = Dummy for Liberalization, a0 , a1, a2, a3, a4,a5, b0, b1, b2, b3,
b4, b5 are parameters to be estimated and et, e2t are the error terms.
Since performance will be estimated using Dynamic Ordinary Least Square
(DOLS) techniques, equations (3.5) and (3.6) were further specified in DOLS
forms. Thus:
∑
∑
∑
∑ ∑
………………………3.7
where ,
∑
∑
∑
∑ ∑
……………………………..3.8
where ,
Data Sources
To achieve the objective of the study, times series data for the period 1986–
2010 were employed. Data relating real GDP, telephone subscriber per 100
populations, number of operators in both mobile and fixed line segment in
telecommunication industry, employee per mainline, total population and
percentage of the population living in an urban area. Also, these time series
data will be obtained from International Telecommunication Union (ITU),
World Development Indicator (WDI), Central Bank of Nigeria (CBN)
statistical bulletin, Nigeria Communication Commission (NCC), National
Bureau of Statistics (NBS) publications
Estimation Techniques
To determine the effect of economic liberalization on the performance of
telecommunication sector was achieved by using Stock and Watson’s
Dynamic Ordinary Least Square(DOLS) technique. The following sequential
procedures were adopted as part of our methodology. The inclusion of leads

Analysis of Economic Liberalization and Telecommunication Sector Performance in Nigeria
7
Vol. IV, Issue 6 December 2014
and lags was applied to system of variables with different order of
integration in order to verify to what degree these series share univariate
integration properties. Both unit root tests and mean stationarity tests were
performed. Augmented Dickey-Fuller tests (Dickey and Fuller, 1981), as well
as Phillips-Perron tests were employed to check for the first-order unit
roots. These tests suggested that the first differences of the logs of the
variables should be used in specifying and estimating the model.
In carrying out this procedure, we initially tested for the stationarity
of the respective variables. This is necessary, given the respective innovation
in econometric modeling which has indicated that many macroeconomic
time series are not stationary in their levels and that many time series are
most adequately represented by first difference (Dickey, Jensen and
Thornton, 1991). The choice of DOLS techniques is influenced by two main
reasons. First , this approach has certain advantage over the Classical
Ordinary Least Square (OLS) since it is robust to small sample and
simultaneity bias. Second, the DOLS estimator is superior to a number of
other estimators as corrects for simultaneity bias and small sample bias
among regressors (Stock and Watson, 1993).
Results and Discussions
All data series used in the study covers the period from 1986 to 2010. For the
purpose of the study, data on level of competition (COMP), penetration rate
(PEN), population (POP), real gross domestic product (rgdp), employee per
subscribers (SEMP), urban population (URPOP) and gross domestic product
(GDP) were used in the analysis. Moreover, a dummy variable (LIDUM)
which is intended to capture the impact of economic liberalization on the
sector under consideration is also introduced. This dummy takes the value
of 0 before the liberalization of the telecommunication sector in 2001 and
the value of 1 after liberalization.
Table 4.1 also indicates that all the series displayed a high level of
consistency as their mean and median values were perpetually within the
maximum and minimum values of these series. The skewness and kurtosis
statistics are particularly of great importance since they were used in the
computation of Jarque-Bera statistic, which was used in testing for the
normality or asymptotic property of a particular series. If the Jarque-Bera

Analysis of Economic Liberalization and Telecommunication Sector Performance in Nigeria
8
Vol. IV, Issue 6 December 2014
statistic is greater than the critical value of the chi-square, we reject the null
hypothesis of normality.
As shown in table 4.1, all the data series (except PEN) are
approximately normally distributed. The non-normality of the PEN variable
becomes apparent since the Jarque-Bera statistic of 17.778 is greater than the
critical value of 5.99 and 9.21 at 5% and 1% level respectively. The normality
of most variables is also indicated by the closeness of means and medians.
Given that most of the series used in this study are nor mally distributed, one
can reasonably describe the distribution of parameters, such as slope and
intercept that we hope to estimate (Pindyck and Rubinfeld, 1998).
Table 4.1: Descriptive Statistics of Data Series
Descriptive
Statistics COMP PEN POP RGDP EMPS URPOP GDP
Mean 13.600 10.082 120.396 103451.9 0.037 50.582 7593227
Median 2.000 0.431 118.899 79709.9 0.034 48.820 2939650
Maximum 42.000 63.110 158.144 190357.3 0.101 78.629 30215800
Minimum 1.000 0.252 87.461 51615.0 0.003 28.425 93062
Std. Dev. 14.654 18.500 21.666 47572.0 0.025 15.434 9395220
Skewness 0.594 1.820 0.161 0.8 0.752 0.271 1.191
Kurtosis 1.807 4.954 1.825 2.1 3.068 1.864 3.060
Jarque-
Bera 2.955 17.778* 1.546 3.6 2.363 1.650 5.918

Analysis of Economic Liberalization and Telecommunication Sector Performance in Nigeria
9
Vol. IV, Issue 6 December 2014
Note: Critical values of at 5% and 1% levels are 5.99 and 9.21 respectively. * denotes the rejection of normality assumption at both 5% and 1% levels.
Estimated Correlation Matrix of Variables
For the purpose of analyzing the relationship between variables employed in
this study, the correlation matrix of data series is also computed. Estimation
of correlation matrix for variables becomes important in an attempt to
establish whether there is a linear dependence between variable and to
know whether variables are moving in the same or opposite direction. Table
4.2 shows that a positive correlation exists between most of the variables
employed for the study. Since correlation coefficient always lies between -1
and +1, a positive correlation indicates that variables in question move in the
same direction, while a negative correlation implies that they move in
opposite direction.
Table 4. 2: Estimated Correlation Matrix of Variables
VARIABLES PEN EMPS COMP GDP POP URPOP RGDP
PENT 1.000
SEMP -0.175 1.000
COMP 0.843
-0.539 1.000
GDP 0.956 -0.399 0.952 1.000
POP 0.779 -0.717 0.946 0.913 1.000
URPOP 0.801
-0.691 0.956 0.928 0.999 1.000
RGDP 0.889
-0.465 0.961 0.974 0.921 0.933 1.000
Probability 0.228 0.000 0.462 0.2 0.307 0.438 0.051
Obs. 25 25 25 25 25 25 25

Analysis of Economic Liberalization and Telecommunication Sector Performance in Nigeria
10
Vol. IV, Issue 6 December 2014
Time Series Properties of Variables (Unit Root Tests)
Recently, the issue of testing for the stationarity of data series in empirical
research has been accorded great importance. This becomes necessary so as
to know whether variables are stationary in levels or in first difference.
Knowledge of the time series properties of data series becomes crucial in the
light of the recent innovation in econometric indicating that most economic
data are not stationary in level and could adequately be represent by unit
root. When time series are stationary in their levels, they are denoted as I(0)
series. Non-stationary series that are integrated of order 1 are denoted as I(1)
and the level of such variables can become arbitrarily large or small so that
there is no tendency for them to revert to their mean level. Test for
stationarity of variables is therefore known as the unit root test. Carrying out
a unit root test in this study becomes crucial since studies have shown that
regression of one variable on another without knowing their time-series
properties could yield spurious result.
In testing for the stationarity of variables, both the Augment-Dickey
Fuller test and Philip-Perron unit root tests were adopted. The null
hypothesis formulated using both test statistics is that the variable in
question has a unit root. Given the limited number of observation of data
used, 1 lag is adopted under the Augmented Dickey Fuller test while 2 lags
were specified for the Philip-Perron test.
Table 4.3 shows that the null hypothesis that the variables are of
unit root cannot be rejected for four out of the six variables while the
hypothesis is rejected for only two variables. This implies that four variables
(PEN, COMP, GDP, POP) out of the four variables to be used in the analysis
of the effect of liberalization of telecommunication sector on performance in
Nigeria are of unit root while only two variables (SEMP and URPOP) are
stationary in level.
Given that the system of variables in our study is made of different
order of integration, this study employs the Dynamic Ordinary Least
Squares (DOLS) estimation technique in the analysis of the impact
economic liberalization on the performance of the telecommunication
sector in Nigeria. The DOLS technique involves the inclusion of leads and
lags of differenced explanatory variables in the long-run model and corrects
for simultaneity bias and small sample bias among regressors (Stock and

Analysis of Economic Liberalization and Telecommunication Sector Performance in Nigeria
11
Vol. IV, Issue 6 December 2014
Watson, 1993). The DOLS estimates have also been proved to be more
robust relative to the conventional error correction modeling (ECM).
Table 4. 3: Unit Roots (Augment-Dickey Fuller and Philip-Perron unit root
tests)
Variables ADF*(1lag) With constant with constant No trend and trend
PP*(2 lags) With constant with constant
No trend and trend
D
Pen ∆pen
- 2.2103 -1.7537 -3.3130* -4.7279*
-2.3376 -2.8435 -3.9563* -.9621*
I(1) I(0)
Emps ∆emps
-3.0166 * -3.6502* -3.7344* -3.9451*
-3.0320* -3.6655* -4.2298* -3.9392*
I(0) I(0)
Comp ∆comp
0.7066 -1.8263 -2.7677 ** -3.7272*
1.5868 -1.5800 -2.7297** -3.3178**
I(1) I(0)
Gdp ∆gdp
-1.9378 -1.2525 -3.1756* -3.9500*
-2.4955 -1.2560 -4.2149* -4.7863*
I(1) I(0)
Pop ∆pop
-0.8639 -4.4687 -2.6457 ** -3.4324**
-2.8642 -1.0605 -2.7952** -3.4368**
I(1) I(0)
Urpop ∆urpop
-4.3986* -5.0873* -5.1517* -6.6729*
-5.9522* -6.2008* -6.4482* -6.4789*
I(0) I(0)
Rgdp ∆rgdp
0.1608 -2.0703 -4.5446* -4.6014*
-0.3981 -2.1739 -6.6082 * -6.8843*
I(1) I(0)
Critical value @5% Level
1st Diff.
-2.9969 -3.6219 -3.3019 -3.6330
-2.9907 -3.6118 -2.9969 -3.6219
@10% Level 1st Diff.
-2.6381 -3.2474 -2.6417 -3.2535
-2.6348 -3.2418 -2.6381 -3.2474
Notes: ADF, PP and d denote Augmented Dickey Fuller, Philips-Perron test and decision about the order of integration, respectively. *(**) indicate statistical significance at 5% and 10% respectively.
The Impact Economic Liberalization on the Performance of
Telecommunication Sector in Nigeria
For the purpose of analyzing the impact of economic liberalization on the
performance of the telecommunication sector in Nigeria. The section
adopts the Stock and Watson’s DOLS technique. Since the sample of data
used in this study is small, the specified model is estimated by including j=±1
leads and lags of all the variables. Moreover, since two variables capturing
penetration rate (PEN) and employee per telecom subscribers are used as
measures of performance in the study, two models with different dependent
variables (PEN and EMPS) are estimated. Table 4.4 and 4.5 show the over-

Analysis of Economic Liberalization and Telecommunication Sector Performance in Nigeria
12
Vol. IV, Issue 6 December 2014
parameterized Stock and Watson’s DOLS estimation which include the
leads and lags of the differenced variables.
Table 4. 4: Overparameterised DOLS Estimation (Dependent Variable PEN)
Dependent variable is PEN ( 22 observations used for estimation from 1988 to 2009)
Regressor Coefficient Standard Error T-Ratio[Prob]
C 40.7742 212.7603 .19164[.853]
COM .021918 .24602 .089090[.931]
GDP .2569E-5 .7622E-6 3.3703[.010]
POP 1.7994 4.1946 .42899[.679]
URPOP .79227 5.7674 .13737[.894]
DCOMP(-1) .14666 .29731 .49328[.635]
DCOMP(+1) .20922 .30176 .69333[.508]
DGDP(-1) -.7254E-6 .6819E-6 -1.0638[.318]
DGDP(+1) .6212E-6 .6009E-6 1.0339[.331]
DPOP(-1) 11.7738 31.9175 .36888[.722]
DPOP(+1) -47.1611 33.2218 -1.4196[.193]
DURPOP(-1) -86.1735 50.1352 -1.7188[.124]
DURPOP(+1) -13.8557 37.8255 -.36631[.724]
LIBDUM 1.8164 2.5101 .72363[.490]
R-Squared .97774 R-Bar-Squared .97407 S.E. of Regression 1.2074 F-stat. F( 13, 8) 271.5719[.000] Mean of Dependent Variable 8.5650 S.D. of Dependent Variable 15.6728 Residual Sum of Squares 11.6624 Equation Log-likelihood -24.2353 Akaike Info. Criterion -38.2353 Schwarz Bayesian Criterion -45.8726 DW-statistic 2.0186
Diagnostic Tests: (i) Breusch-Godfrey LM test: F=2.306(p-value =0.173) (ii) Ramsey Reset test: F=3.247(p-value =0.178)

Analysis of Economic Liberalization and Telecommunication Sector Performance in Nigeria
13
Vol. IV, Issue 6 December 2014
In order to obtain parsimonious models from the estimated model
reported in Table 4.4 and 4.5, the p-value criteria is used in variable deletion
process and the insignificant leads and lags were dropped and the
parsimonious DOLS estimations are reported in Table 4.6 and 4.7. Since
the stability of a regression model is very important and could be
interpreted as parameter stability in parametric econometric (Chan and Lee,
1979), the stability of the estimated parsimonious models are further tested
using CUSUM of recursive residual and CUSUM of squares of residuals.
These CUSUMS are presented in Figures 4.1 to 4.4
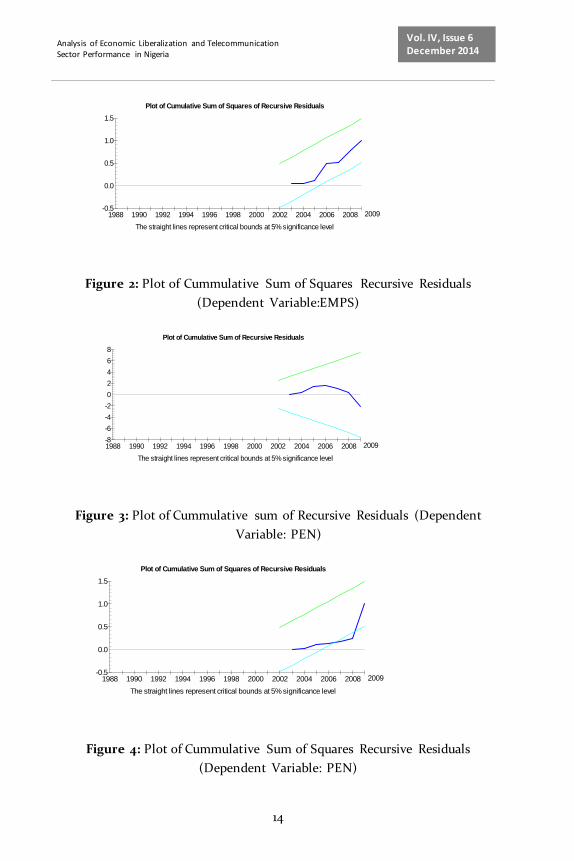
A proper look at the CUSUMs for the Parsimonious EMPS and PEN
models (figures 4.1- 4.4) indicates that the SEMP model is more stable than
the PEN model . This is indicated by the CUSUM of squares residuals for
PEN which wanders slightly beyond its confidence interval. A proper look at
the CUSUMs for the Parsimonious EMPS and PEN models (figures 4.1- 4.4)
indicates that the SEMP model is more stable than the PEN model. This is
indicated by the CUSUM of squares residuals for PEN which wanders
slightly beyond its confidence interval.
Figure 1: Plot of Cummulative Sum of Recursive Residuals (Dependent
Variable: EMPS)
Plot of Cumulative Sum of Recursive Residuals
The straight lines represent critical bounds at 5% significance level
-2
-4
-6
-8
0
2
4
6
8
1988 1990 1992 1994 1996 1998 2000 2002 2004 2006 2008 2009
Analysis of Economic Liberalization and Telecommunication Sector Performance in Nigeria
14
Vol. IV, Issue 6 December 2014
Figure 2: Plot of Cummulative Sum of Squares Recursive Residuals
(Dependent Variable:EMPS)
Figure 3: Plot of Cummulative sum of Recursive Residuals (Dependent
Variable: PEN)
Figure 4: Plot of Cummulative Sum of Squares Recursive Residuals
(Dependent Variable: PEN)
Plot of Cumulative Sum of Squares of Recursive Residuals
The straight lines represent critical bounds at 5% significance level
-0.5
0.0
0.5
1.0
1.5
1988 1990 1992 1994 1996 1998 2000 2002 2004 2006 2008 2009
Plot of Cumulative Sum of Recursive Residuals
The straight lines represent critical bounds at 5% significance level
-2
-4
-6
-8
0
2
4
6
8
1988 1990 1992 1994 1996 1998 2000 2002 2004 2006 2008 2009
Plot of Cumulative Sum of Squares of Recursive Residuals
The straight lines represent critical bounds at 5% significance level
-0.5
0.0
0.5
1.0
1.5
1988 1990 1992 1994 1996 1998 2000 2002 2004 2006 2008 2009

Analysis of Economic Liberalization and Telecommunication Sector Performance in Nigeria
15
Vol. IV, Issue 6 December 2014
The instability of PEN can also be checked informally by noting that
some of the parameters of the PEN model (table 4.6) are rather large. In the
light of this discovery, the analysis of the impact of economic liberalization
on the performance of the telecommunication sector in Nigeria is based on
the analysis of the EMPS model (table 4.7).
Table 4.5: Overparameterised DOLS Estimation (Dependent Variable
EMPS)
Dependent variable is EMPS ( 22 observations used for estimation from 1988 to 2009)
Regressor Coefficient Standard Error T-Ratio[Prob]
C .30238 .53649 .56362[.588]
COM .8510E-5 .6204E-3 .01372[.989]
GDP .1190E-8 .1922E-8 .61923[.553]
POP .005886 .010577 .55648[.593]
URPOP .015609 .014543 1.0733[.314]
DCOMP(-1) .1302E-3 .7497E-3 .17363[.866]
DCOMP(+1) .4560E-3 .7609E-3 .10994[.915]
DGDP(-1) .1890E-9 .1720E-8 .10994[.915]
DGDP(+1) .1099E- .1515E-8 .72563[.489]
DPOP(-1) .10234 .080483 1.2716[.239]
DPOP(+1) .091982 .083772 1.0980[.304]
DURPOP(-1) -.23510 .12642 -1.8597[.100]
DURPOP(+1) - .21125 .095381 -2.2148[.058]
LIBDUM .00805 .006329 1.2710[.239]
R-Squared .98124 R-Bar-Squared .98700 S.E. of Regression .0030446
F-stat. F( 13, 8) 69.6185[.000] Mean of Dependent Variable .032818 S.D. of Dependent Variable .020075 Residual Sum of Squares .7415E-4 Equation Log-likelihood 107.3878 Akaike Info. Criterion 93.3878

Analysis of Economic Liberalization and Telecommunication Sector Performance in Nigeria
16
Vol. IV, Issue 6 December 2014
Schwarz Bayesian Criterion 85.7505 DW-statistic 1.9051
Diagnostic Tests: (i) Breusch-Godfrey LM test: F=1.0226(p-value =0.346) (ii)
Ramsey Reset test: F=2.3435(p-value =0.154)
Table 4.7, indicates that the R-squared and adjusted R2 squares are
over 98 percent. This indicates that more than 98 percent variation in
performance (proxied by employee per telecom subscribers) is explained by
various explanatory variables included in the model . The implication of high
value of the coefficient of multiple determinations is that the model has a
good fit. The F-statistics of 160.7 (p-value =0.00) is statistically significant at
the 1% level indicating that explanatory variables are jointly significant in
influencing EMPS (a variable capturing the performance of the
telecommunication industry in Nigeria). Moreover, the residual sum of
square (RSS) of approximately 0.001 indicates that the model is efficient
while the Durbin-Watson statistic of approximately 2 means that the model
is free from the problem of serial correlation. This is also confirmed by the
F-version of Breusch-Godfrey Lagrange Multiplier test test of 1.704 (p-value
= 0.176). The Ramsey RESET test statistic of 1.432 (p-value =0.253) suggests
that the model is not mis-specified.
Table 4.6: Parsimonious DOLS Estimation (Dependent Variable PEN)
Dependent variable is EMPS ( 22 observations used for estimation from 1988 to 2009)
Regressor Coefficient Standard Error T-Ratio[Prob]
C 141.4045 33.4469 .2277[.001]
COM .020952 .15641 .13396[.896]
GDP .2196E-5 .2659E-6 8.2603[.000]
URPOP 1.7244 .49002 3.5190[.004]
DCOMP(-1) .31524 .21688 1.4535[.172]
DCOMP(+1) .42599 .24444 1.7427[.107]

Analysis of Economic Liberalization and Telecommunication Sector Performance in Nigeria
17
Vol. IV, Issue 6 December 2014
DGDP(-1) .9466E-9 .6050E-6 .0015647[.999]
DPOP(+1) -69.7724 26.1461 -2.6686[.020]
DURPOP(+1) -14.1597 28.7011 .49335[.631]
LIBDUM 1.2952 1.7904 .72341[.483]
R-Squared .98640 R-Bar-Squared .98370 S.E. of Regression 1.2439
F-stat. F( 9, 12) 369.1173[.000] Mean of Dependent Variable 8.5650 S.D. of Dependent Variable 15.6728 Residual Sum of Squares 8.5660 Equation Log-likelihood -29.3499 Akaike Info. Criterion -39.3499 Schwarz Bayesian Criterion -44.8051 DW-statistic 2.0505
Diagnostic Tests: (i) Breusch-Godfrey LM test : F=1.962(p-value =0.248)( ii)
Ramsey Reset test: F=2.8164(p-value =0.121)
In examining the parameter of the estimated model, table 4.7 shows
that a positive relationship exists between performance in Nigerian
Telecommunication sector and competition. This implies that as the level of
competition in the telecom sector increases, performance measured by the
number of subscriber per employees also increases. This relationship is not
only positive but also statistically significant at 10 percent level (t-value
=2.0654). Table 4.7 further reveals that Gross Domestic Product entered
with expected coefficient, suggesting that higher levels of income are
associated with the increased performance in telecommunication sector
which also shows that a positive relationship exist between gross domestic
product(GDP) and performance. This relationship is also statistically
significant at 1 percent level(t-value= 5.8575). The implication of this is that
an increase in income among substantial number of population will lead to
increase in the number of telephone subscribers. This trend will also lead to
increase in demand for telecommunication accessories thereby improving
the performance of the Telecommunication sector
Another explanatory variable included in the regression model is
the urban population. The urban population refers to number of people in
the urban areas. The increasing demand for white collar jobs in cities, and
the declining drive for agriculture have led to massive rural-urban migration
and large population of cities. Given this phenomenon, the study also
examines the relationship between urban population and telecom sector

Analysis of Economic Liberalization and Telecommunication Sector Performance in Nigeria
18
Vol. IV, Issue 6 December 2014
performance. Table 4.7 also reveals that a positive and significant
relationship exist between urban population growth and performance of the
telecommunication sector in Nigeria.
Table 4.7: Parsimonious DOLS Estimation (Dependent Variable EMPS)
Dependent variable is EMPS ( 22 observations used for estimation from 1988
to 2009)
Regressor Coefficient Standard Error T-Ratio[Prob]
C .18715 .057137 3.2754[.006]
COM .5254E-3 .2544E-3 2.0654[.058]
GDP .0077416 .0018100 4.2771[.001]
URPOP .0077416 .0018100 4.2771[.001]
DPOP(+1) .10976 .045397 2.4178[.030]
DURPOP(-1) .22498 071481 3.1474[.007]
DURPOP(+1) - .20785 .056891 3.6534[.003]
LIBDUM .0059578 .0012840 4.6400[.000]
R-Squared .98771 R-Bar-Squared .98156 S.E. of Regression
.0027258 F-stat. F( 7, 14) 160.7202[.000] Mean of Dependent Variable .032818 S.D. of Dependent Variable .020075 Residual Sum of Squares .1040E-3 Equation Log-likelihood 103.6648 Akaike Info. Criterion 95.6648 Schwarz Bayesian Criterion 91.3006 DW-statistic 1.7929
Diagnostic Tests: (i) Breusch-Godfrey LM test: F=1.7042(p-value =0.176) (ii)
Ramsey Reset test: F=1.4320(p-value =0.253)s
With respect to the impact of economic liberalization on the
performance of the telecommunication sector, we focus on the dummy
variable (LIDUM) in our estimated DOLS model . The sign and the
significance of this dummy variable is the main determinant of the impact of
economic liberation on the performance of the sector under consideration.
Analysis of Economic Liberalization and Telecommunication Sector Performance in Nigeria
19
Vol. IV, Issue 6 December 2014
If the dummy variable is positive and statistically significant, then
economic liberalization has improved the performance of
telecommunication sector in Nigeria. The reverse holds if the variable is
negative or insignificant in the regression model. Table 7 shows that the
parameter and the coefficient of the dummy variable (LIDUM) is positive
and statistically significant at 1 percent level (t=4.6400, p-value=0.000). The
implication of this result is that the liberalization of the telecommunication
sector since 2001 has brought about significant improvement in the
telecommunication sector. This result is also corroborated if the variable
COMP is used as a proxy for economic liberalization. Prior to the
liberalization of the telecommunication sector in Nigeria, a single
firm(NITEL) which serve as a monopoly dominated the industry, however
with liberalization and privatization of the industry, more telecoms firms
were allowed into the industry in 2001. One immediate effect of
liberalization is that the number of firms in the telecom industry increased
from one to four and the number of telephone service subscribers increased
drastically.
Conclusions
The analysis of the impact of economic liberalization on the performance of
telecommunication sector showed that out of the two variables that
captured the performance of telecommunication sector, employee per
telecommunication subscribers is significant and more efficient in
explaining the performance of telecommunication sector. The analysis also
showed that a positive relationship exist between performance in Nigerian
telecommunication sector and competition. This implies that as the number
of operators in telecommunication market increases, performance measured
by the employee per telecommunication subscribers will also increase.
Other variables such as population and urban population were also found to
be statistically significant with telecommunication sector performance. High
rate of population growth in Nigeria and large population of cities have
explained the rapid growth of telecommunication service in Nigeria.
In the light of the above, clear government policy, independent and
effective regulatory policies that attract the necessary investments in
telecommunication sector and thereby continually enhanced network
infrastructure in the sector should be encouraged.

Analysis of Economic Liberalization and Telecommunication Sector Performance in Nigeria
20
Vol. IV, Issue 6 December 2014
The telecommunication sector is capital intensive and , to
continually encourage timely network expansion, improve quality of service
and ensure national coverage in Nigeria, NCC must formulate policies that
ensure attractive operating environment.
References
[1]. Oyedijo, A (2012). Strategic Agility and Competitive Performance in
the Nigerian Telecommunication Industry: An Empirical
Investigation American International . Journal of Contemporary
Research. 2( 3)
[2]. Doumbouya, S . F. and ILEAP (2004) Le Cycle des négociations du
Millénaire : L’Afrique et le commerce international des services de
telecommunications, mimeo
[3]. Fink, C., A. Mattoo, and R. Rathindran. (2003). An assessment of
Telecommunications Reform in Developing Countries. Information
Economics and Policy 15
[4]. Gruber, H. and F. Verboven (2001), The Diffusion of Mobile
Telecommunications Services in the European Union Countries,
European Economic Review, 45(3)
[5]. Gilwald A. (2003): Transforming Telecom Reform for Development
Graduate School of Public and Development Management.
University of Witwatersrand South Africa
[6]. Jha, R., and S.K. Majumdar (1999), A matter of connections: O.E.C.D.
telecommunications sector productivity and the role of cellular
technology diffusion, Information Economics and Policy, 11(3): 243-
269
[7]. Li, W., C. Z. Qiang, and C. L. Xu, (2001), The Political Econo my of
Privatization and Competition: Cross-Country Evidence from the
Telecommunication Sector, mimeo, the World Bank
[8]. Shiu, A. and P.L Lam, (2008). Causal relationship between
telecommunications and economic growth in China and its regions.
Regional Studies, 42, 705–18
[9]. Shirley, M. M. (2001), The Effects of Regulation and Competition on
Telecommunications in Africa, mimeo. Available at
cbdd.wsu.edu/edev/kpi/shirley.

Analysis of Economic Liberalization and Telecommunication Sector Performance in Nigeria
21
Vol. IV, Issue 6 December 2014
[10].Wallsten, S. (2001). An econometric analysis of telecom competition,
privatization and regulation in Africa and Latin America. The Journal
of Industrial Economics, 49(1), 1-19.
[11]. Wallsten, Scott. (2003). Of carts and horses: Regulation and
privatization in telecommunications reforms. Journal of Policy
Reform 6, (4) (12): 217-31,
http://search.ebscohost.com/login.aspx?direct=true&db=bth&AN=1
2930426&site=ehost.
[12]. Wellenius B. (1997): Extending Telecommunications Services to the
Rural Areas-the Chilean Experience. World Bank Viewpoint Note
No. 15
[13]. WTO (1994): General Agreement on Trade in Services and Related
Instruments, Geneva April.
[14].WTO (2004): World Trade Report: Exploring the Linkage between the
Domestic Policy Environment and International Trade. WTO,
Geneva.
[15]. Ros, A. J. (1999). Does Ownership or Competition Matter? The Effects
of Telecommunications Reform on Network Expansion and Efficiency.
Journal of Regulatory Economics 15: 219-244.