Embed Size (px)
Citation preview
Materials Sciences and Applications, 2010, 1, 152-157 doi:10.4236/msa.2010.13024 Published Online August 2010 (http://www.SciRP.org/journal/msa)
Copyright © 2010 SciRes. MSA
Analysis of Density of Sintered Iron Powder Component Using the Response Surface Method
Prasanta Kumar Bardhan1, Suprs Patra2, Goutam Sutradhar3
1Department of Mechanical Engineering, JIS College of Engineering, Kalyani, India; 2Cwiss, IIT Kharagpur, West Bengal, India; 3Department of Mechanical Engineering, Jadavpur University, Kolkata, India. Email: [email protected] Received March 18th, 2010; revised May 14th, 2010; accepted May 26th, 2010.
ABSTRACT
The continued growth of ferrous powder metallurgy in automobile and others engineering application is largely de-pendent on the development of higher density materials and improved mechanical properties. Since density is a pre-dominant factor in the performance of powder metallurgy components, it has been primarily considered for the present investigation. An experimental investigation have been undertaken in order to understand the variation of density with respect to the variation of process parameters viz., compaction load, sinter temperature and sintering time. The relation among the various process parameters with density has been observed. A mathematical model has been developed us-ing second order response surface model (RSM) with central composite design (CCD) considering the above mentioned process parameters. The developed mathematical model would help in predicting the variation in density with the change in the level of different parameters influencing the density variation. This model also can be useful for setting of optimum value of the parameters for achieving the target density. Keywords: Powder Metallurgy, Density, Sintering, Response Surface Model, Central Composite Design
1. Introduction
Growth of ferrous powder metallurgy (P/M) over the past few decades has been outstanding as this technology is providing itself as an alternate lower process cost to mac- hining, casting, stamping, forging and other similar metal working technologies [1,2]. Along with that it also prov- ides some outstanding advantages such as high material utilization, more refined microstructure that provides su- perior material properties as well as greater microstruc-ture homogeneity. Above all the net shape making proc-ess by this P/M method is a result of material design that provides consistent and minimal shrinkage after sintering from the originally compacted parts [3]. The use of the double press double sintering process is an accepted me- thod for providing higher density parts. A low temperat- ure presintering and a repress step are performed betw- een the first compaction and final sintering steps [4-5]. In P/M process a familiar method is double compaction and double sintering method although this process is well ac- cepted due to achievement of high density samples; how-ever it suffers from high costing which sometimes is not desirable. Another useful method in this regard is single compaction warm compaction process in which powders and tools are heated between 130◦ and 150◦ to achieve
high density product. This method also provides increa- sed green strength and reduced ejection forces [5,6]. To lower the production cost sometimes a relatively easier method is employed for the preparation of the P/M products known as single compaction method where the desirable density can easily be achieved by controlling of sintering temperature and time. As sintering is a predo- minant factor for controlling the density of the P/M sam-ples, variation of sintering time, temperature largely aff- ects the density of the P/M components [7-11]. In some cases a steam treatment or other secondary operations are necessary to meet specific usage requirement. In another version of the P/M process, powder are pressed to a pre-form and hot forged immediately after sintering (Powder Forge-P/F process). The powder forged parts are compa-rable to conventional forged steel parts. P/M process pro- duce 95-98% of full density compare to P/F process wh- ich produces 100% density [3].
The effects of different types of powder on density, age hardening on the pore closure and hardness of sintered iron and iron copper alloy have also been studied. The ef- fect of compaction pressure and powder particle size on the pore structure and hardness of steam oxidized sint- ered iron have also been investigated [9]. When an imp-
Analysis of Density of Sintered Iron Powder Component Using the Response Surface Method 153
ermeable ferrous product is desirable, the sintered parts of high density can be steam treated to close the surface pores. It is also observed that the green density and sint- ered density is a function of powder type and compaction pressure [9].
Albeit, a large number of experimental investigations have been carried out, only few of them substantiated their observations with a theoretical model. However, present day industrial application demands comprehen-sive theoretical simulation before actual design. Consid-ering these aspects we provided a theoretical model ba- sed on our experimental results. Present study examines the variation of density (R1) as a function of process par- ameters (compactionload x1, sintering temperature x2, and sintering time x3) of sintered iron P/M components. The samples were produced by changing the process parame- ters as per the design of experiment (DOE) and the resp- onse surface methodology (RSM) has been used to plan and analyze the density. The experimental plan adopts the face-centered central composite design (CCD). A second order response surface model (RSM) has been used to develop a predicting equation of density based on the data collected by a statistical design of experiments [12-14]. The analysis of variation (ANOVA) shows that the observed data fits well into the assumed second order RSM model. It is worth mentioning that this model is one of the most widely used methods to solve the optimiza- tion problem in manufacturing technology [10]. In the experiment, porosity of the samples, compacted and sin-tered under different conditions were investigated by the optical microscope [7]. It is found that porosity of the samples decreases with the increase of compaction load, sintering temperature and sintering time.
2. Experimental Procedures
The iron powder used in the present study was supplied by Kawasaki Steel Corporation Chiba Works, chiba, Ja-pan. The said company has clarified chemical analysis and particle size distribution of the above powder mate-rial. The data has shown in Tables 1 and 2.
The iron powder was compacted in a closed cylindri-cal die using 120 Ton hydraulic press (Lawrence & Ma- yo) for green stage product. During compaction, the die was lubricated with Zn-stearate. The sintering process was carried out in a vacuum furnace of capacity (1450˚C)
Table 1. Chemical Analysis of iron powder (weight%)
C Si Mn P S O Fe
0.001 0.02 0 .17 0.013 0.010 0.129 Balance
Table 2. Powder Properties. Apparent Density (gm/cc): 2.94; Flow (s/50gm): 24.7. Sieve Distribution
Sieve Number Size Cumulative wt%
+100# +150# +200# +250# +325# –325#
> 150 um > 106 um > 75 um > 63 um > 45 um < 45 um
8.5 20.1 22.9 9.5
16.8 22.2
using argon as an inert gas.
One of the major objectives of present investigations is to shade light on the density of the compacted sintered sa- mples. In this context 60 different P/M components (dia- 25 mm) were produced according to design of experi-ment (DOE). Related density (R1) of these samples were measured by hydrostatic weighing method against the va- riation of controllable process variables like compaction load (x1), sintering time (x3) and sintering temperature (x2). The results obtained through the experiments are given in Tables 3 and 4 and the available data have been analyzed by response surface method using Minitab sof- tware (version 14).
From the results of ANOVA a mathematical model has been proposed for the evaluation of density, RCCD
(Density) of the powder metallurgy components. The proposed model is expressed as
RCCD (Density) = – 0.820967 + 0.218738 x1
+ 0.008407x2 – 0.571286 x3 + 0.007148x1
2 – 0.000002x22
+ 0.064705x32 – 0.000333x1x2
– 0.020574x1x3 + 0.000767x2x3
3. Results and Discussion
In the present study iron powders, sintered at various tem- perature and time are investigated. The samples are co- mpacted under different load range (14.6 ton-29.49 ton) according to the design of experiment (DOE).
Table 3. Symbols, levels and values of process parameters
Symbols Levels Process parameters
(Independent variables) Actual Coded Actual Coded
Compaction load (Ton) z1 x1 17.66 20.075 26.4 9 –1 0 +1
Sintering temperature (℃ ) z2 x2 975 1050 1125 –1 0 +1
Sintering time ( hrs) z3 x3 1 1.5 2 –1 0 +1
Copyright © 2010 SciRes. MSA
Analysis of Density of Sintered Iron Powder Component Using the Response Surface Method 154
Table 4. Observed Density—values for different settings of process parameters based on 23 full factorial design
Coded Value of Parameters Actual Value of Parameters Response variables R1Sl. No. x1 x2 x3 Compaction load. (Ton) Sintering. Temp. (℃) Sintering. Time (Hrs.) Density (g/cm3)
1 –1 –1 –1 17.66 975 1 6.07
2 1 –1 –1 26.49 975 1 7.78
3 –1 1 –1 17.66 1125 1 6.00
4 1 1 –1 26.49 1125 1 6.87
5 –1 –1 1 17.66 975 2 6.07
6 1 –1 1 26.49 975 2 7.78
7 –1 1 1 17.66 1125 2 6.00
8 1 1 1 26.49 1125 2 6.74
9 –1.6818 0 0 14.65 1050 1.5 5.94
10 1.6818 0 0 29.50 1050 1.5 7.84
11 0 –1.6818 0 22.08 923.87 1.5 6.46
12 0 1.6818 0 22.08 1176.13 1.5 6.39
13 0 0 –1.6818 22.08 1050 0.659 6.38
14 0 0 1.6818 22.08 1050 2.341 6.53
15 0 0 0 22.08 1050 1.5 6.38
16 0 0 0 22.08 1050 1.5 6.50
17 0 0 0 22.08 1050 1.5 6.50
18 0 0 0 22.08 1050 1.5 6.60
19 0 0 0 22.08 1050 1.5 6.50
20 0 0 0 22.08 1050 1.5 6.50
21 –1 –1 –1 17.66 975 1 6.07
22 1 –1 –1 26.49 975 1 7.93
23 –1 1 –1 17.66 1125 1 6.00
24 1 1 –1 26.49 1125 1 7.75
25 –1 –1 1 17.66 975 2 6.15
26 1 –1 1 26.49 975 2 7.79
27 –1 1 1 17.66 1125 2 6.00
28 1 1 1 26.49 1125 2 7.74
29 –1.6818 0 0 14.65 1050 1.5 5.89
30 1.6818 0 0 29.50 1050 1.5 8.04
31 0 –1.6818 0 22.08 923.87 1.5 6.38
32 0 1.6818 0 22.08 1176.13 1.5 6.39
33 0 0 –1.6818 22.08 1050 0.659 6.38
34 0 0 1.6818 22.08 1050 2.341 6.53
35 0 0 0 22.08 1050 1.5 6.38
36 0 0 0 22.08 1050 1.5 6.50
37 0 0 0 22.08 1050 1.5 6.50
38 0 0 0 22.08 1050 1.5 6.50
39 0 0 0 22.08 1050 1.5 6.50
40 0 0 0 22.08 1050 1.5 6.50
41 –1 –1 –1 17.66 975 1 6.07
42 1 –1 –1 26.49 975 1 8.02
43 –1 1 –1 17.66 1125 1 6.00
44 1 1 –1 26.49 1125 1 7.79
45 –1 –1 1 17.66 975 2 6.15
46 1 –1 1 26.49 975 2 7.79.
47 –1 1 1 17.66 1125 2 6.00
48 1 1 1 26.49 1125 2 7.77
49 –1.6818 0 0 14.65 1050 1.5 6.06
50 1.6818 0 0 29.500 1050 1.5 7.79
51 0 –1.6818 0 22.08 923.87 1.5 6.38
Copyright © 2010 SciRes. MSA
Analysis of Density of Sintered Iron Powder Component Using the Response Surface Method
Copyright © 2010 SciRes. MSA
155
Table 1 continued
52 0 1.6818 0 22.08 1176.13 1.5 6.39 53 0 0 –1.6818 22.08 1050 0.659 6.38 54 0 0 1.6818 22.08 1050 2.341 6.53 55 0 0 0 22.08 1050 1.5 6.38 56 0 0 0 22.08 1050 1.5 6.50 57 0 0 0 22.08 1050 1.5 6.50 58 0 0 0 22.08 1050 1.5 6.50 59 0 0 0 22.08 1050 1.5 6.50 60 0 0 0 22.08 1050 1.5 6.50
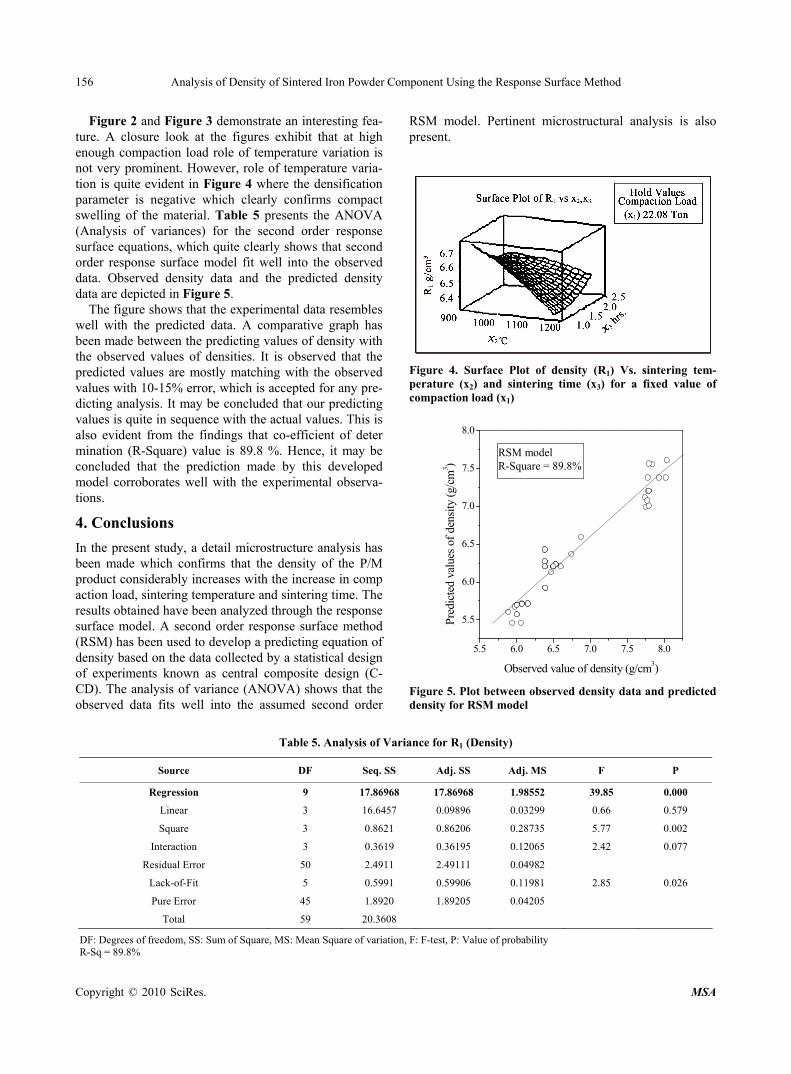
Figure 1 shows the microstructures of P/M samples
sintered at fixed temperature (1050˚C) and for fixed sin-tering time (1.5 hrs.) under different compaction load. The white portion of the figure indicates iron grains and the black portions indicate porous area of the specimen. From the figure it is quite evident that with gradual incr- ease of compaction load the porosity of the samples gr- adually decreases. Similar behavior is also observed with the variation of sintering time and sinter temperature, the porosity changes (not shown in figure). Decrease in poro- sity would increase the density. That phenomenon actua- lly reflected in the Figure 2.
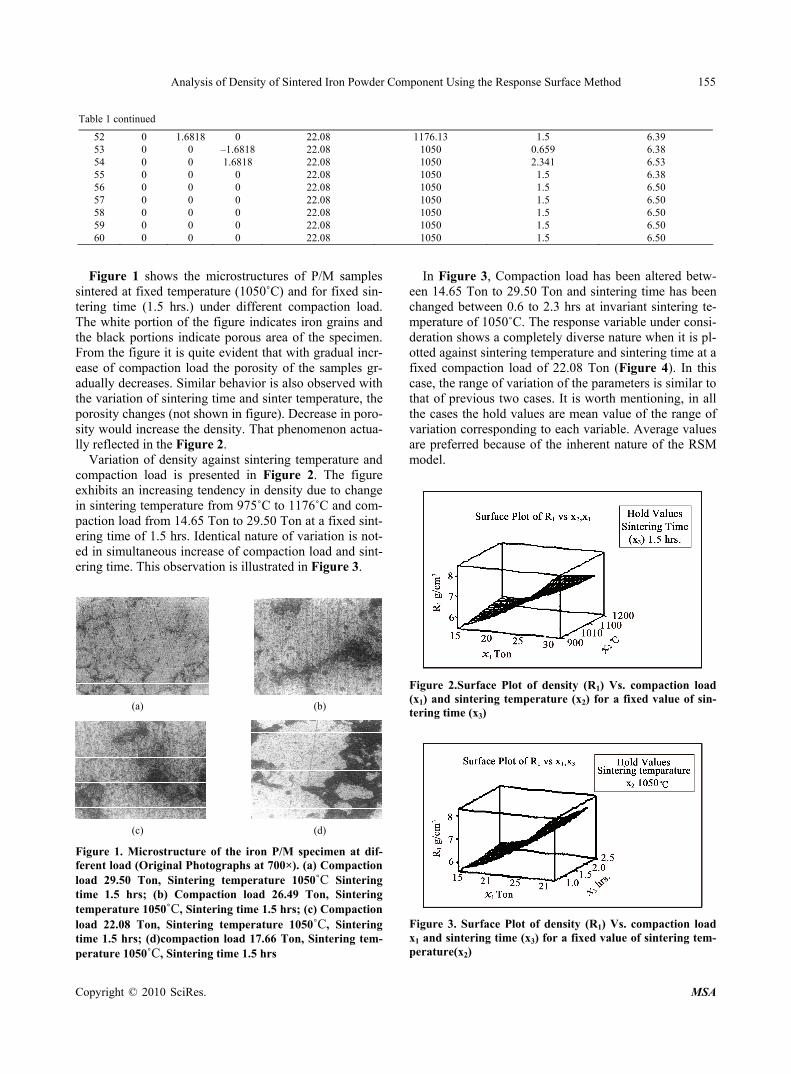
In Figure 3, Compaction load has been altered betw- een 14.65 Ton to 29.50 Ton and sintering time has been changed between 0.6 to 2.3 hrs at invariant sintering te- mperature of 1050˚C. The response variable under consi- deration shows a completely diverse nature when it is pl- otted against sintering temperature and sintering time at a fixed compaction load of 22.08 Ton (Figure 4). In this case, the range of variation of the parameters is similar to that of previous two cases. It is worth mentioning, in all the cases the hold values are mean value of the range of variation corresponding to each variable. Average values are preferred because of the inherent nature of the RSM model. Variation of density against sintering temperature and
compaction load is presented in Figure 2. The figure exhibits an increasing tendency in density due to change in sintering temperature from 975˚C to 1176˚C and com- paction load from 14.65 Ton to 29.50 Ton at a fixed sint- ering time of 1.5 hrs. Identical nature of variation is not- ed in simultaneous increase of compaction load and sint- ering time. This observation is illustrated in Figure 3.
Figure 2.Surface Plot of density (R1) Vs. compaction load (x1) and sintering temperature (x2) for a fixed value of sin-tering time (x3)
(a) (b)
(c) (d)
Figure 1. Microstructure of the iron P/M specimen at dif-ferent load (Original Photographs at 700×). (a) Compaction load 29.50 Ton, Sintering temperature 1050˚C Sintering time 1.5 hrs; (b) Compaction load 26.49 Ton, Sintering temperature 1050˚C, Sintering time 1.5 hrs; (c) Compaction load 22.08 Ton, Sintering temperature 1050˚C, Sintering time 1.5 hrs; (d)compaction load 17.66 Ton, Sintering tem-perature 1050˚C, Sintering time 1.5 hrs
Figure 3. Surface Plot of density (R1) Vs. compaction load x1 and sintering time (x3) for a fixed value of sintering tem-perature(x2)
Analysis of Density of Sintered Iron Powder Component Using the Response Surface Method 156
Figure 2 and Figure 3 demonstrate an interesting fea-ture. A closure look at the figures exhibit that at high enough compaction load role of temperature variation is not very prominent. However, role of temperature varia-tion is quite evident in Figure 4 where the densification parameter is negative which clearly confirms compact swelling of the material. Table 5 presents the ANOVA (Analysis of variances) for the second order response surface equations, which quite clearly shows that second order response surface model fit well into the observed data. Observed density data and the predicted density data are depicted in Figure 5.
The figure shows that the experimental data resembles well with the predicted data. A comparative graph has been made between the predicting values of density with the observed values of densities. It is observed that the predicted values are mostly matching with the observed values with 10-15% error, which is accepted for any pre-dicting analysis. It may be concluded that our predicting values is quite in sequence with the actual values. This is also evident from the findings that co-efficient of deter mination (R-Square) value is 89.8 %. Hence, it may be concluded that the prediction made by this developed model corroborates well with the experimental observa-tions.
4. Conclusions
In the present study, a detail microstructure analysis has been made which confirms that the density of the P/M product considerably increases with the increase in comp action load, sintering temperature and sintering time. The results obtained have been analyzed through the response surface model. A second order response surface method (RSM) has been used to develop a predicting equation of density based on the data collected by a statistical design of experiments known as central composite design (C- CD). The analysis of variance (ANOVA) shows that the observed data fits well into the assumed second order
RSM model. Pertinent microstructural analysis is also present.
Figure 4. Surface Plot of density (R1) Vs. sintering tem-perature (x2) and sintering time (x3) for a fixed value of compaction load (x1)
5.5 6.0 6.5 7.0 7.5 8.0
5.5
6.0
6.5
7.0
7.5
8.0
RSM modelR-Square=89.8%
Pred
icte
d va
lues
of
dens
ity (
g/cm
3 )
Observed value of density (g/cm3)
RSM model R-Square = 89.8%
Figure 5. Plot between observed density data and predicted density for RSM model
Table 5. Analysis of Variance for R1 (Density)
Source DF Seq. SS Adj. SS Adj. MS F P
Regression 9 17.86968 17.86968 1.98552 39.85 0.000
Linear 3 16.6457 0.09896 0.03299 0.66 0.579
Square 3 0.8621 0.86206 0.28735 5.77 0.002
Interaction 3 0.3619 0.36195 0.12065 2.42 0.077
Residual Error 50 2.4911 2.49111 0.04982
Lack-of-Fit 5 0.5991 0.59906 0.11981 2.85 0.026
Pure Error 45 1.8920 1.89205 0.04205
Total 59 20.3608
DF: Degrees of freedom, SS: Sum of Square, MS: Mean Square of variation, F: F-test, P: Value of probability R-Sq = 89.8%
Copyright © 2010 SciRes. MSA
Analysis of Density of Sintered Iron Powder Component Using the Response Surface Method 157
7. Acknowledgements
Authors are very much grateful to All India Council For Technical Education, New Delhi [F. No. 8021 /RID/ NPROJ/R&D-174/2002-03/ (Revalidated 2003-2004) for funding this Project. Authors also like to acknowledge their sincere thanks to M/S Kawasaki Steel Corporation Chiba Works, Chiba, Japan for sending 4 Kg iron Pow-der along with the certificate of chemical analysis free of cost for this study. Authors also acknowledge the facili-ties received from the Metal Forming Laboratory, Me-chanical Engineering Department. Jadavpur University, Kolkata, India.
REFERENCES [1] R. M. German, “Powder Metallurgy of Iron and Steel,”
John Willy & Sons, New York, 1998.
[2] G. S. Upadhyaya, “Powder metallurgy Technology,” Cambridge International Science Publishing, Cambridge, 1997.
[3] K. S. Narasimhan, “Recent Advances in Ferrous Powder Metallurgy,” Advanced Performance Materials, Vol. 3, No. 1, 1996, pp. 7-27.
[4] H. Rutz, J. Khanuja and S. Kassam, “Single Compaction to Active High Density in Ferrous P/M Materials in Au-tomatic Applications,” PM2TEC’96 World Congress, Washington, D.C., 1996.
[5] H. G. Rutz and F. G.Hanejko, “The Application of Worm Compaction to High Density Powder, Metallurgy Parts,” PM2TEC’97 International Conference on Powder Met-allurgy & Particulate Materials, Chicago, 1997.
[6] H. G. Rutz and F. G. Hanejko, “High Density Processing of High Performance Ferrous Materials. Advances in Powder Metallurgy and Particulate Materials,” Metal Powder In-
dustries Federation, Princeton, Vol. 5, 1994, p. 117.
[7] L. A. Dobrzanshi, J. Otereba, M. G. Actis and M. Rosso, “Microstructural Characteristics and Mechanical Proper-ties of Ni-Mo-(W) Steels,” Journal of Achievements in Materials and Manufacturing Engineering, Vol. 18, 2006, p. 347.
[8] K. S. Naransimhan, “Sintering of Powder Mixtures and the Growth of Ferrous Powder Metallurgy,” Materials Chemistry and Physics, Vol. 67, No. 1-3, 2001, pp. 56-65.
[9] W.-F. Wang, “Effect of Powder Type and Compaction Pressure on the Density, Hardness and Oxidation Resis-tance of Sintered and Steam Treated Steels,” Journal of Materials Engineering Performance, Vol. 16, No. 5, 2007, pp. 533-538.
[10] K.-Y. Kung, J.-T. Horng and K.-T. Chiang, “Material Removal Rate and Electrode Wear Ratio Study on the Powder Mixed Electrical Discharge Machining of Cobalt-Bonded Tungsten Carbide,” International Journal of Advanced Manufacturing Technology, Vol. 40, No. 1-2, 2009, pp. 95-104.
[11] A. K. Eksi and A. H. Yuzbasioglu, “Effect of Sintering and Pressing Parameters on the Densification of Cold Iso- Statically Pressed Al and Fe Powder,” Materials & De-sign, Vol. 28, No. 4, 2007, pp. 1364-1368.
[12] D. Chatterjee, B. Oraon, G. Sutradhar and P. K. Bose, “Prediction of Hardness for Sintered HSS Components Using Response Surface Method,” Journal of Materials Processing Technology, Vol. 190, No. 1-3, 2007, pp. 123- 129.
[13] G. E. P. Boxes and N. R. Draper, “Emperical Model Building and Response Surfaces,” Wiley, New York, 1987.
[14] D. C. Montgomery, “Design and Analysis of Experiments,” John Wiley & Sons, New York, 1991.
Nomenclature
x1 coded value of Compaction load x2 coded value of Sintering temperature x3 coded value of Sintering time
R1 density of sintered iron component Rccd Predicting equation of density of sintered
iron component z1 actual value of Compaction load
Copyright © 2010 SciRes. MSA


![Powder Metallurgy Titanium and Titanium Alloy Components ......UTS [ksi] YS [ksi] Elon. [%] Fracture Toughness KIC orKC [ ksi.inch½ ] BE Ti‐6Al‐4V Powder CIP/Sintered then Hot](https://img.pdfslide.us/doc/110x75/60bc0717996f9f43f3734681/powder-metallurgy-titanium-and-titanium-alloy-components-uts-ksi-ys-ksi.jpg)