Embed Size (px)
Citation preview

Analysis of data from Real
time experiments
J.M.K. Mulema
Department of Molecular and Cell Biology
University of Cape Town

• Quantifying RNA; Northern blotting, In situ hybridization, RNAse
protection assays, Microarray, RT-PCR.
• Real time PCR
– Data collected throughout the PCR process as it occurs.
– Amplification and detection combined into a single step.
– Reactions characterized by the point in time where the target amplification
is first detected.
– Cycle threshold (Ct), the time at which fluorescent intensity is greater than
background fluorescence.
– Greater starting target DNA, faster significant increase in fluorescent,
lower Ct
– Requires much less RNA template
Introduction
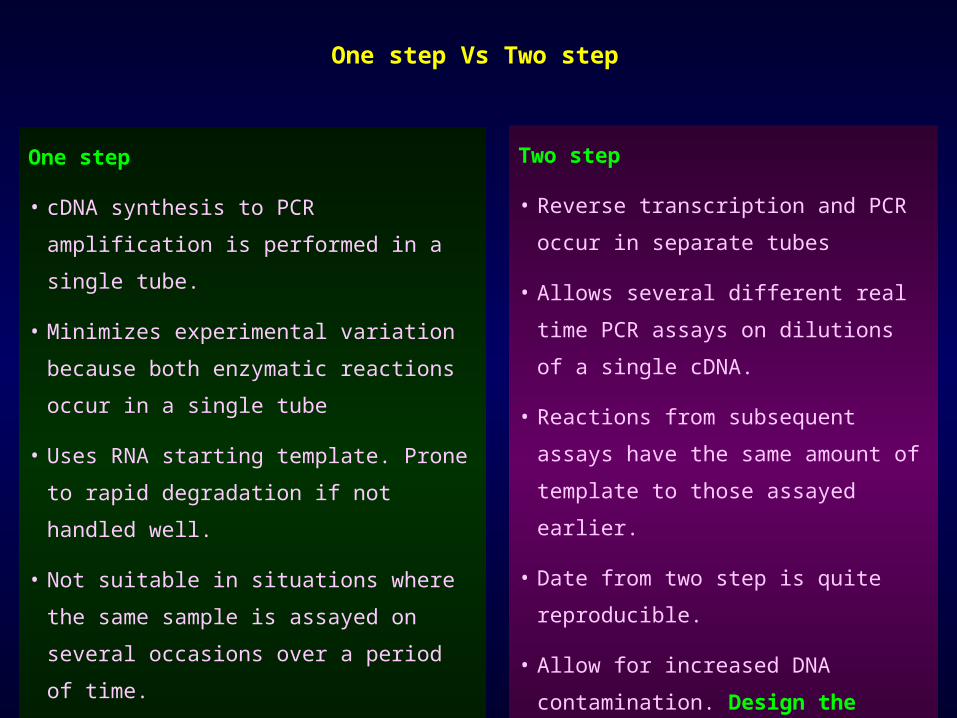
One step Vs Two step
One step
• cDNA synthesis to PCR amplification is
performed in a single tube.
• Minimizes experimental variation
because both enzymatic reactions
occur in a single tube
• Uses RNA starting template. Prone to
rapid degradation if not handled well.
• Not suitable in situations where the
same sample is assayed on several
occasions over a period of time.
• Less sensitive than two step protocols.
Two step
• Reverse transcription and PCR
occur in separate tubes
• Allows several different real time
PCR assays on dilutions of a single
cDNA.
• Reactions from subsequent assays
have the same amount of template
to those assayed earlier.
• Date from two step is quite
reproducible.
• Allow for increased DNA
contamination. Design the target
PCR product to span introns

• Genome sequenced
• A rapid life cycle
• Prolific seed production
• Cultivation in restricted space
• Easily transformed
• Botrytis cinerea (anamorph)
• Botryotinia fuckeliana (teleomorph)
• Ubiquitous
• Chemical control
• Host range
Identify genes that play a
role in resistance

• Arabidopsis leaves infected with B. cinerea
• Extracted RNA from first three replicates
(untreated, 12 hrs pi and 24 hrs pi)
• Made overnight cDNA synthesis
• Used Superscript III reverse transcriptase in a
20µl reaction.
• Diluted the synthesized cDNA 1 in 10
• Designed primers to amplify products ranging
from 70-150 bp
• Amplification optimized with a conventional
PCR before real time.
1. At3g51660 (Macrophage migratory)
2. At4g30270 (MERI-5 protein)
3. At2g47190 (Myb family transcription)
4. At5g39610 (No Apical Meristem)
5. At5g06860 (PGIP1)
6. At4g24340 (Phosphorylase)
7. At5g07010 (Sulfotransferase)
8. At1g22400 (UDP-glucoronosyl)
9. At1g62300 (WRKY)
10. At3g04720 (Hevein-like protein)
11. At3g28930 (avrRpt2-induced protein)
12. At3g50480 (Broad spectrum)
13. At2g24180 (CYP 450)
14. At3g04220 (Disease resistance protein)
15. At1g52200 (Expressed protein)
16. At2g39030 (GCN5-related acetyltransferase)
17. At4g16260 (Glycosyl hydrolase)
18. At4g15610 (Integral membrane protein)
19. At4g33150 (lysine-ketoglutarate)
1. At4g10340 (Chlorophyll A-B)
2. At1g72610 (Germin-like protein)
3. At1g12900 (GAPHD)
4. At5g38430 (RUBSCO)
5. At1g20340 (Plastocyanin)
1. At5g25760 (Ubiquitin-conjugating enzyme)
2. At5g06600 (Ubiquitin-specific protease)
3. At1g04820 (Tubulin alpha 2-alpha 4)
4. At5g44200 (Nuclear cap-binding protein)

• Absolute/Relative quantification
• Used serial diluted standards of
known concentration to generate a
standard curve.
• Standard curve is a linear
relationship between the ct and the
initial amount amounts of RNA or
cDNA.
• This allows the determination of the
concentration of unknowns based on
their ct values
• Assumes that all standards and
samples have equal amplification
efficiencies.
• The concentrations of serial dilutions
should encompass all samples and
stay within the range that can be
quantified
Rep 10 hrs12 hrs pi24 hrs pi
Rep 20 hrs12 hrs pi24 hrs pi
Rep 30 hrs12 hrs pi24 hrs pi
Pooled sample
Dilution 1 (10-1)
Dilution 2 (10-2)
Dilution 3 (10-3)
Generating a standard curve
Carry out runs in triplicates
Source: Celtic Diagnostic


Gene 0hrs R1 12hrs R1 24hrs R1 0hrs R2 12hrs R2 24hrs R2 0hrs R3 12hrs R3 24hrs R3
At3g28930 11.756 81.5393 224.747 5.1133 33.1119 388.9217 8.6277 85.026 106.6237
At3g50480 64.3495 158.3122 179.2381 54.568 70.2542 186.2909 48.3419 101.5222 109.3803
At2g24180 13.7458 55.4771 309.4145 13.5755 33.9872 292.9062 14.5349 77.8196 141.6806
At3g04220 29.3513 93.8687 359.3015 12.8654 29.3513 355.5778 12.2984 168.3563 156.9873
At1g52200 18.0219 111.6761 158.4963 15.463 56.2404 242.5491 14.948 210.0839 168.0951
At2g39030 0.3443 59.346 305.0308 0.3303 32.7631 644.4388 0.2339 58.1566 447.241
At4g16260 0.2982 13.2753 365.5219 0.0909 3.1700 330.4173 0.0922 12.0322 363.5908
At3g04720 4.161 22.9246 372.9041 0.9894 10.1421 316.1588 1.2689 22.79 361.511
At4g15610 2.4848 42.4467 395.1967 2.703 27.3786 302.0836 2.8432 57.5879 260.4722
At4g33150 2.6385 48.3277 269.8711 5.0124 105.9577 137.7378 4.0888 45.0527 294.8066
At3g51660 7.688 71.5792 328.3608 7.9407 56.4595 214.9203 6.4393 109.8782 247.967
At4g30270 12.3045 99.6367 197.8529 22.8425 65.073 185.0064 16.0316 175.1437 319.8013
At2g47190 2.6065 43.7507 325.6823 2.1613 43.8846 315.7555 1.9861 52.0448 333.4451
At5g39610 3.2338 135.7344 293.7087 10.2306 123.9325 909.3652 2.451 212.3385 463.2975
At5g06860 10.4241 62.6886 171.8571 31.3713 39.1112 355.6503 27.1353 112.4979 310.3416
At4g24340 21.4914 27.9686 277.4395 9.145 19.2327 436.6081 13.63 52.4527 301.7165
At5g07010 0.2782 78.6687 261.2367 0.5103 78.1067 250.2366 0.3266 92.4533 203.6362
At1g62300 19.4567 58.0412 334.387 13.6397 42.2785 530.477 17.7916 156.3018 174.7055
At1g22400 17.3066 40.4971 454.7851 11.0579 12.2543 632.0124 10.099 115.3882 250.8585
Upregulated genes
Gene 0hrs R1 12hrs R1 24hrs R1 0hrs R2 12hrs R2 24hrs R2 0hrs R3 12hrs R3 24hrs R3
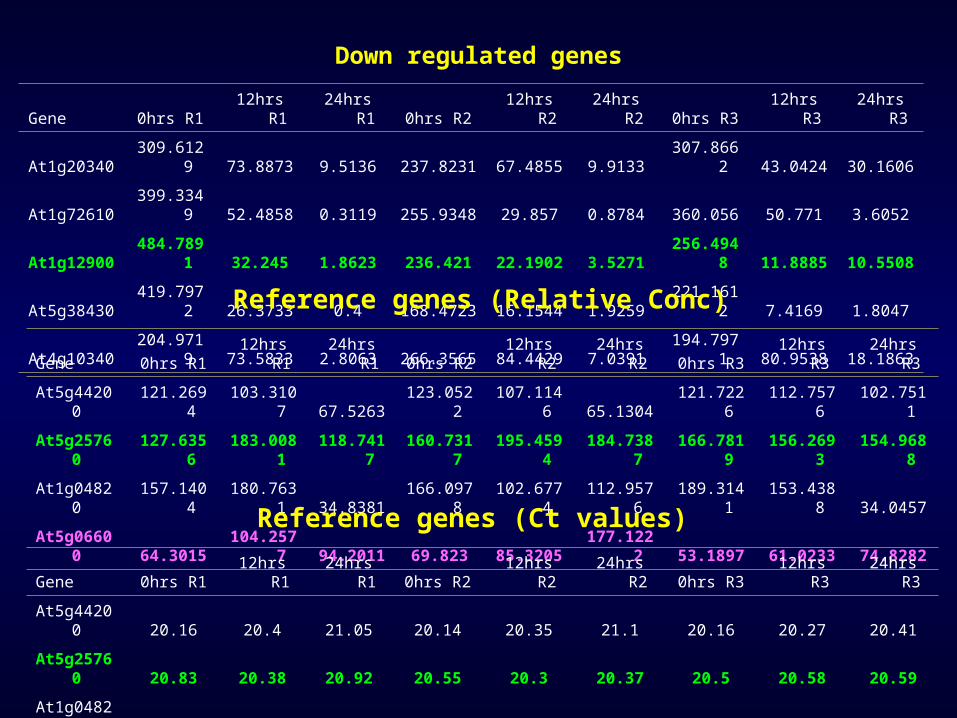
At1g20340 309.6129 73.8873 9.5136 237.8231 67.4855 9.9133 307.8662 43.0424 30.1606
At1g72610 399.3349 52.4858 0.3119 255.9348 29.857 0.8784 360.056 50.771 3.6052
At1g12900 484.7891 32.245 1.8623 236.421 22.1902 3.5271 256.4948 11.8885 10.5508
At5g38430 419.7972 26.3733 0.4 168.4723 16.1544 1.9259 221.1612 7.4169 1.8047
At4g10340 204.9719 73.5833 2.8063 266.3565 84.4429 7.0391 194.7971 80.9538 18.1863
Down regulated genes
Gene 0hrs R1 12hrs R1 24hrs R1 0hrs R2 12hrs R2 24hrs R2 0hrs R3 12hrs R3 24hrs R3
At5g44200 121.2694 103.3107 67.5263 123.0522 107.1146 65.1304 121.7226 112.7576 102.7511
At5g25760 127.6356 183.0081 118.7417 160.7317 195.4594 184.7387 166.7819 156.2693 154.9688
At1g04820 157.1404 180.7631 34.8381 166.0978 102.6774 112.9576 189.3141 153.4388 34.0457
At5g06600 64.3015 104.2577 94.2011 69.823 85.3205 177.1222 53.1897 61.0233 74.8282
Reference genes (Relative Conc)
Gene 0hrs R1 12hrs R1 24hrs R1 0hrs R2 12hrs R2 24hrs R2 0hrs R3 12hrs R3 24hrs R3
At5g44200 20.16 20.4 21.05 20.14 20.35 21.1 20.16 20.27 20.41
At5g25760 20.83 20.38 20.92 20.55 20.3 20.37 20.5 20.58 20.59
At1g04820 15.57 15.37 17.72 15.49 16.18 16.04 15.3 15.6 17.76
At5g06600 18.19 17.38 17.55 18.05 17.71 16.5 18.5 18.27 17.93
Reference genes (Ct values)

• Absolute quantification
– Uses serially diluted standards of known concentration to
generate a standard curve.
– PCR standards
• Fragment of double stranded DNA
• Single stranded DNA
• Complementary RNA bearing the target sequence
• Relative quantification
– Changes in gene expression are an external standard or
calibrator
• Two standard curve method
• Comparative Ct (Delta Delta Ct) method
• Pfaffl method – Relative expression software tool (REST)
Types of real-time quantification

Replicate GOI HKG GOI/HKG Relative values
0 hrs Rep 1 13.7458 127.6356 0.107695659 1.000
12 hrs Rep 1 55.4771 183.0081 0.303140134 2.815
24 hrs Rep 1 309.4145 118.7417 2.60577792 24.196
0 hrs Rep 2 13.5755 160.7317 0.084460626 1.000
12 hrs Rep 2 33.9872 195.4594 0.173883681 2.059
24 hrs Rep 2 292.9062 184.7387 1.585516191 18.772
0 hrs Rep 3 14.5349 166.7819 0.087149145 1.000
12 hrs Rep 3 77.8196 156.2693 0.497983929 5.714
24 hrs Rep 3 141.6806 154.9688 0.914252417 10.491
Calculation of relative values (At2g24180)

0
50
100
150
200
250
300
350
0 hrs Rep 1 12 hrs Rep 1 24 hrs Rep 1 0 hrs Rep 2 12 hrs Rep 2 24 hrs Rep 2 0 hrs Rep 3 12 hrs Rep 3 24 hrs Rep 3
Time points
Rel
ativ
e va
lues
At4g15610 At4g33150 At2g47190 At5g39610 At3g04720
0
0.2
0.4
0.6
0.8
1
1.2
0 hrs Rep 1 12 hrs Rep 1 24 hrs Rep 1 0 hrs Rep 2 12 hrs Rep 2 24 hrs Rep 2 0 hrs Rep 3 12 hrs Rep 3 24 hrs Rep 3
Time points
Rel
ativ
e va
lues
At4g10340 At1g72610 At1g12900 At5g38430 At1g20340
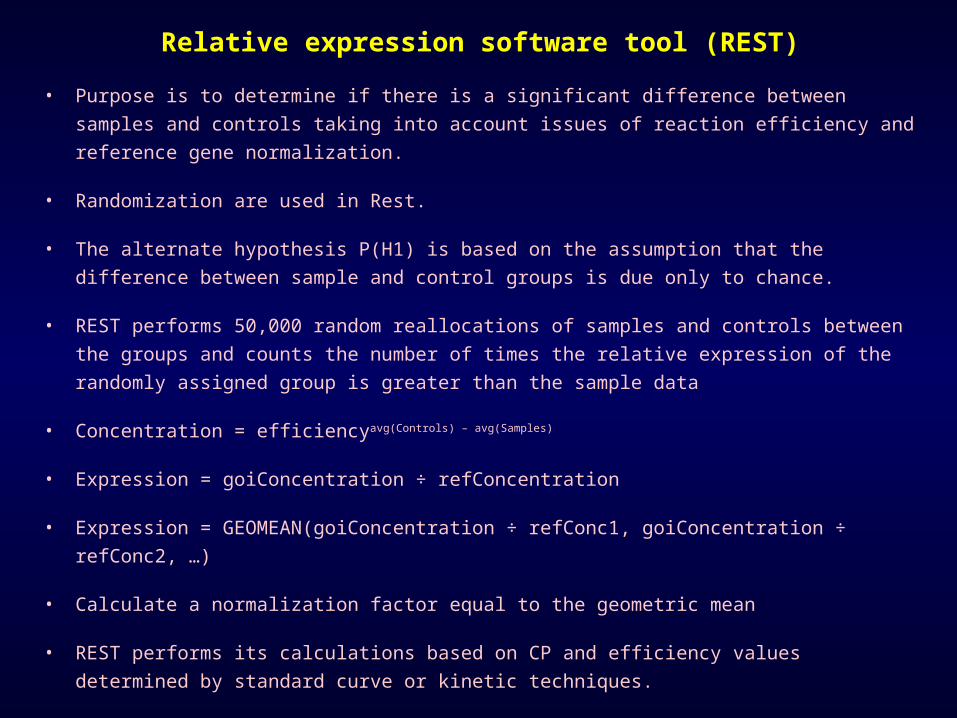
Relative expression software tool (REST)
• Purpose is to determine if there is a significant difference between samples and
controls taking into account issues of reaction efficiency and reference gene
normalization.
• Randomization are used in Rest.
• The alternate hypothesis P(H1) is based on the assumption that the difference
between sample and control groups is due only to chance.
• REST performs 50,000 random reallocations of samples and controls between the
groups and counts the number of times the relative expression of the randomly
assigned group is greater than the sample data
• Concentration = efficiencyavg(Controls) – avg(Samples)
• Expression = goiConcentration ÷ refConcentration
• Expression = GEOMEAN(goiConcentration ÷ refConc1, goiConcentration ÷
refConc2, …)
• Calculate a normalization factor equal to the geometric mean
• REST performs its calculations based on CP and efficiency values determined by
standard curve or kinetic techniques.
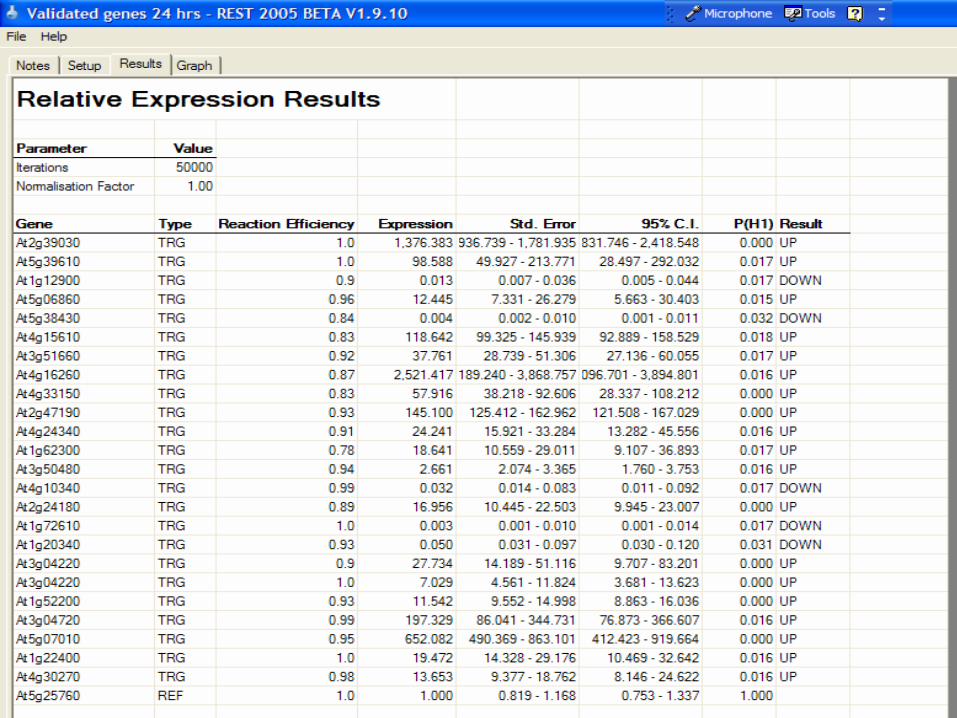
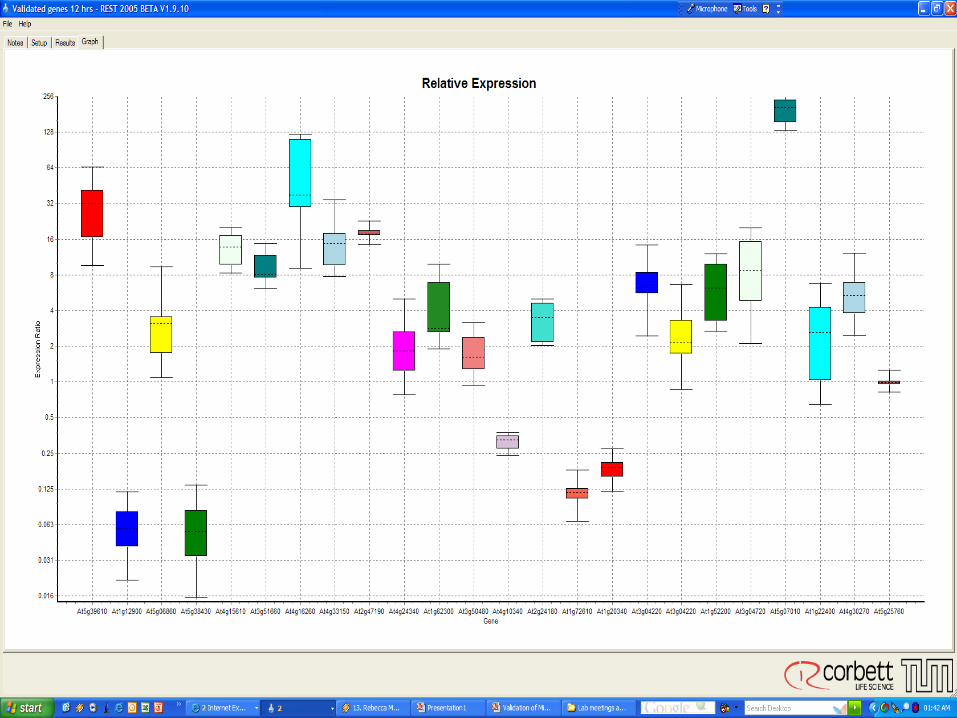


Validated genes from Microarray
1.09
E-0
1
2.66
E+0
1
9.04
E+0
1
3.64
E-0
1
2.27
E+0
0
3.72
E+0
0
7.68
E-0
3
5.79
E-0
1
3.49
E+0
1
1.88
E+0
2
6.53
E+0
0
4.24
E-0
1
0.00E+00
2.00E+01
4.00E+01
6.00E+01
8.00E+01
1.00E+02
1.20E+02
1.40E+02
1.60E+02
1.80E+02
2.00E+02
0 hrs 12 hrs 24 hrs 0 hrs 12 hrs 24 hrs 0 hrs 12 hrs 24 hrs 0 hrs 12 hrs 24 hrs
Mea
n N
orm
aliz
ed E
xpre
ssio
n

Delta Delta Ct method
• Xn = Xo x (1 + Ex)n
• XT = Xo x (1 + Ex)CT,X =KX
• RT = Ro x (1 + ER)CT,R =KR
Dividing XT by RT gives the expression
XT = Xo x (1 + Ex)CT,X =KX
RT = Ro x (1 + ER)CT,R =KR
Assuming equal amplification efficiencies
EX =ER = E
Xo
Ro
x (1 + E) CT,X-CT,R
= XN x (1 + E) ΔCT
= XNcb x (1 + E) ΔCT,cb
= XN,q x (1 + E) ΔCT,q = (1 + E) -
ΔΔCT
Calibration
Amount of the target normalized to an endogenous reference and relative to the calibrator is given by
Amount of target = 2-ΔΔCT
Assumption: The amplification efficiency of the target and reference are approximately equal

y = -0.175x - 2.8609
R2 = 0.3827
-4
-3.5
-3
-2.5
-2
-1.5
-1
-0.5
0
0 0.5 1 1.5 2 2.5
Log cDNA Conc
CT
(T
arg
et -
Ref
)

Time GAPDH UBC ΔCT -ΔΔCT Amount of target
0 hrs 15.16 20.83 -5.67 1
0 hrs 16.28 20.55 -4.27 1
0 hrs 16.15 20.5 -4.35 1
12 hrs 19.38 20.38 -1 4.67 0.04
12 hrs 19.96 20.3 -0.34 3.93 0.07
12 hrs 20.93 20.58 0.35 4.7 0.04
24 hrs 23.82 20.92 2.9 8.57 0.003
24 hrs 22.82 20.37 2.45 6.72 0.009
24 hrs 21.12 20.59 0.53 4.88 0.033
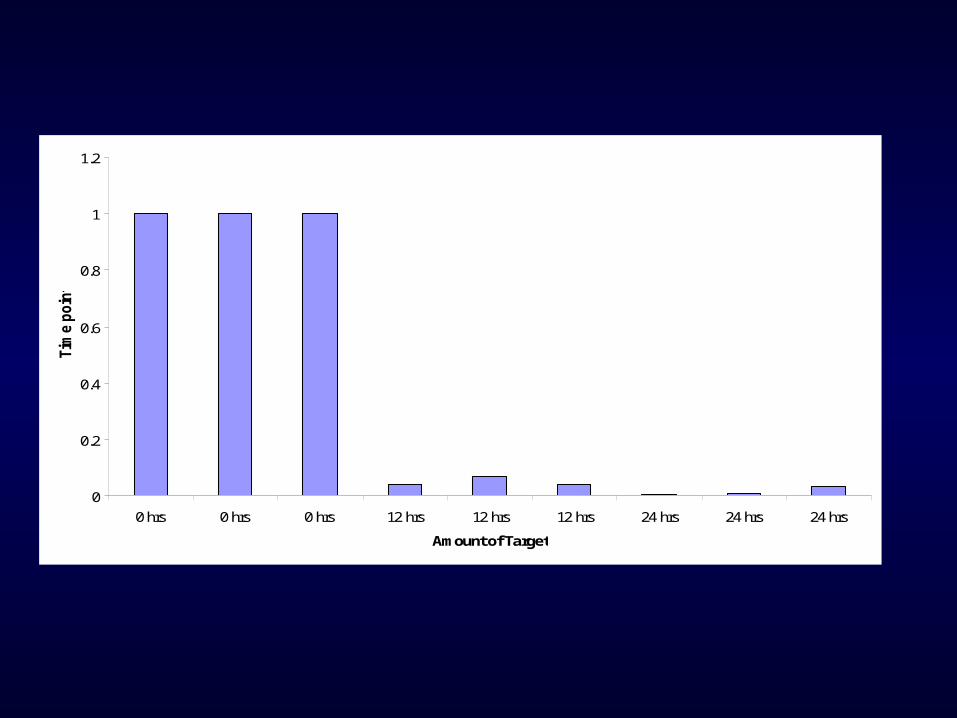
0
0.2
0.4
0.6
0.8
1
1.2
0 hrs 0 hrs 0 hrs 12 hrs 12 hrs 12 hrs 24 hrs 24 hrs 24 hrs
Amount of Target
Tim
e poin
ts
• Real Time PCR is a powerful technique that
gives quantitative answers difficult to
obtain with end point PCR, however, all
steps need to be controlled from sampling
to PCR including manipulations like
extraction and reverse transcription
Conclusion