Embed Size (px)
Citation preview

CHAPTER IV
ANALYSIS OF DATA
AND RESULTS OF THE STUDY
The analysis of data related to the effect of mental imagery training
programme on selected psychological variables and skill performances of
volleyball players are presented in this chapter.
To find out the effect of the experimental training programme on the
independent variables, the analysis of covariance was done for the two
experimental and the two control groups.
In case of significant F – ratio’s, the Benferroni post hoc analysis was
done to find out the significant differences between the paired means of the
experimental and control groups.
The analysis of the data was done in SPSS (Statistical Package for
Social Sciences) (Version 14). The results pertaining to the analysis done
and the graphical representation of relevant results are presented in this
chapter.
The results of the ANCOVA for the pre-test scores and the three
weeks post test scores on selected skill performance variables, after the three
weeks experimental training programme are presented in tables 2 to 13

Analysis
80
The results of the ANCOVA for the pre-test scores and the final post
test scores after the twelve weeks duration of the experimental programme
on selected psychological variables, are presented in tables 14 to 25.
The results of the ANCOVA for the pre-test scores and the final post
test scores after the twelve weeks duration of the experimental programme
on selected skill performance variables are presented in tables 26 to 37.
Pre-test and three weeks post-test scores of the experimental and
control groups on serve are presented in the table 2..
Table 2
Pre and Three Weeks Post-Test Scores of the Experimental and
Control Groups on Serve
Groups
N
Pre Test Post-Test
Mean SD Mean SD
Experimental (Elite) 15 51.14 2.04 54.75 1.80
Control (Elite) 15 47.92 5.26 48.47 5.36
Experimental (Novice) 15 38.23 3.20 41.62 3.62
Control (Novice) 15 36.63 3.45 37.38 2.82
The above table of the pre-test and three weeks post-test means of the
experimental and control groups on serve indicates that in case of elite

Analysis
81
experimental group, the pre and three weeks post-test mean and SD were
51.14 (2.04) and 54.75 (1.80) respectively. In case of elite control group,
the pre and three weeks post-test mean and SD were 47.92 (5.26) and 48.47
(5.36), respectively.
In case of novice experimental group, the pre and three weeks post-
test mean and SD were 38.23 (3.20) and 41.62 (3.62) respectively, and for
the novice control group, the corresponding pre and three weeks post-test
mean and SD were 36.63 (3.45) and 37.38 (2.82) respectively
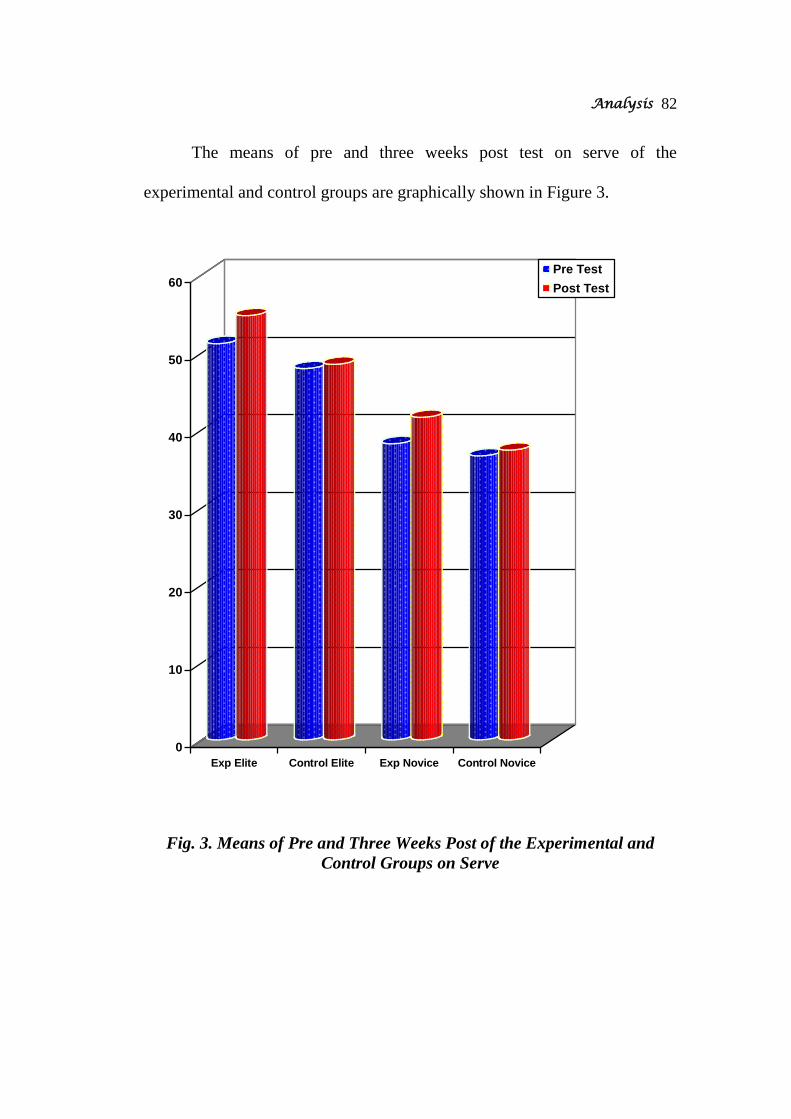
Analysis
82
The means of pre and three weeks post test on serve of the
experimental and control groups are graphically shown in Figure 3.
0
10
20
30
40
50
60
Exp Elite Control Elite Exp Novice Control Novice
Pre Test
Post Test
Fig. 3. Means of Pre and Three Weeks Post of the Experimental and
Control Groups on Serve

Analysis
83
Table 3
ANCOVA Table for Post Means on Serve after Three Weeks of
Mental Imagery Training Programme.
DF SS MSS F Sig.
Level
Corrected
Model 4 3270.276 817.569 431.663* 0.000
Intercept 1 12.476 12.476 6.587* 0.013
Pre 1 639.450 639.450 337.619* 0.000
Groups 3 127.021 42.340 22.355* 0.000
Error 55 104.170 1.894
Total 60 127908.150
* Indicates significance
The effect of imagery intervention on post adjusted means on serve
was examined by using ANCOVA with pre serve scores used as covariate.
As seen from table 3, significant F ratio’s of 337.619 and 22.355 were
obtained for the pre and groups respectively, there by indicating significant
differences in post adjusted serve scores based on imagery interventions
between the experimental and control groups.

Analysis
84
A post-hoc comparison was performed using the Benferroni method
to determine which of the experimental and control groups showed
significant difference for the post adjusted serve scores. All pair wise
comparisons among the groups were determined, and the results of the same
are shown in table 4.
Table 4
Pair Wise Comparison of Post Adjusted Means on Serve after
Three Weeks of Mental Imagery Training Programme
Groups
Experimental
Elite
Control
Elite
Experimental
Novice
Control
Novice
Mean
Difference
47.716 44.395 3.321*
47.716 46.450 1.266
47.716 43.673 4.042*
44.395
46.450 2.055*
44.395
43.673 0.72
46.450 43.673 2.776*
* Indicates significance at 0.05 level

Analysis
85
The post-hoc pair wise comparison of adjusted means on serve
indicates significant difference between experimental elite and control elite,
experimental elite and experimental novice, experimental elite and control
novice. Significant difference was also observed between control elite and
experimental novice, control elite and control novice, and experimental
novice and control novice.
The paired comparison of the adjusted post means after the three
weeks experimental period on serve are presented in Figure 4.
41
42
43
44
45
46
47
48
Exp Elite Control Elite Exp Novice Control Novice
Figure 4: Paired Adjusted Post Means after Three Weeks
Experimental Period on Serve.

Analysis
86
Pre-test and three weeks post-test scores of the experimental and
control groups on pass (service reception) are presented in the table 5
Table 5
Pre and Three Weeks Post-Test Scores of the Experimental and
Control Groups on Pass (Service reception)
Groups
N
Pre Test Post-Test
Mean SD Mean SD
Experimental (Elite) 15 51.68 4.36 54.51 4.06
Control (Elite) 15 45.77 3.43 46.78 3.18
Experimental (Novice) 15 39.11 2.81 42.02 3.51
Control (Novice) 15 37.73 2.85 39.02 2.88
The above table of the pre-test and three weeks post-test means of the
experimental and control groups on pass (service reception) indicates that in
case of elite experimental group, the pre and three weeks post-test mean and
SD were 51.68 (4.36) and 54.51 (4.06) respectively. In case of elite control
group, the pre and three weeks post-test mean and SD were 45.77 (3.43)
and 46.78 (3.18) respectively.
In case of novice experimental group, the pre and three weeks post-
test mean and SD were 39.11 (2.81) and 42.02 (3.51) respectively, and for

Analysis
87
the novice control group, the corresponding pre and three weeks post-test
mean and SD were 37.73 (2.85) and 39.02 (2.88) respectively.
Pre and three weeks post test means on pass (service reception) of the
experimental and control groups are graphically shown in Figure 5.
0
10
20
30
40
50
60
Exp Elite Control Elite Exp Novice Control Novice
Pre Test
Post Test
Fig. 5. Pre and Three Weeks Post Means of the Experimental and
Control Groups on Pass (Service Reception)

Analysis
88
Table 6
ANCOVA Table for Post Means on Pass (Service Reception) after
Three Weeks of Mental Imagery Training Programme
DF SS MSS F Sig.
Level
Corrected
Model 4 2612.293 653.073 343.228* 0.000
Intercept 1 9.886 9.886 5.195* 0.027
Pre 1 558.019 558.019 293.272* 0.000
Groups 3 48.775 16.258 8.545* 0.000
Error 55 104.651 1.903
Total 60 127387.360
* Indicates significance
The effect of imagery intervention on post adjusted means on pass
(service reception) was examined by using ANCOVA with pre pass (service
reception) scores used as covariate. As seen from table 6, significant F –
ratio’s of 293.272and 8.545were obtained for the pre and groups
respectively, there by indicating significant differences in post adjusted pass
(service reception) scores based on imagery interventions between the
experimental and control groups.

Analysis
89
A post-hoc comparison was performed using the Benferroni method
to determine which of the experimental and control groups showed
significant difference for the post adjusted pass (service reception) scores.
All pair wise comparisons among the groups were determined, and the
results of the same are shown in table 7
Table 7
Pair Wise Comparison of Post Adjusted Means on Pass (Service
Reception) after Three Weeks of Mental Imagery Training Programme
Groups
Experimental
Elite
Control
Elite
Experimental
Novice
Control
Novice
Mean
Difference
47.031 44.750 2.282*
47.031 46.136 0.895
47.031 44.416 2.615*
44.750 46.136 1.387
44.750 44.416 0.333
46.136 44.416 1.720*
* Indicates significance at 0.05 level
The post-hoc pair wise comparison of adjusted means on pass
(service reception) indicates significant difference between experimental
elite and control elite, experimental elite and experimental novice,

Analysis
90
experimental elite and control novice. Significant difference was also
observed between control elite and experimental novice, control elite and
control novice, and experimental novice and control novice.
The paired comparison of the adjusted post means after the three
weeks experimental period on pass (service reception) are presented in
Figure 6.
43
43.5
44
44.5
45
45.5
46
46.5
47
47.5
Exp Elite Control Elite Exp Novice Control Novice
Figure 6: Paired Adjusted Post Means After Three Weeks
Experimental Period on Pass (Service Reception).
Analysis
91
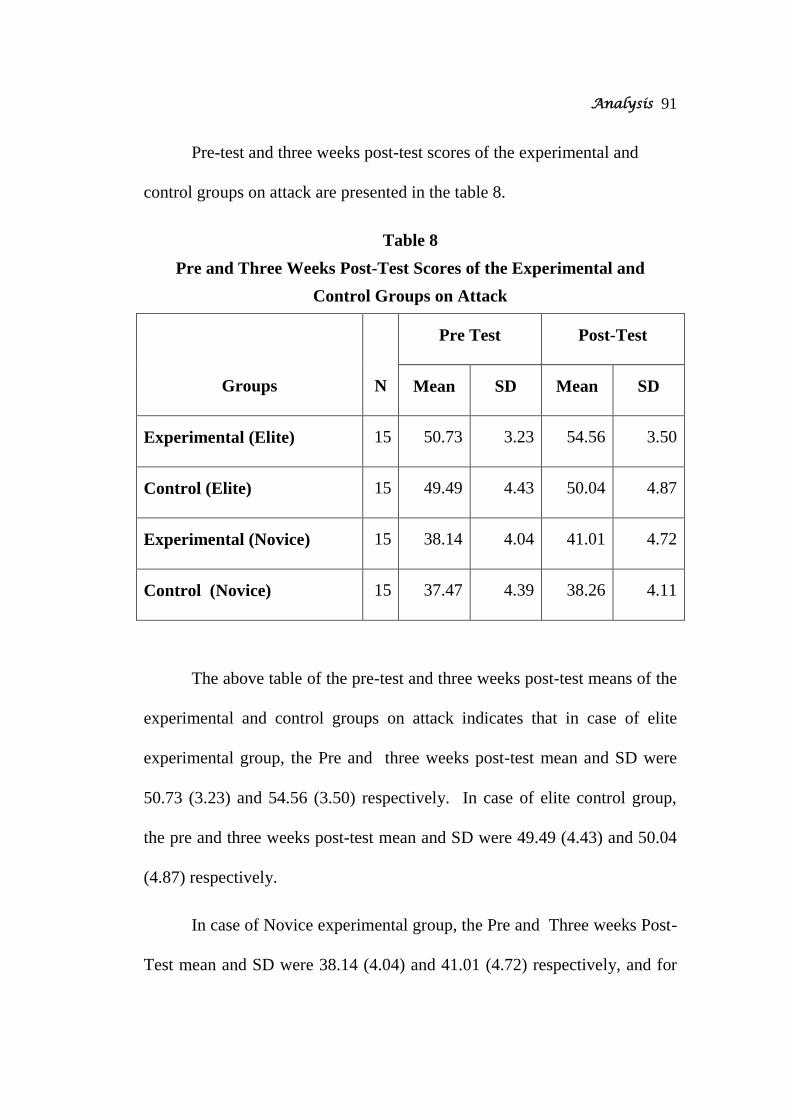
Pre-test and three weeks post-test scores of the experimental and
control groups on attack are presented in the table 8.
Table 8
Pre and Three Weeks Post-Test Scores of the Experimental and
Control Groups on Attack
Groups
N
Pre Test Post-Test
Mean SD Mean SD
Experimental (Elite) 15 50.73 3.23 54.56 3.50
Control (Elite) 15 49.49 4.43 50.04 4.87
Experimental (Novice) 15 38.14 4.04 41.01 4.72
Control (Novice) 15 37.47 4.39 38.26 4.11
The above table of the pre-test and three weeks post-test means of the
experimental and control groups on attack indicates that in case of elite
experimental group, the Pre and three weeks post-test mean and SD were
50.73 (3.23) and 54.56 (3.50) respectively. In case of elite control group,
the pre and three weeks post-test mean and SD were 49.49 (4.43) and 50.04
(4.87) respectively.
In case of Novice experimental group, the Pre and Three weeks Post-
Test mean and SD were 38.14 (4.04) and 41.01 (4.72) respectively, and for

Analysis
92
the novice control group, the corresponding pre and three weeks post-test
mean and SD were 37.47 (4.39) and 38.26 (4.11) respectively.
Pre and three weeks post test means on attack of the experimental
and control groups are graphically shown in Figure 7.
0
10
20
30
40
50
60
Exp Elite Control Elite Exp Novice Control
Novice
Pre Test
Post Test
Fig7. Pre and Three Weeks Post Means of the Experimental and
Control Groups on Attack

Analysis
93
Table 9
ANCOVA Table for Post Means on Attack after Three Weeks of
Mental Imagery Training Programme
DF SS MSS F
Sig.
Level
Corrected
Model
4 3561.100 890.275 462.608* 0.000
Intercept 1 0.873 0.873 0.453* 0.504
Pre 1 947.157 947.157 492.165* 0.000
Groups 3 110.713 36.904 19.176* 0.000
Error 55 105.846 1.924
Total 60 130461.400
* Indicates significance
The effect of imagery intervention on post adjusted means on attack
was examined by using ANCOVA with pre attack scores used as covariate.
As seen from table 9, significant F – ratio’s of 492.165 and 19.176 were
obtained for the pre and groups respectively, there by indicating significant
differences in post adjusted attack scores based on imagery interventions
between the experimental and control groups.

Analysis
94
A post-hoc comparison was performed using the Benferroni method
to determine which of the experimental and control groups showed
significant difference for the post adjusted attack scores. All pair wise
comparisons among the groups were determined, and the results of the same
are shown in table 10.
Table 10
Pair Wise Comparison of Post Adjusted Means on Attack after Three
Weeks of Mental Imagery Training Programme
Groups
Experimental
Elite
Control
Elite
Experimental
Novice
Control
Novice
Mean
Difference
47.689 44.428 3.262*
47.689 46.917 0.773
47.689 44.846 2.843*
44.428 46.917 2.489*
44.428 44.846 0.419
46.917 44.846 2.070*
* Indicates significance at 0.05 level
The post-hoc pair wise comparison of adjusted means on attack
indicates significant difference between experimental elite and control elite,
experimental elite and experimental novice, experimental elite and control

Analysis
95
novice. Significant difference was also observed between control elite and
experimental novice, control elite and control novice, and experimental
novice and control novice.
The paired comparison of the adjusted post means after the three
weeks experimental period on attack are presented in Figure 8.
42.5
43
43.5
44
44.5
45
45.5
46
46.5
47
47.5
48
Exp Elite Control Elite Exp Novice Control Novice
Figure 8: Paired Adjusted Post Means after Three Weeks
Experimental Period on Attack.

Analysis
96
Pre-test and three weeks post-test scores of the experimental and
control groups on block are presented in the table 11
Table 11
Pre and Three Weeks Post-Test Scores of the Experimental and
Control Groups on Block
Groups
N
Pre Test Post-Test
Mean SD Mean SD
Experimental (Elite) 15 51.41 2.35 54.38 2.19
Control (Elite) 15 50.33 3.23 50.67 3.96
Experimental (Novice) 15 39.08 2.71 42.73 2.64
Control (Novice) 15 37.77 3.12 38.88 3.24
The above table of the pre-test and three weeks post-test means of the
experimental and control groups on block indicates that in case of elite
experimental group, the pre and three weeks post-test mean and SD were
51.41 (2.35) and 54.38 (2.19) respectively. In case of elite control group,
the pre and three weeks post-test mean and SD were 50.33 (3.23) and 50.67
(3.96) respectively.
In case of novice experimental group, the pre and three weeks post-
test mean and SD were 39.08 (2.71) and 42.73 (2.64) respectively, and for

Analysis
97
the novice control group, the corresponding pre and three weeks post-test
mean and SD were 37.77 (3.12) and 38.88 (3.24) respectively
The means of pre and three weeks post test means on Block of the
experimental and control groups are graphically shown in Figure 9.
0
10
20
30
40
50
60
Exp Elite Control Elite Exp Novice Control Novice
Pre Test
Post Test
Fig.9. Pre and Three Weeks Post Means of the Experimental and
Control Groups on Block

Analysis
98
Table 12
ANCOVA Table for Post Means on Block after Three Weeks of
Mental Imagery Training Programme
DF SS MSS F
Sig.
Level
Corrected
Model
4 2606.288 651.572 176.829* 0.000
Intercept 1 18.488 18.488 5.017* 0.029
Pre 1 329.962 329.962 89.548* 0.000
Groups 3 109.947 36.649 9.946* 0.000
Error 55 202.662 3.685
Total 60 133484.950
* Indicates significance
The effect of imagery intervention on post adjusted means on block
was examined by using ANCOVA with pre block scores used as covariate.
As seen from table 12, significant F – ratio’s of 89.548 and 9.946 were
obtained for the pre and groups respectively, there by indicating significant
differences in post adjusted block scores based on imagery interventions
between the experimental and control groups.

Analysis
99
A post-hoc comparison was performed using the Benferroni method
to determine which of the experimental and control groups showed
significant difference for the post adjusted block scores. All pair wise
comparisons among the groups were determined, and the results of the same
are shown in table 13.
Table 13
Pair Wise Comparison of Post Adjusted Means on Block After
Three Weeks of Mental Imagery Training Programme
Groups
Experimental
Elite
Control
Elite
Experimental
Novice
Control
Novice
Mean
Difference
38.670 45.874 2.795*
38.670 47.437 1.233
38.670 44.693 3.977*
45.874 47.437
1.562
45.874 44.693
1.181
47.437 44.693
2.744*
* Indicates significance at 0.05 level
The post-hoc pair wise comparison of adjusted means on block
indicates significant difference between experimental elite and control elite,
experimental elite and experimental novice, experimental elite and control

Analysis
100
novice. Significant difference was also observed between control elite and
experimental novice, control elite and control novice, and experimental
novice and control novice.
The paired comparison of the adjusted post means after the three
weeks experimental period on Block are presented in Figure 10.
0
5
10
15
20
25
30
35
40
45
50
Exp Elite Control Elite Exp Novice Control Novice
Figure 10: Paired Adjusted Post Means after Three Weeks
Experimental Period on Block

Analysis
101
Pre-Test and Post-Test scores of the Experimental and Control groups
for cognitive anxiety are Presented in the table 14.
Table 14
Pre and Post-Test Scores of the Experimental and Control Groups
on Cognitive Anxiety
Groups N
Pre Test Post-Test
Mean SD Mean SD
Experimental (Elite) 15 18.93 3.17 16.73 3.15
Control (Elite) 15 16.80 4.84 16.20 4.41
Experimental (Novice) 15 20.13 3.02 17.40 2.47
Control (Novice) 15 16.33 5.16 16.33 4.36
The above table of the pre-test and post-test means of the
experimental and control groups on cognitive anxiety indicates that in case
of elite experimental group, the pre and post-test mean and SD were 18.93
(3.17) and 16.73 (3.15) respectively. In case of elite control group, the pre
and post-test mean and SD were 16.80 (4.84) and 16.20 (4.41) respectively.
In case of novice experimental group, the pre and post-test Mean and
SD were 20.13(3.02) and 17.40 (2.47) respectively, and for the novice

Analysis
102
control group, the corresponding pre and post-test mean and SD were 16.33
(5.16) and 16.33 (4.36) respectively
The means of the experimental and control groups on cognitive
anxiety are graphically shown in Figure 11.
0
5
10
15
20
25
Exp Elite Control Elite Exp Novice Exp Novice
Pre Test
Post Test
Fig. 11. Means of the Experimental and Control Groups
on Cognitive Anxiety

Analysis
103
The results of the analysis of covariance of the experimental and control
groups on cognitive anxiety are presented in tables 15.
Table 15
ANCOVA Table for Post Means on Cognitive Anxiety of the
Experimental and Control Groups
DF SS MSS F Sig. Level
Corrected Model 4 699.009 174.752 122.712* 0.000
Intercept 1 6.309 6.309 4.430* 0.040
Pre 1 665.942 685.942 481.674* 0.000
Groups 3 40.222 13.407 9.415* 0.000
Error 55 78.324 1.424
Total 60 17444.000
* Indicates significance
The effects of imagery intervention on post adjusted means on
cognitive anxiety were examined by using ANCOVA with pre cognitive
anxiety scores used as covariate. As seen from table 15, significant F –
ratio’s of 481.674 and 9.415 were obtained for the pre and post groups
respectively, there by indicating significant differences in post adjusted
cognitive anxiety scores based on imagery interventions between the
experimental and control groups.
Analysis
104
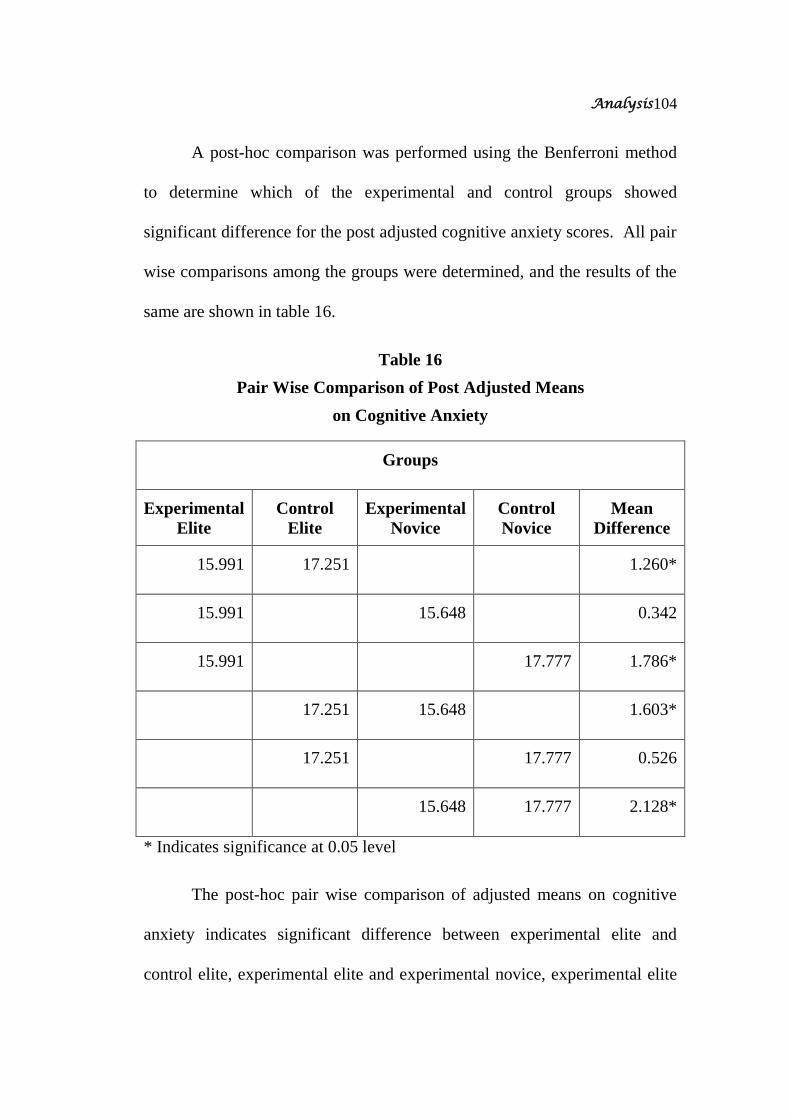
A post-hoc comparison was performed using the Benferroni method
to determine which of the experimental and control groups showed
significant difference for the post adjusted cognitive anxiety scores. All pair
wise comparisons among the groups were determined, and the results of the
same are shown in table 16.
Table 16
Pair Wise Comparison of Post Adjusted Means
on Cognitive Anxiety
Groups
Experimental
Elite
Control
Elite
Experimental
Novice
Control
Novice
Mean
Difference
15.991 17.251 1.260*
15.991 15.648 0.342
15.991 17.777 1.786*
17.251 15.648 1.603*
17.251 17.777 0.526
15.648 17.777 2.128*
* Indicates significance at 0.05 level
The post-hoc pair wise comparison of adjusted means on cognitive
anxiety indicates significant difference between experimental elite and
control elite, experimental elite and experimental novice, experimental elite

Analysis
105
and control novice. Significant difference was also observed between
control elite and experimental novice, control elite and control novice, and
experimental novice and control novice.
The paired comparison of the adjusted post means on cognitive
anxiety means of the experimental and control groups are presented in
Figure12.
14.5
15
15.5
16
16.5
17
17.5
18
Exp Eli Cntrl Eli Exp Nov Cntrl Nov
Figure. 12. Paired Adjusted Post Means on Cognitive Anxiety of the
Experimental and Control Groups

Analysis
106
Pre-test and post-test scores of the experimental and control groups
are presented in the table 17
Table 17
Pre and Post-Test Scores of the Experimental and Control Groups
on Somatic Anxiety
Groups
N
Pre Test Post-Test
Mean SD Mean SD
Experimental (Elite) 15 16.13 5.03 14.06 3.88
Control (Elite) 15 15.73 5.09 16.00 4.69
Experimental (Novice) 15 17.00 3.76 15.66 3.39
Control (Novice) 15 15.93 3.56 15.26 3.23
The above table of the pre-test and post-test means of the
experimental and control groups on somatic anxiety indicates that in case of
elite experimental group, the pre and post-test mean and SD were 16.13
(5.03) and 14.06 (3.88) respectively. In case of elite control group, the pre
and post-test mean and SD were 15.73 (5.09) and 16.00 (4.69) respectively.
In case of novice experimental group, the pre and post-test mean and
SD were 17.00 (3.76) and 15.66 (3.39) respectively, and for the novice

Analysis
107
control group, the corresponding pre and post-test mean and SD were 15.93
(3.56) and 15.26 (3.23) respectively
The means of the experimental and control groups on Somatic
Anxiety are graphically shown in Figure 13.
0
2
4
6
8
10
12
14
16
18
Exp Elite Control Elite Exp Novice Control Novice
Pre Test
Post Test
Fig. 13. Means of the Experimental and Control Groups
on Somatic Anxiety

Analysis
108
Table 18
ANCOVA Table for Post Means on Somatic Anxiety of the
Experimental and Control Groups
DF SS MSS F Sig. Level
Corrected Model 4 761.165 190.291 106.704* 0.000
Intercept 1 15.718 15.718 8.814* 0.004
Pre 1 729.115 729.115 408.842* 0.000
Groups 3 39.883 13.294 7.455* 0.000
Error 55 98.085 1.783
Total 60 14813.000
* Indicates significance
The effects of imagery intervention on post adjusted means on
somatic anxiety were examined by using ANCOVA with pre somatic
anxiety scores used as covariate. As seen from table 18, significant F –
ratio’s of 408.842 and 7.455 were obtained for the pre and groups
respectively, there by indicating significant differences in post adjusted
somatic anxiety scores based on imagery interventions between the
experimental and control groups.
A post comparison was performed using the Benferroni method to
determine which of the experimental and control groups showed significant

Analysis
109
difference for the post adjusted somatic anxiety scores. All pair wise
comparisons among the groups were determined, and the results of the same
are shown in table 19
Table 19
Pair Wise Comparison of Post Adjusted Means
on Somatic Anxiety
Groups
Experimental
Elite
Control
Elite
Experimental
Novice
Control
Novice
Mean
Difference
14.121 16.381 2.260*
14.121 15.013 0.892
14.121 15.485 1.363*
16.381 15. 013 1369*
16.381 15.485 0.897
15. 013 15.485 0.472
* Indicates significance at 0.05 level
The post-hoc pair wise comparison of adjusted mean on somatic
anxiety indicates significant difference between experimental elite and
control elite, experimental elite and experimental novice, experimental elite
and control novice. Significant difference was also observed between

Analysis
110
control elite and experimental novice, control elite and control novice, and
experimental novice and control novice. pre-test and post-test scores of the
experimental and control groups are presented in the table 19
The paired comparison of the adjusted post means on Somatic
Anxiety means of the experimental and control groups are presented in
Figure 14.
12.5
13
13.5
14
14.5
15
15.5
16
16.5
Exp Elite Control Elite Exp Novice Control Novice
Figure 14. Paired Adjusted Post Means on Somatic Anxiety of the
Experimental and Control Groups

Analysis
111
Table20
Pre and Post-Test Scores of the Experimental and Control Groups
on Self Confidence
Groups
N
Pre Test Post-Test
Mean SD Mean SD
Experimental (Elite) 15 25.20 3.84 28.40 3.24
Control (Elite) 15 25.27 4.00 26.26 4.23
Experimental (Novice) 15 22.40 3.48 27.00 3.02
Control (Novice) 15 27.07 3.33 27.26 2.91
The above table of the pre-test and post-test means of the
experimental and control groups on self confidence indicates that in case of
elite experimental group, the pre and post-test mean and SD were 25.20
(3.84) and 28.40 (3.24) respectively. In case of elite control group, the pre
and post-test mean and SD were 25.27 (4.00) and 26.26 (4.23) respectively.
In case of novice experimental group, the pre and post-test mean and
SD were 22.40 (3.48) and 27.00 (3.02) respectively, and for the novice
control group, the corresponding pre and post-test mean and SD were 27.07
(3.33) and 27.26 (2.91) respectively.

Analysis
112
The means of the experimental and control groups on Self
Confidence are graphically shown in Figure 15.
0
5
10
15
20
25
30
Exp Elite Control Elite Exp Novice Control Novice
Pre Test
Post Test
Fig. 15. Means of the Experimental and Control Groups
on Self Confidence

Analysis
113
Table 21
ANCOVA Table for Post Means On Self Confidence of the
Experimental and Control Groups
DF SS MSS F Sig. Level
Corrected Model 4 586.458 146.615 85.535* 0.000
Intercept 1 41.307 41.307 24.098* 0.000
Pre 1 551.191 551.191 321.564* 0.000
Groups 3 121.303 40.434 23.589* 0.000
Error 55 94.275 1.714
Total 60 45180.000
* Indicates significance
The effect of imagery intervention on post adjusted means on self
confidence were examined by using ANCOVA with pre self confidence
scores used as covariate. As seen from table 21, significant F – ratio’s of
321.564and 23.589 were obtained for the pre and groups respectively, there
by indicating significant differences in post adjusted self confidence scores
based on imagery interventions between the experimental and control
groups.
A post comparison was performed using the Benferroni method to
determine which of the experimental and control groups showed significant

Analysis
114
difference for the post adjusted self confidence scores. All pair wise
comparisons among the groups were determined, and the result of the same
shown in table 22
Table 22
Pair Wise Comparison of Post Adjusted Means
on Self Confidence
Groups
Experimental
Elite
Control
Elite
Experimental
Novice
Control
Novice
Mean
Difference
28.215 26.025 2.190*
28.215 29.206 0.991
28.215 25.488 2.727*
26.025 29.206 3.181*
26.025 25.488 0.537
29.206 25.488 3.718*
* Indicates significance at 0.05 level
The post-hoc pair wise comparison of adjusted means on self
confidence indicates significant difference between experimental elite and
control elite, experimental elite and experimental novice, experimental elite

Analysis
115
and control novice. Significant differences were also observed between
control elite and experimental novice, control elite and control novice, and
experimental novice and control novice.
The paired comparison of the adjusted post means on Self Confidence
means of the experimental and control groups are presented in Figure 16.
23
24
25
26
27
28
29
30
Exp Elite Control Elite Exp. Novice Control Novice
Figure 16. Paired Adjusted Post Means on Self Confidence of the
Experimental and Control Groups

Analysis
116
Pre-Test and Post-Test scores of the Experimental and Control groups
are Presented in the table 23
Table 23
Pre and Post-Test Scores of the Experimental and Control Groups
on Attention
Groups
N
Pre Test Post-Test
Mean SD Mean SD
Experimental (Elite) 15 10.20 3.69 13.66 4.23
Control (Elite) 15 13.13 5.46 13.80 5.05
Experimental (Novice) 15 9.87 2.75 13.13 1.92
Control (Novice) 15 15.00 5.46 15.60 4.80
The above table of the pre-test and post-test means of the
experimental and control groups on attention indicates that in case of elite
experimental group, the pre and post-test mean and SD were 10.20 (3.69)
and 13.66 (4.23) respectively. In case of elite control group, the pre and
post-test mean and SD were 13.13 (5.46) and 13.80 (5.05) respectively.
In case of novice experimental group, the pre and post-test mean and
SD were 9.87 (2.75) and 13.13 (1.92) respectively, and for the novice

Analysis
117
control group, the corresponding pre and post-test mean and SD were 15.00
(5.46) and 15.60 (4.80) respectively
The means of the experimental and control groups on Attention are
graphically shown in Figure 17.
0
2
4
6
8
10
12
14
16
Exp Elite Control Elite Exp Novice Control Novice
Pre Test
Post Test
Fig. 17. Means of the Experimental and Control Groups
on Attention

Analysis
118
Table 24
ANCOVA Table for Post Means on Attention of the
Experimental and Control Groups
DF SS MSS F Sig. Level
Corrected Model 4 913.621 228.405 101.943* 0.000
Intercept 1 86.217 86.217 38.481* 0.000
Pre 1 861.838 861.838 384.659* 0.000
Groups 3 62.268 20.756 9.264* 0.000
Error 55 123.229 2.241
Total 60 12881.000
* Indicates significance
The effect of imagery intervention on post adjusted means on
attention was examined by using ANCOVA with pre attention scores used
as covariate. As seen from table 24, there was a significant F – ratio’s of
384.659 and 9.264 were obtained for the pre and groups respectively, there
by indicating significant differences in post adjusted attention scores based
on imagery interventions between the experimental and control groups.
A post-hoc comparison was performed using the Benferroni method
to determine which of the experimental and control groups showed
significant difference for the post adjusted attention scores. All pair wise

Analysis
119
comparisons among the groups were determined, and the result of the same
shown in table 25
Table 25
Pair Wise Comparison of Post Adjusted Means
on Attention
Groups
Experimental
Elite
Control
Elite
Experimental
Novice
Control
Novice
Mean
Difference
15.281 12.855 2.426*
15.281 15.039 0.242
15.281 13.026 2.255*
12.855 15.039 2.184 *
12.855 13.026 0.171
15.039 13.026 2.013*
* Indicates significance at 0.05 level
The post-hoc pair wise comparison of adjusted means on attention
indicates significant difference between experimental elite and control elite,
experimental elite and experimental novice, experimental elite and control
novice. Significant differences were also observed between control elite and

Analysis
120
experimental novice, control elite and control novice, and experimental
novice and control novice.
The paired comparison of the adjusted post means on Attention
means of the experimental and control groups are presented in Figure 18.
11.5
12
12.5
13
13.5
14
14.5
15
15.5
Exp Elite Control Elite Exp Novice Control novice
Figure 18. Paired Adjusted Post Means on Attention of the
Experimental and Control Groups

Analysis
121
Pre-Test and Post-Test scores of the Experimental and Control groups
are Presented in the table 26
Table 26
Pre and Post-Test Scores of the Experimental and
Control Groups on Serve
Groups
N
Pre Test Post-Test
Mean SD Mean SD
Experimental (Elite) 15 50.84 1.77 55.88 1.70
Control (Elite) 15 47.98 5.46 49.16 5.30
Experimental (Novice) 15 37.99 3.23 42.56 3.39
Control (Novice) 15 36.73 2.89 38.11 2.75
The above table of the pre-test and post-test means of the
experimental and control groups on Serve indicates that in case of elite
experimental group, the pre and post-test mean and SD were 50.84 (1.77)
and 55.88 (1.70) respectively. In case of elite control group, the pre and
post-test mean and SD were 47.98 (5.46) and 49.16 (5.30) respectively.
In case of novice experimental group, the pre and post-test mean and
SD were 37.99 (3.23) and 42.56 (3.39) respectively, and for the novice

Analysis
122
control group, the corresponding pre and post-test mean and SD were 36.73
(2.89) and 38.11 (2.75) respectively
The means of the experimental and control groups on Serve are
graphically shown in Figure 19.
0
10
20
30
40
50
60
Exp Elite Control Elite Exp Novice Control Novice
Pre Test
Post Test
Fig. 19. Means of The Experimental and Control Groups
on Serve

Analysis
123
Table 27
ANCOVA Table for Post Means on Serve of the
Experimental and Control Groups
DF SS MSS F Sig.
Level
Corrected
Model 4 3374.871 843.718 1092.324* 0.000
Intercept 1 9.803 9.803 12.692* 0.001
Pre 1 659.719 659.719 854.109* 0.000
Groups 3 186.104 62.035 80.314* 0.000
Error 55 42.482 0.772
Total 60 132780.620
* Indicates significance
The effect of imagery intervention on post adjusted means on serve
was examined by using ANCOVA with pre serve scores used as covariate.
As seen from table 27, significant F – ratio’s of 854.109 and 80.314 were
obtained for the pre and groups respectively, there by indicating significant
differences in post adjusted serve scores based on imagery interventions
between the experimental and control groups.

Analysis
124
A post-hoc comparison was performed using the Benferroni method
to determine which of the experimental and control groups showed
significant difference for the post adjusted serve scores. All pair wise
comparisons among the groups were determined, and the result of the same
shown in table 28.
Table 28
Pair Wise Comparison of Post Adjusted Means
on Serve
Groups
Experimental
Elite
Control
Elite
Experimental
Novice
Control
Novice
Mean
Difference
48.777 44.785 3.993*
48.777 47.708 1.069
48.777 44.462 4.314*
44.785 47.708 2.924*
44.785 44.462 0.322
47.708 44.462 3.245*
* Indicates significance at 0.05 level
The post-hoc pair wise comparison of adjusted means on serve
indicates significant difference between experimental elite and control elite,

Analysis
125
experimental elite and experimental novice, experimental elite and control
novice. Significant difference was also observed between control elite and
experimental novice, control elite and control novice, and experimental
novice and control novice.
The paired comparison of the adjusted post means of Serve of the
experimental and control groups are presented in Figure
20
42
43
44
45
46
47
48
49
Exp Elite Control Elite Exp Novice Control Novice
Figure 20. Paired Adjusted Post Means on Serve of the
Experimental and Control Groups

Analysis
126
Pre-Test and Post-Test scores of the Experimental and Control groups
are Presented in the table 29.
Table 29
Pre and Post-Test Scores of the Experimental and Control Groups
on Pass (Service Reception)
Groups
N
Pre Test Pos-Test
Mean SD Mean SD
Experimental (Elite) 15 51.42 3.86 55.47 4.17
Control (Elite) 15 46.45 3.23 47.17 3.18
Experimental (Novice) 15 38.88 3.38 42.99 3.58
Control (Novice) 15 37.86 3.05 39.54 2.96
The above table of the pre-test and post-test means of the
experimental and control groups on reception indicates that in case of elite
experimental group, the pre and post-test mean and SD were 51.42 (3.86)
and 55.47 (4.17) respectively. In case of elite control group, the pre and
post-test mean and SD were 46.45 (3.23) and 47.17 (3.18) respectively.
In case of novice experimental group, the pre and post-test mean and
SD were 38.88 (3.38) and 42.99 (3.58) respectively, and for the novice

Analysis
127
control group, the corresponding pre and post-test mean and SD were 37.86
(3.05) and 39.54 (2.96) respectively
The means of the experimental and control groups on pass (service
reception) are graphically shown in Figure 21.
0
10
20
30
40
50
60
Exp Elite Control Elite Exp Novice Control Novice
Pre Test
Post Test
Fig. 21. Means of the Experimental and Control Groups
on Pass (Service Reception)

Analysis
128
Table 30
ANCOVA Table for Post Means on Pass (Service Reception) of the
Experimental and Control Groups
DF SS MSS F Sig.
Level
Corrected
Model 4 2702.560 675.640 341.772* 0.000
Intercept 1 8.284 8.284 4.190* 0.045
Pre 1 579.396 579.396 293.087* 0.000
Groups 3 133.341 44.447 22.483* 0.000
Error 55 108.728 1.977
Total 60 131404.910
* Indicates significance
The effect of imagery intervention on post adjusted means on pass
(Service reception) was examined by using ANCOVA with pre pass( service
reception)scores used as covariate. As seen from table 30, significant F –
ratio’s of 293.087 and 22.483 were obtained for the pre and groups
respectively, there by indicating significant differences in post adjusted
Pass(Service reception) scores based on imagery interventions between the
experimental and control groups.

Analysis
129
A post-hoc comparison was performed using the Benferroni method
to determine which of the experimental and control groups showed
significant difference for the post adjusted pass (service reception) scores.
All pair wise comparisons among the groups were determined, and the result
of the same shown in table 31
Table 31
Pair Wise Comparison of Post Adjusted Means
on Pass (Service Reception)
Groups
Experimental
Elite
Control
Elite
Experimental
Novice
Control
Novice
Mean
Difference
48.120 44.524 3.597*
48.120 47.515 0.605
48.120 45.012 3.099*
44.524 47.515 2.991*
44.524 45.012 0.498
47.515 45.012 2.494*
* Indicates significance at 0.05 level
The post-hoc pair wise comparison of adjusted means on pass
(service reception) indicates significant difference between experimental
elite and control elite, experimental elite and experimental novice,

Analysis
130
experimental elite and control novice. Significant difference was also
observed between control elite and experimental novice, control elite and
control novice, and experimental novice and control novice.
The paired comparison of the adjusted post mean on Pas (service
reception) means of the experimental and control groups are presented in
Figure 22.
42
43
44
45
46
47
48
49
Exp Elite Control Elite Exp Novice Control Novice
Figure 22. Paired Adjusted Post Means on Pass (Service Reception) of the
Experimental and Control Groups

Analysis
131
Pre-test and post-test scores of the experimental and control groups
are presented in the table 32
Table 32
Pre and Post-Test Scores of the Experimental and Control Groups
on Attack
Groups
N
Pre Test Post-Test
Mean SD Mean SD
Experimental (Elite) 15 50.82 3.61 55.74 3.59
Control (Elite) 15 49.83 4.97 50.48 4.81
Experimental (Novice) 15 37.90 3.82 42.08 4.91
Control (Novice) 15 37.43 4.35 38.77 4.34
The above table of the pre-test and post-test means of the
experimental and control groups on attack indicates that in case of elite
experimental group, the pre and post-test mean and SD were 50.82 (3.61)
and 55.74 (3.59) respectively. In case of elite control group, the pre and
post-test mean and SD were 49.83 (4.97) and 50.48 (4.81) respectively.
In case of novice experimental group, the pre and post-test mean and
SD were 37.90 (3.82) and 42.08 (4.91) respectively, and for the novice
control group, the corresponding pre and post-test mean and SD were 37.43
(4.35) and 38.77 (4.34) respectively

Analysis
132
The means of the experimental and control groups on attack are
graphically shown in Figure 23.
0
10
20
30
40
50
60
Exp Elite Control Elite Exp Novice Control Novice
Pre Test
Post Test
Fig.23. Means of the Experimental and Control Groups
on Attack

Analysis
133
Table 33
ANCOVA Table for Post Means on Attack of the
Experimental and Control Groups
DF SS MSS F
Sig.
Level
Corrected
Model
4 3709.411 927.353 512.426* 0.000
Intercept 1 3.394 3.394 1.857* 0.176
Pre 1 1007.831 1007.831 556.896* 0.000
Groups 3 196.316 65.439 36.159* 0.000
Error 55 99.535 1.810
Total 60 135054.920
* Indicates significance
The effect of imagery intervention on post adjusted means on attack
was examined by using ANCOVA with pre attack scores used as covariate.
As seen from table 33, significant F – ratio’s of 556.896 and 36.159 were
obtained for the pre and groups respectively, there by indicating significant
differences in post adjusted attack scores based on imagery interventions
between the experimental and control groups.

Analysis
134
A post-hoc comparison was performed using the Benferroni method
to determine which of the experimental and control groups showed
significant difference for the post adjusted attack scores. All pair wise
comparisons among the groups were determined, and the result of the same
shown in table 21
Table 34
Pair Wise Comparison of Post Adjusted Means
on Attack
Groups
Experimental
Elite
Control
Elite
Experimental
Novice
Control
Novice
Mean
Difference
48.883 44.621 4.262*
48.883 48.207 0.676
48.883 45.369 3.514*
44.621 48.207 3.586*
44.621 45.369 0.748
48.207 45.369 2.838*
* Indicates significance at 0.05 level
The post-hoc pair wise comparison of adjusted means on attack
indicates significant difference between experimental elite and control elite,

Analysis
135
experimental elite and experimental novice, experimental elite and control
novice. Significant difference was also observed between control elite and
experimental novice, control elite and control novice, and experimental
novice and control novice.
The paired comparison of the adjusted post means on Attack means
of the experimental and control groups are presented in Figure 24.
42
43
44
45
46
47
48
49
Exp Elite Control Elite Exp Novice Control Novice
Figure 24. Paired Adjusted Post Means on Attack of the
Experimental and Control Groups
Analysis
136
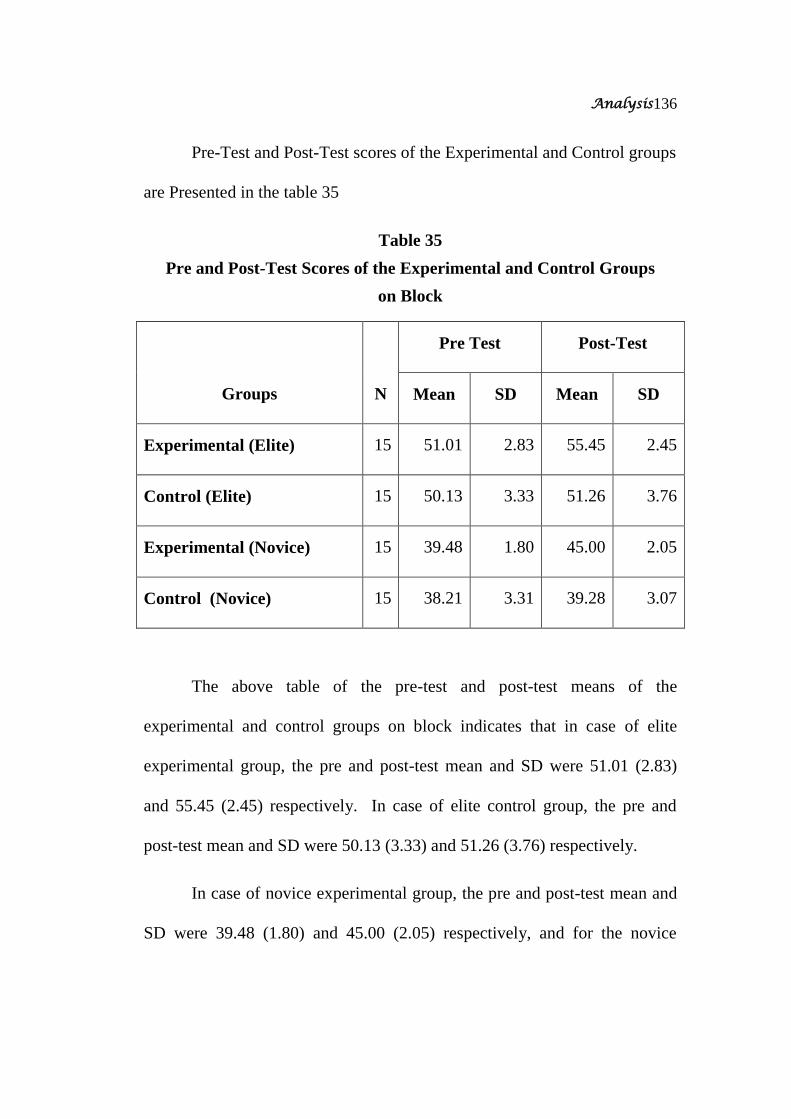
Pre-Test and Post-Test scores of the Experimental and Control groups
are Presented in the table 35
Table 35
Pre and Post-Test Scores of the Experimental and Control Groups
on Block
Groups
N
Pre Test Post-Test
Mean SD Mean SD
Experimental (Elite) 15 51.01 2.83 55.45 2.45
Control (Elite) 15 50.13 3.33 51.26 3.76
Experimental (Novice) 15 39.48 1.80 45.00 2.05
Control (Novice) 15 38.21 3.31 39.28 3.07
The above table of the pre-test and post-test means of the
experimental and control groups on block indicates that in case of elite
experimental group, the pre and post-test mean and SD were 51.01 (2.83)
and 55.45 (2.45) respectively. In case of elite control group, the pre and
post-test mean and SD were 50.13 (3.33) and 51.26 (3.76) respectively.
In case of novice experimental group, the pre and post-test mean and
SD were 39.48 (1.80) and 45.00 (2.05) respectively, and for the novice

Analysis
137
control group, the corresponding pre and post-test mean and SD were 38.21
(3.31) and 39.28 (3.07) respectively
The means of the experimental and control groups on Block are
graphically shown in Figure 25.
0
10
20
30
40
50
60
Exp Elite Control Elite Exp Novice Control Novice
Pre Test
Post Test
Fig. 25. Means of the Experimental and Control Groups
on Block

Analysis
138
Table 36
ANCOVA Table for Post Means on Block of the
Experimental and Control Groups
DF SS MSS F
Sig.
Level
Corrected
Model
4 2632.404 658.101 343.652* 0.000
Intercept 1 14.996 14.996 7.830* 0.007
Pre 1 369.624 369.624 193.013* 0.000
Groups 3 237.952 79.317 41.419* 0.000
Error 55 105.326 1.915
Total 60 139541.480
* Indicates significance
The effect of imagery intervention on post adjusted means on block
was examined by using ANCOVA with pre block scores used as covariate.
As seen from table 36, significant F – ratio’s of 193.013 and 41.419 were
obtained for the pre and groups respectively, there by indicating significant
differences in post adjusted block scores based on imagery interventions
between the experimental and control groups.

Analysis
139
A post-hoc comparison was performed using the Benferroni method
to determine which of the experimental and control groups showed
significant difference for the post adjusted block scores. All pair wise
comparisons among the groups were determined, and the result of the same
shown in table 37
Table 37
Pair Wise Comparison of Post Adjusted Means
on Block
Groups
Experimental
Elite
Control
Elite
Experimental
Novice
Control
Novice
Mean
Difference
49.851 46.441 3.411*
49.851 49.648 0.204
49.851 45.060 4.791*
46.441 49.648
3.207*
46.441 45.060
1.381
49.648 45.060
4.588*
* Indicates significance at 0.05 level
The post-hoc pair wise comparison of adjusted means on block
indicates significant difference between experimental elite and control elite,

Analysis
140
experimental elite and experimental novice, experimental elite and control
novice. Significant difference was also observed between control elite and
experimental novice, control elite and control novice, and experimental
novice and control novice.
The paired comparison of the adjusted post means on Block means of
the experimental and control groups are presented in Figure 26.
42
43
44
45
46
47
48
49
50
Exp Elite Control Elite Exp Novice Control Novice
Figure 26: Paired Adjusted Post Means on Block of the
Experimental and Control Groups

Analysis
141
Discussion of Findings
The present study was undertaken with the following hypotheses:
(i) There would be significant effect for the mental imagery intervention
programme on selected psychological variables namely, cognitive anxiety,
somatic anxiety and self confidence and attention of volleyball players.
(ii) There would be significant effect for the three weeks mental imagery
intervention programme on selected skill performance variables namely,
serve, pass (service reception), attack and block of volleyball players.
(iii) There would be significant effect for the imagery intervention
programmes for all the four skills (three weeks each) for the total duration of
twelve weeks on selected skill performances variables namely, serve, pass
(service reception), attack and block of volleyball players.
The results of the study with respect to the hypothesis (i) that there
would be significant effect for the mental imagery intervention programme
on selected psychological variables namely, cognitive anxiety, somatic
anxiety and self confidence and attention of volleyball players indicated the
following results.
In case of cognitive anxiety, it was found that both the experimental
groups Experimental Elite (EE) and Experimental Novice (EN) showed
significantly lower cognitive anxiety as compared to the control groups after
Analysis
142
the mental imagery training programme. The EE group had significant lower
cognitive anxiety as compared to EN group also. There was no significant
difference in cognitive anxiety between the two control groups.
In case of somatic anxiety, it was found that Experimental Elite (EE)
and showed significantly lower somatic anxiety as compared to the Control
Elite after the imagery training programme. However, there was no
difference in somatic anxiety between the two experimental groups. There
was no significant difference between the Experimental Novice (EN) and
Control Novice (CN).
The results indicating decrease in anxiety for the mental imagery
intervention programmes may be explained with the reason that mental
imagery programmes contribute to the enhancement of readiness to
recognise and interpret signs of anxiety, and create a more positive outcome
towards the upcoming task. As such a gain in confidence level of the players
reciprocally leads to decrease in anxiety.
The above results are in consonance with the findings observed by
Mamassis and Doganis, 2004; Anil, 2005; Craft et al, 2003.
In case of self confidence, it was found that both the experimental
groups Experimental Elite (EE) and Experimental Novice (EN) showed
significantly higher self confidence as compared to both the control groups
after the mental imagery training programme.

Analysis
143
Confidence is in effect, a belief, or self-assurance in ones own
abilities. It is essentially a feeling of having an expectation of success.
Imagery can be a powerful means of developing confidence (Davies, 1989).
Imagery can sometimes be more effective than actual practice, because the
player/s can visualize him/herself playing in a competitive situation, and this
to an extent, is more realistic and valuable (Davies, 1989). During mental
rehearsal, the player imagines positive outcomes, and this creates a feeling
of success, which in turn builds confidence (Davies, 1989). Improvement in
self confidence following mental imagery training have been observed in the
studies by Mamassis and Doganis, 2004; Anil, 2005; Short et al, 2002;
Moritz et al., 1996)
The results showed no difference in self confidence between the two
experimental groups. Imagery as a mental training skill has shown to be
equally effective in case of competitive elite sportspersons as well as
beginners (Cumming, Hall, Harwood, and Gammage, 2002). In the present
finding the effectiveness of imagery intervention for both the elite
experimental and novice experimental supports the above finding.
In case of attention, it was found that both the experimental groups
Experimental Elite (EE) and Experimental Novice (EN) showed
significantly higher attention as compared to both the control groups after
the mental imagery training programme.

Analysis
144
Research (Suinn, 1993) has demonstrated that thought content affects
the athlete’s focus of concentration. Angry thoughts, worry, and anxiety
affects heart rate, muscle tension, and respiration rate, which in turn disturbs
the attention and concentration of athletes. The imagery intervention in the
present study having reduced the anxiety of the volleyball players, it must
have calmed their mind and thought processes, thereby improving their
concentration and focus of attention.
However, there was no difference in attention between the two
experimental groups, which indicate that both the experimental groups had
beneficial effect in improving attention following the imagery interventions.
The results of the study with respect to the hypothesis (ii) that there
would be significant effect for the three weeks mental imagery intervention
programme on selected skill performance variables namely, service,
reception, attack and block of volleyball players indicated the following
results:
In case of serve, pass (service reception), and attack, both the
experimental groups Experimental Elite (EE) and Experimental Novice (EN)
showed significantly better performance as compared to both the control
groups (Control Elite and Control Novice). However, there was no
significant difference in serve, pass (service reception) and attack
performance between the two experimental groups, Experimental Elite (EE)

Analysis
145
and Experimental Novice (EN) after the three weeks mental imagery
intervention.
In case of service reception, the Experimental Elite (EE) group
showed significantly better performance as compared to both the control
groups (Control Elite and Control Novice). However, there was no
significant difference in reception performance among the experimental
novice and control groups after the mental imagery programme
The effectiveness of mental imagery in improving the skill
performance may be attributed to the following reasons: mental imagery can
aid performance by enhancing the learning and execution of physical skills.
Mental imagery reinforces nerve pathways that will be used during training
and competition (Castella, 1996). Effectiveness of mental imagery on
performance enhancement has be found in studies by Hall, Rodgers, and
Barr, 1990; Mamassis and Doganis, 2004; and Bakker and Kayser, 1994;
Blair et al, 1993)
In case of beginners or novice sportspersons, mental imagery can aid
in learning skills by helping to develop the appropriate mental blueprint of
the skill (Parker, 2000).
Imagery may strengthen muscle memory, for a task, by having the
muscles fire in the correct sequence for a movement, without actually
executing that movement (Martin et al, 1999).

Analysis
146
The results suggest that the three weeks mental imagery training was
effective in both elite and novice volleyball players in improving their skill
performance as compared to control groups. These results are in consonance
with the previous results obtained by Savoy and Beitel, 2006; Blair, Hall,
and Leyshon, 1993)
The results of the study with respect to the hypothesis that there
would be significant effect for the imagery intervention programmes for all
the four skills (three weeks each) for the total duration of twelve weeks on
selected skill performances variables namely, serve, pass (service reception),
attack and block of volleyball players indicated the following results:
In case of serve, pass (service reception), and attack; both the
experimental groups Experimental Elite (EE) and Experimental Novice (EN)
showed significantly better performance as compared to both the control
groups (Control Elite and Control Novice). However, there was no
significant difference in serve. Service reception and attack performance
between the two experimental groups after the mental imagery programme.
In case of block, both the experimental groups Experimental Elite
(EE) and Experimental Novice (EN) showed significantly better
performance as compared to both the control groups (Control Elite and
Control Novice). However, there was no significant difference in block

Analysis
147
performance between the two experimental groups after the mental imagery
programme.
The above results indicate that there was improvement in selected
skill performances from the beginning (pre test) to the end (after twelve
weeks post test) of the total imagery training programme. Though the
imagery intervention for each skill was only for a period of three weeks, it
was observed that there was significant improvement in performance up to
the end of twelve weeks. As the study having employed the repeated
measures design, the subjects were assigned the three weeks of mental
imagery for the selected four skills in rotation. Not withstanding the above,
it was found that even after the end of the twelve week period there was
significant improvement in all the skill performances of volleyball players.
Though the mode of treatment as per the design can be one of the reasons,
the study results definitely warrants further probing into the retention
capabilities of mental imagery intervention programmes.
Discussion of Hypothesis
With reference to the results obtained from the study, the first
hypothesis that there would be significant effect for the three weeks mental
imagery intervention programme on selected skill performance variables
namely, serve, pass, attack and block of volleyball players is accepted since

Analysis
148
both the experimental groups were effective in improving the performance
in all the selected skills of volleyball players as compared to control groups.
The second hypothesis that there would be significant effect for the
mental imagery intervention programme on selected psychological variables
namely, cognitive anxiety, somatic anxiety and self confidence and attention
of volleyball players for the total duration of twelve weeks is accepted since
both the experimental groups brought about significant improvement in all
the selected psychological skills from the pre to post intervention tests.
The third hypothesis that there would be significant effect for the
imagery intervention programmes for all the four skills (three weeks each)
for the total duration of twelve weeks on selected skill performances
variables namely, serve, service reception, attack and block of volleyball
players is accepted since the results shows significant improvement in all the
selected skill performance after the twelve weeks of imagery training
programme.