Embed Size (px)
Citation preview
I
ANALYSIS OF COPING STRATEGIES IN THE FACE OF
OCCUPATIONAL HAZARDS -
A STUDY OF WHITE COLLAR EMPLOYEES OF
EDUCATION SECTOR IN WEST BENGAL (INDIA)
Doctoral Thesis Submitted
In partial fulfillment of the requirements for the award of the degree of
DOCTOR OF PHILOSOPHY
In
MANAGEMENT
BY
RUPSHA ROY
Under the guidance of
Research Co-Supervisor
Dr. Soumendra Narain Bagchi
Associate Professor
XLRI
Jamshedpur
Research Supervisor
Dr. Bijoya Ganguly
Assistant Professor
ICFAI university,
Jharkhand
ICFAI UNIVERSITYJHARKHAND
RANCHI
SEPTEMBER 2016
II
THESIS COMPLETION CERTIFICATE
This is to certify that the thesis “Analysis of Coping Strategies in the face
of Occupational Hazards - A study of white collar employees of education
sector in West Bengal (India) submitted” by Rupsha Roy in partial fulfilment
of the requirements for the award of the Degree of Doctor of Philosophy is an
original work carried out by her under our joint guidance. It is certified that
the work has not been submitted anywhere else for the award of any other
Degree or Diploma of this or any other University. We also certify that she
complied with the plagiarism guidelines of the University.
Dr. Soumendra Narain Bagchi
Associate Professor
XLRI
Jamshedpur
Co-Supervisor
Dr. Bijoya Ganguly
Assistant Professor
ICFAI University,
Jharkhand
Supervisor

III
DECLARATION OF AUTHORSHIP
I declare that this research thesis titled “Analysis of coping strategies in the
face of occupational hazards - A study of white collar employees of education
sector in West Bengal (India) ”, submitted by me in partial fulfilment of the
requirements for the award of the degree of Doctor of Philosophy in
Management by the ICFAI University, Jharkhand, Ranchi is my own work. It
contains no material previously published or written by another person nor
material which has been accepted for the award of any other degree or
diploma of the university or other institute of higher learning, except where
due acknowledgement has been made in the text. I further state that I complied
with the plagiarism guidelines of the University, while preparing the thesis.
(Rupsha Roy)
ID No. 12JU11300014
Address:
P2/22, Vivekananda Tirtha Complex
Paik Para Road, Narendrapur
Kolkata - 700103
Ranchi
Dated:
IV
ACKNOWLEDGEMENTS
The completion of my research would not have been possible without the
support of many people.
Firstly, I would like to express my sincere gratitude to Dr. Soumendra Narain
Bagchi for guiding and rendering continuous support to my research Work
with immense patience and extensive knowledge in the field of my study. In
this context I express my gratitude to Dr. Bijoya Ganguly for being
instrumental and also motivator for the thesis completion. Their guidance
helped me in all the time for research and writing of this thesis.
Besides my Supervisor, I would like to thank the rest of the ICFAI University,
Jharkhand thesis committee comprising of Prof. O.R.S. Rao for creating a
proactive, caring and supportive environment in the University, Prof. B. M
Singh, and Dr. K.K.Nag, for their insightful comments and encouragement
and Dr. Hariharan for constant motivation and support.
My sincere thanks also goes to Dr. S. C. Swain for sharing his immense
knowledge in research methodology, application of statistical methods using
SPSS and practical experience in conducting research.
V
I will be failing in my duty if I did not mention my gratitude towards all the
academic as well as non-academic staff members of ICFAI University
Jharkhand, who have always gone out of their way to see to it that all my
needs in my Doctoral pursuit are taken care.
I would like to thank my parents for their blessings and also building the
desire to achieve in me and to my friends for supporting me spiritually
throughout writing this thesis and my life in general. I would thank all my
colleagues, my relatives and my teachers for helping me in my pursuit of
excellence.
I would like to give special thanks to the CPP Inc. for permitting me to use the
MBTI Tool for assessment of the personality trait of my respondents.
Last but not the least; I am extremely grateful to all my respondents for their
active co-operation and participation in my research.
(Rupsha Roy)
Date:
Place:
VI
PREFACE
The research presented in this thesis identifies various occupational hazards,
sources of these hazards and also the coping strategies adopted by the
employees of the education sector. It also tries to priotises the sources of the
hazards with respect to the escalation of the impact of the occupational
hazards on the employees. In this research the coping strategies are analysed
on the basis of the parameters that are influencing the employees to adopt a
particular coping strategy.
Objective of the Research Study:
Most of the studies in the sector of occupational hazards have been studied
with respect to the manufacturing sector. Very few have been studied on the
service sector. At least in India the studies in education sector are very few as
a result the health and safety of the academia group is very negligible. West
Bengal being the centre of excellence in academia have very renowned
educational institutes, this research aims to fulfill the following objectives:
Objective 1. To provide the general background to the discussion on
occupational hazards faced by the employee working in white collar jobs in
the Educational sector in West Bengal.
Objective 2. To review and summarize the impacts of these occupational
hazards on the employee’s working in the education sector of West Bengal.
VII
Objective 3. To identify the factors causing occupational hazards to the
employees in the education sector.
Objective 4. To identify and prioritize the sources of these occupational
hazards.
Objective 5. To analyse the coping strategies adopted to cope with the
occupational hazards of the education sector.
Objective 6. To analyse the factors influencing the coping strategies of the
employees facing the occupational hazards in the education sector.
VIII
THESIS LAYOUT
The research thesis has 7 chapters starting with Chapter 1 introducing the
concepts used in the research along with the current scenario of the employees
of the education sector. The definition of the terms like occupational hazard,
coping strategy, education sector and white collar jobs are also explained with
their references in this chapter.
Chapter 2 gives the detailed information of the West Bengal Education Sector.
The Chapter 3 presents the survey of literature and the description of the tools
utilized for this research. Chapter 4 describes the objective and hypothesis of
the research.
Chapter 5 elaborates on the research methodology, giving detailed information
about the population of the research along with the sample studied.
Description of the various tools like MBTI and CSI that are used for the
purpose of fulfilling the objective of the research is given in this chapter. This
chapter also presents the reliability and validity information of the tools used
in this research.
Chapter 6 focuses on analysis and interpretation of the data gathered in this
research along with the statistical tools used to test the hypothesizes
formulated for the purpose of fulfilling the objectives of the research.
IX
Chapter 7 presents the findings, conclusions, recommendations, limitations
and the scope of the research.
X
EXECUTIVE SUMMARY
Working in education sector education sector has traditionally been regarded
as low hazardous occupation. This concept has made a huge migration of
employees from other corporate to the education sector. To some extent in the
historical point of view this idea could be considered as true, but it is not so
with the modern education system. Drawing on a considerable body of
empirical evidences it is argued that during the past decades hazards in the
education sectors have a tendency to increase in all continents. It is generally
agreed that one of the most common determinants of these hazards are the
increasing demand of the employees in the education sector.
The research has been motivated by teachers, administrators and researchers
working in the educational sector to help the policy makers make policies for
the betterment of the living standards of the employees and also improve the
quality of imparting education in India. But for several reasons the researches
on the occupational hazards and coping strategies did not progress much in the
educational sector of India.
An extensive literature review has been carried out in the areas of occupational
hazards in education sector, sources of the occupational hazards, overview of
education sector of West Bengal, Myers-Briggs type indicator and Coping
Strategy Inventory published in International and National journals to identify
the research gaps, which are absence of the study of other hazards apart from
XI
occupational stress in education sector, absence of studies leading to the
factors influencing the coping strategies for these occupational hazards and
identifying the most significant sources causing these hazards in the education
sector of West Bengal. Research objective emanated from the research
problem statement are:
1. To provide the general background to the discussion on occupational
hazards faced by the employee working in white collar jobs in the
Educational sector in West Bengal.
2. To review and summarize the impacts of these occupational hazards on
the employee’s working in the education sector of West Bengal.
3. To identify the factors causing occupational hazards to the employees
in the education sector.
4. To identify and prioritize the sources of these occupational hazards.
5. To analyse the coping strategies adopted to cope with the occupational
hazards of the education sector.
6. To analyse the factors influencing the coping strategies of the
employees facing the occupational hazards in the education sector.
In order to achieve these objectives a set of 22 hypotheses have been
formulated for this study and tested. The research hypothesis are categorised
in three groups.
The First group deals with the impact of occupational hazard among different
age groups, gender, marital status, educational level, earning status, working
modes, working experience, different organisations, different funding
XII
agencies, respondents occupying different positions in the organisation and
different personality traits.
The Second Group tries to investigate the significant predictors of the impact
of occupational hazards.
The Third group deals with variables influencing the different coping
strategies.
Research methodology that is followed is of the type mixed research design in
terms of both qualitative and quantitative research design approach has been
adopted for achieving the objective of the research. The research design is
divided into two phases. Initially the qualitative research method is adopted to
identify the hazards, sources of hazards, coping strategies and factors
influencing the coping strategies amongst the respondents working in the
education sector of West Bengal with the help of “the public voice”. This
phase has been utilized to identify the concepts to develop a conceptual
framework. The qualitative research is used as a precursor to quantitative
method used in phase – 2.
The concepts evolved from the phase – 1 were utilized in developing a
questionnaire for testing the conceptual framework so evolved. The
questionnaire consists of eight sections. These eight sections are to capture
data of demographic details of the respondent, occupational information of the
respondent, personality trait identification, impact of occupational hazard,
sources of occupational hazard, stakeholder related information, task related
information and coping strategy questionnaire.
XIII
The sampling design comprised of data that is used for this research is
collected in two phases.
First phase is the qualitative data, which is collected with the help of
unstructured interview of respondents who faced and agreed to participate in
this research, provided their identity is not disclosed.
The second phase of data was collected from the population of the
academicians in whole of West Bengal belonging to 15 universities, 10
colleges, 5 professional institutes and 10 Schools. A total of 1664 respondents
were approached by sending them the questionnaire through online method
using the online tool (survey monkey), out of which 567 people have
responded. Among these 567 respondents 286 respondents have responded the
questionnaire in full. The rest responded in partial and has to be eliminated
from analysis. The researcher has personally administered to 80 respondents
and collected the data by convenient sampling. Hence the total sample size is
358.
The research instrument used is a well designed questionnaire for converting
the qualitative data into quantitative. Two very popular instruments like the
Myers-Briggs Type Indicator (MBTI) instrument and the Coping Strategy
Inventory (CSI) instrument are used. The MBTI instrument is used to analyse
the personality trait of the respondent and the CSI instrument is used to
analyse the coping strategies adopted by the respondents when faced with
occupational hazard.
XIV
The primary data collected from respondents was edited, coded and analyzed
using IBM SPSS 20.0 software. Pilot survey data is analysed for corrections
and modifications of the questionnaire. Data Analysis is presented in two
sections. Section – I deals with Qualitative Data Analysis and Section – II
deals with Quantitative Data Analysis.
Out of the total 22 hypotheses, 11 were tested using ANOVA test while the
remaining 11 were tested through linear regression analysis. Out of the 11
hypothesis 7 hypotheses were retained since their significant value was below
the cutoff value of 0.05. Three exploratory factor analysis was performed on
the 13 scale items of the sources of occupational hazards, 24 scale items of
stakeholder related concepts and 7 scale items of task related concepts. Two
linear equations were obtained for predicting the impact of occupational
hazard. The first linear equation is to predict the impact of occupational hazard
with the demographic and organisational variables. The second linear equation
is used to predict the impact of occupational hazard with the factors of sources
of occupational hazards, stakeholder concepts and task concepts.
Exploratory Factor Analysis was performed on 13 scale items of the sources of
occupational hazards since multi co linearity existed in the 13 scale items. The
variables were transformed into uncorrelated variables using Principal
Component Analysis (PCA). To yield factors orthogonal rotation was selected.
The final solution had no correlation amongst them. An Eigen value was used
for final factor extraction. The sum of variances of factor values should be
greater than one and that the factor structure should be meaningful, useful and
XV
conceptually sound. Accordingly four factors like entity interface, work
structure, campus work environment and the policies.
Exploratory Factor Analysis was performed on 24 scale items of the
stakeholder related concept, since multi co linearity existed in the 24 scale
items. The variables were transformed into uncorrelated variables using
Principal Component Analysis (PCA). To yield factors orthogonal rotation
was selected. The final solution had no correlation amongst them. An Eigen
value was used for final factor extraction. The sum of variances of factor
values should be greater than one and that the factor structure should be
meaningful, useful and conceptually sound. Accordingly six factors like
transparency in organisation, stakeholder administrative issues, and
stakeholder interface, stakeholder policies, student control and parent control.
Exploratory Factor Analysis was performed on 7 scale items of the task
concept. Since multi co linearity existed in the 7 scale items. The variables
were transformed into uncorrelated variables using Principal Component
Analysis (PCA). To yield factors orthogonal rotation was selected. The final
solution had no correlation amongst them. An Eigen value was used for final
factor extraction. The sum of variances of factor values should be greater than
one and that the factor structure should be meaningful, useful and conceptually
sound. Accordingly 3 factors like task control, task density and task conflict.
The research findings are divided into qualitative data analysis findings and
quantitative data analysis findings. These findings are explained below:-
XVI
Qualitative data analysis Findings:
The first research question was about the existence to the hazard among the
employees of the education sector. On the basis of the in-depth interview it is
very clear that the employees working in the education sector of West Bengal
are not free from the perils of dangers in the occupation. Though the
maximum employees speak of the common hazards like occupational stress,
still the other hazards are burnout, musculo-skeletal disorder, and false
accusation. It was also found that the musculo-skeletal disorder was found
more in primary and secondary schools of West Bengal which are mostly run
by the government of West Bengal.
The second research question was to know what could be the factors of the
hazards. The sources of these hazards as perceived by the employees working
in the education sector are due to no proper organisational or governmental
policies. The management culture or the work culture is also not very
amicable and comfortable. These factors also aggravate the hazards. Another
main source of the hazard is the job itself. Today the job descriptions of the
employees who are working in the education sector are very much different
from what it was earlier. The jobs are not just limited to academics like
teaching, evaluating, assessing and managing the classes. All the activities not
only eat into their time but also keep them into high pressures both physically
as well as mentally. This creates lots of stress in an individual. Moreover in
West Bengal campus violence is quite a common phenomenon. The sources
for the campus violence can be attributed to many reasons. The source for
false accusations could be attributed to organisational politics, difficult teacher
XVII
– parent relationships etc. Apart from the above mentioned sources the other
sources are stakeholder related concepts and task related concepts. The
stakeholder related concepts are stakeholder multiplicity, stakeholder
complexity, and stakeholder interface and stakeholder administration. The task
related concepts are task complexity, task ambiguity and task description.
To the question how these hazards have impacted the majority of the
respondents answered that they had to take the help of medication due to the
stress that incurred in their jobs. Many respondents also complained of
sleeplessness, boredom and also losing interest in their jobs. Few respondents
also complained of the damage that occurred in the relationship with their
colleagues. Few respondents also pointed out on not being able to balance
between their work life and their home life.
The next research question was to how to cope with these hazards. To this the
respondents had a view of adopting multiple coping strategies based on the
phases of the hazards. According to the respondents in the initial phase of the
hazard they normally adopted emotion focused strategy or avoidance
strategies. Some respondents even tried the self-criticism strategies. Few of
them tried to adopt humour strategies to decrease the intensity of the hazard.
But as the intensity of the hazard starts increasing some respondents tend to
lose their patience. This made them adopt the confronting strategies. In spite
of adopting these strategies if the hazard gets aggravated respondents
complained of lot of health related problems like losing appetite,
sleeplessness, nightmares, headaches and fatigues. In this phase of the hazard
most respondents spoke of social support as the common coping mechanism
XVIII
adopted by them. They even tried to adopt problem focused strategy like
seeking support of their higher authorities, management, supervisors and
colleagues. When the impact of the hazard was extensive and respondents felt
totally helpless and unable to cope with the hazard they tried to adopt the
withdrawal strategy or attacking strategy. The withdrawal strategy was in the
form of taking more of sick leaves, avoiding few tasks, coming late to
workplace or intentionally leaving early. When none of the strategies worked
then the respondents aimed to end the hazard by quitting like resigning,
requesting for transfer to different location, department or branch.
The final research question was to analyse the factors that influence the
employees to adopt a coping strategy. To this all the respondents answered
that their personality and their experience helped them to adopt any particular
strategy.
Based on the findings from qualitative analysis we can form the following
theories:
1. Stake holder related concepts, task related concepts, organisational
policies, organisational culture, management issues, job related
variables like job profile, job security etc, relationship with parents,
student handling and control process all contribute to escalate the
occupational hazards among the employees of the education sector of
West Bengal.
2. The hazards impact the employees both physically and mentally.
Physically by causing damage to their health and body and mentally by
XIX
making them too loose interest in their jobs, causing boredom and
fatigue impacting their performance and quality of work life.
3. To cope with these hazards the employees adopt various strategies like
emotion focused, problem focused, self criticism, social withdrawal,
seeking support and if they can’t cope then they exit either by
resigning or re-locating themselves from the place of hazard.
4. To adopt any coping mechanism the employee’s personality trait and
their experience in their jobs influences a lot.
Quantitative data analysis Findings:
The theories formed from the findings of the qualitative phase are tested
through the help of a questionnaire and collecting primary data with his
questionnaire. The findings that emerged from the quantitative data analysis
are as follows:
Initially the impact of occupational hazard was analysed with the demographic
variables like gender, age group, marital status, educational level and earning
status. On analysis with these variables the following findings were obtained:
1. The impact of occupational hazard is not significantly different for
male or female employees. It means that the impact is same as to
making them exhausted sleepless, losing appetite and sometimes even
have to take the help of medicines.
2. When it comes to the various age groups it has been confirmed that
the impact has a significant difference when the employees belong to
different age groups. The employees belonging to higher age groups
XX
are impacted by the hazards more than those belonging to lower age
groups.
3. The marital status has no influence when it comes to the impact of the
hazards on the respondents.
4. In the case of the educational level of the respondents it was found
from the data that the higher the education level the higher is the
impact.
5. When the earning status of the employees with respect to whether they
were the sole earners or shared earners was analysed in context to
impact of occupational hazard it was found from the data that there
was a significant difference in the impact of the hazard on the
individual with respect to their earning status. It was found that the
impact was quite higher for respondents who were sole earners. Where
as in case of shared earners the impact was less. The impact of the
occupational hazard after being analysed with the demographic
variable were analysed with organisational variables like academic
experience, mode of working, type or category of the organisation in
which the respondents are working, the type of funding mode of the
organisation, and also the position held by the respondents in their
organisation. The findings obtained by this analysis are as follows:-
1. The analysis showed that the impact of the hazard has significant
difference among the respondents with different groups of
academic experience. The higher the academic experience the
higher is the impact.
XXI
2. The analysis of the Impact of occupational hazard with respect to
the working mode of the employees revealed a significant
difference in case of employees who are permanently employed
than who are temporarily employed. It has been found from the
data that the employees who are permanently employed are having
high potential of impact compared to temporary employees. As the
temporary employees are quite free to avoid the unpleasant
situations in their jobs either by changing the organisation or by
remaining away from the situation.
3. The analysis or the impact of the hazard with respect to the
organisation type revealed that there is significant difference in the
impact of the hazard of different organisation categories. In West
Bengal the hazard is near to negligible in case of primary schools
and secondary schools. Professors, Associate Professors and
Assistant Professors are entrusted with clerical duties like
maintenance of attendance records, defaulter’s list, evaluation data,
assessment data etc, administrative work, social work, counseling,
mentoring, participation in conferences and workshops, paper
publications, paper corrections, handling examinations, working
with students in their projects and also in private colleges
additional responsibility is given to the professors to get students a
type of marketing job also. Targets are there for all these activities
and pressure is also given on them for these activities.
4. The data analysis has also revealed a significant difference in the
impact of the hazard based on the funding agency of the
XXII
organisations. In West Bengal there are both private and public
players in the organisations belonging to the educational sector.
The school is run by both state government and private
organisations. Even in case of universities in West Bengal there are
universities run by state government, private universities, deemed
universities and also one university run by the central government.
Hence the impacts of the hazards are different for organisations run
by state government or private organisations.
5. There is significant difference in the means of the Impact of
occupational hazards among the respondents working in different
positions in the organisations. The data analysis in this perspective
revealed that higher the position occupied is more prone to the
hazard and hence the impact is also high. It is quite evident that
employees who occupy higher positions in the organisations have
more responsibilities and commitments to their jobs. Hence more
the responsibility more prone to hazards likes stress and burnouts.
One more important finding that was observed from this study is that the
personality trait that emerged as maximum number among the respondents is
extroverted sensing thinking and judging in short it is abbreviated as ESTJ.
Robert Heyward suggests in his personality page that ESTJ’s when they deal
with issues rationally and logically, their primary mode of living is focused
externally. Whereas when they take things via their five senses in literal and
concrete fashion, their secondary mode is internal.
XXIII
The next emerging personality trait is introverted sensing thinking and judging
in short it is abbreviated as ISTJ.
Various researchers have suggested that the careers chosen by people
belonging to ESTJ personality types are Law, Human Resources, and
Training, nursing, management, project management and administration.
Careers chosen by most of people with personality traits of ISTJ are medical,
science, engineering, analysis, accountancy, academia, law, computing, and
project management.
On analysis of the demographic variables and organisation variable the
analysis focuses on the sources of the hazards. Three groups of sources were
identified. They are individual and organisational sources, stakeholder related
sources and task related sources.
The research started with 13 variables of individual and organisational
sources, 24 variables of stakeholder related sources and 7 variables of task
related sources. On applying correlation among these variables it was found
that there was multi-co linearity problem among the variables. So to reduce
the number of variables, factor analysis was done. The factor analysis reduced
individual and organisational variables into 4 factors, stakeholder related
variables into 6 factors and task related variables into 3 factors. So the
research identified a total of (7 + 4 + 3) 14 factors as sources of the hazards in
the education sector of West Bengal. These 14 factors are entity interface,
work structure, work environment, policies, and transparency in organisation,
stakeholder administrative issues, stakeholder interface, stakeholder policies,
student control, parent control, task control, task density and task conflict.
XXIV
These 14 factors were then analysed using a linear regression model. The
model derived the significant sources for the hazards as task conflict, task
control, student control, stakeholder interface, transparency in organisation
and work environment. Hence these sources have a great role to play in either
escalation or de-escalation of the hazards.
After the analysis of occupational hazard and the sources of the occupational
hazard we now focus on the coping strategies adopted by the personnel to
cope with the hazards. A very interesting finding in this case is that the coping
strategies that are adopted by the individual to cope with the occupational
hazard are a combination of multiple coping strategies. As per the theory of
Niedl (1996), Zapf and Gross (2001) the individuals adopt avoidance
strategies in the beginning of the hazards. But the finding of this study says
that most of the individuals adapt to the problem focused strategies. As per the
descriptive statistics the coping strategies with the highest to the lowest means
are in the order of problem solving, cognitive restructuring, social support,
express emotion, wishful thinking, social withdrawal, problem avoidance,
political and self criticism respectively. Coping strategies are basically a
conscious effort to solve problems of both personal and inter-personal nature
to overcome, minimize or tolerate any hazards like stress or conflict. As per
various researches the two main types of coping strategies are emotion and
problem focused coping.
The person adapting emotion focused coping changes their emotional response
to stressors. The coping techniques that are focused on reducing the negative
emotional responses, an individual might experience because of stressors are
XXV
emotional focused coping. Normally the common behaviors that are visible in
the case are like letting off steam by venting to friends and family, to keep the
mind away from the stressors they try to keep themselves busy, also tries to
seek encouragement, moral support, sympathy and understanding from others,
turning to rigorous activities like sports to distract attention from stressors etc.
When People don’t think that their actions can affect the stressor itself they try
to alter their response to the stressor are more likely to adopt emotion focused
coping. Coping strategies belonging to the group of emotion focused strategies
include express emotion, social support, self criticism and social withdrawal.
To avoid the stress responses the stressors are causing individuals try to adapt
to deal with the stressors. This involves finding out the practical ways to deal
with hazardous situations. Some behaviour administered by individuals who
adopt this coping strategy include put other activities on hold in order to
concentrate and cope with the hazards, actively try to remove or work around
the stressor, wait to act until the appropriate time, seek concrete advice,
assistance and information etc. This coping method is more common when
individuals believe that the action can affect the stressor. Coping strategies
belonging to the group of problem focused strategies include problem solving,
cognitive Restructuring, problem avoidance, wishful thinking and political.
After understanding the coping strategies adopted by the individuals the next
analysis was to find the demographic and organisational factors which are
influencing the employee to adopt the particular coping strategy.
On analysis of the demographic variables with the coping strategies it was
found that the variables like gender, age group and educational level of the
XXVI
employees are significantly associated with the coping strategies. To analyse
individually gender is significantly associated with the coping strategy of self
criticism only. Age group of the employees is significantly associated with
coping strategies like problem solving, cognitive restructuring, express
emotion, problem avoidance and self criticism. Educational level is
significantly associated with all the nine coping strategies. Hence we can say
that the factors which enable an individual to adopt a particular coping
strategy are employee’s age and their educational level. Many relations
between personality and coping were stronger in older samples.
On analysis of organisational variable with coping strategies it was found that
the variables like organisation type, the funding agency of the organisation and
the position held by the employees are significantly associated with the coping
strategy adopted by them. Out of these three variables the organisation type is
significantly associated with only one coping strategy that is wishful thinking.
The other two variables like funding agency of the organisation and the
position held by the individual is significantly associated with all the nine
coping strategies.
Many researchers have supported the theory that individuals who were post
graduates, individuals who were in the position of head of the department or
organisation and individuals with greater work experience adopted the
problem focused coping strategies to a greater extent. Another research also
stressed on the fact that the female employees adopted emotion focused
strategies to a greater extent.
XXVII
The study also revealed that the personality trait of an individual has a greater
influence in the adoption of the coping strategy by the individual. Personality
influences coping in many ways. Even prior to coping, personality influences
the frequency of exposure to hazards and also the type of hazards experiences.
We have from theories that neuroticism predicts exposure to interpersonal
stress and tendencies to appraise events as highly threatening.
The research concludes that:-
1. Few of the hazards that are highlighted in this study are burnouts,
campus violence, stress and false accusations. Among them majority
spoke of burnout. According to the respondents the cause for the
burnouts was due to job overload, meeting expectations of
management and peers, students and their guardian’s etc. The
respondents working in schools spoke of musckulo-skeletal disorders
(MSD) due to the board work and furniture’s used in the schools. The
major impacts of these hazards are physical health variables and
psychological variables like fatigue, burnout etc.
2. The highest impact was on health and they had to take medicines for
hypertensions etc. Most of the people complained of sleeplessness,
exhaustion, and boredom and losing interest in the job. Few of them
also complained that such unpleasant situations have damaged their
relationships with their colleagues. According to self reporting the
employees spoke of difficulties in maintaining work – home balance.
3. The respondents perceived of few factors causing the hazards, which
can be grouped into three categories. They are general factors,
XXVIII
stakeholder related concepts and task related concepts. The factors
belonging to the group of general categories are organisational
policies, management issues, job profile, job security, organisational
politics, and student handling, parents and outsiders interactions. The
outsiders are political parties, community etc. The factors belonging to
the stakeholder concepts are stakeholder multiplicity, interface,
complexity, administration and operating paradigm. The task related
concepts involve factors like task ambiguity, task complexity, task
description and task control.
4. The most significant sources of the hazards are task conflict, task
control, and student control, stakeholder interface and campus culture.
Among these the highest in priority is in the order are stakeholder
interfaces, task conflict, student control, and task control and campus
culture.
5. The major and common coping strategies that are adopted by the
employees of education sector were problem solving, cognitive
restructuring, social support and express emotion. Though it was found
from the study that an individual uses a combination of coping
strategies to cope with unpleasant situations in their work, but few
strategies that were mentioned above were commonly used by most of
the employees to cope with their problems.
6. The qualitative analysis revealed that personality trait and experience
in this sector has a major influence on the coping strategies. The
quantitative analysis revealed that personality trait if the employee,
XXIX
funding agency of the organisation, position held by the employee in
the current organisation
Recommendations of this research are as follows:-
1. The research report highlights the major personality type the
respondent’s posses in the education sector. This information can be
used to recruit the respondents in this sector.
2. The report also investigates the different occupational hazards and its
impacts on the respondents facing them. This information can be used
in induction training program to make the new recruits aware of the
problems and consecutive solutions.
3. The research report also priotises the different sources which could
predict the occupational hazards. This information can be used to de-
escalate the impacts of the occupational hazard.
4. The knowledge of health hazards mentioned in this report could help
the policy makers to focus on the health and safety issues of the
respondents working in this sector.
This research contributes the knowledge of the existence of different hazards
in the education sector and also its impacts on different respondents are
different. Since education sector belongs to the service industry the results
could be attributed with other sectors belonging to service industries like
hospital, hotel, banks etc. The research also identifies that the variable which
influence the adoptions of coping strategies. Respondents can be trained in
adopting specific coping strategies for specific hazards to become successful
in their career.
XXX
The research is limited to a very small sample of the respondents working in
the education sector. As a result only one personality trait i.e. ESTJ was in
majority. If the data would have been collected in huge it could have showed
some more personality traits making the analysis rich in content. The language
of the instrument being English major portion of respondents belonging to the
education sector of West Bengal could not comprehend or understand the
meaning. Hence a very large portion of the population could not be
approached for the research. Also this limitation escalated the numbers of non-
response or partially filled questionnaire. Cumulative character of the hazard
develops the impact of the hazard very slowly and after a period of time.
Hence many respondents’ responses were not the exact impacts.
The quest for knowledge, solutions to problems and research questions leading
to improved quality of life is synonymous with progress of human civilization.
Whereas the current research provided answers to the research questions, it
also highlighted its limitations in the previous section. These limitations can
be removed on further research individually in different organisation types.
The extension of this study can be made in other service sectors giving a huge
scope to the researchers to study the service sectors.
1
TABLE OF CONTENTS
Thesis Completion Certificate……………………………………………. II
Declaration of Authorship………………………………………………... III
Acknowledgement…………………………………………………………. IV
Preface……………………………………………………………………... VI
Thesis Layout……………………………………………………………… VIII
Executive Summary………………………………………………………. X
List of Figures…………………………………………………………….. 4
List of Tables……………………………………………………………… 5
1. Introduction…………………………………………………………….. 8
1.1. Overview………………………………………………………………. 8
1.2. Definitions……………………………………………………………... 11
1.2.1. White Collar Employee……………………………………… 11
1.2.2. Occupational Hazard………………………………………… 12
1.2.3. Education Sector…………………………………………….. 13
1.2.4. Coping Strategies……………………………………………. 14
1.3. Research Motivation…………………………………………………… 15
1.4. Purpose of the study…………………………………………………… 17
2. West Bengal Education Sector………………………………………… 19
3. Literature Review………………………………………………………. 25
3.1 Overview……………………………………………………………….. 25
3.2. Occupational Hazard in Education Sector…………………………….. 27
3.3. Sources of Occupational Hazard in Education Sector…………………. 33
3.5. Myers-Briggs Type Indicator (MBTI)…………………………………. 36
3.6. Coping Strategy Inventory……………………………………………... 39
3.7. Findings from the Literature Review………………………………….. 45
3.8. Research Gaps…………………………………………………………. 48
4. Objective and Hypothesis………………………………………………. 50
4.1. Research Problem……………………………………………………… 50
4.2. Research Objective…………………………………………………….. 51
4.3. Research Hypothesis…………………………………………………… 52
2
5. Research Methodology…………………………………………………. 58
5.1. Overview……………………………………………………………….. 58
5.2. Research Design……………………………………………………….. 58
5.2.1. Phase -1……………………………………………………… 58
5.2.1.1. Theme Identification Technique…………………………… 61
5.2.2. Phase -2………………………………………………………. 62
5.3. Population of the Research…………………………………………….. 68
5.4. Sources of Data………………………………………………………… 70
5.5. Research Instrument…………………………………………………… 72
5.6. Pilot Survey Questionnaire……………………………………………. 73
5.7. Final Survey Questionnaire……………………………………………. 75
5.8. Reliability Analysis……………………………………………………. 76
6. Data Analysis and Interpretation……………………………………... 82
6.1. Overview……………………………………………………………….. 82
6.2. Section – I Analysis of Qualitative Data………………………………. 82
6.3. Section – II Analysis of Quantitative Data…………………………….. 89
6.3.1. Demographic Profile of the Respondents……………………. 97
6.3.2. Occupational Profile of the Respondents……………………. 100
6.3.3. Personality Traits of the Respondents……………………….. 102
6.3.4. Analysis of Impact of Occupational Hazards……………….. 104
6.3.5. Analysis of Sources of Occupational Hazards………………. 121
6.3.6. Analysis of Stakeholder Concept……………………………. 124
6.3.6. Analysis of Task Concept……………………………………. 128
6.3.6. Analysing the Relation of Impact of Occupational Hazard
With the Concepts Source of Occupational Hazard, Stakeholder
Concept and Task Concept………………………………………….
131
6.3.7. Analysis of Factors Influencing the Coping Strategies……… 134
7. Conclusion and Recommendation…………………………………….. 158
7.1. Findings………………………………………………………………... 158
7.1.1. Qualitative Data Analysis Findings………………………….. 158
7.1.2. Quantitative Data Analysis Findings………………………… 162
7.2. Conclusions……………………………………………………………. 174
7.3. Recommendations……………………………………………………… 177
7.4. Contributions…………………………………………………………... 178
7.5. Limitations……………………………………………………………... 179
7.6. Scope for Future Research……………………………………………... 181
3
Bibliography……………………………………………………………….. 184
Annexure – I……………………………………………………………….. 191
Annexure – II………………………………………………………………. 203
Annexure – III……………………………………………………………... 206
Annexure – IV……………………………………………………………... 208
Annexure – V……………………………………………………………… 211
Annexure – VI…………………………………………………………….. 212
4
LIST OF FIGURES
Figure 1.1 Education Sector of India…………………………………….. 14
Figure 6.1 Conceptual Frameworks for Research………………………... 89
Figure 6.2 Personality Trait Vs Gender………………………………….. 103
Figure 6.3 Personality Trait Distributions……………………………….. 104
Figure 6.4 Cramer’s V Value of Independent Variables along the Coping
Strategies……………………………………………...............
155
Figure 6.5 Gamma Value of Independent Variables along The Coping
Strategies………………………………………………………
156
Figure 6.6 Somer’s Symmetric Value of Independent Variables along the
Coping Strategies……………………………………………...
156
5
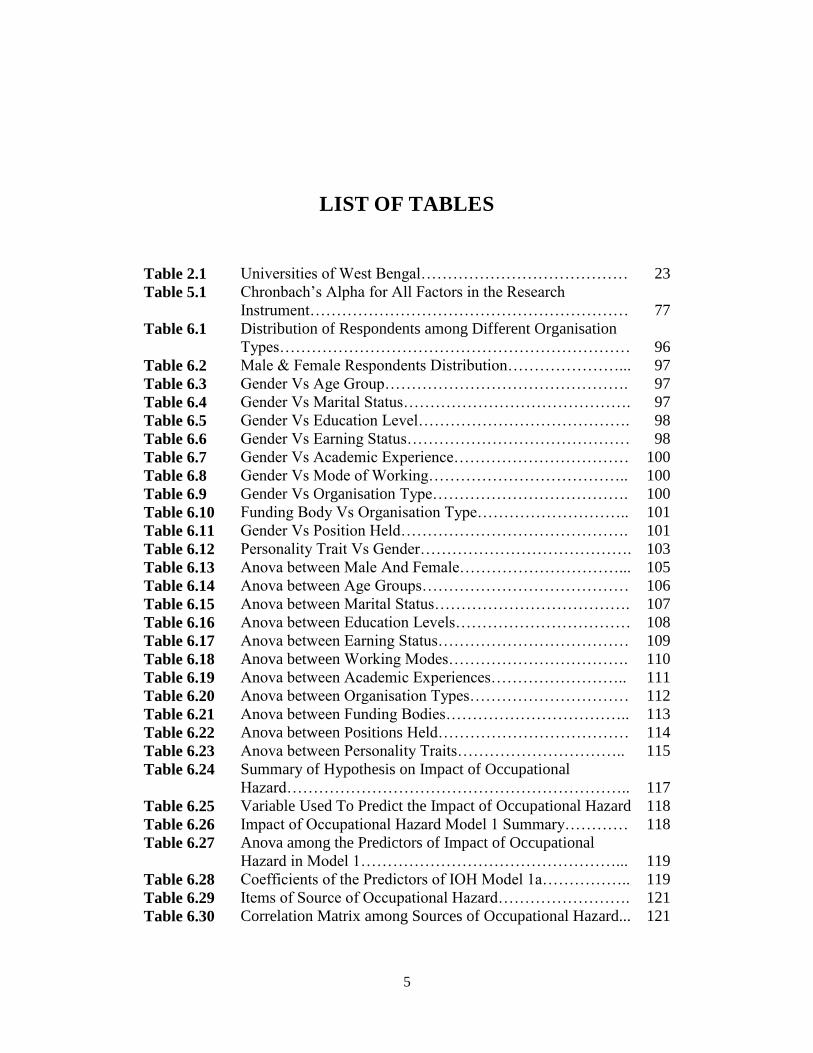
LIST OF TABLES
Table 2.1 Universities of West Bengal………………………………… 23
Table 5.1 Chronbach’s Alpha for All Factors in the Research
Instrument……………………………………………………
77
Table 6.1 Distribution of Respondents among Different Organisation
Types…………………………………………………………
96
Table 6.2 Male & Female Respondents Distribution…………………... 97
Table 6.3 Gender Vs Age Group………………………………………. 97
Table 6.4 Gender Vs Marital Status……………………………………. 97
Table 6.5 Gender Vs Education Level…………………………………. 98
Table 6.6 Gender Vs Earning Status…………………………………… 98
Table 6.7 Gender Vs Academic Experience…………………………… 100
Table 6.8 Gender Vs Mode of Working……………………………….. 100
Table 6.9 Gender Vs Organisation Type………………………………. 100
Table 6.10 Funding Body Vs Organisation Type……………………….. 101
Table 6.11 Gender Vs Position Held……………………………………. 101
Table 6.12 Personality Trait Vs Gender…………………………………. 103
Table 6.13 Anova between Male And Female…………………………... 105
Table 6.14 Anova between Age Groups………………………………… 106
Table 6.15 Anova between Marital Status………………………………. 107
Table 6.16 Anova between Education Levels…………………………… 108
Table 6.17 Anova between Earning Status……………………………… 109
Table 6.18 Anova between Working Modes……………………………. 110
Table 6.19 Anova between Academic Experiences…………………….. 111
Table 6.20 Anova between Organisation Types………………………… 112
Table 6.21 Anova between Funding Bodies…………………………….. 113
Table 6.22 Anova between Positions Held……………………………… 114
Table 6.23 Anova between Personality Traits………………………….. 115
Table 6.24 Summary of Hypothesis on Impact of Occupational
Hazard………………………………………………………..
117
Table 6.25 Variable Used To Predict the Impact of Occupational Hazard 118
Table 6.26 Impact of Occupational Hazard Model 1 Summary………… 118
Table 6.27 Anova among the Predictors of Impact of Occupational
Hazard in Model 1…………………………………………...
119
Table 6.28 Coefficients of the Predictors of IOH Model 1a…………….. 119
Table 6.29 Items of Source of Occupational Hazard……………………. 121
Table 6.30 Correlation Matrix among Sources of Occupational Hazard... 121
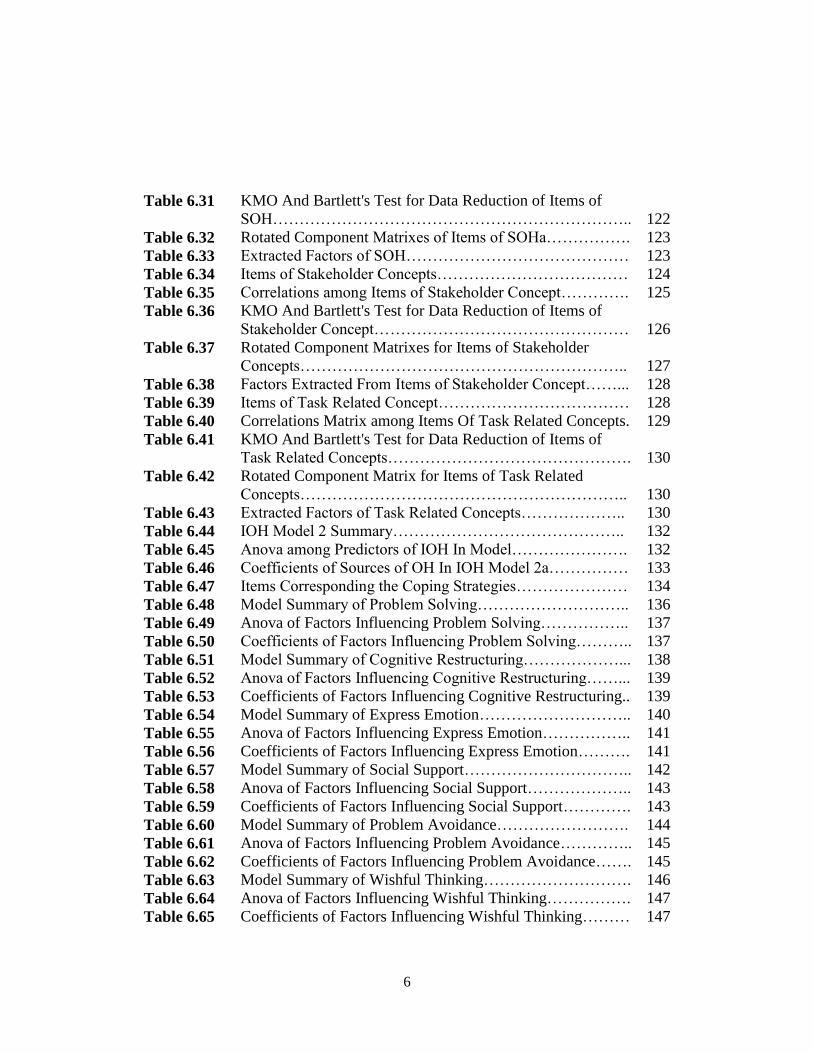
6
Table 6.31 KMO And Bartlett's Test for Data Reduction of Items of
SOH…………………………………………………………..
122
Table 6.32 Rotated Component Matrixes of Items of SOHa……………. 123
Table 6.33 Extracted Factors of SOH…………………………………… 123
Table 6.34 Items of Stakeholder Concepts……………………………… 124
Table 6.35 Correlations among Items of Stakeholder Concept…………. 125
Table 6.36 KMO And Bartlett's Test for Data Reduction of Items of
Stakeholder Concept…………………………………………
126
Table 6.37 Rotated Component Matrixes for Items of Stakeholder
Concepts……………………………………………………..
127
Table 6.38 Factors Extracted From Items of Stakeholder Concept……... 128
Table 6.39 Items of Task Related Concept……………………………… 128
Table 6.40 Correlations Matrix among Items Of Task Related Concepts. 129
Table 6.41 KMO And Bartlett's Test for Data Reduction of Items of
Task Related Concepts……………………………………….
130
Table 6.42 Rotated Component Matrix for Items of Task Related
Concepts……………………………………………………..
130
Table 6.43 Extracted Factors of Task Related Concepts……………….. 130
Table 6.44 IOH Model 2 Summary…………………………………….. 132
Table 6.45 Anova among Predictors of IOH In Model…………………. 132
Table 6.46 Coefficients of Sources of OH In IOH Model 2a…………… 133
Table 6.47 Items Corresponding the Coping Strategies………………… 134
Table 6.48 Model Summary of Problem Solving……………………….. 136
Table 6.49 Anova of Factors Influencing Problem Solving…………….. 137
Table 6.50 Coefficients of Factors Influencing Problem Solving……….. 137
Table 6.51 Model Summary of Cognitive Restructuring………………... 138
Table 6.52 Anova of Factors Influencing Cognitive Restructuring……... 139
Table 6.53 Coefficients of Factors Influencing Cognitive Restructuring.. 139
Table 6.54 Model Summary of Express Emotion……………………….. 140
Table 6.55 Anova of Factors Influencing Express Emotion…………….. 141
Table 6.56 Coefficients of Factors Influencing Express Emotion………. 141
Table 6.57 Model Summary of Social Support………………………….. 142
Table 6.58 Anova of Factors Influencing Social Support……………….. 143
Table 6.59 Coefficients of Factors Influencing Social Support…………. 143
Table 6.60 Model Summary of Problem Avoidance……………………. 144
Table 6.61 Anova of Factors Influencing Problem Avoidance………….. 145
Table 6.62 Coefficients of Factors Influencing Problem Avoidance……. 145
Table 6.63 Model Summary of Wishful Thinking………………………. 146
Table 6.64 Anova of Factors Influencing Wishful Thinking……………. 147
Table 6.65 Coefficients of Factors Influencing Wishful Thinking……… 147
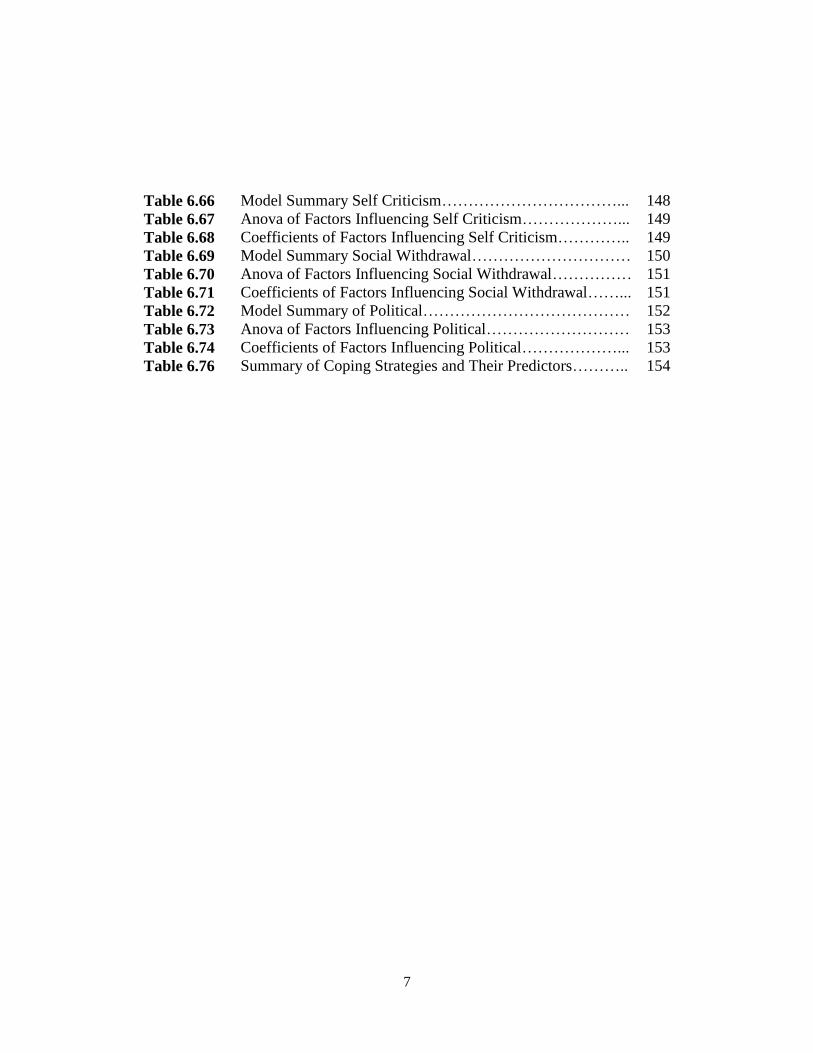
7
Table 6.66 Model Summary Self Criticism……………………………... 148
Table 6.67 Anova of Factors Influencing Self Criticism………………... 149
Table 6.68 Coefficients of Factors Influencing Self Criticism………….. 149
Table 6.69 Model Summary Social Withdrawal………………………… 150
Table 6.70 Anova of Factors Influencing Social Withdrawal…………… 151
Table 6.71 Coefficients of Factors Influencing Social Withdrawal……... 151
Table 6.72 Model Summary of Political………………………………… 152
Table 6.73 Anova of Factors Influencing Political……………………… 153
Table 6.74 Coefficients of Factors Influencing Political………………... 153
Table 6.76 Summary of Coping Strategies and Their Predictors……….. 154
8
CHAPTER – 1
1. INTRODUCTION
1.1. OVERVIEW:
Education Scenario in West Bengal is in news always for reasons which are
highly unacceptable to the culture and belief of the education sector of West
Bengal. West Bengal is always considered as the cradle of Indian renaissance and
national freedom movement. It is also considered as a land of intellectual
awakening.
West Bengal is in fact the home, of four Nobel Laureates like Ronald Ross,
Rabindranath Tagore, Mother Theresa and Amartya Sen and great scientists like
Jagdish Chandra Bose. Bengal is credited for being the first to establish a
University and Medical College based on western concepts. West Bengal is
considered as the land of poet-philosopher Rabindranath Tagore, the land of great
saint Swami Vivekananda, Bengal has a rare beauty steeped in culture and
scholasticism where the past still looms over the present with the legacy still
lingering on.
9
It is common knowledge that the province of Bengal, undivided till 1947, and
then the state of West Bengal, has played a leading role in the country in
spreading education at all levels, beginning with mass education and culminating
in higher, professional and specialised education.
West Bengal’s academic atmosphere is very much ideal for any types of
intellectual pursuits and scientific quest. West Bengal is popular for its original
ideas. But it is really unfortunate that this is vanishing very fast. We are now
frequently hearing the stories of talents moving to other states, interference of
political parties, mediocrity regimes, also standards going down, disrepair and
deterioration of laboratories and classrooms as well as huge financial crisis in the
education sector. Among all states the rank of Bengal with respect to the overall
literacy rate, gross enrolment ratio, drop-out rates etc are dropping down quite
vigorously. (Sarkar, 2004).
Very recently there are frequent recurrences of student’s confrontation in
educational institutes of West Bengal. Students have become quite disrespectful
to teachers and do not hesitate to insult or injure them. To all this we can say that
today’s education in Bengal is suffocating. It lacks fresh thinking as to how to
rejuvenate the sagging morale and spirit of the teaching community, students and
their worried parents.
The past three decades has visualized the whole process of bagging an academic
job and getting promotion through the standard ladder had lots of procedural
deficiencies. The college and school service commissions were created to bridge
10
the 'trust deficit', still there are rising huge questions on the selection of experts
and the subjective basis of selection of candidates. There are practically no
standard criteria to determine placement and transfer of teachers from one school
or college to the other school or college. A teacher is not independent in his
academic life as transparency is completely lacking in the system. Many
individuals who are striving for becoming a teacher in this sector are focusing
more on influences and patronage of those who play important role in this process
rather than their talents.
It is quite evident that based on the teacher’s devotion to their work and the
students sow the seeds of the adequate attitude and respect of students towards
their teachers as well as education system as a whole. Knowing the process of the
selection of teachers, one can very much suspect the degree of such devotion to
teaching of the present teaching community. In recent periods, students are not
only confronting each other over filing of election papers but are also directly
heckling the teachers-in-charge. This shows an extreme form of disrespect and
hatred toward today’s teachers. The future development of Bengal depends
largely on the quality and quantity of the students. Bengal should in fact bring out
provisions to disengage students from such harmful activities and for good human
capital.
11
The definitions of the key word used in the title of the topic are given in the
following sub-sections.
1.2. DEFINITIONS:
1.2.1. WHITE COLLAR EMPLOYEE:
Novelist Upton Sinclair is credited for coining the term white collar. He used the
term white collar to refer to any sort of clerical or administrative work. The term
was used as early as 1911 and in 1923 it was used in Wall Street Journal. ‘White
collar’ dress is generally worn by individuals whose job doesn’t require strenuous
physical labor. Sinclair’s version also refers to the dress code. In 19th
and 20th
centuries male office workers wore shirts with white collars. Usually people who
did white collar jobs were salaried employees where as blue collar people
received hourly wages. The most popular white collar jobs are Doctor, Manager,
Lawyer, Professor, Teacher, CEO etc. (Berger, 2013).
Employees doing White collar jobs usually perform their duties in an office
setting. They are highly skilled and formally trained professionals. Accountants,
bankers, attorneys and real estate agents also belong to the white collar
employees, provide professional services to clients. The other white collar
professions include engineers and architects, service providers to businesses,
corporations and government agencies. People should possess formal education to
be eligible to do white-collar jobs. The minimum qualification for any white-
collar employees should be least a high school pass out. The most adequate
qualifications are bachelors, masters or professional degrees. Since the education
12
level is very important for and entry level position also, so people in the white-
collar professions generally get high salaries. (Scott, 2015)
Teachers are considered white collar workers. They obtain a formal education in
college, and then take positions in elementary or secondary education after
graduation. Teachers are involved in teaching children a variety of subjects such
as math, science and history. Most teachers that work in high schools often
specialize in a specific subject area like English. (Suttle, 1999)
The communities of teachers, researchers and administrators of the education
sector have been considered as white collar professions.
1.2.2. OCCUPATIONAL HAZARD:
As per the Collins dictionary occupational hazard is something unpleasant that
you may suffer or experience as a result of doing your job or hobby. The Ontario
Ministry of labour, claims that occupational illness, normally develops over a
period of time because of workplace conditions. Under the occupational health
and safety act, the condition that results from exposure in a workplace to a
physical, chemical or biological agent to the extent that it affects the normal
physiological mechanisms and the worker’s health is impaired is called as
occupational illness.
Occupational hazards can be categorized into various types like physical,
chemical, biological, mechanical and psychological. For the purpose of research
main focus is given on the physical and psychological hazards which creates
13
exhaustion, injury, lack of job satisfaction, insecurity, poor interpersonal relation,
work pressure, ambiguity, aggressiveness, anxiety, depression etc. in employees
and changes their behavior.
1.2.3. EDUCATION SECTOR:
Form of learning in which the knowledge, skills, and habits of a group of
people are passing on from one generation to the next through teaching,
training, or research is called an education. Education is an independent
industry which challenges orthodox thinking.
Education sector has seen a host of reforms and improved financial outlays in
recent years that could possibly transform the country into a knowledge haven.
In the overall development of the country human resource is increasingly
gaining significance, hence the key focus of the current decade should be
development of education infrastructure. In this scenario, infrastructure
investment in the education sector is likely to see a considerable increase in the
current decade
In global education industry India is holding an important place. The country has
more than 1.4 million schools with over 227 million students enrolled and more
than 36,000 higher education institutes. India is credited to hold the largest higher
education systems in the world. (INDIA BRAND EQUITY FOUNDATION,
2015)
14
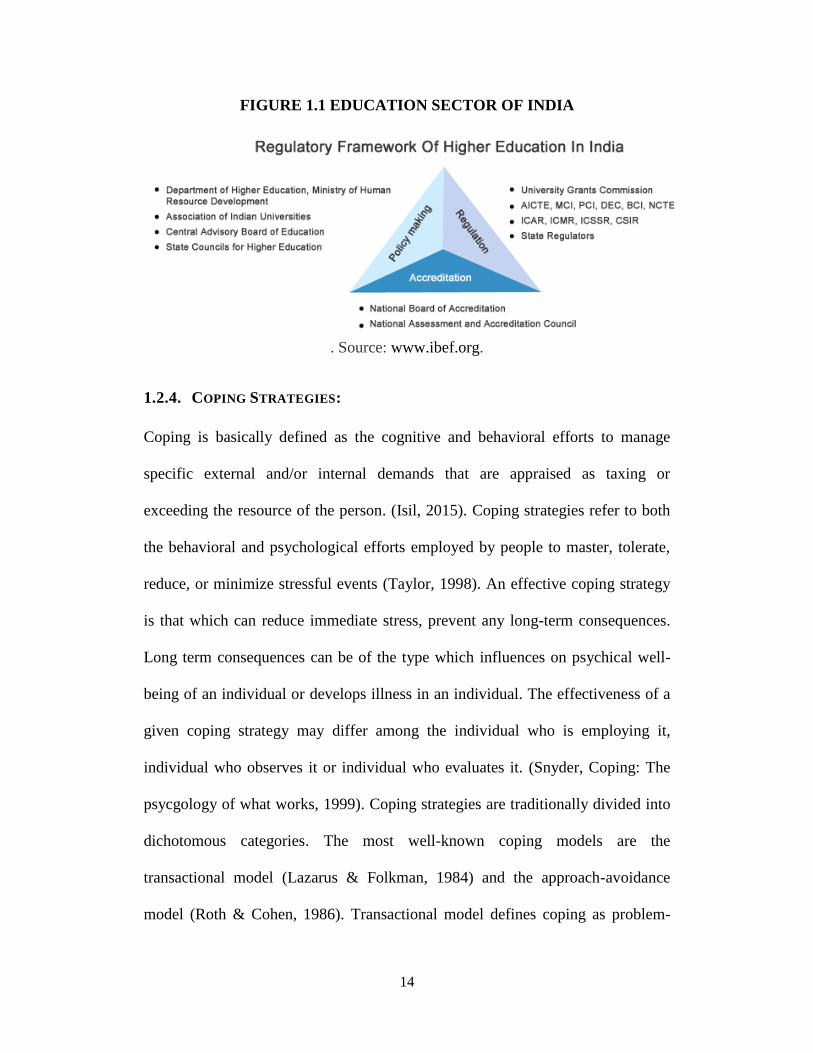
FIGURE 1.1 EDUCATION SECTOR OF INDIA
. Source: www.ibef.org.
1.2.4. COPING STRATEGIES:
Coping is basically defined as the cognitive and behavioral efforts to manage
specific external and/or internal demands that are appraised as taxing or
exceeding the resource of the person. (Isil, 2015). Coping strategies refer to both
the behavioral and psychological efforts employed by people to master, tolerate,
reduce, or minimize stressful events (Taylor, 1998). An effective coping strategy
is that which can reduce immediate stress, prevent any long-term consequences.
Long term consequences can be of the type which influences on psychical well-
being of an individual or develops illness in an individual. The effectiveness of a
given coping strategy may differ among the individual who is employing it,
individual who observes it or individual who evaluates it. (Snyder, Coping: The
psycgology of what works, 1999). Coping strategies are traditionally divided into
dichotomous categories. The most well-known coping models are the
transactional model (Lazarus & Folkman, 1984) and the approach-avoidance
model (Roth & Cohen, 1986). Transactional model defines coping as problem-
15
focused and emotion-focused. Approach-avoidance model describes coping
strategies of the type of either approach or avoidance category. The most
important aspect in both these models is individual’s consideration as to whether
they have the resources for a solution to the given situation. In the approach-
avoidance model, the individual considers whether they have the resources for
coping with the situation and subsequently chooses either the approach mode
which focuses on a direct solution to the problem, or the avoidance mode (Roth &
Cohen, 1986).
1.3. RESEARCH MOTIVATION:
We all are aware that every occupation has its own perils and dangers and
occupations in education sector is no exception. But the hazards in the education
sector especially in teaching profession are quite peculiar in nature as few are
overt and few are covert. The overt hazards are those which are quite visible like
disease transmission, physical injury due to violence, voice problem etc. The
covert hazards are more of psychological than physical. Also the hazards are
mostly of cumulative character than immediate. The effect of these hazards is
very slow in developing and takes a time period to make them felt. Since they do
not impact immediately hence most of the time they are imperceptible.
Being a teacher has rewards that no other jobs can boast. Due to these rewards
there is a frequent migration of personnel to teaching profession from other jobs.
Teachers take the pleasure of helping their students to discover their skills and
16
ability, which will in turn take the students to the peak of success. But this joy of
teaching comes with the hazards. Data collected by the U.S. Bureau of Labour
statistics have found out that there were 169 fatalities in the year 2010 among
employees belonging to teaching sector. (Morgan, 2016).
Research and discussion on occupational hazards in India started from 1965-66 by
the establishment of National Institute of occupational Health (1966) and
Industrial Toxicology research centre (1965) and is rapidly increasing. A
considerable number of articles have been written on the topic of occupational
hazard in agricultural sector, chemical sector, coal sector etc. Very few have
focused on the education sector. The current research is aimed to identify the
factors affecting the coping strategies adapted by the employees of the education
sector to cope with the occupational hazards. Initially qualitative study is done to
identify the factors affecting the coping strategy. Then based on these factors
questionnaire is designed to establish the hypothesis.
The Research questions for this research are:-
RQ1: What are the hazards faced by the employees working in the education
sector?
RQ2: What could be the sources for these hazards?
RQ3: How do these hazards impact the employees?
RQ4: Which sources are more instrumental in creating occupational hazards?
17
RQ5: What coping strategies are adopted by the employees facing the hazards
in the educational sector?
RQ6: What are the factors that influence the employees to adopt the coping
strategies?
1.4. PURPOSE OF THE STUDY:
The education system as practiced in India has given rise to a number of issues,
the major one being the problems faced by the employees engaged in imparting
the education to the student community of India. However, the policy makers and
the researchers have neglected this field. The Government policies are tailored to
enhance the education of children both in primary education as well as the higher
education system. But very few of the policies focus on the employees involved in
imparting this education as a whole. These employees or academicians are
basically the teachers of schools or institutes, professors of colleges and
universities, researchers, administrators and head of the educational Institutions.
Therefore, the issues of academicians have always been a neglected field in India.
The numbers of academicians working in the country are numerous. However, the
problems of academicians have hardly been the focus of empirical studies. Hence,
here an attempt is made to study the occupational hazards, its impacts, sources of
these hazards and coping strategies used by academicians. The present
18
investigation is an introductory study to analyse the occupational hazards, its
sources and the coping strategies adopted by the academicians of West Bengal.
Hence the aim of the study is: To analyse the impact of occupational hazards,
sources of occupational hazards, and coping strategies of occupational hazards
among the academicians of West Bengal.
19
CHAPTER – 2
2. WEST BENGAL EDUCATION SECTOR
West Bengal education sector consists of both the public as well as the private
players. British missionaries and the Indian social reformists have developed the
modern education system. West Bengal is famous for many reputed institutes of
higher education. Among them are Amity University, Indian Institute of
Management(IIM) Calcutta is actually the first IIM in India which was set up in
1961 at Joka and also it was the first national institute for post-graduate studies
and research in management sciences. Indian Institute of Technology (IIT)
Kharagpur is also the first IIT in India. Bengal Engineering and Science
University is the second oldest engineering institution in India. Presidency
College, Indian Institute of Science Education and Research, Kolkata, National
Institute of Technology, Durgapur, Indian Statistical Institute and Visva-Bharati
University are other reputed educational institutes in West Bengal.
The capital of West Bengal, Kolkata has always played a pioneering role in the
development of the modern education system in India. This was also the city
through which western models of education came to India. Sir William Jones
noted philologist has established the Asiatic Society in 1784 for promoting
oriental studies. 1800 had seen the establishment of The Fort William College and
20
In 1817 The Hindu College was established. The Hindu College was renamed as
the Presidency College in 1855. The Sanskrit College was established in 1824.
The Scottish Church College in Calcutta was formed by the merging of the two
institutions General Assembly's Institution, established by Reverend Alexander in
1830 and the Free Church Institution established in 1844. La Martini ere
Calcutta was established in 1836. The Bethune College for girls in Calcutta was
set up by John Bethune in 1879. This was the time women's education was
frowned upon in the society. The oldest medical school in Asia, the Calcutta
Medical College was set up in 1835. In 1857, a fully fledged multi-disciplinary
university was established in South Asia, which is popularly known today as
The University of Calcutta. It was modeled on the lines of the University of
London. In 1856 technical and engineering education came with the establishment
of a civil engineering department. This setup went through various
reorganisations to finally become the Bengal Engineering College in 1921.
The Jesuit administered St Xavier's College was established in 1860. In 1906,
the partition of Bengal led to widespread nationalistic and anti British feelings.
This led to the setting up of the National Council of Education, Bengal. This later
on became the Jadavpur University in 1955. Jadavpur University is also credited
to become the first to introduce chemical engineering and numerous other
interdisciplinary studies in India
Post independence has seen Kolkata to be in the forefront of the educational
scenario. In 1951 The Government College of Art & Craft was established.
Another university, offering courses in fine and performing arts was established in
21
1962 called The Rabindra Bharati University. The country's first management
institute and is also the first in the country to offer an MBA degree of a university
was set up in 1953 under the name of The Indian Institute of Social Welfare and
Business Management. In 1960 the Regional Engineering College which is
presently called as National Institute of Technology (NIT) was set up at
Durgapur. It is the oldest and also amongst the top NITs in India.
West Bengal schools are run by both the state government or by private
organisations, including religious institutions. Instruction is mainly in English or
Bengali, though Urdu is also used, especially in Central Kolkata. The secondary
schools are affiliated with the Council for the Indian School Certificate
Examinations (CISCE), the Central Board for Secondary Education (CBSE), the
National Institute of Open School (NIOS) or the West Bengal Board of Secondary
Education. Under the 10+2+3 plan, after completing secondary school, students
typically enroll for 2 years in a junior college, also known as pre-university, or in
schools with a higher secondary facility affiliated with the West Bengal Council
of Higher Secondary Education or any central board. Students choose from one of
three streams, namely liberal arts, commerce or science. Upon completing the
required coursework, students may enroll in general or professional degree
programs. Up to March 2000, the number of primary schools was 52,385 in West
Bengal. (Siraj, 2003).
The higher education sector in West Bengal is currently in a significant expansion
mode. In West Bengal there are one central university, twenty four state
22
universities, seven private universities and one deemed university. West Bengal
Council of Higher Education (WBSCHE) , established in 1994 has taken plenty of
new initiatives in order to enhance the quality of higher education in West Bengal,
introduction of academic auditing in universities, planning for common entrance
tests for admission in post graduate courses in university, formation of expert
committees for various academic activities, helping the government with setting
up of new universities, drafting private university bill, advising the amendment of
West Bengal Universities Act, Presidency University Act etc. (Dasgupta, 2013).
The list of along with their location, type and specialization in shown in table 2.1
in the next page.
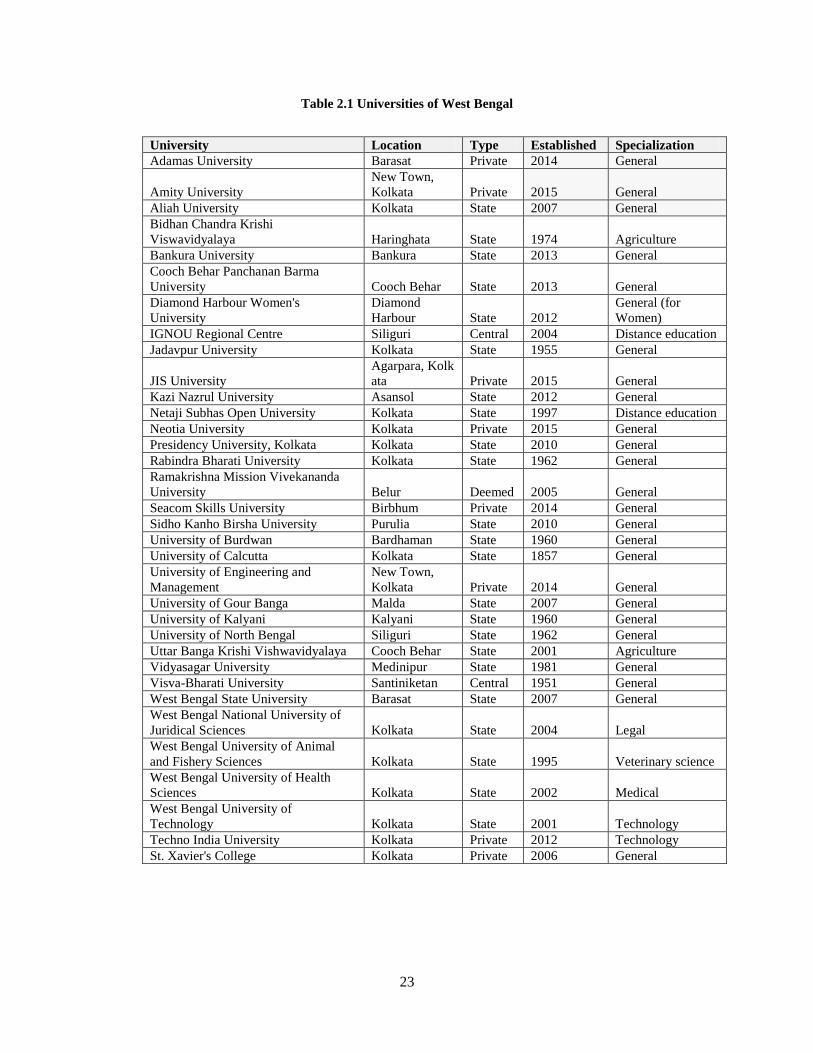
23
Table 2.1 Universities of West Bengal
University Location Type Established Specialization
Adamas University Barasat Private 2014 General
Amity University
New Town,
Kolkata Private 2015 General
Aliah University Kolkata State 2007 General
Bidhan Chandra Krishi
Viswavidyalaya Haringhata State 1974 Agriculture
Bankura University Bankura State 2013 General
Cooch Behar Panchanan Barma
University Cooch Behar State 2013 General
Diamond Harbour Women's
University
Diamond
Harbour State 2012
General (for
Women)
IGNOU Regional Centre Siliguri Central 2004 Distance education
Jadavpur University Kolkata State 1955 General
JIS University
Agarpara, Kolk
ata Private 2015 General
Kazi Nazrul University Asansol State 2012 General
Netaji Subhas Open University Kolkata State 1997 Distance education
Neotia University Kolkata Private 2015 General
Presidency University, Kolkata Kolkata State 2010 General
Rabindra Bharati University Kolkata State 1962 General
Ramakrishna Mission Vivekananda
University Belur Deemed 2005 General
Seacom Skills University Birbhum Private 2014 General
Sidho Kanho Birsha University Purulia State 2010 General
University of Burdwan Bardhaman State 1960 General
University of Calcutta Kolkata State 1857 General
University of Engineering and
Management
New Town,
Kolkata Private 2014 General
University of Gour Banga Malda State 2007 General
University of Kalyani Kalyani State 1960 General
University of North Bengal Siliguri State 1962 General
Uttar Banga Krishi Vishwavidyalaya Cooch Behar State 2001 Agriculture
Vidyasagar University Medinipur State 1981 General
Visva-Bharati University Santiniketan Central 1951 General
West Bengal State University Barasat State 2007 General
West Bengal National University of
Juridical Sciences Kolkata State 2004 Legal
West Bengal University of Animal
and Fishery Sciences Kolkata State 1995 Veterinary science
West Bengal University of Health
Sciences Kolkata State 2002 Medical
West Bengal University of
Technology Kolkata State 2001 Technology
Techno India University Kolkata Private 2012 Technology
St. Xavier's College Kolkata Private 2006 General
24
A news analysis published in one of the most popular magazines (Dey A. , 2015)
claimed that frequent campus violence, mass copying, irregularities in admission
procedure, frequent student protest over trivial matters are plaguing West
Bengal’s once reputed educational institutions that have at one time produced
some of India’s best known faces, both leaders and scholars. One of the states
prestigious institutions remained the epicenter of a massive student agitation that
led to the unprecedented step of its vice chancellor being asked to step down by
none other than the Chief Minister herself. As educationist and former vice
chancellors blamed political interference, especially by the ruling party for the
“anarchy” they also claim the students were acquiring a tendency to agitate for
“anything and everything”.
When and where all this educational anarchy will end no one knows, but
increasingly talented young people with some means are leaving the state to find
better and more conducive educational and job opportunities outside the state as
West Bengal rapidly assumes the reputation of a failed state amongst its own
people.
25
CHAPTER – 3
3. LITERATURE REVIEW
3.1 OVERVIEW:
Employees working in education sector has traditionally regarded as low
hazardous occupation. In historical point of view it could be true but it is not so in
modern era. (Teichmann, Sources of occupational stress in technical university
academics, 2010). Most of the studies in this area are focused on the occupational
stress. Drawing on a considerable body of empirical evidence, it is argued that
during the past decade stress among university academics has tendency to
increase in all continents. The education sector in most developing countries is
largely growing and includes employers with widely varying organisation cultures
and involves high risk exposures. (Venebles & Allender, 2006) . Despite its risk
and complexity, little has been written about the occupational health needs of this
employment sector. The occupational health needs means not only information
about the hazards, but also other information for planning for provision for
occupational health for this sector.
26
Only limited number of relevant guidance documents has been published. The
United Kingdom Health and Safety Commission published guidance on
occupational health services in universities in 1991. (HMSO, 1991). The
Department for Education and Employment in the UK has published guidance on
fitness to teach, which although focused on primary and secondary education has
relevance to higher education.
Computerized searches were carried out for published papers with key words like
“Occupational Hazard”, “Hazards in Education Sector”, “Coping Strategies”,
“Sources of Occupational Hazards”, “Occupational Health in universities”,
“Problems faced in Teaching profession”, “Problems faced by university
professors”, “White Collar Jobs”, Hazards in White Collar Professions”,
“Universities”, “Education Sector” and “Problems in Schools and Colleges in
West Bengal”. On in-depth study of the relevant articles on the topics were
retained. Of the 1045 papers identified in initial search only 48 were retained for
the final review. The literature review is then divided into the 5 sections i.e.
Occupational Hazards in Education Sector, Sources of Occupational Hazards,
Overview of West Bengal Education Sector, Myers-Briggs Type Indicator
(MBTI), and Coping Strategy (CS).
27
3.2. OCCUPATIONAL HAZARD IN EDUCATION SECTOR:
To understand the occupational hazards in the education sector, we need to first
understand the various tasks or jobs that are handled by the employees working in
the education sector. Mostly the employees working here are in the job of
teaching, evaluating and managing the academics of the organisation. Especially
In teaching employees spend much of their time in delivering lessons, reading
aloud and directing students. The tasks involved in these professions are teaching,
preparing of lessons, evaluating student’s assignments and exercises, carrying out
guidance and counseling work, performing non-teaching clerical duties like
recording, data maintenance etc., preparing for school reviews, participating in
continuing professional development, satisfying the requests of stakeholders like
management, students, guardians, approving bodies, government agencies etc.
They also head Institutions, Departments, and take charge of library, computer
labs and workshop, maintain student discipline both inside and outside the
classroom and also train students in different sports. They also accompany
students to field visits and other trips. As a result the employees working in this
sector might suffer from both physical and mental health due to variety of job
functions and frequent overtime. While performing these tasks they face lot of
situations which might lead to unpleasantness, anxiety or even damage them
sometimes physically or mentally. Then we term those dangers or problems or
situations as occupational hazards. (Wikipedia, 2016). A research published in the
journal of speech, language and hearing in 2004 reported 11% of teachers having
28
current voice disorder and nearly 58% of teachers having a history of voice
disorder in America. Hence this problem of voice dysfunction interferes with job
dissatisfaction, performance and attendance causing 18% of teachers to miss work
and about 40% of them to limit classroom activities. (Nelson Roy, 2013). In a
research article published in BMC public health, concluded that neck shoulder
pain and lower back pain are very common among the teachers of China. There
were strong associations with different individual, ergonomic and occupational
factors. (Pengying Yue, 2012).Most of the studies both in India and outside India
showed that the employees working in this sector are subjected to heavy
occupational stress that could adversely affect their mental health status. (Chan,
1998). In addition to occupational stress employees working in the education
sector in the course of their career also faced physical health problems that were
caused or worsened by their jobs as well as past work. Elaine Y.L. Chong and
Allan H.S.Chan in their article have identified three main types of occupational
health problems in teachers were voice problems, musculoskeletal disorders and
contact dermatitis in schools of Hong Kong. (Chong & Chan, 2010). N.
Barkhuizen and N. Barkhuizen in their article have identified the indicators of the
occupational stress for academic staff in South African higher education
institutions. (Barkhuizen & Rothmann, 2008). There is now overwhelming
evidence attesting to what many academics has known for years, academia is
highly stressful occupation. In fact academia throughout the world deals with a
substantial amount of ongoing occupational stress. Ironically university teaching
has traditionally been conceived as a relatively stress free occupation. (Fisher S. ,
29
1994).Although they are not highly paid in comparison to other industrial sectors,
academics have been envied for their tenure, light workloads, flexibility perks and
freedom to pursue their own research. (Gillespie, Walsh, Winefield, & Stough,
2001). However with many of these attractions and advantages, it comes as no
surprise that higher education institutions are now commonly labeled as “Stress
Factories”. (Barkhuizen & Rothmann, 2008). The working environment exposes
many teachers to health hazards and leads to injuries in vocal cord, respiratory
diseases, and cancer, and musculoskeletal disorder, mental and neurological
illness. The science of ergonomics and occupational health and safety was
adopted and became useful in United State of America in the late 1960’s by
occupational health and safety administration (OHSA) after a policy called
compensation safety establishment. In Ghana the health and safety of all
employees in various occupational sectors and professions are supported by
Ghana Labour Act 2003. Act 651 is to ensure that employees are not exposed to
conditions that would lead them to work related injuries or illness. Teaching
occupation has got several ergonomics and occupational health hazard. Most
teaching staff spend most of their working hours each day on their feet teaching or
lecturing due to the seating arrangement in the classroom, or lifting and handling,
working with computers or inhaling certain chemicals from a laboratory are also a
greater risk of health problems including varicose vein, poor circulation of air,
painful swelling in feet and leg, foot problems, joint damage, low back pain, heart
and circulatory problems. (Hayford, 2014). Any incident where an employee or
employer is abused, threatened or assaulted in situations related to their work can
30
be termed as violence at work. Employees from organisations within the
education sector like universities, schools, colleges, and professional institutes
etc. may be exposed to violence at work due to stakeholder aggression like
aggression from students, guardians, family members, friends etc., robbery,
occupational violence like bullying, sexual harassments, assaults etc.,
opportunistic violence i.e. violence committed for the sake of violence.
Workplace violence can have significant impact on health, safety and welfare of
employees and students. Educational institutions can also suffer as a result of lost
productivity, loss of morale among staff and students, community dissatisfaction,
and increase legal costs. Workcover Corporation has developed guidelines for
reducing the risk of violence at work. The guidelines are designed to assist
workplaces to identify the potential for violence and provide practical guidance
for the development of prevention strategies. (Workcover Corporation, 2002).
Violence in educational campus is neither a new phenomenal word nor incident.
Rather to be more specific this has become a regular and problematic practice in
developed western countries also. But the character, nature and dimension of
these violent incidents in the western countries are completely different from the
one that is faced by Indian education campuses. The reason of these differences is
Indian’s attitude, value and belief system is totally asymmetrical in comparison to
western countries. Student politics and campus violence have become quite
synonymous with the college life in West Bengal from last decade itself. Still the
31
memories of Naxalbari Movement are alive in everyone’s mind in West Bengal.
But from 1970, violence started to haunt with the State with a tinge of idealism.
From 2010 onwards West Bengal started to visualize a new phase of campus
violence. The new type of violence was only created to take hold of the position
in the campus. It has nothing to do with any ideology, or any agitation for the
benefit or development of the student of for introduction of any learning system.
Prof. Abirup Sarkar rationalized this in one of his interview with Deccan Herald
on 15-10-13, that, “Actually, winds of Political Changes are blowing in the State,
and that is why there is this increase in Campus Violence”. Some scholars even
termed it as “criminalization of Student-Union politics”. This caused situations
where teachers and principals were beaten and sometime were forced either to
promote a student who has failed or to excuse students, who are alleged with the
blame of ragging. These are the prime causes why the violence in campus of
educational institution has recently become a burning issue and draws special
attention of the researchers as well as of the conscious members of the Civil
Society. Under this social and philosophical basis we need to put light on the
growing trends of campus violence, especially in West Bengal, where the violent
campuses have become an essential part of the daily news, in print and electronic
media. (Chattopadhyay, Campus Violence In Educational Institution: An
Experience (With Reference To West Bengal)., 2013). We have already discussed
the various articles which spoke of occupational stress, ergonomic issues and also
workplace violence. Apart from these there are other occupational hazards like
32
false accusation, disease transmission, legal consideration, burn-out etc. in this
sector.
False accusations of wrongdoing have been nightmares for some unfortunate
teachers. It's probably the last thing any teacher ever imagined would happen to
them, but even innocent teachers have ended up on the evening news because of a
child's accusation. More than one in five school or college staff i.e. 22% surveyed
had been the target of a false allegation by a pupil while one in seven have been
subject to false allegation by pupil’s parent or family friend. (Garner, 2015).
Innocent teachers and school staff are quitting their jobs after false allegations
against them by pupils because they cannot cope with the stigma, according to a
report in 2009. An alarming rise in the number of false allegations being made
against teachers is "infecting" the atmosphere in schools and leaving staff afraid
to assert their authority and discipline pupils. (Asthana, 2009).
Teachers spend their days with students, colleagues and parents making them
susceptible to bacterial infection. A study led by investigations from MGEN
Foundation for public health revealed that teachers are more susceptible to certain
types of infections than any other workers. EYL Chong and AHS Chan in their
research have shown that 24.4% of teachers suffered from contact dermatitis and
almost all of them claimed that was caused or worsened by their work. (Chong &
Chan, 2010).
33
Educators must comply with laws designed to ensure that all students have equal
rights for educational opportunities. In this context lots of rules and policies are
set by the government, institutions, board and universities. These should be
understood and followed completely. Failing to comply with these laws, rules,
and policies puts teachers in the risk of losing their professional credentials.
Dealing continuously with unhelpful parents, belligerent students and lackluster
administrators can make even the most enthusiastic teachers burn out. Pressure to
increase standardized test scores, poor school resources and an increasing number
of non-teaching-related tasks are the cause of increasing burnout among teachers.
Teachers have the highest rate of burnout (Fisher M. H., 2011). This is partly due
to improper training and unrealistic expectations that teaching is “easy”.
Teaching, as you know, is far from easy. Burnout may be closely attributed to the
fact that when people believe that they are unable to help effectively, they lose
hope, and lose their self-efficacy. (Grant, 2013). Christina Maslach, one of the
world’s foremost experts on burnout, defines job burnout as “a prolonged
response to chronic emotional and interpersonal stressors on the job, and is
defined by the three dimensions of exhaustion, cynicism, and inefficacy”.
(Maslach, 2001)
3.3. SOURCES OF OCCUPATIONAL HAZARD IN EDUCATION SECTOR:
New teachers can be overwhelmed by the workload, especially if they have to
teach five to six different courses. Course preparations can take up several hours a
34
day, in addition to daily teaching hours. Building relationships with students can
be difficult. In high schools, adolescents tend to challenge authority, which can
make teaching an alienating experience. Government mandates and monitoring of
test-driven curriculums make many teachers feel restricted or disillusioned about
their jobs as educator. Teaching is an incredibly rewarding experience, but it
requires a lot more work than what some may think. It’s convenient for people to
blame teachers but we really should be giving credit to our schools for not
hemorrhaging more than they are. Public schools are underfunded and
professional development opportunities for staff are often the first thing that gets
cut in a school’s budget.
The European Trade Union Committee for Education (ETUCE) in collaboration
with World Health Organisation (WHO) made a study on stress. According to the
report made by ETUCE the sources of occupational hazards are grouped into
professional skills, economic pressure, students, difficult parent - teacher
relationship, poor planning and programming and social and personal pressure.
(European Trade Union Committee for Education , 1999). The factors identified
under the professional skills are new teaching method, changes in curriculum and
courses, adoption to changes in information and communication technologies and
inadequate training and continuing education. The factors identified under
economic pressure are inadequate salary and job insecurity. The factors identified
under student are drugs, violence and aggression, increases class size per teacher,
lack of student motivation, attention and interest, decrease in discipline, grading
and assessment and finally target setting and meeting targets. The factors
35
identified under difficult parent teacher relation are new demands regarding roles
of the teacher, responsibility of overall student welfare and decreased parent
participation. The factors identified under poor planning and programming
constant restructuring, frequent reforms in the vocational education system,
working alone and the transition to team work, lack of employees and poor
allocation, strong administrative hierarchy with lack of support and insufficient
financial resources. The factors identified under social and personal pressure are
teacher’s own ambition, concerns about the quality of education, lack of
coherence between personal goals and professional obligations, social positions
have no recognition or acknowledgements, lack of public esteem, and society
demands on the duty of a teacher in child’s upbringing. The factors identified
under the school as a stressful workplace are excessive workload and hours of
work and lack of time, Lack of control and autonomy, environmental noise, poor
ventilation, lack of solidarity and morale, problems with hygiene and security,
excessive paper work and administrative duties, discrimination and workplace
bullying, lack of sufficient and up-to-date teaching material, equipment and
classroom and solitude and isolation.
Milan Shreshta in her blog identified hazards and its related causes. (Shreshta,
2011). According to her the causes of work place injury among university
teachers were found to be because of the slippery surfaces, falls from heights and
other accidents respectively. Dust and poor air conditioning was the cause of
voice disorder among university teachers. Main causes of work place violence
were Gender bias, relationship with students, relationship with boss, relationship
36
with colleague and political bias. The respiratory disorders were caused by chalk
dust, poor ventilation, low humidity and impure water. Backache among
university teachers was caused by work stress, work postures and work place
injury. Occupational stress was caused due to multiple reasons like organisational
culture, roles in university, career development and decision control. The
organisation culture involves work environment, lack of defined objective, poor
problem solving environment, poor communication and non-supportive
environment. Roles in university related factors are role ambiguity, role conflict
and high responsibility for students. Career development related problems are
career uncertainty, career stagnation, poor status, poor pay, job insecurity and low
social value. Decision control related problems are low participation in decision
making, lack of control over work and little decision making in work. Job related
components are ill defined work, high uncertainty, and monotonous work,
underutilization of skill and continua exposes to their students.
3.5. MYERS-BRIGGS TYPE INDICATOR (MBTI):
The aim of MBTI is to identify through its measuring instrument the basic
preferences of people in regard to perception and judgment. The notion is that the
effects of each preference, singly and in combination can be established by
research and put into practical use, especially in relation to decision making
behavior. The four preference dimension of MBTI accumulates into a set of 16
permutations dichotomies that result in 16 personality types. These form the basis
of the Myer’s model and therefore MBTI. To code these types MBTI adopts a set
37
of ordered letters, first letter (E) extrovert or (I) introvert; second letter (S) sensing
or (N) intuition; third letter (T) thinking or (F) feeling; fourth letter (J) judging or
(P) perceiving. There is a tendency to understand each of the 16 types as the sum
of the essential parts such as ESTJ = E+S+T+J. However it is the interaction of
the four preferences that are important and the unique mental pattern these
interactions determine. Thus INTJ is taken to be the most independent minded of
the 16 types, while ISTP is seen as in particular having an intuitive investigatory
aptitude. (Yolles M. , 2009). Thus for instance the 16 types are listed as: ISTJ,
ISFJ, INFJ, INTJ, ISTP, ISFP, INFP, INTP, ESTP, ESFP, ENFP, ENTP, ESTJ,
ESFJ, ENFJ and ENTJ. However they can also be blocked into 4 stable patterns
(Boje, 2004) (Berens, 2007) and referred to as Opinion (ENTJ, ENTP) and
Government (ESTJ, ISTJ); Revolutionary (ENTJ, ENTP) and Reform (ESTJ,
ISTJ); Prince (ENTJ, ENTP) and Bureaucratic (ESTJ, ISTJ) and Super (ESFJ,
ISFJ) and Heroic (ENFJ, ENFP).
The purpose of the Myers-Briggs Type Indicator® (MBTI) is to make the theory
of psychological types described by Swiss psychiatrist C. G. Jung (1921/1971)
understandable and useful in people's lives. The essence of the theory is that much
seemingly random variation in behavior is actually quite orderly and consistent
being due to basic differences in the way individuals prefers to use their
perception and judgment. Main postulates of this theory is that people have inborn
behavioral tendencies and preferences. Isabel Myers and Catherin Briggs
38
expanded on Jung’s work by developing an instrument to help people identify
their preferences.
Many researchers have used this MBTI instrument for evaluating the personality
types of their respondents. One of them is Kun, András István and Kiss, Marietta
and Kapitány, Anna in their study focused on the effect of personality type and
personality preferences measured by the Myers-Briggs typology, on higher
education students' choice of profession and on their academic performance. They
statistically analyzed a sample from two slightly similar bachelor majors studied
at the University of Debrecen, Hungary to reveal both the general and major-
specific effects of personality. They found that the most frequent types in both
majors were ENFJ and ESFJ. However, differences were revealed in the relative
frequencies in the ESTJ, ISTJ and ENFJ types. They identified significant
differences between the majors in the average preferences along the introversion-
extraversion scale and in the sensing-intuition dichotomies. They also found
differences in the explanatory power of personality for the two majors and also in
the types and preferences which contribute positively or negatively to academic
success. (Kun, 2015).Another researcher Yolles, Maurice and Fink, Gerhard in
their study indicated that current type theories are not necessarily stand alone but
may be seen as complimentary within a broader conceptual framework. They
utilized the MBTI and Mindscape theory for his investigation. (Yolles M. a.,
2009). Bocar, Anna C. and Pasok, Prudelen C. and Labastin, Benjiemen A in their
study limits its investigation to the learning and teaching styles of the
39
respondents. These learning styles are found to be the combination of Myers-
Briggs Type Indicator (MBTI) in which it was derived from Carl Jung’s Theory
of psychological types, and from Felder-Silverman Learning Style Model (1996).
The results established that four colleges preferred most the verbal style of
learning while the least preferred learning style of the three colleges is aural
learning style. Furthermore, it was found that the 100% of teachers preferred most
the logical teaching style. (Bocar, 2012). The result of another research using the
Myers-Briggs Type Indicator (MBTI) showed that conscientiousness,
extroversion and MBTI intuition were positively correlated with managerial level,
and neuroticism, MBTI introversion and sensing were negatively correlated with
managerial level. These findings attest to the utility of personality tests used
within the occupational community, for selection and assessment of suitability for
promotion to senior managerial roles. (Moutafi, 2007).
3.6. COPING STRATEGY INVENTORY:
The original coping strategy inventory (CSI) was developed to categories coping
responses based on coping target and directionality of response. With this system
individuals are classified using a 2X2 matrix that quantifies the degree to which
each strategy is generally employed. Coping efforts are first categorized as to
whether they represent an engagement strategy involving approach related actions
that result in confronting hazards, often viewed as a crucial factor in limiting the
long term psychological and physiological sequel ace of environmental stressors,
or disengagement strategy (avoidance) seeking to limit exposure to noxious
40
stimuli often producing desirable short term effects, but leading to long term
problems including depressive symptoms. (Levine, Warrenburg, Kerns, &
Schwartz, 1987)). Within these categories the target of coping effort is either
problem-focused or emotion –focused. (Suls & Fletcher, 1985) (Laux & Weber,
1993). Emotion focused coping emphasizes the regulation of one’s effective
response, whereas problem focused coping emphasizes the management of the
hazard producing situation. The CSI was selected because it was believed to
adequately address the questions of coping it, addressed factors that were crucial
to the model. The CSI was originally constructed as a 78-item questionnaire.
(Tobin, Holroyd, Reynolds, & Wigul, 1989). A seven-point Likert scale was used
to record the participant’s responses. When individuals face events which are
stressful that can be controlled by them Lazarus and Folkman pointed out that
then these individuals adopt problem focused strategies. Whereas when these
individuals cannot control the stressful events they adopt emotion focused
strategies. (Lazarus R. a., 1984). The coping methods were divided into eight
types by Stone and Neale. These eight types were distraction, situation re-
definition, direct action, catharsis, acceptance, seeking social support, relaxation
and religion (Stone, 1984). A revised version Ways of Coping Checklist (WCC)
was developed by Folkman and Lazarus using problem and emotion-focused
coping methods as the basis. This WCC was used to test university students. The
test results showed eight inventories like direct coping, alienation, self-control,
search for social support, accept responsibilities, prevention/avoidance, plan for
solving problems and positive appraisal coping (Folkman, 1985).
41
Scheier, Weintraub and Carver have done huge researches on the coping
strategies. The results of these researches revealed that denial/aloofness, centre of
the problem, self-accusation, acceptance/abandonment, active re-interpretation,
evasion through delusions, and social support are the main stress coping strategies
(Scheier, 1986).
Coping strategies were divided into direct and indirect strategies by Pine and
Aroson. They categorized the concepts into action and non-action. These
divisions and categorizations were mutually combined to form four categories,
these four categories are direct/action, direct/non-action, indirect/action, and
indirect/non-action. The findings of this research shows, that the most active
strategy that is beneficial for as individual’s growth is direct/action. This
emphasizes facing hazardous situations with courage. However, the most passive
strategy that is harmful for physical and mental health of any individual is
direct/non-action. This is when an individual takes the help of harmful alcohol or
drug to flee from reality. This may cause irrecoverable harm (Pine, 1988).
Coping Matrix which is a table that can be used to explain coping strategies and
coping resources was pointed out by Justice. This Coping Matrix splits the coping
behaviour into problem-focused and emotion-focused. In problem-focused coping
an individual tries to change the strongest source of the problems which including
both the external and internal environment. In emotion-focused coping an
42
individual tries to points at moderate the negative impact or the difficulties
brought on by problems, including both the physical and emotional perspective.
Justice even claims that the coping strategies used by an individual normally
include three methods like direct action, indirect action, or controlled action,
These are irrespective of whether the resources for coping exist or not. They
hinder individual from adjustment of factors of their success (Justice, 1988).
A cope inventory was developed by Carver, Weintraub and Scheier’s, when they
were researching on university students. This cope inventory is a
multidimensional inventory. It integrates the similar coping methods into two
types (Carver C. W., 1989). These two types are: problem-focused coping which
includes the adoption of active coping actions, suspension of competitive
activities, suspension of coping behaviours and search for tools of social support
and emotion-focused coping includes denial, acceptance, search for religion,
positive interpretation and search for emotional social support.
A multidimensional coping inventory (MCI) was developed by Endler and Parker.
This MCI includes three methods i.e. mission-focused coping (which is similar to
problem-focused), emotion-focused coping and evasion-focused coping (Endler,
1990). The stress coping methods of young people were divided into four
categories by Halstead, Johnson and Cunningham. These four categories are
problem-focused coping, search for social support, positive thinking and evasion
coping (Halstead, 1993). On investigation of the university students revealed
43
when exams were the source of stress, this stress was estimated as threatening and
harmful stress by Carver and Scheier. These results also showed the frequent
usage of problem-focused coping, search for social support and positive
appraisals. (Carver C. a., 1994) . Thoits’ pointed out in his research that people
who continuously have higher self-esteem and control power, often tend to use
the problem-focused coping strategies method with imitativeness. Whereas
people, who have lower self-esteem or lack control, tend to passively use the
emotion-focused coping strategies method (Thoits, 1995). The source of stress
experienced by 110 university students of the nursing department was
investigated by Timmins and Kaliszer. The result of their investigation showed
that the main coping strategies are like schools arranging education for clinical
internship, or guiding students to face stress recognition, and also incorporating
counseling from direct internship professors (Timmins, 2002). 113 university
students were examined for their psychological and physiological aspects of
adjustment by Kim and Seidlitz. Their investigations showed that stress coping
methods can be categorized into problem solving, search for support, rejection,
sense of humor and physiological situations (Kim, 2002) . University students
were investigated by Misra and Castillo using the questionnaire investigation
method. The findings of their investigation showed that the stress coping attitudes
of these students include frustrations, disputes, changes and taking up
responsibilities (Misra, 2004). The same questionnaire investigation method was
used by Karademas and Kalantzi-Azizi to investigate university students. The
investigation results emphasized that when an individual faces stress, they choose
44
different stress estimations to cope with stress (Karademas, 2004). Investigation
of 235 university students for their adoption of stress coping methods was done
by Twamley, Hami and Stein. The results of this investigation showed that the
coping methods were divided into three types. These are current experience mode,
evasion and negative strategic modes. The negative strategic modes include usage
of alcohol and drug (Twamley, 2004). An investigation based on the optimists and
pessimists was done by Iwanaga, Yokoyama and Seiwa. The results of this
investigation showed that the coping methods were divided into problem
management, problem estimation, re-establishment of appraisals, and evasion
(Iwanaga, 2004). Another research on the university students of the nursing
department done by Steele, Lauder, Caperchione and Anastasi showed that when
students faced clinical care, interpersonal relationships and financial problems,
then to cope with them effectively they use effective management experiences,
such as a support Web site, sequential handling, active anticipation and attitude
(Steele, 2005). Research in cyber bullying indicates that it could be very
problematic for classifying strategies into known general categories. This may
depend on the construction of the measuring tool (Riebel, 2009). In another article
on cyber bullying, the coping mechanisms are like leaving a website, deleting
threatening messages etc. In the context of cyber bullying, some studies include
technical coping or directly addressing the bully in this model (Parris, 2011).
Veronika Slegolova used the coping strategies like technical coping, avoiding,
defensive coping and social support in her article on coping on cyber bullying
among adolescent victims. (Veronika Šléglová, 2011).
45
There are few researches which spoke of the factors influencing the coping
strategies of an individual. Conner in his study of finding the relationship of
personality type with coping strategy claimed that personality may directly
facilitate or constrain coping. (Jennifer K. Connor-Smith, 2007). In his study he
found out that personality most strongly predicted coping in his samples .In
another study the researcher tried to investigate the relationship of personality
profile and the coping strategies adapted by military pilots. (Maja Meško1, 2009).
The results of this study revealed that certain personality characteristics were
differently and significantly related to specific stress coping strategies adopted by
military pilots. In another research personality and coping play both independent
and interactive roles in influencing physical and mental health. (Connor-Smith2,
2010). The results of this study reveal personality is strongly associated with the
coping skills of the individual. Another study on factors influencing the coping
strategies among nursing personnel revealed that strategies focused on the
problem were adapted to a greater extent more by postgraduate nurses, head nurse
and nurses with greater work experience. Intensive care unit nurses mainly
adapted the strategy of denial. While strategy focused on emotions were most
adapted by female nurses. (Zyga, 2016).
3.7. FINDINGS FROM THE LITERATURE REVIEW:
On going through various articles and research papers under the categories of the
groups like occupational hazards in education sector, sources of these hazards and
coping strategies, the following are the findings.
46
1. Most of the researches that were done on teachers whether they belong to
primary section or high school are done in China, Honking, America and
Africa. Very few are from India and practically very few may be less than
ten on West Bengal.
2. On the basis of these researches the occupational hazard that were
identified were Burn-out, Occupational Stress, Voice problems, Musculo-
Skeletal disorder, False accusation, Workplace violence and Disease
transmission. Out of this hazard huge amount of research was done in the
field of occupational stress, voice problems and musculo-skeletal disorder.
The voice problems, musculo-skeletal disorder and the disease
transmission was more of an attribute for the primary school teachers as
they were into proximity with the children most of the time. The
occupational stress and the burn-outs were attributed to university and
college professors as per the articles found.
3. The sources or the causes for the above mentioned hazards were first the
job structure of today’s teacher’s in the modern education system. Today’s
teacher have to do jobs other than just teaching like, evaluating, assessing,
invigilation, counseling, etc.. Doing these activities they face pressure
from their peers, authorities and also external bodies like political
influences etc. Hence the main source of their hazards is there job itself.
To be successful in their jobs they need to constantly upgrade their
knowledge and hence keep on improving their professional skills. To do
their task they have to handle students, maintain cordial relationship with
47
the parents of their students, face huge economic pressure and also work
pressure. Apart from these factors which are quite instrumental in
escalating the hazards, the other factors are poor planning and
programming of the organisations and also organisation culture.
4. On reviewing articles and researches on coping strategies it was found that
the common coping strategies that are adopted by the individuals can be
distributed under into two categories that are engagement and
disengagement coping strategies. The engagement coping strategies are
problem solving, cognitive restructuring, express emotion and social
support. The disengagement coping strategies are problem avoidance,
wishful thinking, self criticism and social withdrawal. Among these
strategies some are problem focused and some are emotion focused.
Various articles and researches showed that the factors influencing the
problem focused strategies were influence by the work experience and
educational level. If the educational level is higher and work experience is
higher they adopt problem focused coping strategies. The job type also
sometimes influence the type of coping strategy adopted by a person i.e.
coping strategy like denial. Emotion focused coping strategies are mainly
adopted by females as per an article. Which also means gender can be one
of the predictors of adopting the coping strategy by an individual. Age
group and marital status has no significant influence in the adoption of
coping strategy. Most of the studies on coping strategies are done in the
health care sector.
48
3.8. RESEARCH GAPS:
In order to put much of recent research into its proper theoretical perspective, it is
important to notice, that the approach to the occupational hazards is at the core of
majority of recent research into occupational hazards of the employees working in
the education sector. Most of the studies have concentrated on identifying the
occupational and organisational sources of stress that are related to various
indices of strain (e.g. job dissatisfaction, psychological stress, burnout, sickness
absence). Turning to the concept of stressors, this is an emotionally laden concept
that reflects the attributions employees make about the source of occupational
stress. Hazards can refer to a wide variety of environmental conditions or
situations that affect the well-being of employees.
From theoretical perspective, for several reasons, we predict that our
understanding of sources of occupational hazards in education sector has not
progressed that far over the past decade.
First, very few studies are there on the academic employees as initially this
profession was considered of low hazardous scenario. Moreover whatever study
was done was done outside India and only few within India like special educators
of Kerala and others. Today, when the modern education system environment is
changing drastically, to such an extent the researches are not focused in this area.
It is very much important to know what the probable hazards of this sector are and
49
also what could be the sources of this hazard. This will help the policy makers to
frame policies for the well being of the academicians.
.
Second, the identification of the sources of occupational hazards often did not
follow the theoretical framework suggested by occupational hazard literature. The
majority of research has not been fully integrated into an appropriate theoretical
framework that enables to understand in which areas the educational institutions
have to modify its organisation and work for better cope with occupational
hazards
.
Thirdly, very few studies have been made to identify the factors influencing the
adoption of the coping strategies. Most of the research in coping strategies
focused on the adoption of coping strategies and consequences faced by the
employees adopting such strategy. But none focused on the factors influencing the
employees to adopt the coping strategy.
Fourthly though there are a few researches on finding relation of personality and
the coping strategies most of them are of meta-analysis, and none was of
empirical in nature.
50
CHAPTER – 4
4. OBJECTIVE AND HYPOTHESIS
4.1. RESEARCH PROBLEM:
Hazards are an inherent feature of any occupation, and the growing evidence even
in perceived non-hazardous jobs suggests it may be increasing in severity.
Occupational hazard has been implicated as the major contributing factor to
growing job dissatisfaction, rapid turnover and high attrition rates among
employees working in Education Sector. It was found that the hazards impact not
only their physical and mental health but also their abilities to the job demands.
This will seriously impair the provision of quality care of the students and
efficacy of educational service delivery.
A survey of literature on teachers be it in schools, colleges or universities reveal
that although a great deal of research has been carried out relating to occupational
stress and job hazards in teaching profession nationally and internationally, little
had been written about employees working in education sector of West Bengal.
Given the international setting and other states setting the status of educational
services in West Bengal are quite different.
51
The research is aimed identify the hazards and their sources along with the coping
strategies adopted by the employees of the education sector. The knowledge
obtained would be useful in the formulation of recommendations to address the
occupational hazards amongst the employees working in the education sector of
West Bengal.
4.2. RESEARCH OBJECTIVE:
Research objective has been developed from the research problem statement after
an in-depth study of the domain and review of literature detailed in chapter 2. In
finalization of the objective due considerations have been taken with respect to
the impacts of the occupational hazards on the employees and also the various
sources of these hazards. The research objective has been developed accordingly
as follow:-
1. To provide the general background to the discussion on occupational
hazards faced by the employee working in White Collar jobs in the
educational sector in West Bengal.
2. To review and summarize the impacts of these occupational hazards on
the employee’s working in the education sector of West Bengal.
52
3. To identify the factors causing occupational hazards to the employees in
the education sector.
4. To identify and prioritize the sources of these occupational hazards,
5. To analyse the coping strategies adopted to cope with the occupational
hazards of the education sector.
6. To analyse the factors influencing the coping strategies of the employees
facing the occupational hazards in the education sector.
4.3 RESEARCH HYPOTHESIS:
In order to achieve the above mentioned objectives a set of 22 hypothesis have
been formulated, which have been tested and conclusions drawn on the basis of
test results. The research hypothesis are categorised in 3 groups.
The First group deals with the impact of occupational hazard among different
age groups, gender, marital status, educational level, earning status, working
modes, working experience, different organisations, different funding agencies,
employees occupying different positions in the organisation and different
personality traits.
Hypothesis of the First Group are as follows:-
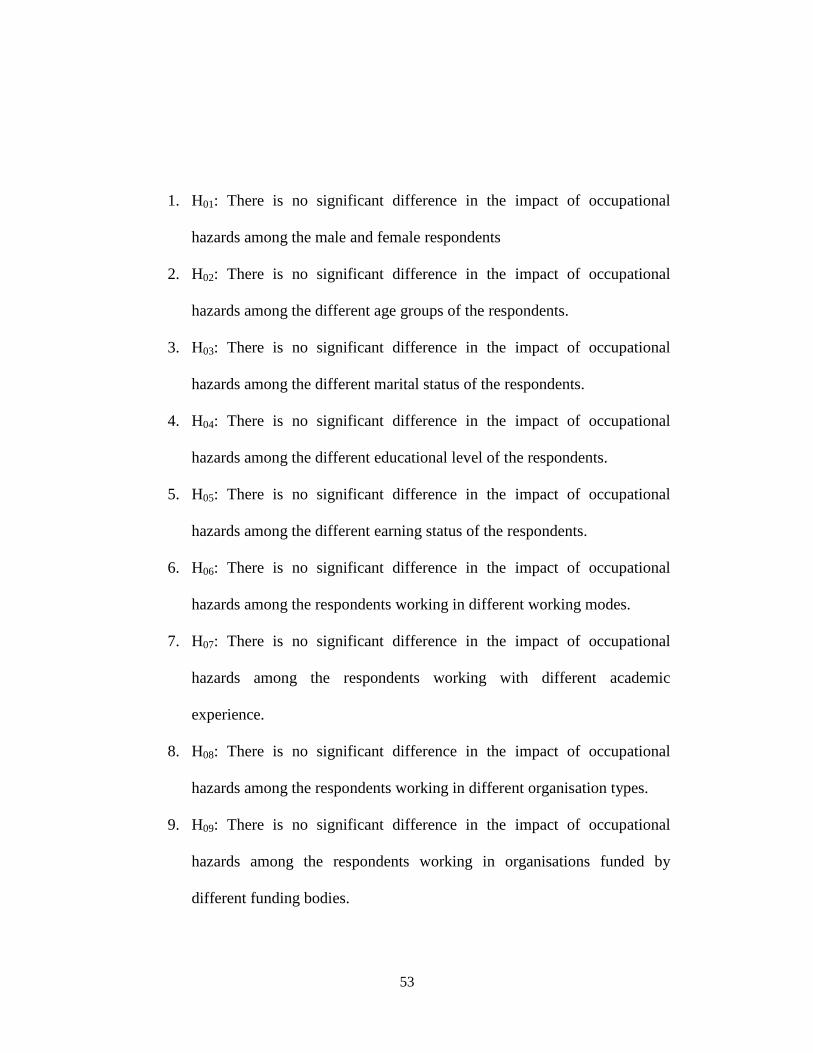
53
1. H01: There is no significant difference in the impact of occupational
hazards among the male and female respondents
2. H02: There is no significant difference in the impact of occupational
hazards among the different age groups of the respondents.
3. H03: There is no significant difference in the impact of occupational
hazards among the different marital status of the respondents.
4. H04: There is no significant difference in the impact of occupational
hazards among the different educational level of the respondents.
5. H05: There is no significant difference in the impact of occupational
hazards among the different earning status of the respondents.
6. H06: There is no significant difference in the impact of occupational
hazards among the respondents working in different working modes.
7. H07: There is no significant difference in the impact of occupational
hazards among the respondents working with different academic
experience.
8. H08: There is no significant difference in the impact of occupational
hazards among the respondents working in different organisation types.
9. H09: There is no significant difference in the impact of occupational
hazards among the respondents working in organisations funded by
different funding bodies.
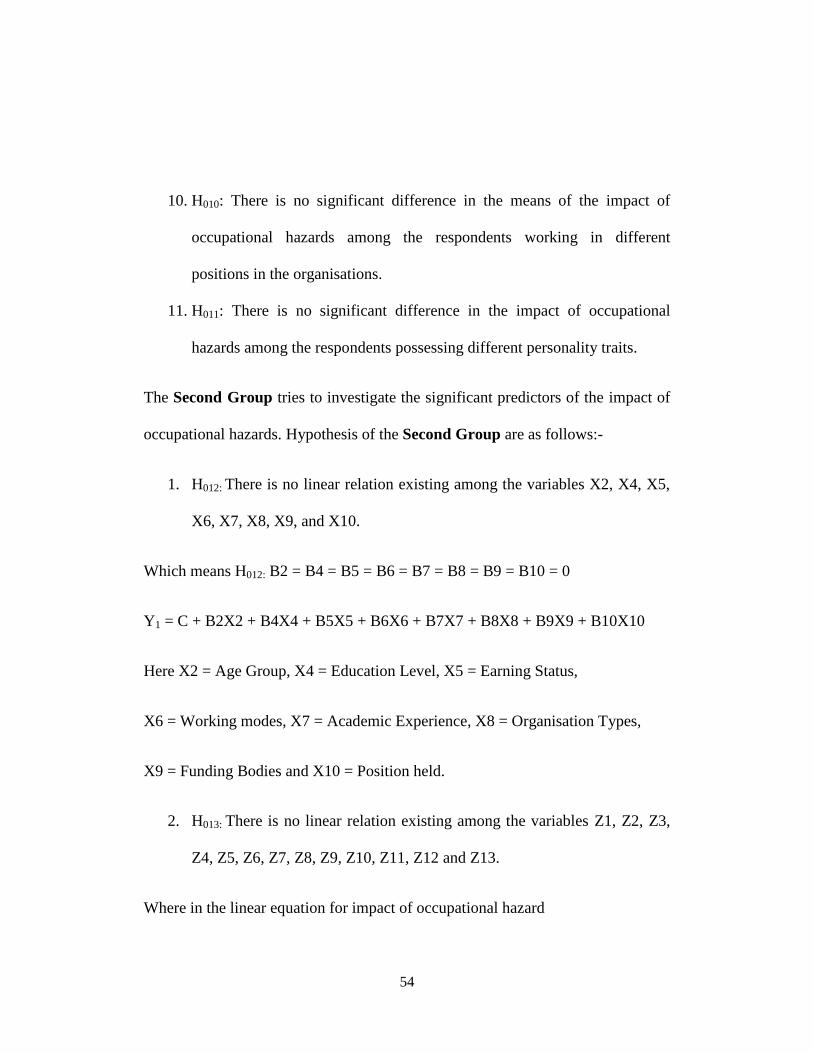
54
10. H010: There is no significant difference in the means of the impact of
occupational hazards among the respondents working in different
positions in the organisations.
11. H011: There is no significant difference in the impact of occupational
hazards among the respondents possessing different personality traits.
The Second Group tries to investigate the significant predictors of the impact of
occupational hazards. Hypothesis of the Second Group are as follows:-
1. H012: There is no linear relation existing among the variables X2, X4, X5,
X6, X7, X8, X9, and X10.
Which means H012: B2 = B4 = B5 = B6 = B7 = B8 = B9 = B10 = 0
Y1 = C + B2X2 + B4X4 + B5X5 + B6X6 + B7X7 + B8X8 + B9X9 + B10X10
Here X2 = Age Group, X4 = Education Level, X5 = Earning Status,
X6 = Working modes, X7 = Academic Experience, X8 = Organisation Types,
X9 = Funding Bodies and X10 = Position held.
2. H013: There is no linear relation existing among the variables Z1, Z2, Z3,
Z4, Z5, Z6, Z7, Z8, Z9, Z10, Z11, Z12 and Z13.
Where in the linear equation for impact of occupational hazard
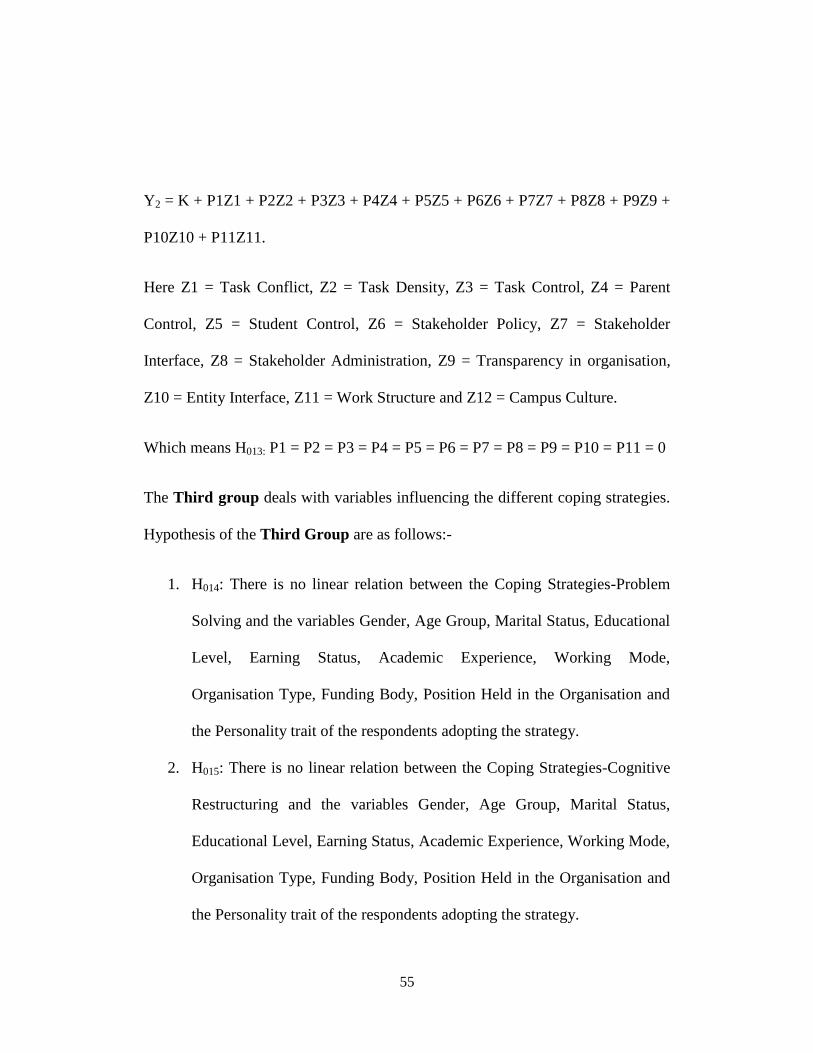
55
Y2 = K + P1Z1 + P2Z2 + P3Z3 + P4Z4 + P5Z5 + P6Z6 + P7Z7 + P8Z8 + P9Z9 +
P10Z10 + P11Z11.
Here Z1 = Task Conflict, Z2 = Task Density, Z3 = Task Control, Z4 = Parent
Control, Z5 = Student Control, Z6 = Stakeholder Policy, Z7 = Stakeholder
Interface, Z8 = Stakeholder Administration, Z9 = Transparency in organisation,
Z10 = Entity Interface, Z11 = Work Structure and Z12 = Campus Culture.
Which means H013: P1 = P2 = P3 = P4 = P5 = P6 = P7 = P8 = P9 = P10 = P11 = 0
The Third group deals with variables influencing the different coping strategies.
Hypothesis of the Third Group are as follows:-
1. H014: There is no linear relation between the Coping Strategies-Problem
Solving and the variables Gender, Age Group, Marital Status, Educational
Level, Earning Status, Academic Experience, Working Mode,
Organisation Type, Funding Body, Position Held in the Organisation and
the Personality trait of the respondents adopting the strategy.
2. H015: There is no linear relation between the Coping Strategies-Cognitive
Restructuring and the variables Gender, Age Group, Marital Status,
Educational Level, Earning Status, Academic Experience, Working Mode,
Organisation Type, Funding Body, Position Held in the Organisation and
the Personality trait of the respondents adopting the strategy.
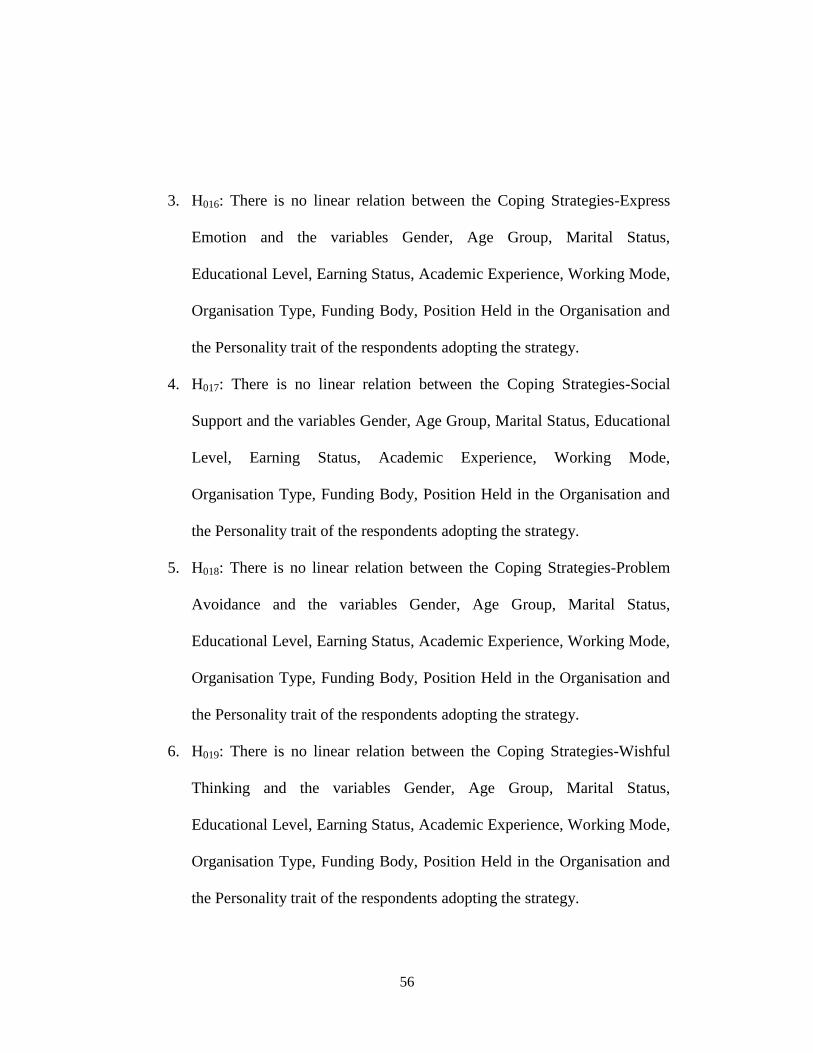
56
3. H016: There is no linear relation between the Coping Strategies-Express
Emotion and the variables Gender, Age Group, Marital Status,
Educational Level, Earning Status, Academic Experience, Working Mode,
Organisation Type, Funding Body, Position Held in the Organisation and
the Personality trait of the respondents adopting the strategy.
4. H017: There is no linear relation between the Coping Strategies-Social
Support and the variables Gender, Age Group, Marital Status, Educational
Level, Earning Status, Academic Experience, Working Mode,
Organisation Type, Funding Body, Position Held in the Organisation and
the Personality trait of the respondents adopting the strategy.
5. H018: There is no linear relation between the Coping Strategies-Problem
Avoidance and the variables Gender, Age Group, Marital Status,
Educational Level, Earning Status, Academic Experience, Working Mode,
Organisation Type, Funding Body, Position Held in the Organisation and
the Personality trait of the respondents adopting the strategy.
6. H019: There is no linear relation between the Coping Strategies-Wishful
Thinking and the variables Gender, Age Group, Marital Status,
Educational Level, Earning Status, Academic Experience, Working Mode,
Organisation Type, Funding Body, Position Held in the Organisation and
the Personality trait of the respondents adopting the strategy.
57
7. H019: There is no linear relation between the Coping Strategies-Self
Criticism and the variables Gender, Age Group, Marital Status,
Educational Level, Earning Status, Academic Experience, Working Mode,
Organisation Type, Funding Body, Position Held in the Organisation and
the Personality trait of the respondents adopting the strategy.
8. H021: There is no linear relation between the Coping Strategies-Social
Withdrawal and the variables Gender, Age Group, Marital Status,
Educational Level, Earning Status, Academic Experience, Working Mode,
Organisation Type, Funding Body, Position Held in the Organisation and
the Personality trait of the respondents adopting the strategy.
9. H021: There is no linear relation between the Coping Strategies-Political
and the variables Gender, Age Group, Marital Status, Educational Level,
Earning Status, Academic Experience, Working Mode, Organisation
Type, Funding Body, Position Held in the Organisation and the
Personality trait of the respondents adopting the strategy.
58
CHAPTER – 5
5. RESEARCH METHODOLOGY
5.1. OVERVIEW:
The research methodology adopted for this research is described in the following
sub-sections: the research design, the sources of data, sampling design which
contains the sampling technique used and data collection instrument developed.
Also the different analytical tools, which are being used for analysis of the
collected data to derive at the conclusions, are also being explained.
5.2. RESEARCH DESIGN:
Mixed research design in terms of both qualitative and quantitative research
design approach has been adopted for achieving the objective of the research. The
research design is divided into two phases.
5.2.1. PHASE -1:
Initially the qualitative research method is adopted to identify the hazards, sources
of hazards, coping strategies and factors influencing the coping strategies amongst
the respondents working in the education sector of West Bengal with the help of
59
“the public voice”. This method was applied by Teichmann, Mare, Ilvest and Jüri
Jr. in their paper “Sources of occupational stress in technical university
academics”. This phase has been utilized to identify the concepts to develop a
conceptual framework. The qualitative research is used as a precursor to
quantitative method used in phase – 2.
In this phase a descriptive qualitative design is used to facilitate an in-depth
exploration of the respondents’ experience regarding the hazards faced during
their occupation, perceived sources for these hazards and also their coping
methods to these hazards. The data is collected through un-structured interviews.
Qualitative research interview allows obtaining information about topics in which
different level of meaning need to be explored. (King, 1994). Therefore, a
qualitative design is used to help discover the different meanings and
characteristics of impacts of occupational hazards, sources and coping with
respect to occupational hazards from the respondent’s perspective. The focus of
the present study is to explore and develop a conceptual framework on the
occupational hazards, sources of these hazards and the coping strategies adopted.
The sampling aimed here is towards the theory construction and not for
population representativeness. The data was initially collected on the occupational
hazards, sources of these hazards and the coping strategies adopted and also the
possible factors that are influencing the coping strategies by interviewing few of
the academicians who were interested in the study to share their in-depth
experience on the above mentioned concepts. The qualitative research method
60
was adapted for the reason to clarify the occupational hazards and the sources of
these hazards and also the coping strategies adopted along with the factors
influencing the coping strategies in the educational sector of West Bengal with the
help of “public voice”. Open answers unstructured interview as a conversation
between two people e.g. researcher and the respondents working in academic
sector of West Bengal on specific topics (occupational hazard in education sector,
sources of these hazards and coping strategy) was adopted. There were no
designate specific questions asked by the interviewer. Obtained information from
the interview was transcribed into report in the form of field notes. All the
interviews were taken by the researcher herself who is experienced in taking such
interviews from her past jobs handled. Each face to face interview extended to 20
to 35 minutes. The interviewee was approached multiple times to get rich data.
In order to build up the concepts the reports written were analysed and the
common elements extracted from the reports. The critical incident technique was
adopted for enabling the extraction of elements common to occupational hazards
and sources for these hazards and also the coping strategies. This procedure
resulted in identifying the 7 types of occupational hazard faced by the respondents
working in the education sector of West Bengal. Along with this 12 sources for
these hazards were identified. The other concepts that emerged were stakeholder
concept, task concept, personality traits and 9 types of coping strategies.
Analysing the texts from the scripts of the respondents which were collected
through in-depth-interviews involves five complex tasks. Firstly we try to
61
discover the themes and subthemes from the texts. The term “Theme” more
naturally connote the fundamental concepts we are trying to describe. In everyday
language we talk about themes that appear in texts and refer to particular
instances as expression of goodness or anger or evil. In selecting the set of terms
over others, we surely ignore subtle differences, but the basic ideas are just as
useful under many glosses. Secondly we describe the core and peripheral
elements of the themes that are identified. Third step is to build the hierarchy of
the themes. In the fourth step we apply the themes, i.e. attaching them to the
chunks of actual texts. The final step is to linking the themes into the theoretical
model. The steps followed are explained in Annexure – V.
5.2.1.1. THEME IDENTIFICATION TECHNIQUE:
The techniques for discovering themes come from across the social sciences and
from different methodological perspectives. A priori theme also comes from
already agreed on professional definitions found in literature reviews, from local,
commonsense constructs, and from researcher’s values, theoretical orientation and
personal experience. (Bulmer, 1979) (Maxwell, 2005) (Strauss, 1987). A. Strauss
and Corbin call the use of a priori themes theoretical sensitivity.
The decisions about what topics to cover and how best to query people about
those topics, are rich sources of a priori themes (Dey I. , 1993). In fact, the first
pass at generating themes often comes from the questions in an interview protocol
(Coffey A., 1996). Mostly, though, themes are derived empirically induced from
62
data. Even with a fixed set of open-ended questions, there’s no way to anticipate
all the themes that will come up before you analyze a set of texts The act of
discovering themes is what grounded theorists call open coding, and what classic
content analysts call qualitative analysis (Berelson, 1952) or latent coding
(Shapiro, 1997).
There are many variations on these methods and many recipes for arriving at a
preliminary set of themes (Tesch, 1990). “Anyone who has listened to long
stretches of talk,” says D’Andrade, “knows how frequently people circle through
the same network of ideas”. Repetition is easy to recognize in text. The more the
same concept occurs in a text, the more likely it is a theme. Based on this a
conceptual framework was developed.
5.2.2. PHASE -2:
The concepts evolved from the phase – 1 were utilized in developing a
questionnaire for testing the conceptual framework so evolved. The questionnaire
consists of eight sections. These eight sections are to capture data of demographic
details of the respondent, occupational information of the respondent, personality
trait identification, impact of occupational hazard, sources of occupational hazard,
stakeholder related information, task related information and coping strategy
questionnaire.
63
5.2.2.1. MBTI INSTRUMENT:
For the purpose of identifying the personality trait of the respondent MBTI tool
has been used. The MBTI tool has been licensed by CPP Inc. to the researcher for
use in academic research The MBTI tool is basically a set of 70 questions with
just two options to tick for the respondent. The questions are repeated to eliminate
the outliers. Based on the responses a respondent can be categorized among one
of the sixteen personality types. The sixteen personality types are as follow:-
1. Extraverted intuitive feeling judging (ENFJ)
2. Extraverted intuitive thinking judging (ENTJ)
3. Extraverted intuitive feeling perceiving (ENFP)
4. Extraverted intuitive thinking perceiving (ENTP)
5. Extraverted sensing feeling judging (ESFJ)
6. Extraverted sensing feeling perceiving (ESFP)
7. Extraverted sensing thinking judging (ESTJ)
8. Extraverted sensing thinking perceiving (ESTP)
9. Introverted intuitive feeling judging (INFJ)
10. Introverted intuitive feeling perceiving (INFP)
11. Introverted intuitive thinking judging (INTJ)
12. Introverted intuitive thinking perceiving (INTP)
13. Introverted sensing feeling judging (ISFJ)
14. Introverted sensing feeling perceiving (ISFP)
15. Introverted sensing thinking judging (ISTJ)
64
16. Introverted sensing thinking perceiving (ISTP)
The score key as used by Harley Friedman and advised by Nancy Schaubhut,
M.S, and Program coordinator of CPP Inc is attached in the Annexure – III,
Along with the set of 70 questions.
5.2.2.2. CSI INSTRUMENT:
The coping strategy questionnaire in built on the Coping Strategy Inventory(CSI)
model (Tobin D. L., 2001). The coping strategy inventory is a questionnaire
consisting of 72 items. This is designed to assess the coping thoughts and
behaviors of the respondents in response to any specific stressors. The CSI
instrument format adopted from the Lazarus “Ways of Coping” Questionnaire
(Lazarus.R.S., 1981). The coping strategies utilized in this research include:
1. Problem Solving:
People adopt the coping strategy of problem solving to eliminate the sources of
hazards, by changing the hazardous situation. This strategy refers to items
referring to both behavior and cognitive strategies.
2. Cognitive Restructuring::
People adopt the coping strategy of cognitive restructuring to try to alter the
meaning of the hazardous situation as it is less threatening. This strategy includes
cognitive strategies and is examined for its positive aspects. It is then is viewed
from a new perspective.
65
3. Express Emotion:
People adopt this strategy to release their stress and anxiety by expressing their
emotions. This strategy includes items that refer to releasing and expressing
emotion.
4. Social Support:
People who adopt this strategy seek support from their friends and family
members. Items included in this strategy refer to seeking emotional support from
family members and friends.
5. Problem Avoidance:
People who adopt this strategy basically deny the existence of any problems.
They try to avoid any thoughts or actions against the hazardous agents. The items
included in this strategy refer to the denial of problems and the avoidance of
thoughts or action about the hazardous agent.
6. Wishful Thinking:
People who adopt this coping strategy hope and wish that the situation will
become better. This strategy refers to the cognitive strategies that reflect an
inability or reluctance to reframe or alter the hazardous situations. The items in
this strategy involve hoping and wishing that things could be better.
7. Self Criticism:
People who adopt this strategy are frequently adopted by those people who face
high levels of stress which impacts them negatively than impacting positively
66
(Zuroff, 1995). In fact the concept of self criticism can be a direct concept for the
personality trait of the person with numerous outcomes which are maladaptive.
8. Social Withdrawal:
People who adopt this coping strategy also adopt the self criticism coping
strategy. The items included in this strategy reflect the behavior of blaming
oneself for such unpleasant situations and also criticizing oneself.
9. Political:
People who adopt this strategy believes in taking support, advice and suggestions
from people who are either politically affiliated or having a great influence in the
society as to how to overcome the situation which is giving them lots of stress.
Coping strategies inventory (CSI) tool was utilized by many researchers for the
purpose of the research. Clifton in his article has used the CSI tool to study to
establish the psychometric properties for a coping strategies inventory. (Clifton C.
Addison, 2007). Another Researcher has used the Coping Strategy Inventory to
assess the appraisal of stressful events.. The coping strategy inventory was
employed to assess coping strategies used in responding to the most disruptive
event that had occurred in the past month. (Koellner, 1987). Andrea Bezerra
Rodrigues in her research attempted to control factors resulting to occupational
stress in individuals using the coping strategies. (RodriguesI & ChavesII, 2008).
Jose Marıa in her article using the coping strategy inventory has found out that
most caregivers reported higher anxiety and depression levels. Use of
disengagement coping strategies and higher caregiver burden predicted anxiety on
67
logistic regression. In turn, use of disengagement coping strategies and higher
caregiver burden predicted depression on logistic regression. These results may be
useful for designing treatment interventions that aim to modify the use of coping
strategies and thus reduces caregiver anxiety and depression. (Jose Maıa Garca-
Alberca, 2012). Ying Ming Lin in his article investigated stress coping style
inventory of university and college of technology students, and established that it
points at the methods selected along with stress coping as a type of process and
attitude. The coping strategy questionnaire has been tested for both reliability and
validity.
5.2.2.2.1. RELIABILITY OF THE CSI INSTRUMENT:
Chronbach’s alpha has been most frequently reported the coefficient of reliability
for measuring the coping process. The alpha coefficient for the coping strategy
questionnaire is 0.986. Which is quite acceptable as Chronbach’s alpha above 0.7
is acceptable (Tavakol, 2011).
5.2.2.2.2. VALIDITY OF THE CSI INSTRUMENT:
Validity of the coping strategy questionnaire has been assessed by construct
validity. There are several studies that have looked at the relationship of coping
strategy questionnaire to instruments measuring the other important constructs in
stress and coping literature. The coping strategy questionnaire is particularly
68
predictive of depressive symptoms for individuals who are in high stress zone.
Also persons who have a greater self efficacy report doing more problem solving
and less problem avoidance than individuals with lower self efficacy (Tobin,
1984). The purpose of this questionnaire was to test the conceptual framework
obtained from qualitative data.
5.3. POPULATION OF THE RESEARCH:
In West Bengal there is One Central University, Twenty Four State Universities,
and Seven Private Universities and One Deemed University. Besides there are
Three Regional Centre’s of IGNOU at Siliguri, Kolkata and Raghugnathganj and
one sub-regional centre of IGNOU at Darjeeling.
The HEI (Higher Education Institutions) in West Bengal can be broadly divided
into two categories in terms of their financial dependence on state government. (i)
Government colleges and (ii) grant –in-aid colleges. The government colleges are
fully dependent on the state government for their maintenance and development.
The grant-in-aid colleges receive maintenance grant from state government and
occasionally development grant. Most of these colleges are recognized under
section 2(f) and 12(B) of the UGC (University Grants Commission) Act, 1956
and receive the UGC grants. These colleges are free to create posts beyond the
sanctioned posts. (Sarkar, Pabitra;, 2004). In total West Bengal have 899 colleges
(Ministry of Human Resource Department, 2013)
69
West Bengal is now divided into 20 districts which include Alipurduar District
form 24th
June 2014. (wikipedia.org, 2014). All the schools, colleges and
universities are distributed along these 20 districts of West Bengal.
The education sector of West Bengal consists of
Primary schools: Primary education is from class - I to IV. There are about
42624 primary schools in West Bengal as per the 2008 DISE report.
(Department of School Education, 2008)
Secondary schools: Secondary education is from class - V to X. There are
about 3589 Secondary schools in West Bengal as per the 2008 DISE
report. (Department of School Education, 2008)
Higher secondary schools: Higher secondary education is from class – XI
and XII. There are about 4300 higher secondary schools in West Bengal.
(West Bengal Council for Higher Secondary Education)
Colleges: There are 277 colleges in West Bengal catering to various
courses in Agriculture, Arts & Science, Ayurvedic, Catering & Hotel
management, Management, Law, Engineering, and Dental etc. (World
Colleges Information, 2013)
Universities: In West Bengal there are about 18 state universities, 1 central
university and 1 deemed university. (Educational Information, 2014)
Professional institutes: In West Bengal the recognized professional
institutes are Indian Institute of Technology, Bengal Engineering and
70
Science University, Indian Statistical Institute, Centre for studies in social
sciences, Technical Education and Training Department, Indian Institute
for Management.
More than 1, 00, 000 people are employed in the education sector of West Bengal
and hence belong to the population of this research.
5.4. SOURCES OF DATA:
Data that is used for this research is collected in two phases.
First phase is the qualitative data which is collected with the help of unstructured
interview of respondents who faced and agreed to participate in this research,
provided their identity is not disclosed. Purposive sampling is used in this phase
to collect the data. This is one of the most common sampling strategies where
participants are selected on the basis of criteria relevant to the research questions.
Sample sizes which may or may not be fixed prior to data collection, depends on
the resources and time available as well as the study’s objective. Purposive
sample sizes are often determined on the basis of theoretical saturation i.e. the
point in data collection when new data no longer bring additional insights to the
research question. Purposive sampling is therefore most successful when data
review and analysis is done in conjunction with data collection. (Denzin NK,
2000)
The characteristics of these ten respondents are as follow:-
71
1. Professor and head of the Department in Calcutta University. The
respondent is female by gender, belonging to age group of 51 to 60 with
more than 15 years of experience in academics.
2. Professor and Dean of IIT, Kharagpur. The respondent is male , belonging
to age group of 51 to 60 and has an experience of being in the post of VC
of a reputed university.
3. Principal of a private school in Kolkata and was in the news recently for
being harassed and even served few days under arrest by the complaint of
the parents of the students of the same school. The respondent is a female
by gender and belongs to the age group of 41 to 50 years.
4. Retired Principal of another private school in Kolkata. The respondent is
above 60 years and is male by gender.
5. Professor of a reputed University in West Bengal. The respondent is male
by gender and belongs to the age group of 51 to 60 years.
6. Teacher of a private school in Kolkata. The respondent is female by
gender and belongs to the age group of 41 to 50 years.
7. Teacher of a private school in Murshidabad. The respondent is female by
gender and belongs to the age group of 31 to 35 years.
8. Retired principal of a government school in Murshidabad. The respondent
is male by gender and belongs to the age group above 60.
72
9. Dean of management school in Kolkata. The respondent is female by
gender and belongs to the age group of 41 to 45 years.
10. Faculty of management school in Kolkata. The respondent is male by
gender and belongs to the age group of 31 to 40 years.
These respondents were interviewed multiple times to get the rich qualitative data.
This qualitative data is used to design the questionnaire for the quantitative
research.
The second phase of data was collected from the population of the academicians
in whole of West Bengal. The respondents of this survey belonging to 15
universities, 10 colleges, 5 professional institutes and 10 schools. A total of 1664
respondents were approached by sending them the questionnaire through online
tools like survey monkey, out of which 567 people have responded. Among them
286 respondents have responded the questionnaire in full. The rest responded in
partial and has to be eliminated from analysis. The researcher has personally
administered to 80 respondents and collected the data by convenient sampling.
Hence the total sample size is 366.
5.5. RESEARCH INSTRUMENT:
The first phase of data collection was done by unstructured face to face interview
method, where the interaction was between the researcher as the interviewer and
the respondent as the interviewee. In this phase the grounded theory approach is
utilized where data is collected and simultaneously analysed which helps in
73
framing more relevant questions to get rich data. (Charmaz, 2012). In this phase
data is collected for the following concepts:
a. Occupational Hazards
b. Impacts of Occupational Hazards
c. Sources of Occupational Hazards
d. Coping strategies.
The type of the questions asked in the unstructured interview is given in
Annexure - VI.
The second phase of data collection is done through a structured questionnaire
developed by the researcher and personally administered to respondents for
responses. Questionnaire was the main research instrument used to analyse the
conceptual framework developed through qualitative research. Questionnaire was
used as it is economical, structured and appropriate to collect the primary data and
test the hypothesis. The final questionnaire used for the research is given in
Annexure - I.
5.6. PILOT SURVEY QUESTIONNAIRE:
Initially the questionnaire that was developed by the researcher had five sections.
The first section gave their occupational information along with their
74
demographic details. In this section the respondents gave the following
information:
a. Demographic details like age, gender, marital status, education level and
earning status.
b. Occupation details like total experience, experience in current
organisation, occupational status, organisation category, organisation
funded by and position held in the organisation.
The second section is used to identifying the personality traits of the respondent
using the MBTI tool which has been licensed to the researcher on application by
the CPP Inc.
The third section is used to capture information of the impacts of the occupational
hazards faced by asking the respondent to the statements in a seven point Likert
scale from Never to Every time. The scale that is used is as follows:-
1. Never, 2. Rarely, 3. Occasionally, 4. Sometimes, 5. Frequently, 6. Usually,
7. Every time.
The fourth section is used to capture information of sources of occupational
hazard. Even here 7 point Likert scale was used and the respondents were asked
to tick the appropriate option.
The fifth section was used to capture the information of the coping strategies by
asking the respondents to answer in a 7 point Likert scale on the 72 statements.
75
These 72 statements resemble 9 types of coping strategies. The 9 coping strategies
are as follows:-Problem Solving, Cognitive Restructuring, Express Emotion,
Social Support, Problem Avoidance, Wishful Thinking, Self Criticism, Social
Withdrawal and Political.
This has been developed taking the guidance from the Manual CSI Inventory
(Tobin D. L., 2001). The way the statements are distributed for the respective
coping strategies in shown in Annexure - II. The respondents are asked to tick on
the seven point scale from strongly disagree to strongly agree.
5.7. FINAL SURVEY QUESTIONNAIRE:
On the basis of the experience in Pilot survey in administering the questionnaire
and also analyzing the data so obtained the questionnaire had to be refined and
improved to collect more accurate data. The changes made in the questionnaire
are as follows:
a. The questionnaire had to be extended with two more sections. One section
is used to capture the information on the stakeholder concepts which was
identified in the conceptual framework in detail. The second section was
used to capture information on the task concepts.
b. There was change in the way of administering the questionnaire. It was
already observed in the pilot survey that many respondents, who initially
showed the willingness to respond, withdrew their interest on seeing the
76
length of the questionnaire. Many respondents displayed sign of disinterest
in responding the questionnaire due to its length. Hence part method of
administering was used. In this case the questionnaire was divided into
three parts i.e. Part A, Part B and Part C. In this case the respondents were
asked to respond the questionnaire in individual parts in three times. So
that the interest in the topic is also retained giving them the freedom to
answer without pressure.
c. Certain wordings had to be changed for the respondents better and clear
understanding; keeping in mind the respondents are from India who
understands simple English words.
d. Some open ended questions were added to help the respondent to freely
answer their perceptions on occupational hazards, stakeholder interactions,
or any event related to the topic faced by them.
The questionnaire is given in the Annexure - I.
5.8. RELIABILITY ANALYSIS:
The factors that emerged in the questionnaire for collecting of responses were
tested for internal reliability using Chronbach’s alpha which indicates the average
inter-item correlation within each of the factors. Those factors resulting in
Chronbach’s alpha of 0.7 or greater are generally considered to be reliable
(Tavakol, 2011) and therefore are useful for further analysis as a part of a specific
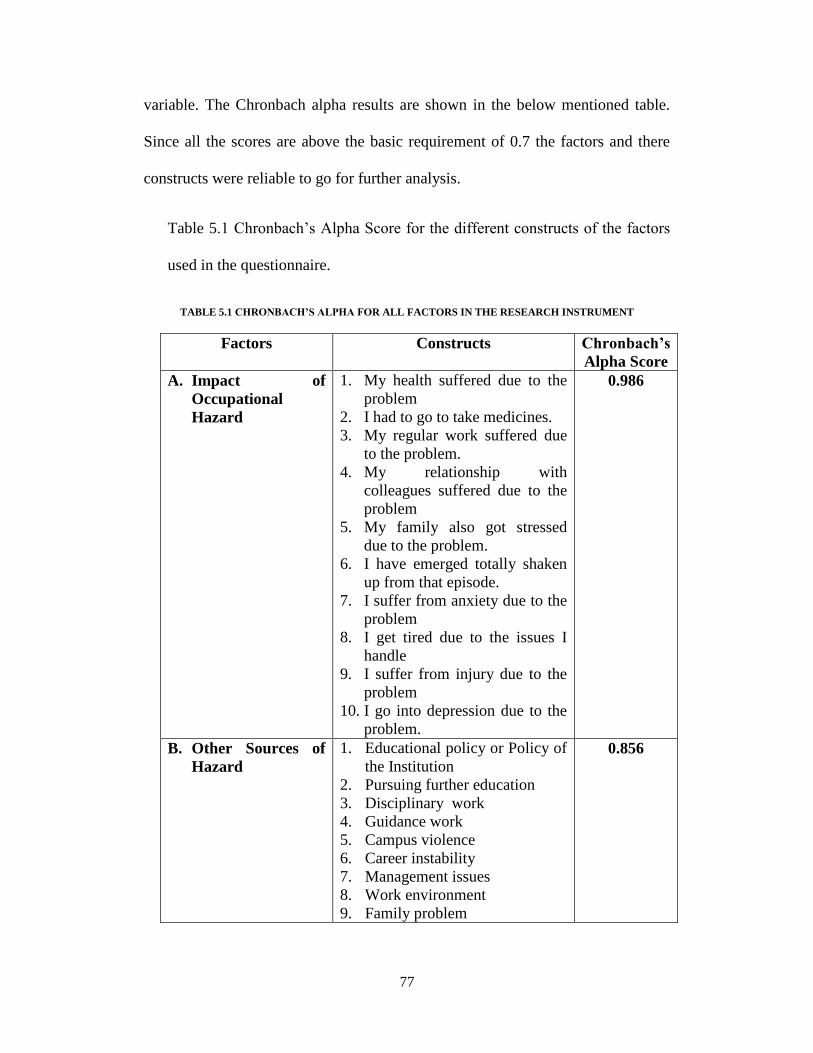
77
variable. The Chronbach alpha results are shown in the below mentioned table.
Since all the scores are above the basic requirement of 0.7 the factors and there
constructs were reliable to go for further analysis.
Table 5.1 Chronbach’s Alpha Score for the different constructs of the factors
used in the questionnaire.
TABLE 5.1 CHRONBACH’S ALPHA FOR ALL FACTORS IN THE RESEARCH INSTRUMENT
Factors Constructs Chronbach’s
Alpha Score
A. Impact of
Occupational
Hazard
1. My health suffered due to the
problem
2. I had to go to take medicines.
3. My regular work suffered due
to the problem.
4. My relationship with
colleagues suffered due to the
problem
5. My family also got stressed
due to the problem.
6. I have emerged totally shaken
up from that episode.
7. I suffer from anxiety due to the
problem
8. I get tired due to the issues I
handle
9. I suffer from injury due to the
problem
10. I go into depression due to the
problem.
0.986
B. Other Sources of
Hazard
1. Educational policy or Policy of
the Institution
2. Pursuing further education
3. Disciplinary work
4. Guidance work
5. Campus violence
6. Career instability
7. Management issues
8. Work environment
9. Family problem
0.856
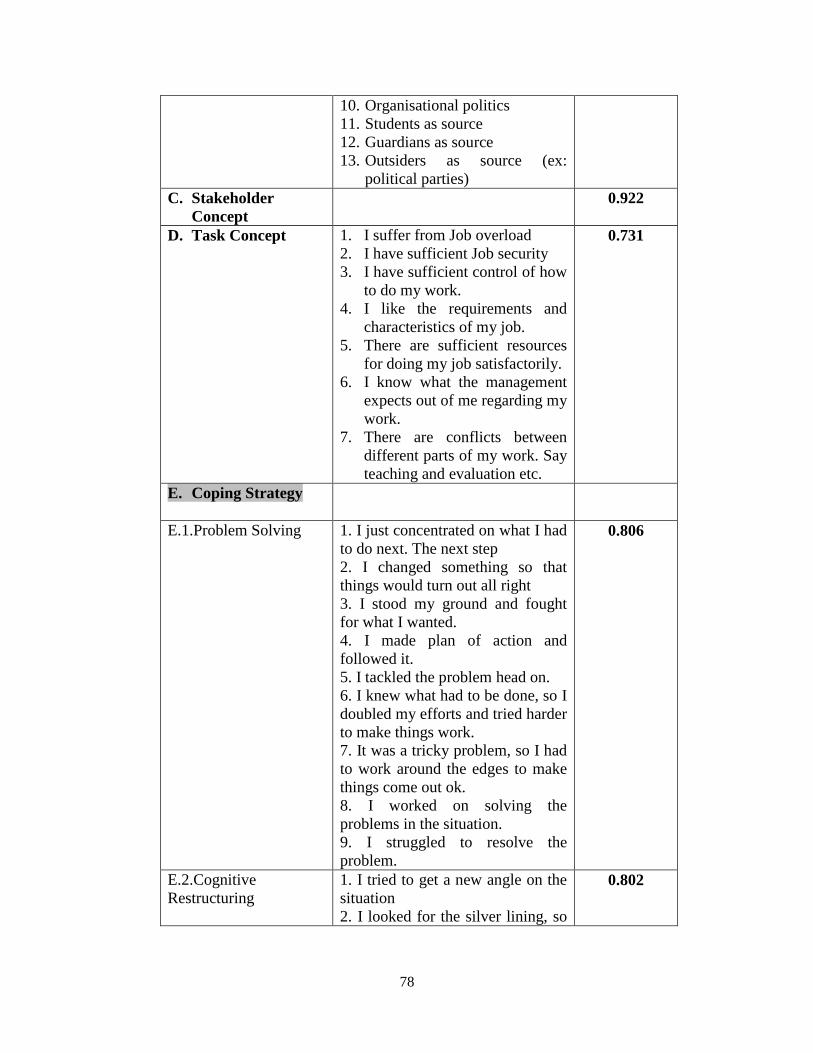
78
10. Organisational politics
11. Students as source
12. Guardians as source
13. Outsiders as source (ex:
political parties)
C. Stakeholder
Concept
0.922
D. Task Concept 1. I suffer from Job overload
2. I have sufficient Job security
3. I have sufficient control of how
to do my work.
4. I like the requirements and
characteristics of my job.
5. There are sufficient resources
for doing my job satisfactorily.
6. I know what the management
expects out of me regarding my
work.
7. There are conflicts between
different parts of my work. Say
teaching and evaluation etc.
0.731
E. Coping Strategy
E.1.Problem Solving 1. I just concentrated on what I had
to do next. The next step
2. I changed something so that
things would turn out all right
3. I stood my ground and fought
for what I wanted.
4. I made plan of action and
followed it.
5. I tackled the problem head on.
6. I knew what had to be done, so I
doubled my efforts and tried harder
to make things work.
7. It was a tricky problem, so I had
to work around the edges to make
things come out ok.
8. I worked on solving the
problems in the situation.
9. I struggled to resolve the
problem.
0.806
E.2.Cognitive
Restructuring
1. I tried to get a new angle on the
situation
2. I looked for the silver lining, so
0.802
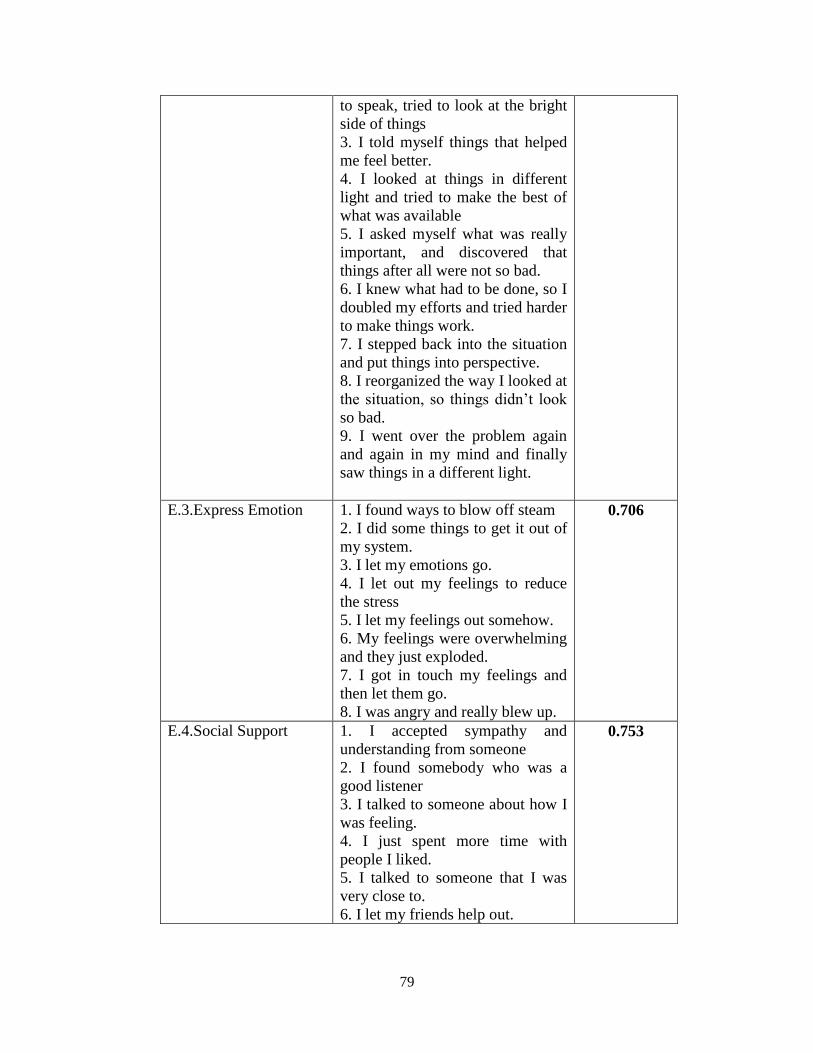
79
to speak, tried to look at the bright
side of things
3. I told myself things that helped
me feel better.
4. I looked at things in different
light and tried to make the best of
what was available
5. I asked myself what was really
important, and discovered that
things after all were not so bad.
6. I knew what had to be done, so I
doubled my efforts and tried harder
to make things work.
7. I stepped back into the situation
and put things into perspective.
8. I reorganized the way I looked at
the situation, so things didn’t look
so bad.
9. I went over the problem again
and again in my mind and finally
saw things in a different light.
E.3.Express Emotion 1. I found ways to blow off steam
2. I did some things to get it out of
my system.
3. I let my emotions go.
4. I let out my feelings to reduce
the stress
5. I let my feelings out somehow.
6. My feelings were overwhelming
and they just exploded.
7. I got in touch my feelings and
then let them go.
8. I was angry and really blew up.
0.706
E.4.Social Support 1. I accepted sympathy and
understanding from someone
2. I found somebody who was a
good listener
3. I talked to someone about how I
was feeling.
4. I just spent more time with
people I liked.
5. I talked to someone that I was
very close to.
6. I let my friends help out.
0.753
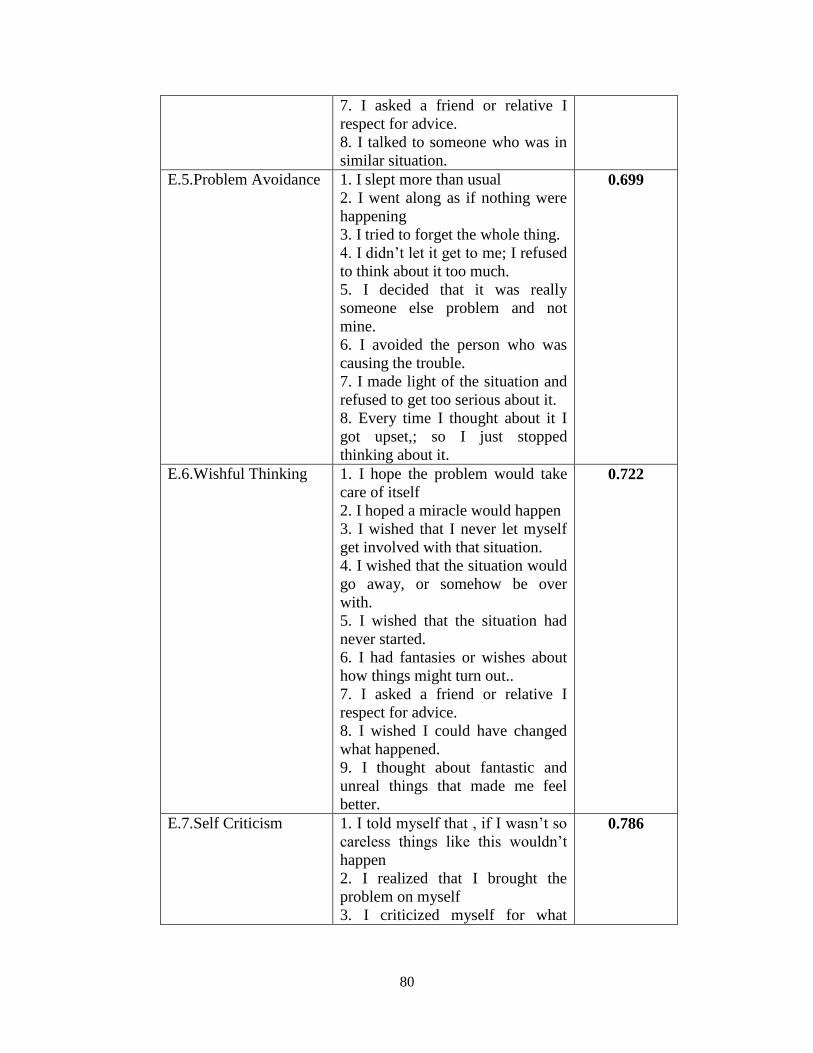
80
7. I asked a friend or relative I
respect for advice.
8. I talked to someone who was in
similar situation.
E.5.Problem Avoidance 1. I slept more than usual
2. I went along as if nothing were
happening
3. I tried to forget the whole thing.
4. I didn’t let it get to me; I refused
to think about it too much.
5. I decided that it was really
someone else problem and not
mine.
6. I avoided the person who was
causing the trouble.
7. I made light of the situation and
refused to get too serious about it.
8. Every time I thought about it I
got upset,; so I just stopped
thinking about it.
0.699
E.6.Wishful Thinking 1. I hope the problem would take
care of itself
2. I hoped a miracle would happen
3. I wished that I never let myself
get involved with that situation.
4. I wished that the situation would
go away, or somehow be over
with.
5. I wished that the situation had
never started.
6. I had fantasies or wishes about
how things might turn out..
7. I asked a friend or relative I
respect for advice.
8. I wished I could have changed
what happened.
9. I thought about fantastic and
unreal things that made me feel
better.
0.722
E.7.Self Criticism 1. I told myself that , if I wasn’t so
careless things like this wouldn’t
happen
2. I realized that I brought the
problem on myself
3. I criticized myself for what
0.786
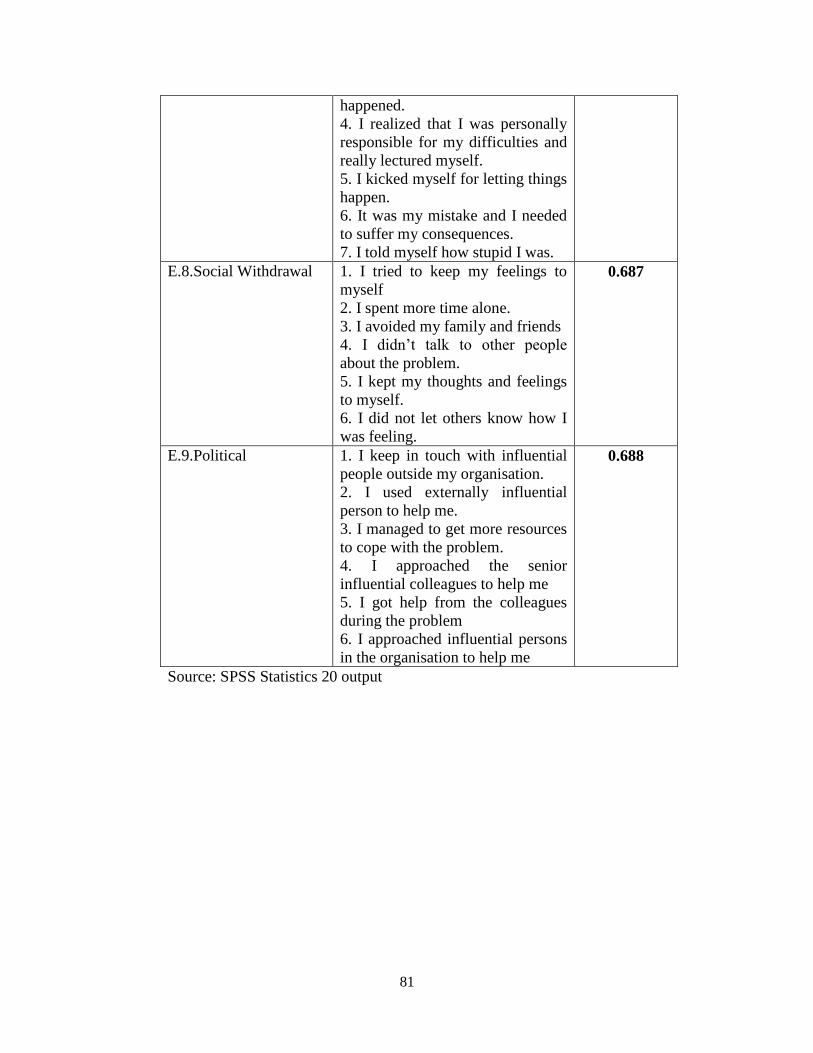
81
happened.
4. I realized that I was personally
responsible for my difficulties and
really lectured myself.
5. I kicked myself for letting things
happen.
6. It was my mistake and I needed
to suffer my consequences.
7. I told myself how stupid I was.
E.8.Social Withdrawal 1. I tried to keep my feelings to
myself
2. I spent more time alone.
3. I avoided my family and friends
4. I didn’t talk to other people
about the problem.
5. I kept my thoughts and feelings
to myself.
6. I did not let others know how I
was feeling.
0.687
E.9.Political 1. I keep in touch with influential
people outside my organisation.
2. I used externally influential
person to help me.
3. I managed to get more resources
to cope with the problem.
4. I approached the senior
influential colleagues to help me
5. I got help from the colleagues
during the problem
6. I approached influential persons
in the organisation to help me
0.688
Source: SPSS Statistics 20 output
82
CHAPTER – 6
6. DATA ANALYSIS AND INTERPRETATION
6.1. OVERVIEW:
The primary data collected during the pilot survey and the final survey, through
questionnaires, was edited, coded and analyzed using IBM SPSS 22.0 software.
Pilot survey data is analysed for corrections and modifications of the
questionnaire. The final data analysis is presented in detail in section – II of this
chapter. Data analysis is presented in two sections. Section – I deals with
qualitative data analysis and section – II deals with quantitative data analysis.
6.2. SECTION – I ANALYSIS OF QUALITATIVE DATA:
The qualitative data was collected through unstructured interview of ten
respondents occupying different positions in the organisations belonging to the
education sector of West Bengal. The original plan was to collect the data of
occupational hazards, sources of these hazards and the coping strategies adopted
by the respondents working in the education sector of West Bengal as letting the
respondents to “speak for themselves” and to hear “the people voice”.
83
Before analyzing the qualitative data the interview transcripts were read carefully
and making comments in the margin about key patterns, themes and issues in the
data. A theme is a broad category or topic. The data is read several times before it
is completely coded. A code is a way of organizing the data in terms of its subject
matter. The codes are then used to organise data into specific categories. The
major themes that have emerged from the data are divided into four categories
like occupational hazards faced, sources of these hazards, coping strategies
adapted and factors influencing the coping strategies. The categories and
respective themes are presented below.
6.2.1.1. THEME – 1 - OCCUPATIONAL HAZARD:
This theme represents the respondent’s views on the various situations in their
jobs which made them unpleasant or uncomfortable, satisfying the definition of
the term “occupational hazard”. The sub themes that were identified under this are
1) Burnout (mostly all the ten participants commented on this), 2) Campus
Violence (eight participants commented and accepted this as a usual phenomena
at the time of examination or college elections), 3) Stress (almost nine participants
commented on this speaking of having jobs other than teaching or heavy
workload) and 4) False accusation (six participants commented on this being
caused by the organisation politics).
84
6.2.1.2. THEME- IMPACT OF OCCUPATIONAL HAZARD:
This theme represents the respondent’s comments on how those unpleasant
situations impacted them individually. To this most of them viewed that their
health got affected and they had to take the help of medication because of such
unpleasant situations. Nearly eight out of ten participants commented of
sleeplessness, exhaustion, and boredom and losing interest in the job. Six of them
complained about these unpleasant situations have even damaged their
relationships with their colleagues. Five of them complained of disturbance
between wok – home balance.
6.2.1.3. THEME- FACTORS INFLUENCING OCCUPATIONAL HAZARD:
This theme represents the respondent’s perceptions as to what factors influence
the occupational hazards. This theme identified three categories of subthemes.
The first subtheme that emerged was the organisational related concepts. The
respondents perceived that the variables like organisational policies, management
issues, job profile, job security, organisational politics, students, parents and
outsiders like political parties interfacing with the employees and disturbances in
family caused the occupational hazards.
The second subtheme that emerged was about stakeholder related concepts. In this
the stakeholder multiplicity level, stakeholder complexity level, stake holder
85
interface and stakeholder administrations were very important in creating the
hazards.
The third subtheme that emerged was the task related concepts. The respondents
commented on the task complexity, task ambiguity and task description.
6.2.1.4. THEME- COPING STRATEGIES:
This theme represents the respondent’s methods of coping when faced with the
occupational hazards. Five subthemes were identified under this category.
6.2.1.4.1. SUBTHEME – UNDERESTIMATION OF THE PROBLEM –
AVOIDANCE:
The subtheme represented the respondents comment about the initial phase of the
hazard process when the unpleasantness has just started. It also includes the
respondent’s behavior and attitudes about the unpleasant situation. In this initial
phase, negative acts in most cases were generally subtle and work related, like
withholding vital information from the respondent or someone else taking the
credit of respondents achievement. All respondents have been in this first phase
and reported that they could not figure out what was going on and assumed a
passive, emotion focused attitude towards the hazard. Some used avoidance
strategies like trying to stay away from the hazard. Others blamed themselves
86
adapting self-criticism strategies and worked harder to avoid the accusations and
negligence or questioned themselves as to what wrong they had done. The third
group pretended to ignore the hazard by using humour as a coping strategy. In this
phase they did not ask the support of others or confront the hazard. However
underestimation or avoidance strategies did not help to end the hazard on the
contrary escalated it.
6.2.1.4.2. SUBTHEME – LOSING PATIENCE – CONFRONTATION:
This subtheme represents the type of the behavior that caused the respondents to
lose their patience and the varying strategies to deal with such hazards. In the
second phase the frequency and the intensity of the hazard increased. The
respondent encountered work-related hazard such as unmanageable task, person
related hazard like loud voice criticism, humiliation in front of others, insulting
comments and threats of violence. Accordingly it can be stated that confronting
strategies alone were not affective in stopping the hazard on contrary aggravated
it.
6.2.1.4.3. SUBTHEME – PERCEIVING THREATS TO PERSONAL HEALTH –
SEEKING SUPPORT:
This subtheme included the respondent’s physiological and psychological health
complaints related with their experiences and their various coping strategies that
87
helped to stop or aggravate the hazard process. All the respondents had been
through this phase and suffered a range of health related problems that included
loss of appetite, sleeplessness, nightmares, headaches and fatigues. Seeking social
support was a common coping mechanism reported in this evolving phase. It
included emotion-focused coping strategy like talking with friends and family
members to restore their morale. In addition respondents sought advocacy support
such as asking the support of colleagues to cope with the hazards. Another
problem focused strategy used in this phase was seeking support by talking to a
superior or filing formal complaint to the authorities of the organisation. These
strategies to maximum extent reduced the impact of the hazards.
6.2.1.4.4. SUBTHEME – DESPAIR – DESTRUCTIVE COPING:
This subtheme explored the fourth phase of the hazard process and included the
respondents’ narrative about how they felt unable to cope with the hazard and felt
hopeless. In this phase the respondent’s level of tolerance to the hazard is
determined to be its lowest due to their absence of energy and resource to cope.
Thereby they tried adopting emotion-focused strategies like exhibiting withdrawal
or attacking behavior. Withdrawal behavior could be like ignoring non-essential
tasks, taking sick leaves, leaving some tasks undone and going to work late or
leaving early intentionally.
88
6.2.1.4.5. SUBTHEME – GIVING UP – EXIT:
This subtheme included the respondent’s final reaction that aimed to end the
hazards like resigning, planning to resign or requesting to transfer to another
branch or department or location. This phase determined to be the final phase of
the hazard process. After trying various coping strategies unsuccessfully,
respondents had accepted that there was no sense in striving, so they gave up.
6.2.1.5. THEME- FACTORS INFLUENCING COPING STRATEGIES:
This theme was developed on the respondents perception of what could be the
factor that made them to adapt to a specific strategy. To this all the ten
respondents commented that their experience and their personality made them
adapt to a specific coping strategy.
Results of the qualitative analysis indicated the respondent’s views and comments
on the occupational hazards, impact of these hazards, factors escalating or de-
escalating the hazards, coping strategies adapted and the factors influencing the
respondent to adapt a specific coping strategy. Based on these findings a
conceptual framework has been developed.
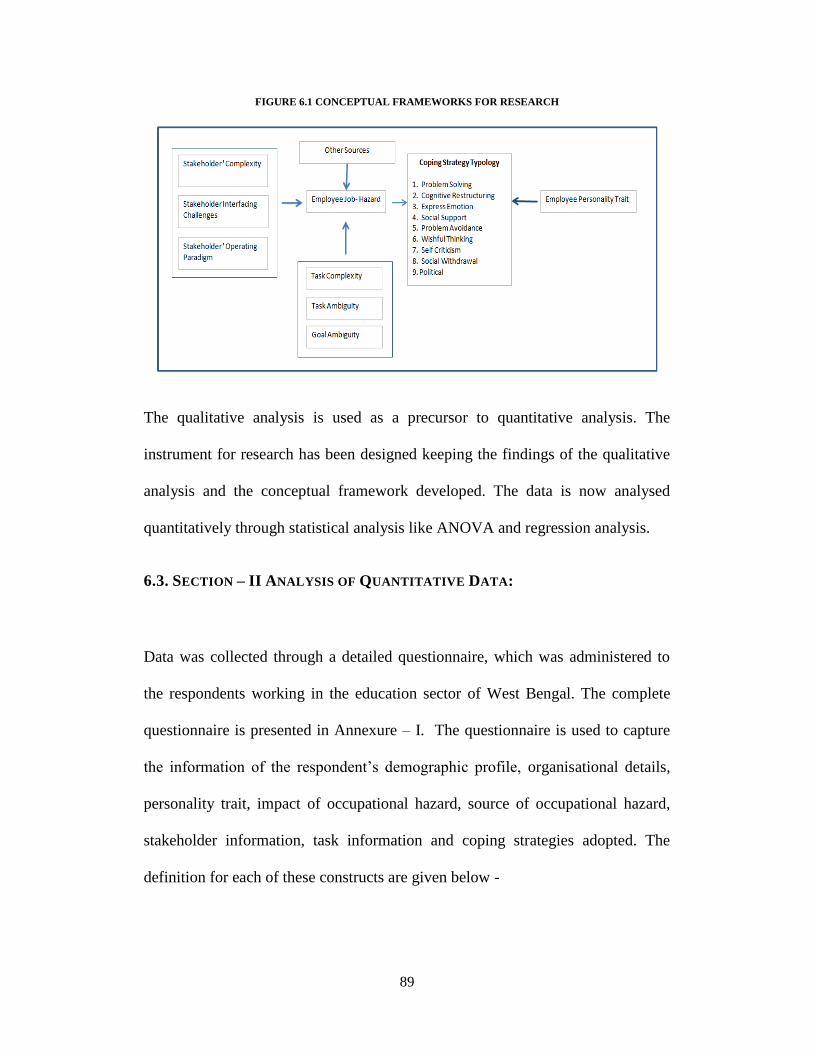
89
FIGURE 6.1 CONCEPTUAL FRAMEWORKS FOR RESEARCH
The qualitative analysis is used as a precursor to quantitative analysis. The
instrument for research has been designed keeping the findings of the qualitative
analysis and the conceptual framework developed. The data is now analysed
quantitatively through statistical analysis like ANOVA and regression analysis.
6.3. SECTION – II ANALYSIS OF QUANTITATIVE DATA:
Data was collected through a detailed questionnaire, which was administered to
the respondents working in the education sector of West Bengal. The complete
questionnaire is presented in Annexure – I. The questionnaire is used to capture
the information of the respondent’s demographic profile, organisational details,
personality trait, impact of occupational hazard, source of occupational hazard,
stakeholder information, task information and coping strategies adopted. The
definition for each of these constructs are given below -
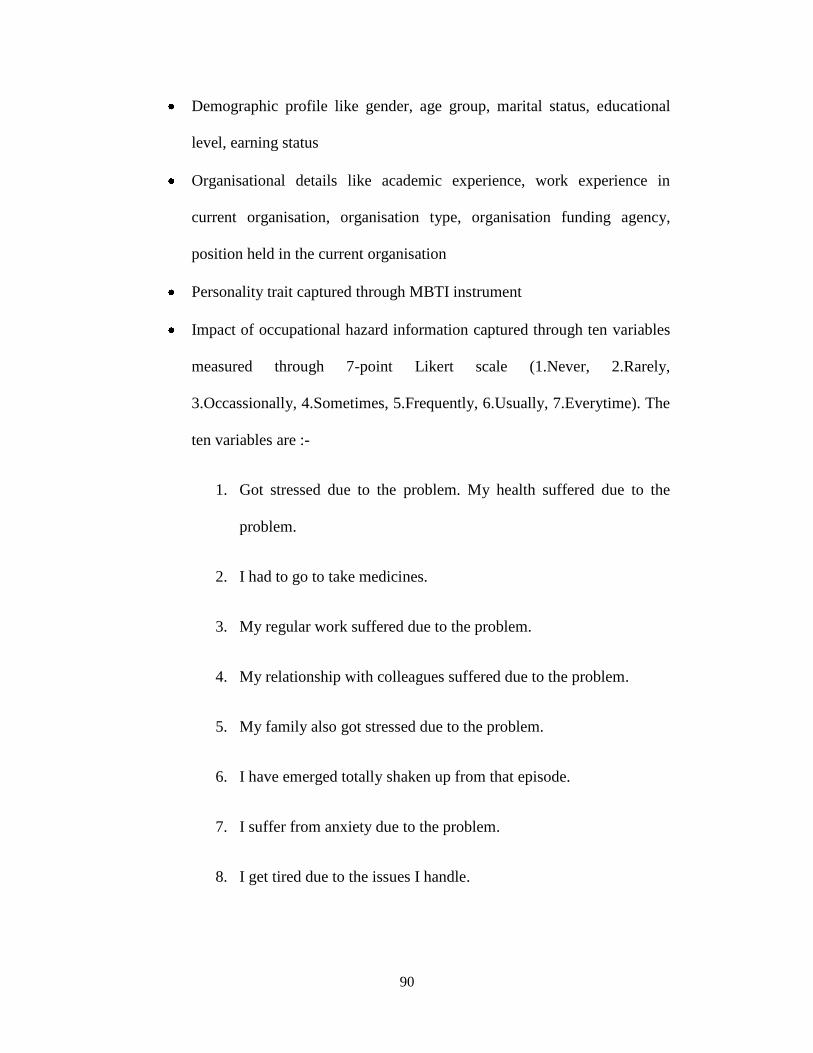
90
Demographic profile like gender, age group, marital status, educational
level, earning status
Organisational details like academic experience, work experience in
current organisation, organisation type, organisation funding agency,
position held in the current organisation
Personality trait captured through MBTI instrument
Impact of occupational hazard information captured through ten variables
measured through 7-point Likert scale (1.Never, 2.Rarely,
3.Occassionally, 4.Sometimes, 5.Frequently, 6.Usually, 7.Everytime). The
ten variables are :-
1. Got stressed due to the problem. My health suffered due to the
problem.
2. I had to go to take medicines.
3. My regular work suffered due to the problem.
4. My relationship with colleagues suffered due to the problem.
5. My family also got stressed due to the problem.
6. I have emerged totally shaken up from that episode.
7. I suffer from anxiety due to the problem.
8. I get tired due to the issues I handle.
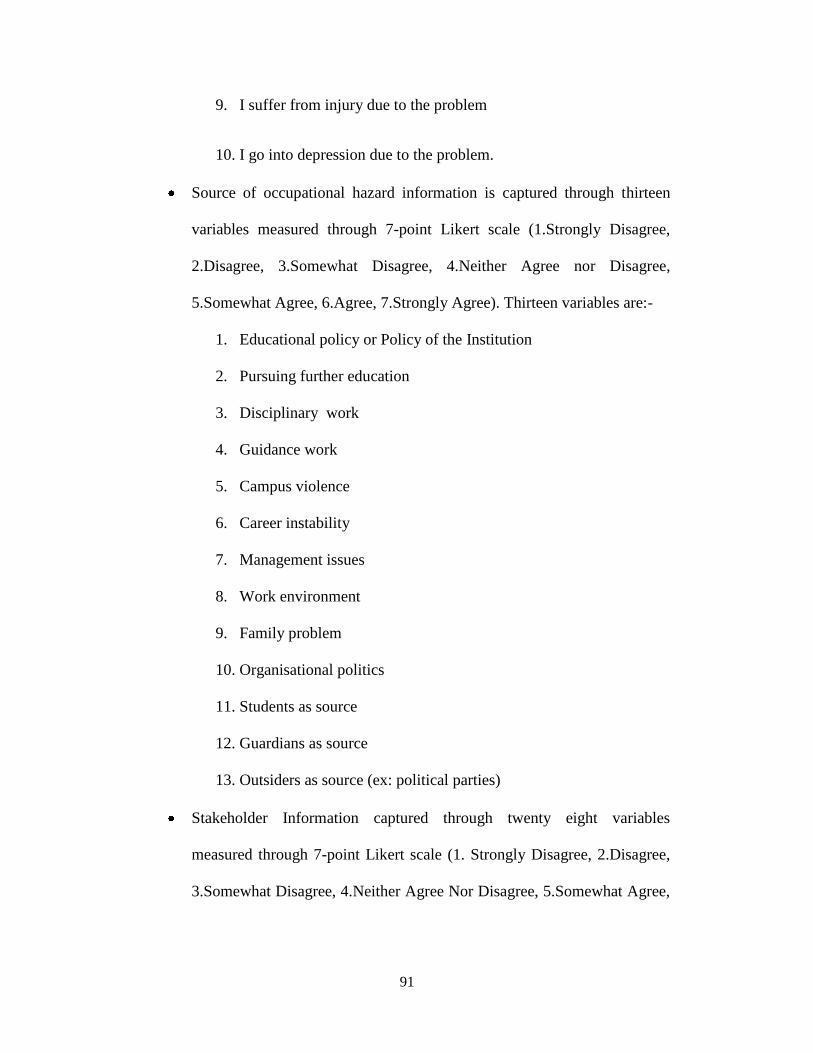
91
9. I suffer from injury due to the problem
10. I go into depression due to the problem.
Source of occupational hazard information is captured through thirteen
variables measured through 7-point Likert scale (1.Strongly Disagree,
2.Disagree, 3.Somewhat Disagree, 4.Neither Agree nor Disagree,
5.Somewhat Agree, 6.Agree, 7.Strongly Agree). Thirteen variables are:-
1. Educational policy or Policy of the Institution
2. Pursuing further education
3. Disciplinary work
4. Guidance work
5. Campus violence
6. Career instability
7. Management issues
8. Work environment
9. Family problem
10. Organisational politics
11. Students as source
12. Guardians as source
13. Outsiders as source (ex: political parties)
Stakeholder Information captured through twenty eight variables
measured through 7-point Likert scale (1. Strongly Disagree, 2.Disagree,
3.Somewhat Disagree, 4.Neither Agree Nor Disagree, 5.Somewhat Agree,
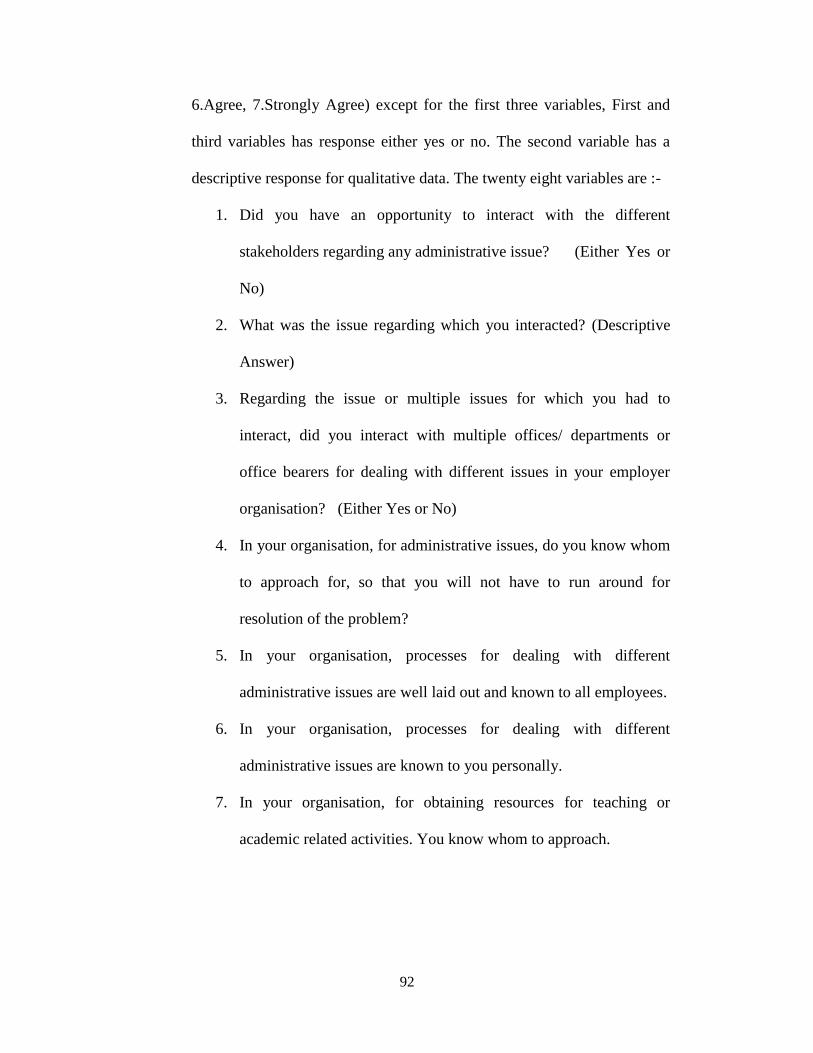
92
6.Agree, 7.Strongly Agree) except for the first three variables, First and
third variables has response either yes or no. The second variable has a
descriptive response for qualitative data. The twenty eight variables are :-
1. Did you have an opportunity to interact with the different
stakeholders regarding any administrative issue? (Either Yes or
No)
2. What was the issue regarding which you interacted? (Descriptive
Answer)
3. Regarding the issue or multiple issues for which you had to
interact, did you interact with multiple offices/ departments or
office bearers for dealing with different issues in your employer
organisation? (Either Yes or No)
4. In your organisation, for administrative issues, do you know whom
to approach for, so that you will not have to run around for
resolution of the problem?
5. In your organisation, processes for dealing with different
administrative issues are well laid out and known to all employees.
6. In your organisation, processes for dealing with different
administrative issues are known to you personally.
7. In your organisation, for obtaining resources for teaching or
academic related activities. You know whom to approach.
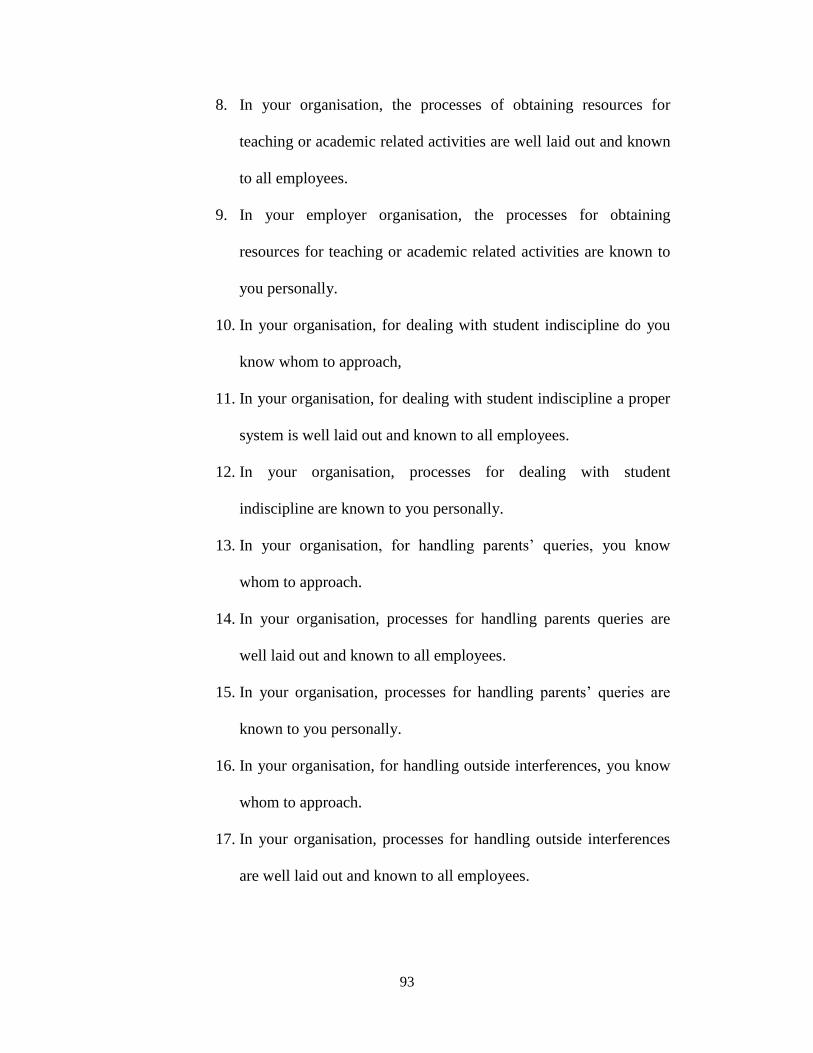
93
8. In your organisation, the processes of obtaining resources for
teaching or academic related activities are well laid out and known
to all employees.
9. In your employer organisation, the processes for obtaining
resources for teaching or academic related activities are known to
you personally.
10. In your organisation, for dealing with student indiscipline do you
know whom to approach,
11. In your organisation, for dealing with student indiscipline a proper
system is well laid out and known to all employees.
12. In your organisation, processes for dealing with student
indiscipline are known to you personally.
13. In your organisation, for handling parents’ queries, you know
whom to approach.
14. In your organisation, processes for handling parents queries are
well laid out and known to all employees.
15. In your organisation, processes for handling parents’ queries are
known to you personally.
16. In your organisation, for handling outside interferences, you know
whom to approach.
17. In your organisation, processes for handling outside interferences
are well laid out and known to all employees.
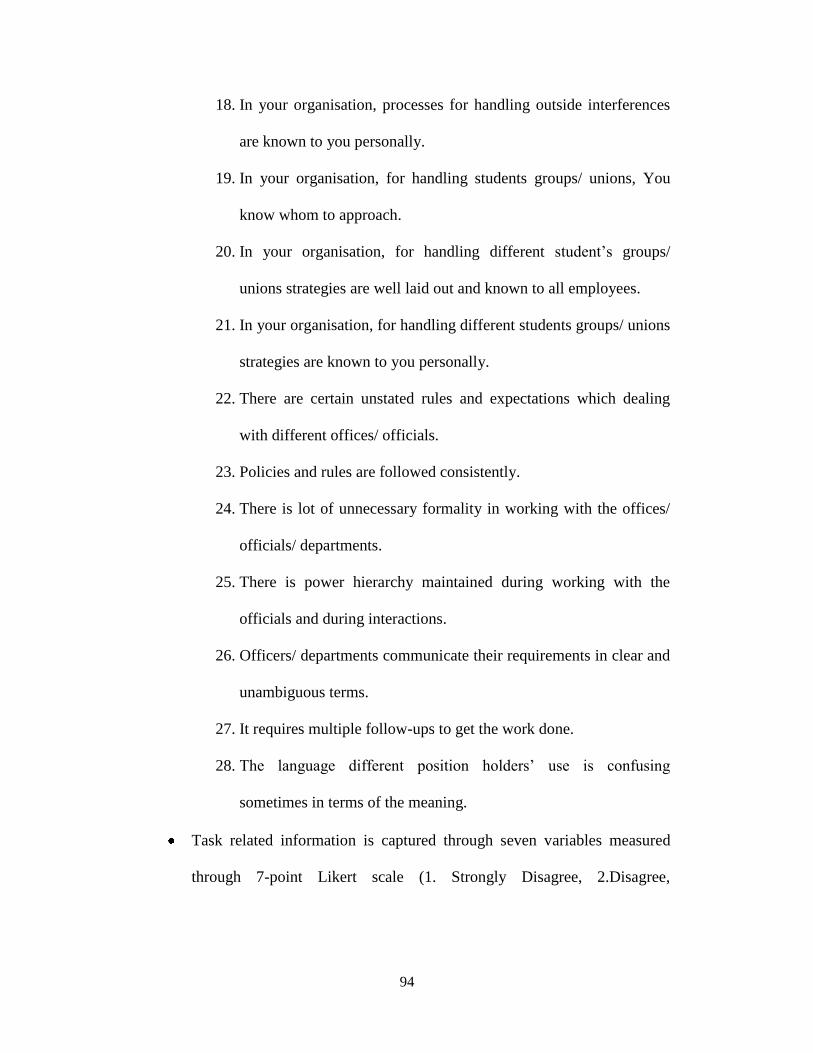
94
18. In your organisation, processes for handling outside interferences
are known to you personally.
19. In your organisation, for handling students groups/ unions, You
know whom to approach.
20. In your organisation, for handling different student’s groups/
unions strategies are well laid out and known to all employees.
21. In your organisation, for handling different students groups/ unions
strategies are known to you personally.
22. There are certain unstated rules and expectations which dealing
with different offices/ officials.
23. Policies and rules are followed consistently.
24. There is lot of unnecessary formality in working with the offices/
officials/ departments.
25. There is power hierarchy maintained during working with the
officials and during interactions.
26. Officers/ departments communicate their requirements in clear and
unambiguous terms.
27. It requires multiple follow-ups to get the work done.
28. The language different position holders’ use is confusing
sometimes in terms of the meaning.
Task related information is captured through seven variables measured
through 7-point Likert scale (1. Strongly Disagree, 2.Disagree,
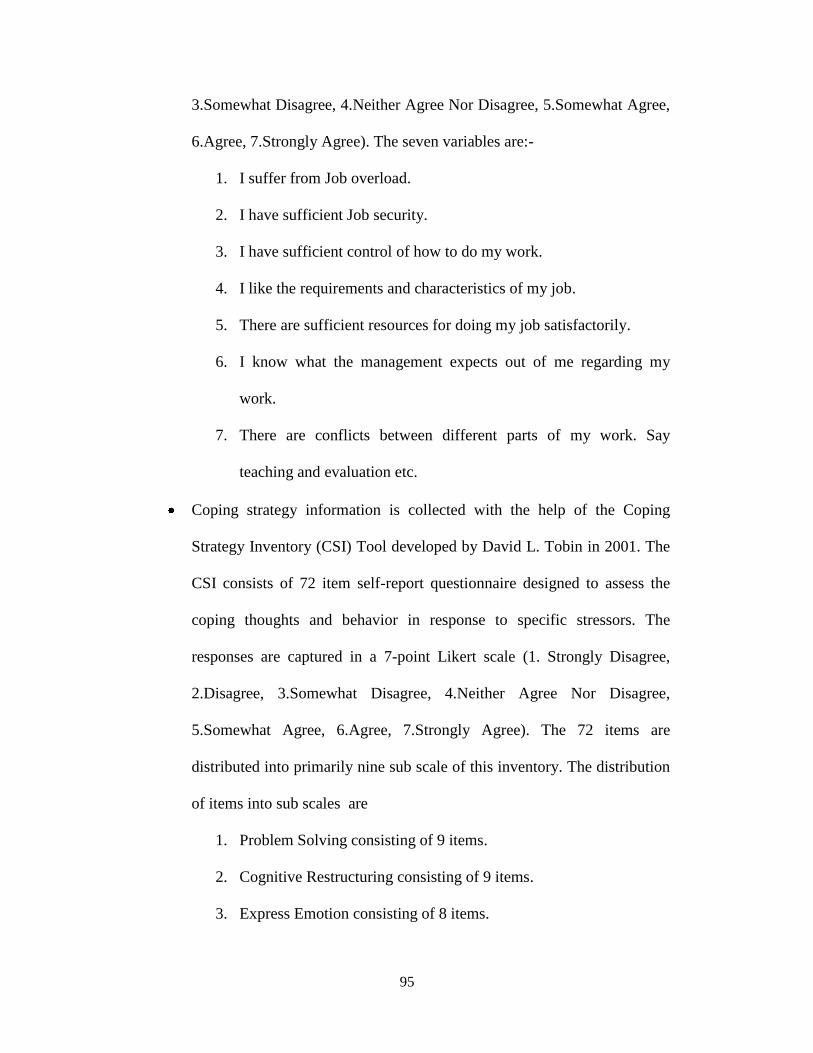
95
3.Somewhat Disagree, 4.Neither Agree Nor Disagree, 5.Somewhat Agree,
6.Agree, 7.Strongly Agree). The seven variables are:-
1. I suffer from Job overload.
2. I have sufficient Job security.
3. I have sufficient control of how to do my work.
4. I like the requirements and characteristics of my job.
5. There are sufficient resources for doing my job satisfactorily.
6. I know what the management expects out of me regarding my
work.
7. There are conflicts between different parts of my work. Say
teaching and evaluation etc.
Coping strategy information is collected with the help of the Coping
Strategy Inventory (CSI) Tool developed by David L. Tobin in 2001. The
CSI consists of 72 item self-report questionnaire designed to assess the
coping thoughts and behavior in response to specific stressors. The
responses are captured in a 7-point Likert scale (1. Strongly Disagree,
2.Disagree, 3.Somewhat Disagree, 4.Neither Agree Nor Disagree,
5.Somewhat Agree, 6.Agree, 7.Strongly Agree). The 72 items are
distributed into primarily nine sub scale of this inventory. The distribution
of items into sub scales are
1. Problem Solving consisting of 9 items.
2. Cognitive Restructuring consisting of 9 items.
3. Express Emotion consisting of 8 items.
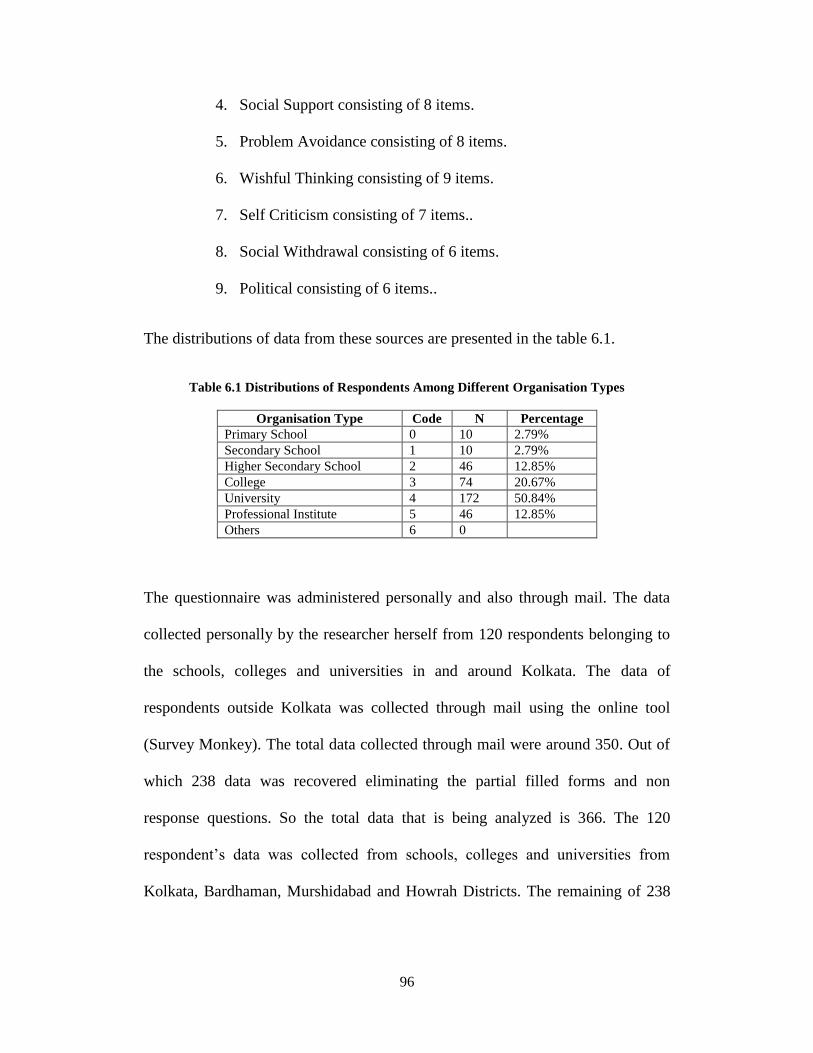
96
4. Social Support consisting of 8 items.
5. Problem Avoidance consisting of 8 items.
6. Wishful Thinking consisting of 9 items.
7. Self Criticism consisting of 7 items..
8. Social Withdrawal consisting of 6 items.
9. Political consisting of 6 items..
The distributions of data from these sources are presented in the table 6.1.
Table 6.1 Distributions of Respondents Among Different Organisation Types
Organisation Type Code N Percentage
Primary School 0 10 2.79%
Secondary School 1 10 2.79%
Higher Secondary School 2 46 12.85%
College 3 74 20.67%
University 4 172 50.84%
Professional Institute 5 46 12.85%
Others 6 0
The questionnaire was administered personally and also through mail. The data
collected personally by the researcher herself from 120 respondents belonging to
the schools, colleges and universities in and around Kolkata. The data of
respondents outside Kolkata was collected through mail using the online tool
(Survey Monkey). The total data collected through mail were around 350. Out of
which 238 data was recovered eliminating the partial filled forms and non
response questions. So the total data that is being analyzed is 366. The 120
respondent’s data was collected from schools, colleges and universities from
Kolkata, Bardhaman, Murshidabad and Howrah Districts. The remaining of 238
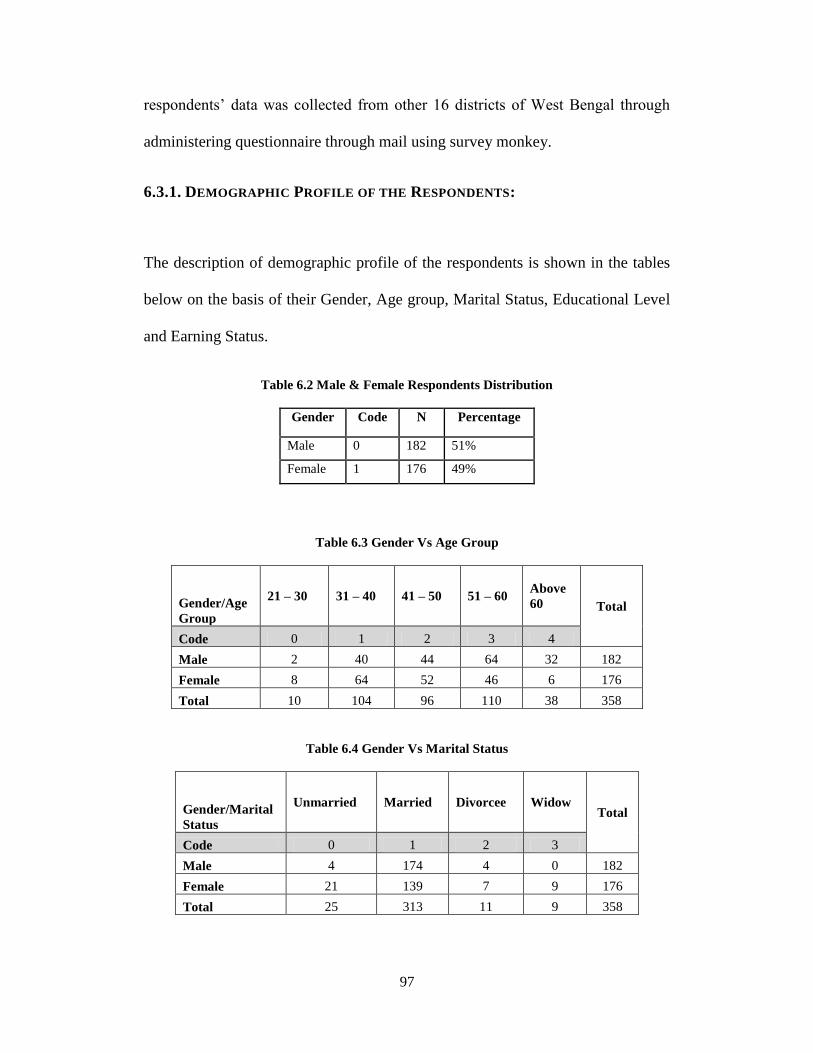
97
respondents’ data was collected from other 16 districts of West Bengal through
administering questionnaire through mail using survey monkey.
6.3.1. DEMOGRAPHIC PROFILE OF THE RESPONDENTS:
The description of demographic profile of the respondents is shown in the tables
below on the basis of their Gender, Age group, Marital Status, Educational Level
and Earning Status.
Table 6.2 Male & Female Respondents Distribution
Gender Code N Percentage
Male 0 182 51%
Female 1 176 49%
Table 6.3 Gender Vs Age Group
Gender/Age
Group
21 – 30 31 – 40 41 – 50 51 – 60 Above
60 Total
Code 0 1 2 3 4
Male 2 40 44 64 32 182
Female 8 64 52 46 6 176
Total 10 104 96 110 38 358
Table 6.4 Gender Vs Marital Status
Gender/Marital
Status
Unmarried Married Divorcee Widow Total
Code 0 1 2 3
Male 4 174 4 0 182
Female 21 139 7 9 176
Total 25 313 11 9 358
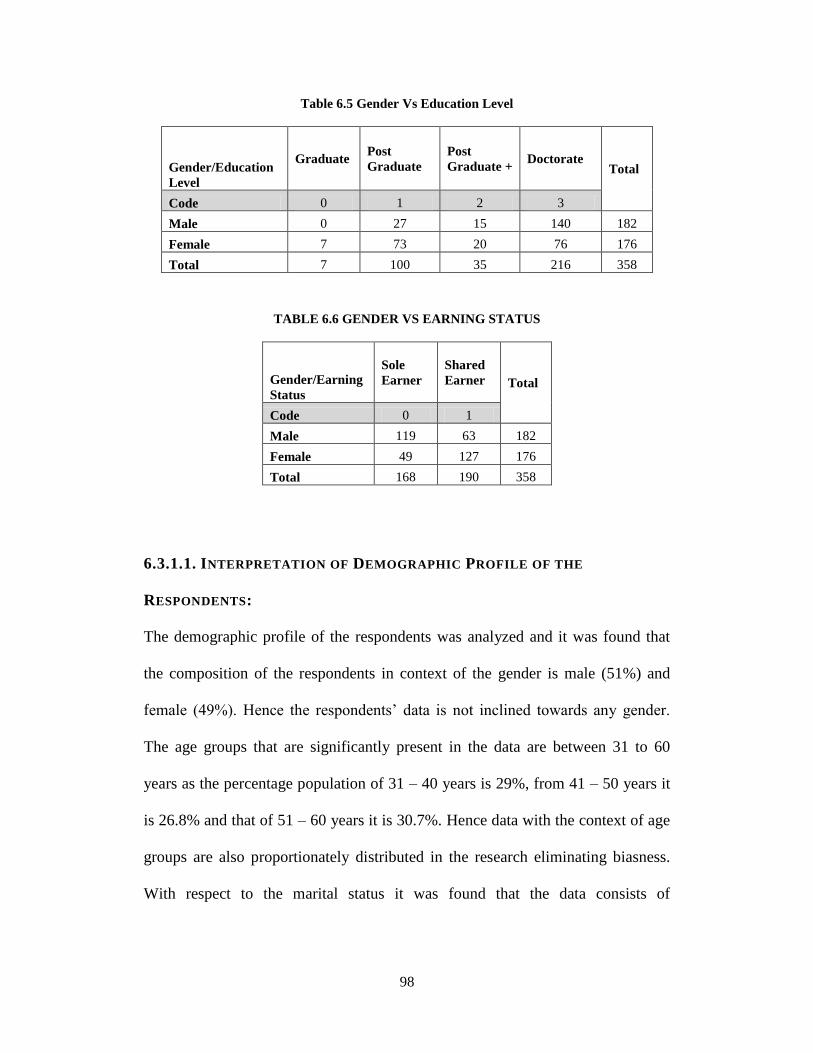
98
Table 6.5 Gender Vs Education Level
Gender/Education
Level
Graduate Post
Graduate
Post
Graduate + Doctorate
Total
Code 0 1 2 3
Male 0 27 15 140 182
Female 7 73 20 76 176
Total 7 100 35 216 358
TABLE 6.6 GENDER VS EARNING STATUS
Gender/Earning
Status
Sole
Earner
Shared
Earner Total
Code 0 1
Male 119 63 182
Female 49 127 176
Total 168 190 358
6.3.1.1. INTERPRETATION OF DEMOGRAPHIC PROFILE OF THE
RESPONDENTS:
The demographic profile of the respondents was analyzed and it was found that
the composition of the respondents in context of the gender is male (51%) and
female (49%). Hence the respondents’ data is not inclined towards any gender.
The age groups that are significantly present in the data are between 31 to 60
years as the percentage population of 31 – 40 years is 29%, from 41 – 50 years it
is 26.8% and that of 51 – 60 years it is 30.7%. Hence data with the context of age
groups are also proportionately distributed in the research eliminating biasness.
With respect to the marital status it was found that the data consists of
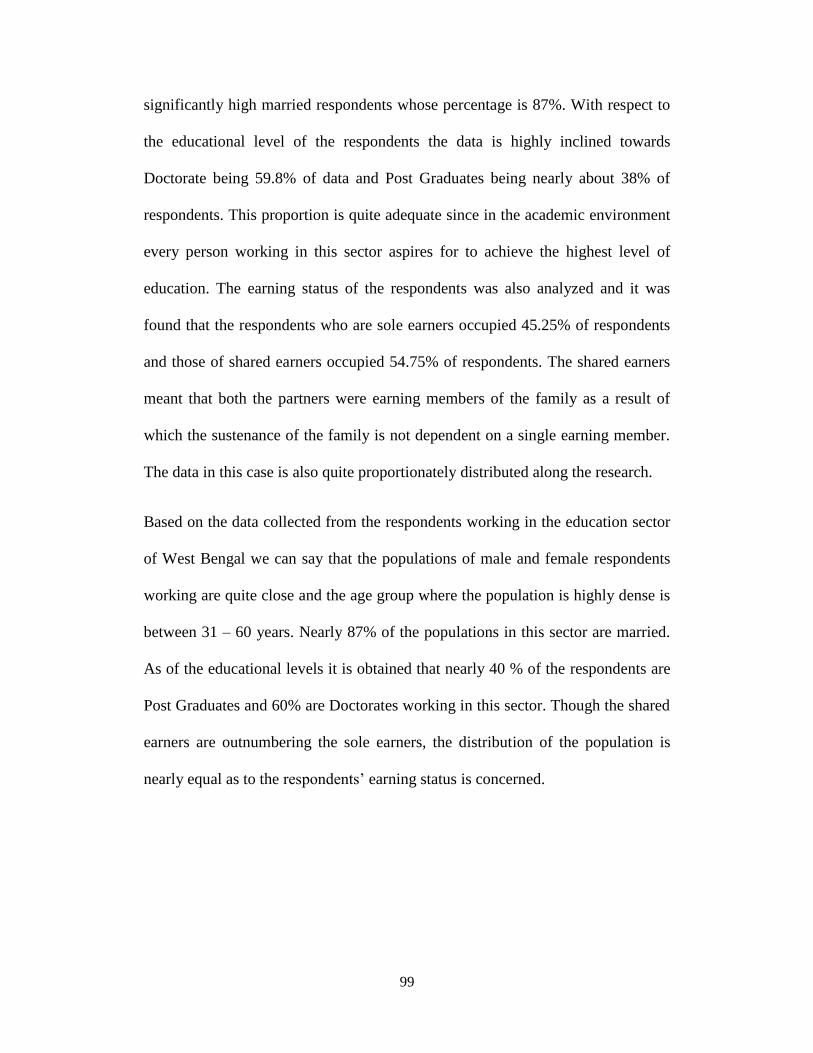
99
significantly high married respondents whose percentage is 87%. With respect to
the educational level of the respondents the data is highly inclined towards
Doctorate being 59.8% of data and Post Graduates being nearly about 38% of
respondents. This proportion is quite adequate since in the academic environment
every person working in this sector aspires for to achieve the highest level of
education. The earning status of the respondents was also analyzed and it was
found that the respondents who are sole earners occupied 45.25% of respondents
and those of shared earners occupied 54.75% of respondents. The shared earners
meant that both the partners were earning members of the family as a result of
which the sustenance of the family is not dependent on a single earning member.
The data in this case is also quite proportionately distributed along the research.
Based on the data collected from the respondents working in the education sector
of West Bengal we can say that the populations of male and female respondents
working are quite close and the age group where the population is highly dense is
between 31 – 60 years. Nearly 87% of the populations in this sector are married.
As of the educational levels it is obtained that nearly 40 % of the respondents are
Post Graduates and 60% are Doctorates working in this sector. Though the shared
earners are outnumbering the sole earners, the distribution of the population is
nearly equal as to the respondents’ earning status is concerned.
100
6.3.2. OCCUPATIONAL PROFILE OF THE RESPONDENTS:
In the Occupational Profile of the respondents the variables that are considered
are Academic Experience, Mode of Working, Organisation Type, Funding mode
of the Organisation and the Current Position held in the organisation. The data is
represented in the form of tables shown below:-
Table 6.7 Gender Vs Academic Experience
Gender/Academic
Experience in years
Less than
1 1 – 5 6 – 10 11 – 15
Greater
than 15 Total
Code 0 1 2 3 4
Male 0 13 21 77 71 182
Female 0 10 45 59 62 176
Total 0 23 66 136 133 358
Table 6.8 Gender Vs Mode Of Working
Gender/Mode of
Working Permanent Visiting
On
Probation Retired
Total
Code 0 1 2 3
Male 166 3 4 9 182
Female 161 5 3 7 176
Total 327 8 7 16 358
Table 6.9 Gender Vs Organisation Type
Gender/Orga
nisation Type
Primary
School
Secondary
School
Higher
Secondary
School
College University Professional
Institute Others
Total
Code 0 1 2 3 4 5 6
Male 5 0 4 20 116 32 0 182
Female 5 10 44 55 54 13 0 176
Total 10 10 48 75 170 45 0 358
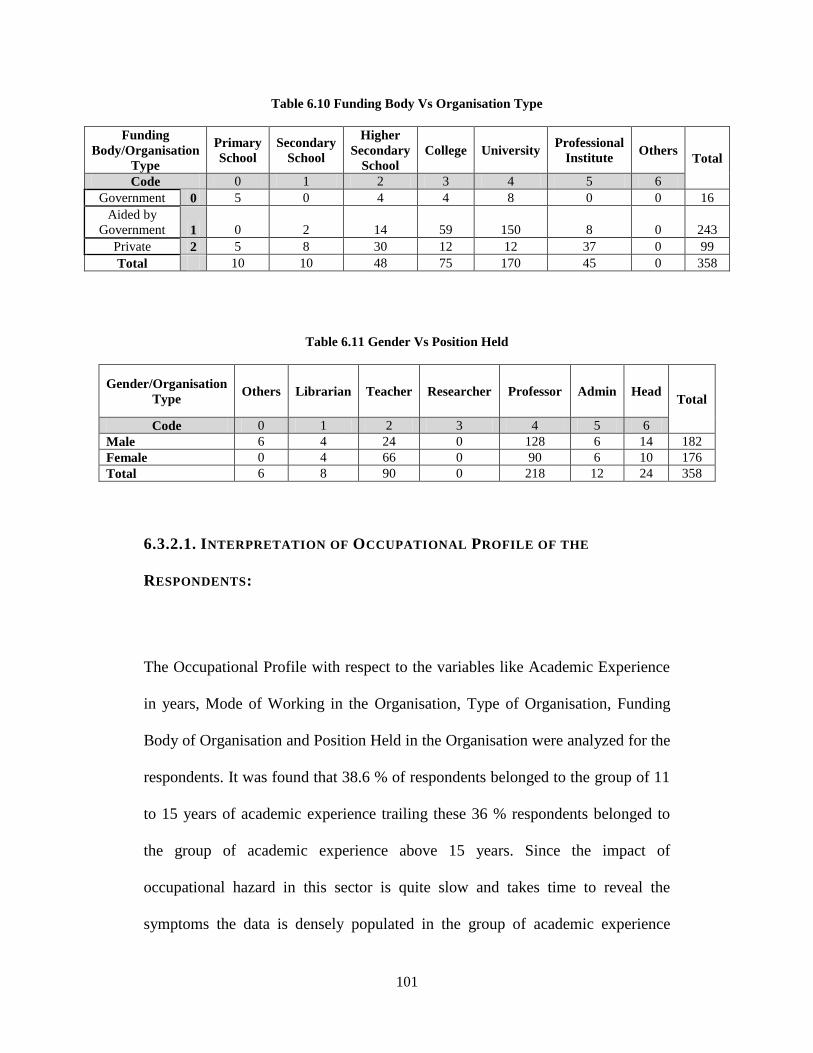
101
Table 6.10 Funding Body Vs Organisation Type
Funding
Body/Organisation
Type
Primary
School
Secondary
School
Higher
Secondary
School
College University Professional
Institute Others
Total
Code 0 1 2 3 4 5 6
Government 0 5 0 4 4 8 0 0 16
Aided by
Government 1 0 2 14 59 150 8 0 243
Private 2 5 8 30 12 12 37 0 99
Total 10 10 48 75 170 45 0 358
Table 6.11 Gender Vs Position Held
Gender/Organisation
Type Others Librarian Teacher Researcher Professor Admin Head
Total
Code 0 1 2 3 4 5 6
Male 6 4 24 0 128 6 14 182
Female 0 4 66 0 90 6 10 176
Total 6 8 90 0 218 12 24 358
6.3.2.1. INTERPRETATION OF OCCUPATIONAL PROFILE OF THE
RESPONDENTS:
The Occupational Profile with respect to the variables like Academic Experience
in years, Mode of Working in the Organisation, Type of Organisation, Funding
Body of Organisation and Position Held in the Organisation were analyzed for the
respondents. It was found that 38.6 % of respondents belonged to the group of 11
to 15 years of academic experience trailing these 36 % respondents belonged to
the group of academic experience above 15 years. Since the impact of
occupational hazard in this sector is quite slow and takes time to reveal the
symptoms the data is densely populated in the group of academic experience
102
greater than 6 years which is about 92.81 %. In the context of Mode of Working
the data of permanently employed respondents were considered where the
respondent’s population is about 91 %. Though temporarily employed and retired
respondents were also considered at 4 % and 5 % of respondents to analyse for
variations in the data. Near about 50% respondents belonged to be working in the
universities and about 15 % respondents belonged to secondary and higher
secondary schools. About 13 % respondents belonged to the professional
institutes like Indian Institute of Management, Kolkata, Indian Institute of
Technology, Kharagpur and also few private management schools in and around
Kolkata. 67 % of organisations in this sector are aided by government and
approximately 28 % of the organisations are run privately which was considered
for this research. Nearly 61% of respondents worked in the position of professor
and 25 % worked in the position of teachers. To analyse the variance among the
positions 8% of respondents working as head of the organisation or department
and 3 % of respondents working as administrators were also considered.
6.3.3. PERSONALITY TRAITS OF THE RESPONDENTS:
To analyse and identify the Personality Traits of the respondents MBTI tool is
used with the permission from CPP Inc... The score key as used by Harley
Friedman and advised by Nancy Schaubhut, M.S, Program coordinator of CPP
Inc is attached in the Annexure – III.The response was analysed with the score
key and the results are given in the Table 6.12.
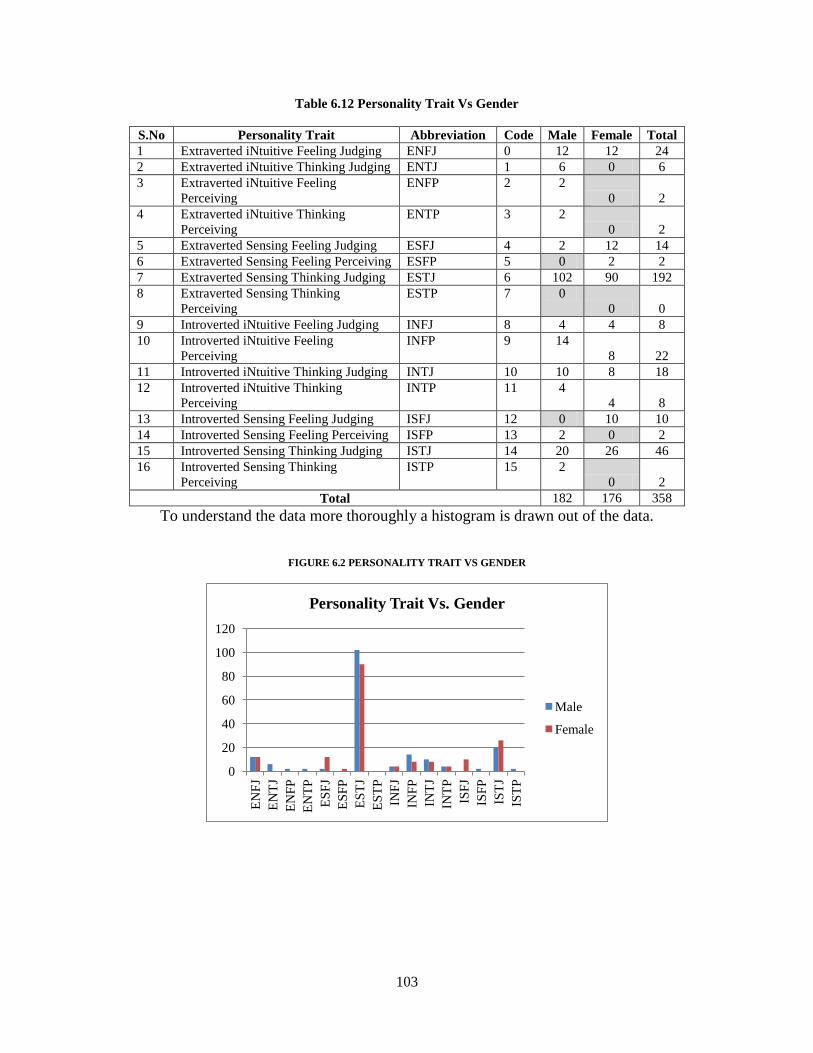
103
Table 6.12 Personality Trait Vs Gender
S.No Personality Trait Abbreviation Code Male Female Total
1 Extraverted iNtuitive Feeling Judging ENFJ 0 12 12 24
2 Extraverted iNtuitive Thinking Judging ENTJ 1 6 0 6
3 Extraverted iNtuitive Feeling
Perceiving
ENFP 2 2
0 2
4 Extraverted iNtuitive Thinking
Perceiving
ENTP 3 2
0 2
5 Extraverted Sensing Feeling Judging ESFJ 4 2 12 14
6 Extraverted Sensing Feeling Perceiving ESFP 5 0 2 2
7 Extraverted Sensing Thinking Judging ESTJ 6 102 90 192
8 Extraverted Sensing Thinking
Perceiving
ESTP 7 0
0 0
9 Introverted iNtuitive Feeling Judging INFJ 8 4 4 8
10 Introverted iNtuitive Feeling
Perceiving
INFP 9 14
8 22
11 Introverted iNtuitive Thinking Judging INTJ 10 10 8 18
12 Introverted iNtuitive Thinking
Perceiving
INTP 11 4
4 8
13 Introverted Sensing Feeling Judging ISFJ 12 0 10 10
14 Introverted Sensing Feeling Perceiving ISFP 13 2 0 2
15 Introverted Sensing Thinking Judging ISTJ 14 20 26 46
16 Introverted Sensing Thinking
Perceiving
ISTP 15 2
0 2
Total 182 176 358
To understand the data more thoroughly a histogram is drawn out of the data.
FIGURE 6.2 PERSONALITY TRAIT VS GENDER
0
20
40
60
80
100
120
EN
FJ
EN
TJ
EN
FP
EN
TP
ES
FJ
ES
FP
ES
TJ
ES
TP
INF
J
INF
P
INT
J
INT
P
ISF
J
ISF
P
IST
J
IST
P
Personality Trait Vs. Gender
Male
Female
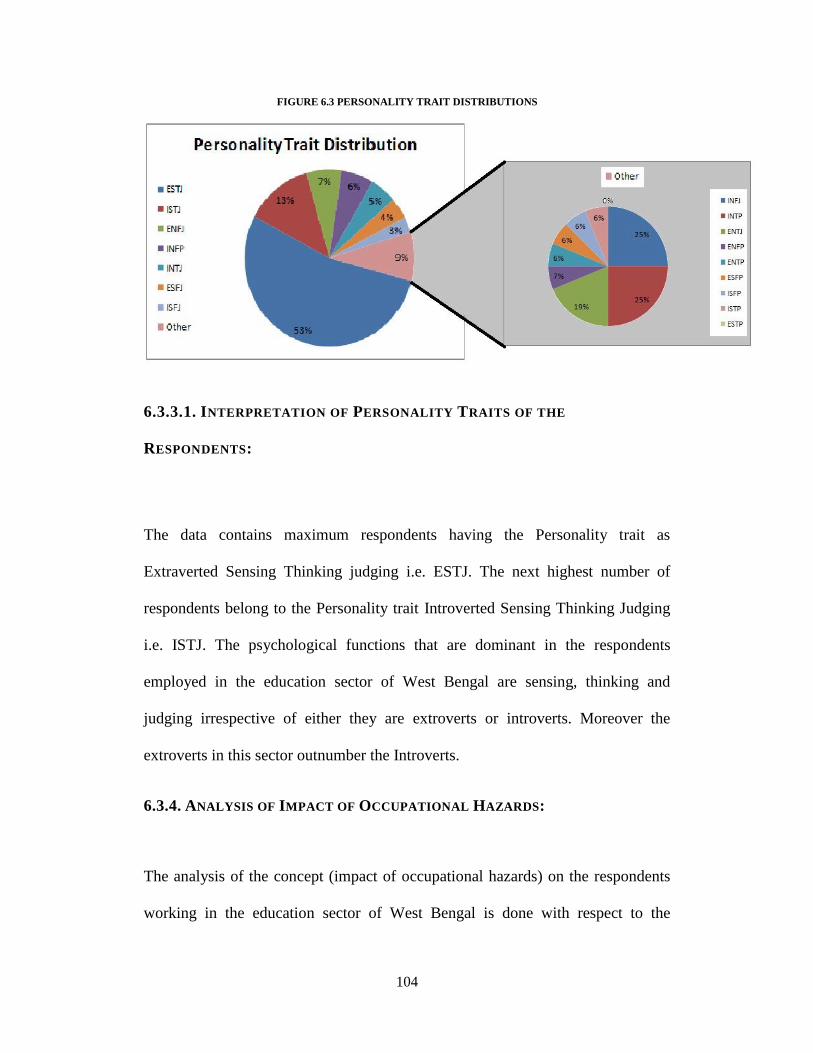
104
FIGURE 6.3 PERSONALITY TRAIT DISTRIBUTIONS
6.3.3.1. INTERPRETATION OF PERSONALITY TRAITS OF THE
RESPONDENTS:
The data contains maximum respondents having the Personality trait as
Extraverted Sensing Thinking judging i.e. ESTJ. The next highest number of
respondents belong to the Personality trait Introverted Sensing Thinking Judging
i.e. ISTJ. The psychological functions that are dominant in the respondents
employed in the education sector of West Bengal are sensing, thinking and
judging irrespective of either they are extroverts or introverts. Moreover the
extroverts in this sector outnumber the Introverts.
6.3.4. ANALYSIS OF IMPACT OF OCCUPATIONAL HAZARDS:
The analysis of the concept (impact of occupational hazards) on the respondents
working in the education sector of West Bengal is done with respect to the
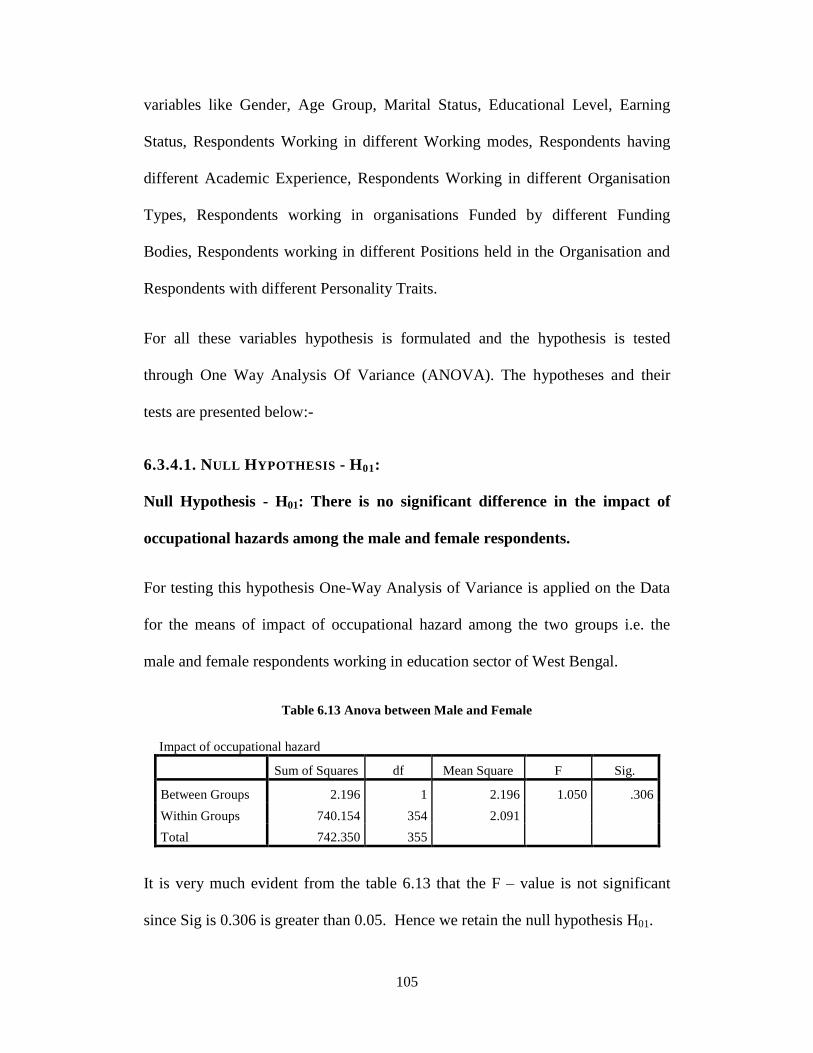
105
variables like Gender, Age Group, Marital Status, Educational Level, Earning
Status, Respondents Working in different Working modes, Respondents having
different Academic Experience, Respondents Working in different Organisation
Types, Respondents working in organisations Funded by different Funding
Bodies, Respondents working in different Positions held in the Organisation and
Respondents with different Personality Traits.
For all these variables hypothesis is formulated and the hypothesis is tested
through One Way Analysis Of Variance (ANOVA). The hypotheses and their
tests are presented below:-
6.3.4.1. NULL HYPOTHESIS - H01:
Null Hypothesis - H01: There is no significant difference in the impact of
occupational hazards among the male and female respondents.
For testing this hypothesis One-Way Analysis of Variance is applied on the Data
for the means of impact of occupational hazard among the two groups i.e. the
male and female respondents working in education sector of West Bengal.
Table 6.13 Anova between Male and Female
Impact of occupational hazard
Sum of Squares df Mean Square F Sig.
Between Groups 2.196 1 2.196 1.050 .306
Within Groups 740.154 354 2.091
Total 742.350 355
It is very much evident from the table 6.13 that the F – value is not significant
since Sig is 0.306 is greater than 0.05. Hence we retain the null hypothesis H01.
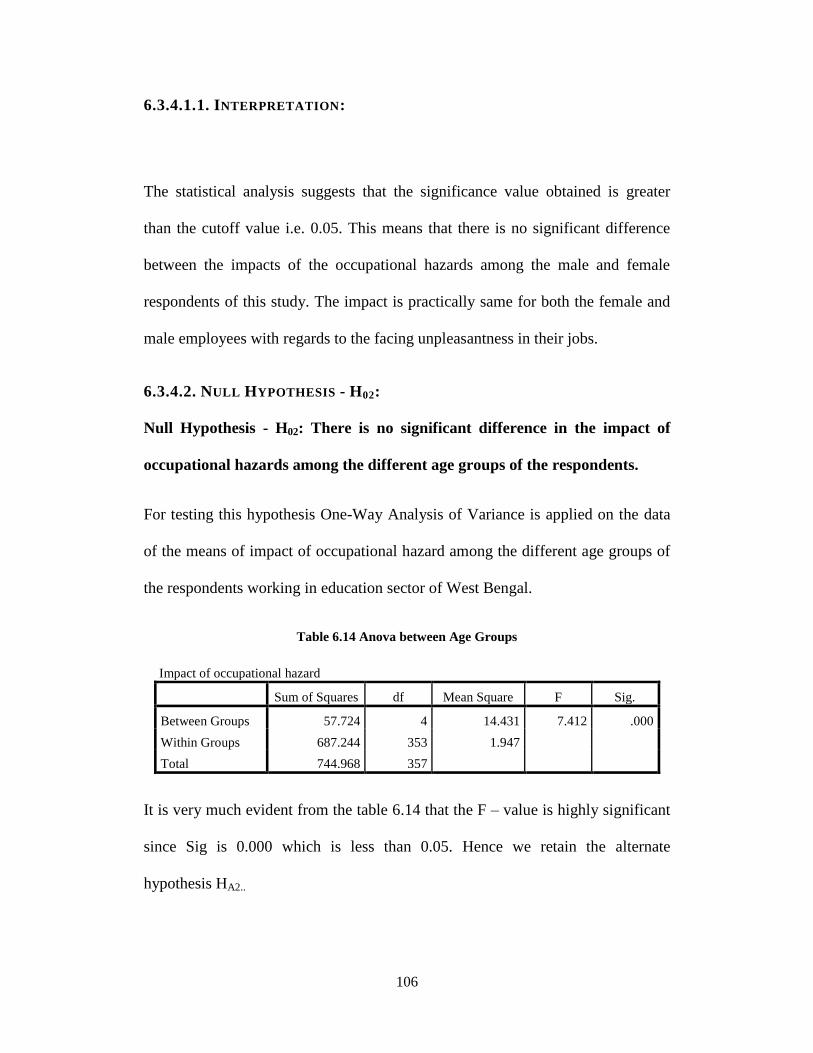
106
6.3.4.1.1. INTERPRETATION:
The statistical analysis suggests that the significance value obtained is greater
than the cutoff value i.e. 0.05. This means that there is no significant difference
between the impacts of the occupational hazards among the male and female
respondents of this study. The impact is practically same for both the female and
male employees with regards to the facing unpleasantness in their jobs.
6.3.4.2. NULL HYPOTHESIS - H02:
Null Hypothesis - H02: There is no significant difference in the impact of
occupational hazards among the different age groups of the respondents.
For testing this hypothesis One-Way Analysis of Variance is applied on the data
of the means of impact of occupational hazard among the different age groups of
the respondents working in education sector of West Bengal.
Table 6.14 Anova between Age Groups
Impact of occupational hazard
Sum of Squares df Mean Square F Sig.
Between Groups 57.724 4 14.431 7.412 .000
Within Groups 687.244 353 1.947
Total 744.968 357
It is very much evident from the table 6.14 that the F – value is highly significant
since Sig is 0.000 which is less than 0.05. Hence we retain the alternate
hypothesis HA2..
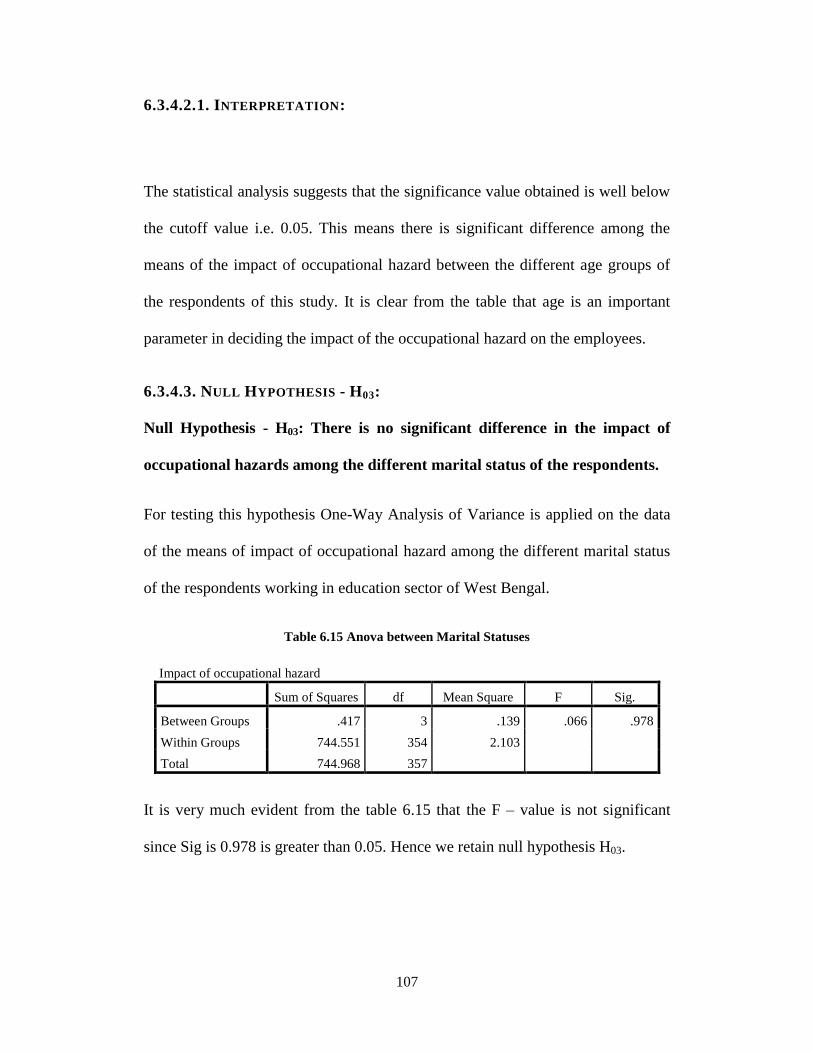
107
6.3.4.2.1. INTERPRETATION:
The statistical analysis suggests that the significance value obtained is well below
the cutoff value i.e. 0.05. This means there is significant difference among the
means of the impact of occupational hazard between the different age groups of
the respondents of this study. It is clear from the table that age is an important
parameter in deciding the impact of the occupational hazard on the employees.
6.3.4.3. NULL HYPOTHESIS - H03:
Null Hypothesis - H03: There is no significant difference in the impact of
occupational hazards among the different marital status of the respondents.
For testing this hypothesis One-Way Analysis of Variance is applied on the data
of the means of impact of occupational hazard among the different marital status
of the respondents working in education sector of West Bengal.
Table 6.15 Anova between Marital Statuses
Impact of occupational hazard
Sum of Squares df Mean Square F Sig.
Between Groups .417 3 .139 .066 .978
Within Groups 744.551 354 2.103
Total 744.968 357
It is very much evident from the table 6.15 that the F – value is not significant
since Sig is 0.978 is greater than 0.05. Hence we retain null hypothesis H03.
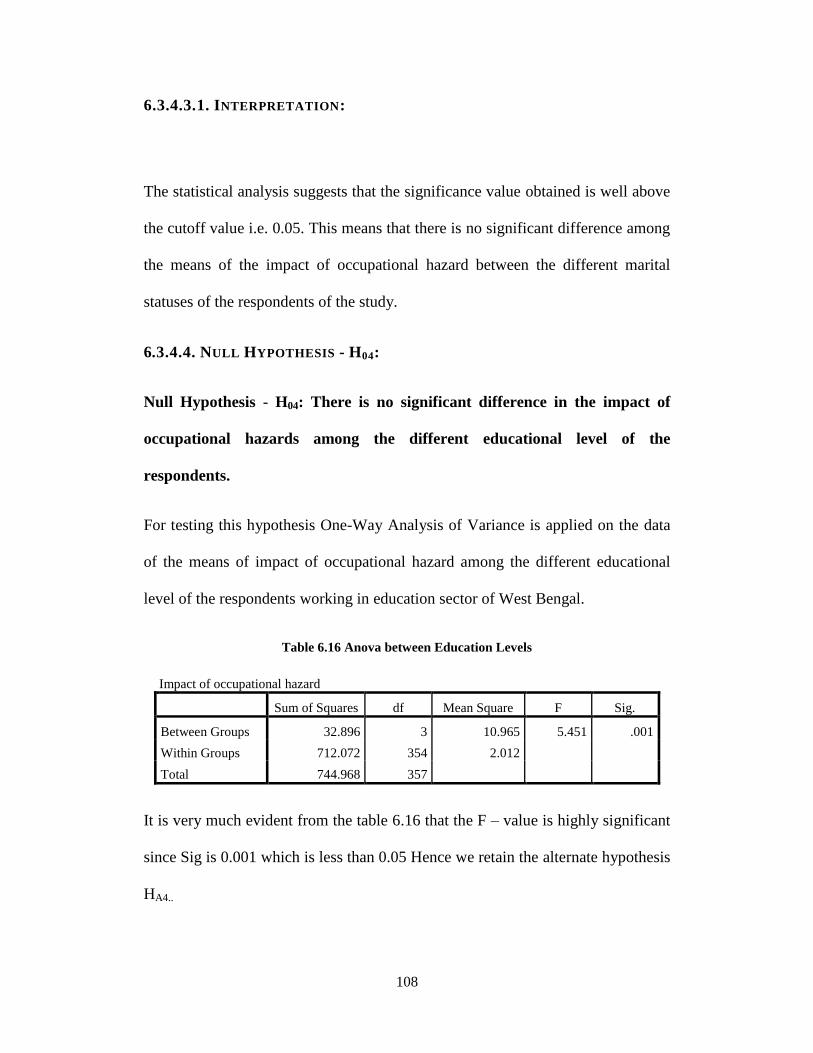
108
6.3.4.3.1. INTERPRETATION:
The statistical analysis suggests that the significance value obtained is well above
the cutoff value i.e. 0.05. This means that there is no significant difference among
the means of the impact of occupational hazard between the different marital
statuses of the respondents of the study.
6.3.4.4. NULL HYPOTHESIS - H04:
Null Hypothesis - H04: There is no significant difference in the impact of
occupational hazards among the different educational level of the
respondents.
For testing this hypothesis One-Way Analysis of Variance is applied on the data
of the means of impact of occupational hazard among the different educational
level of the respondents working in education sector of West Bengal.
Table 6.16 Anova between Education Levels
Impact of occupational hazard
Sum of Squares df Mean Square F Sig.
Between Groups 32.896 3 10.965 5.451 .001
Within Groups 712.072 354 2.012
Total 744.968 357
It is very much evident from the table 6.16 that the F – value is highly significant
since Sig is 0.001 which is less than 0.05 Hence we retain the alternate hypothesis
HA4..
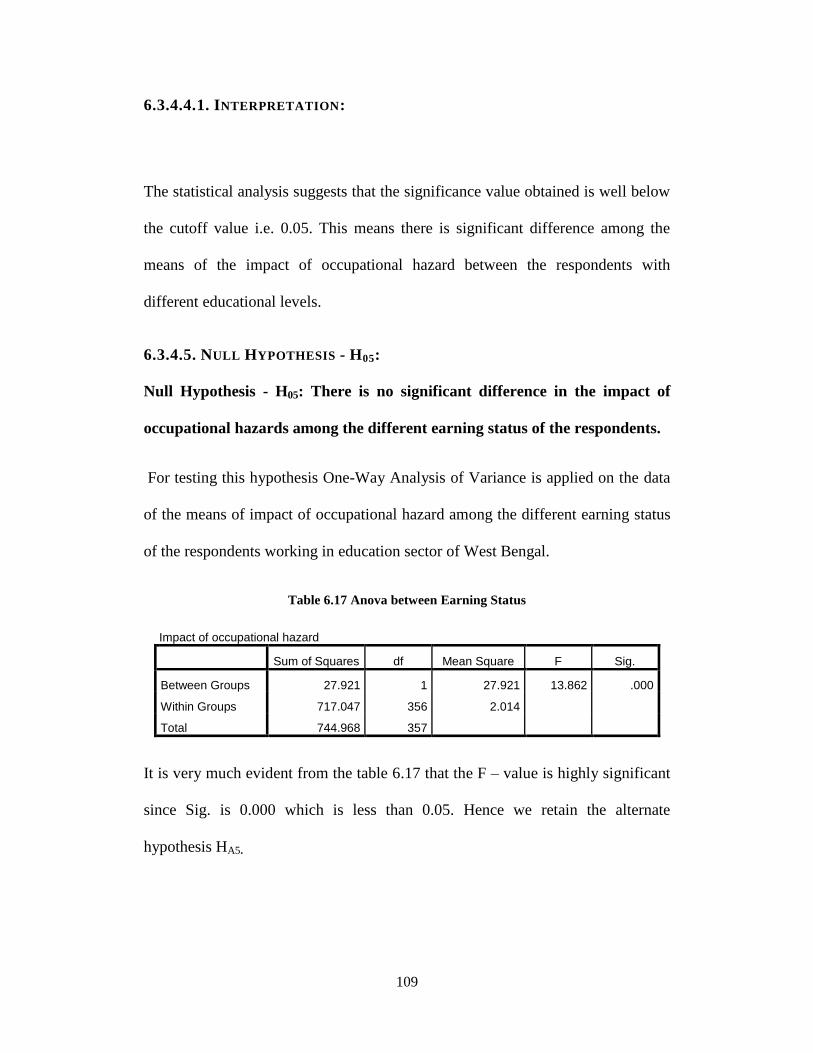
109
6.3.4.4.1. INTERPRETATION:
The statistical analysis suggests that the significance value obtained is well below
the cutoff value i.e. 0.05. This means there is significant difference among the
means of the impact of occupational hazard between the respondents with
different educational levels.
6.3.4.5. NULL HYPOTHESIS - H05:
Null Hypothesis - H05: There is no significant difference in the impact of
occupational hazards among the different earning status of the respondents.
For testing this hypothesis One-Way Analysis of Variance is applied on the data
of the means of impact of occupational hazard among the different earning status
of the respondents working in education sector of West Bengal.
Table 6.17 Anova between Earning Status
Impact of occupational hazard
Sum of Squares df Mean Square F Sig.
Between Groups 27.921 1 27.921 13.862 .000
Within Groups 717.047 356 2.014
Total 744.968 357
It is very much evident from the table 6.17 that the F – value is highly significant
since Sig. is 0.000 which is less than 0.05. Hence we retain the alternate
hypothesis HA5.
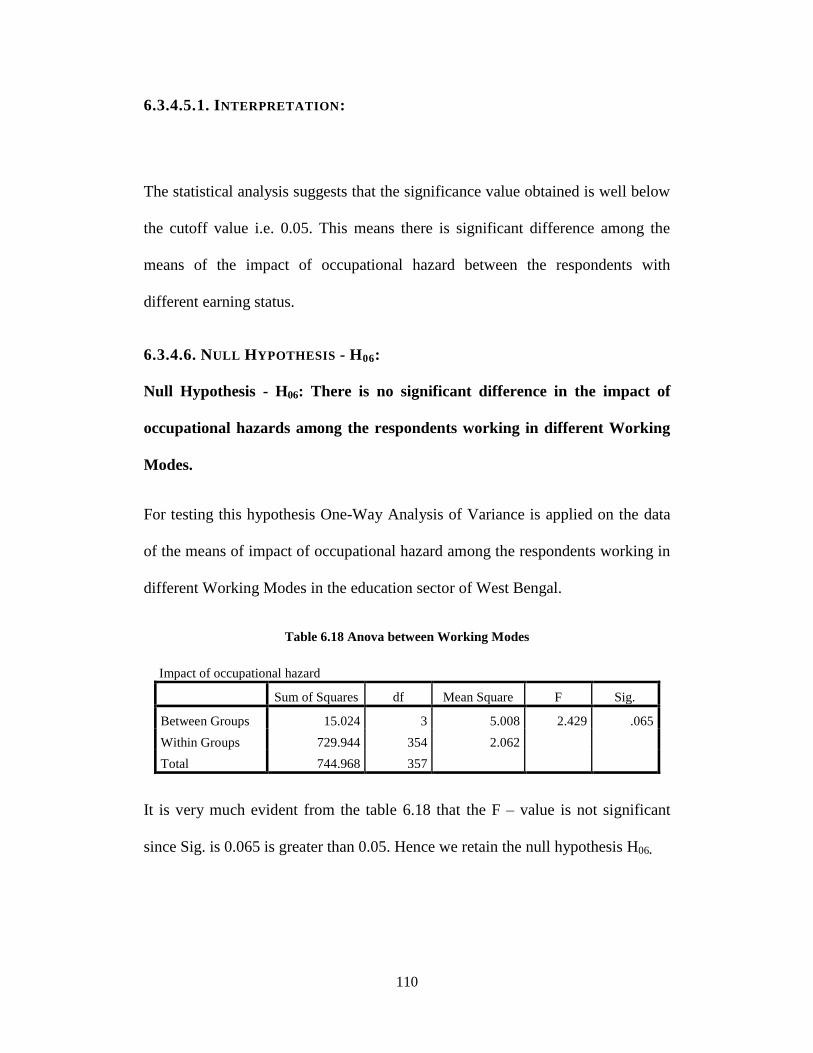
110
6.3.4.5.1. INTERPRETATION:
The statistical analysis suggests that the significance value obtained is well below
the cutoff value i.e. 0.05. This means there is significant difference among the
means of the impact of occupational hazard between the respondents with
different earning status.
6.3.4.6. NULL HYPOTHESIS - H06:
Null Hypothesis - H06: There is no significant difference in the impact of
occupational hazards among the respondents working in different Working
Modes.
For testing this hypothesis One-Way Analysis of Variance is applied on the data
of the means of impact of occupational hazard among the respondents working in
different Working Modes in the education sector of West Bengal.
Table 6.18 Anova between Working Modes
Impact of occupational hazard
Sum of Squares df Mean Square F Sig.
Between Groups 15.024 3 5.008 2.429 .065
Within Groups 729.944 354 2.062
Total 744.968 357
It is very much evident from the table 6.18 that the F – value is not significant
since Sig. is 0.065 is greater than 0.05. Hence we retain the null hypothesis H06.
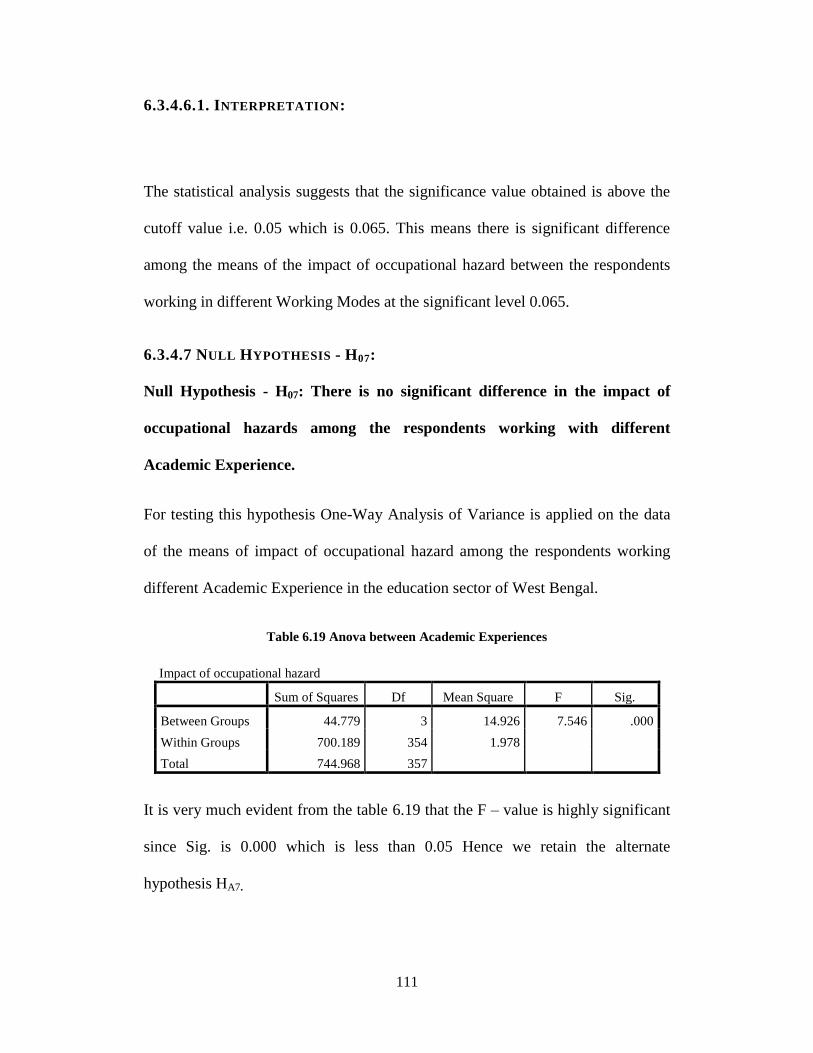
111
6.3.4.6.1. INTERPRETATION:
The statistical analysis suggests that the significance value obtained is above the
cutoff value i.e. 0.05 which is 0.065. This means there is significant difference
among the means of the impact of occupational hazard between the respondents
working in different Working Modes at the significant level 0.065.
6.3.4.7 NULL HYPOTHESIS - H07:
Null Hypothesis - H07: There is no significant difference in the impact of
occupational hazards among the respondents working with different
Academic Experience.
For testing this hypothesis One-Way Analysis of Variance is applied on the data
of the means of impact of occupational hazard among the respondents working
different Academic Experience in the education sector of West Bengal.
Table 6.19 Anova between Academic Experiences
Impact of occupational hazard
Sum of Squares Df Mean Square F Sig.
Between Groups 44.779 3 14.926 7.546 .000
Within Groups 700.189 354 1.978
Total 744.968 357
It is very much evident from the table 6.19 that the F – value is highly significant
since Sig. is 0.000 which is less than 0.05 Hence we retain the alternate
hypothesis HA7.
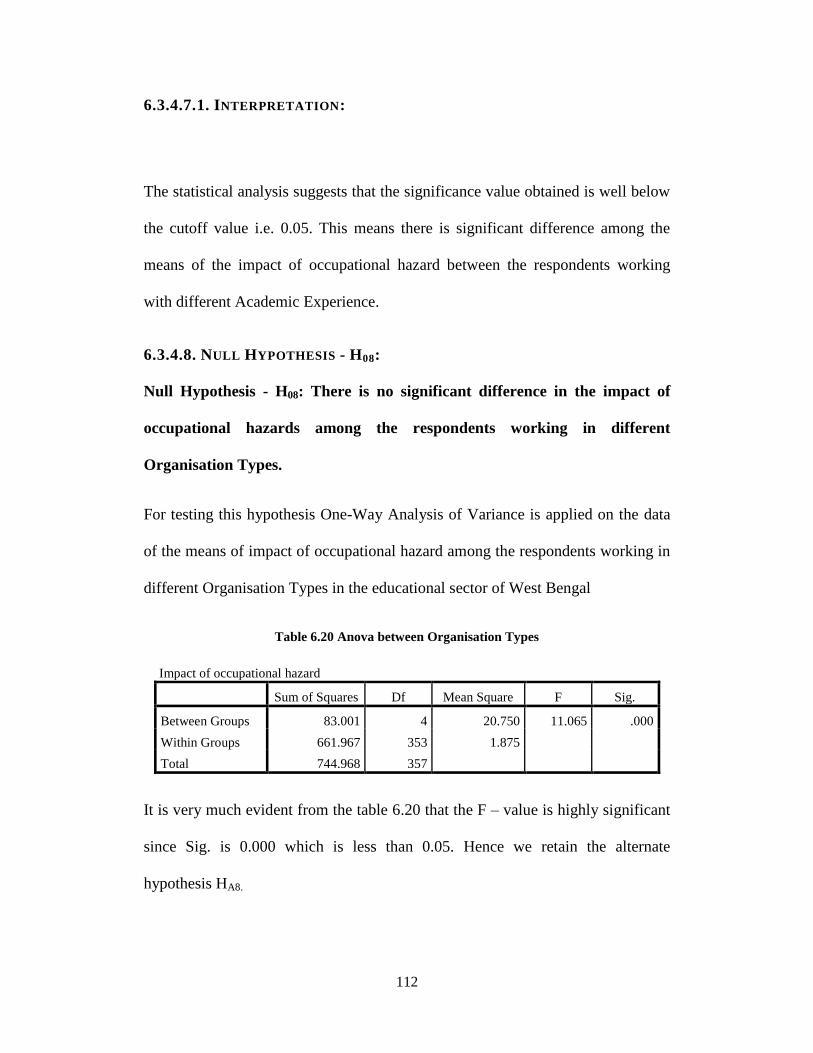
112
6.3.4.7.1. INTERPRETATION:
The statistical analysis suggests that the significance value obtained is well below
the cutoff value i.e. 0.05. This means there is significant difference among the
means of the impact of occupational hazard between the respondents working
with different Academic Experience.
6.3.4.8. NULL HYPOTHESIS - H08:
Null Hypothesis - H08: There is no significant difference in the impact of
occupational hazards among the respondents working in different
Organisation Types.
For testing this hypothesis One-Way Analysis of Variance is applied on the data
of the means of impact of occupational hazard among the respondents working in
different Organisation Types in the educational sector of West Bengal
Table 6.20 Anova between Organisation Types
Impact of occupational hazard
Sum of Squares Df Mean Square F Sig.
Between Groups 83.001 4 20.750 11.065 .000
Within Groups 661.967 353 1.875
Total 744.968 357
It is very much evident from the table 6.20 that the F – value is highly significant
since Sig. is 0.000 which is less than 0.05. Hence we retain the alternate
hypothesis HA8.
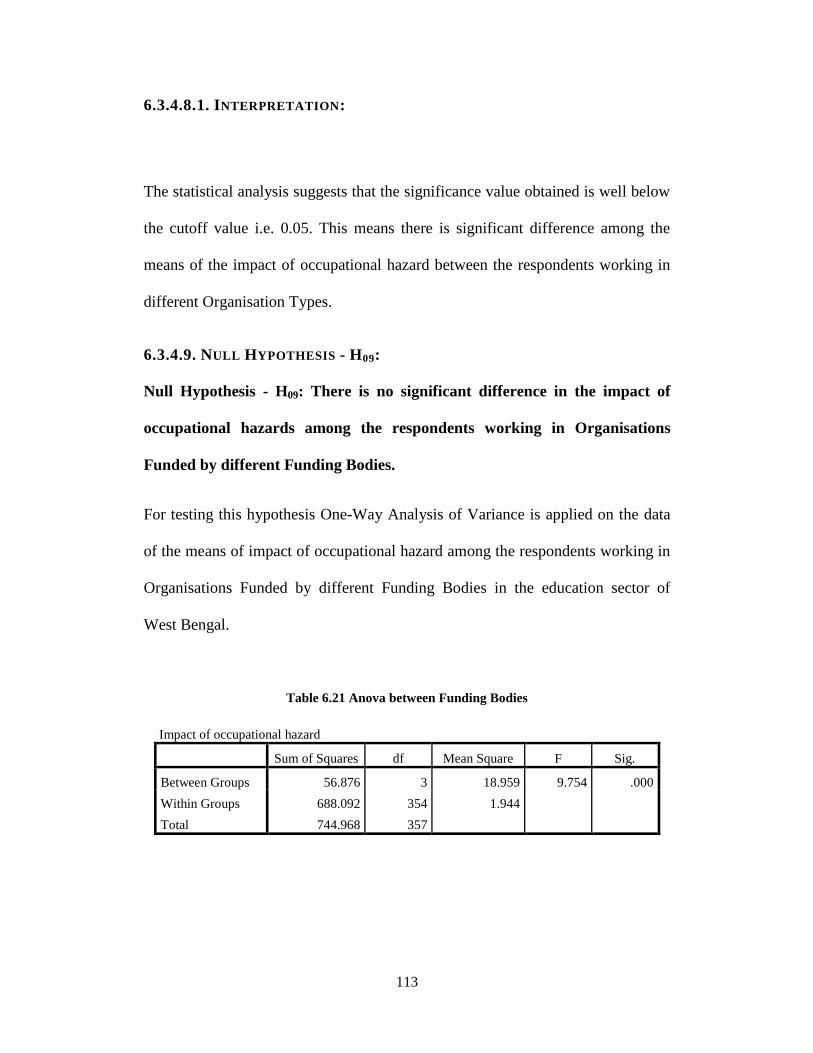
113
6.3.4.8.1. INTERPRETATION:
The statistical analysis suggests that the significance value obtained is well below
the cutoff value i.e. 0.05. This means there is significant difference among the
means of the impact of occupational hazard between the respondents working in
different Organisation Types.
6.3.4.9. NULL HYPOTHESIS - H09:
Null Hypothesis - H09: There is no significant difference in the impact of
occupational hazards among the respondents working in Organisations
Funded by different Funding Bodies.
For testing this hypothesis One-Way Analysis of Variance is applied on the data
of the means of impact of occupational hazard among the respondents working in
Organisations Funded by different Funding Bodies in the education sector of
West Bengal.
Table 6.21 Anova between Funding Bodies
Impact of occupational hazard
Sum of Squares df Mean Square F Sig.
Between Groups 56.876 3 18.959 9.754 .000
Within Groups 688.092 354 1.944
Total 744.968 357
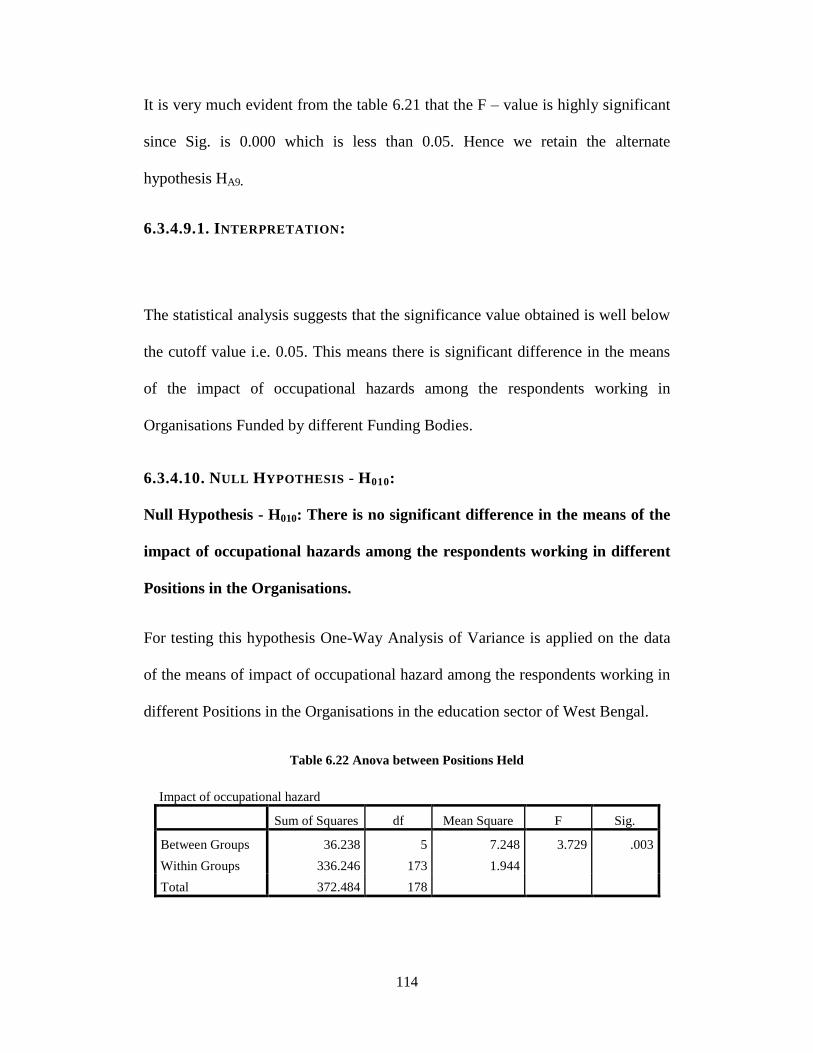
114
It is very much evident from the table 6.21 that the F – value is highly significant
since Sig. is 0.000 which is less than 0.05. Hence we retain the alternate
hypothesis HA9.
6.3.4.9.1. INTERPRETATION:
The statistical analysis suggests that the significance value obtained is well below
the cutoff value i.e. 0.05. This means there is significant difference in the means
of the impact of occupational hazards among the respondents working in
Organisations Funded by different Funding Bodies.
6.3.4.10. NULL HYPOTHESIS - H010:
Null Hypothesis - H010: There is no significant difference in the means of the
impact of occupational hazards among the respondents working in different
Positions in the Organisations.
For testing this hypothesis One-Way Analysis of Variance is applied on the data
of the means of impact of occupational hazard among the respondents working in
different Positions in the Organisations in the education sector of West Bengal.
Table 6.22 Anova between Positions Held
Impact of occupational hazard
Sum of Squares df Mean Square F Sig.
Between Groups 36.238 5 7.248 3.729 .003
Within Groups 336.246 173 1.944
Total 372.484 178
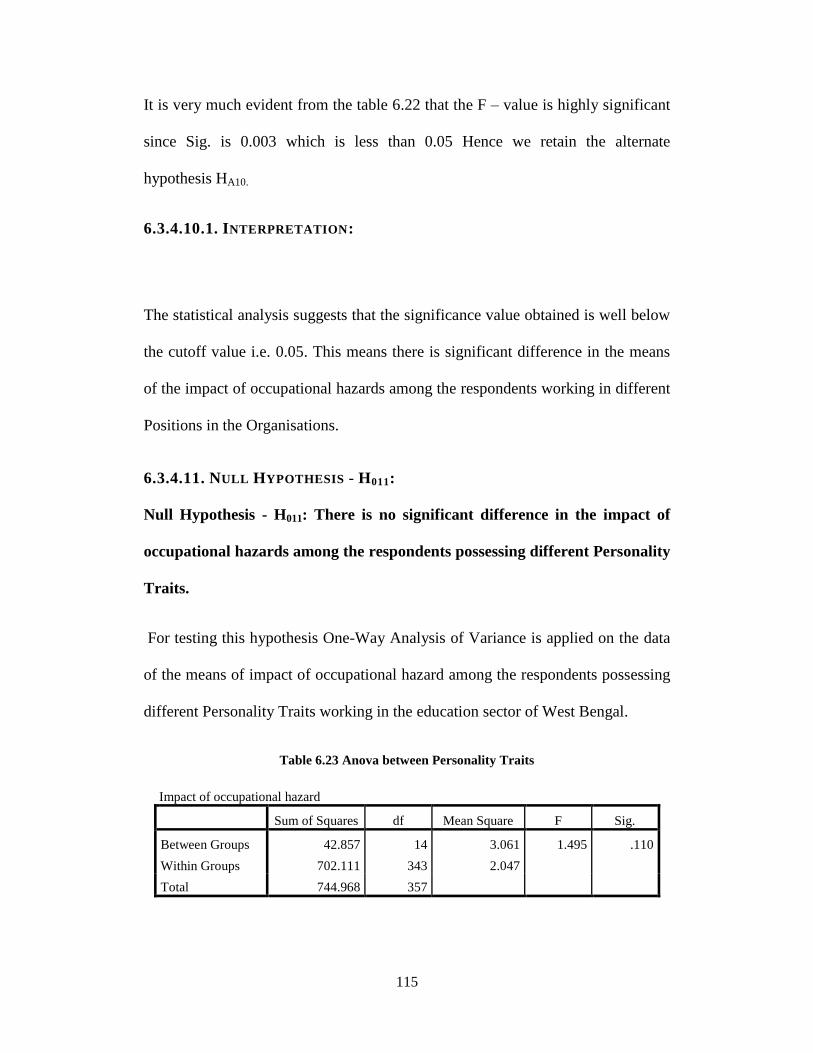
115
It is very much evident from the table 6.22 that the F – value is highly significant
since Sig. is 0.003 which is less than 0.05 Hence we retain the alternate
hypothesis HA10.
6.3.4.10.1. INTERPRETATION:
The statistical analysis suggests that the significance value obtained is well below
the cutoff value i.e. 0.05. This means there is significant difference in the means
of the impact of occupational hazards among the respondents working in different
Positions in the Organisations.
6.3.4.11. NULL HYPOTHESIS - H011:
Null Hypothesis - H011: There is no significant difference in the impact of
occupational hazards among the respondents possessing different Personality
Traits.
For testing this hypothesis One-Way Analysis of Variance is applied on the data
of the means of impact of occupational hazard among the respondents possessing
different Personality Traits working in the education sector of West Bengal.
Table 6.23 Anova between Personality Traits
Impact of occupational hazard
Sum of Squares df Mean Square F Sig.
Between Groups 42.857 14 3.061 1.495 .110
Within Groups 702.111 343 2.047
Total 744.968 357
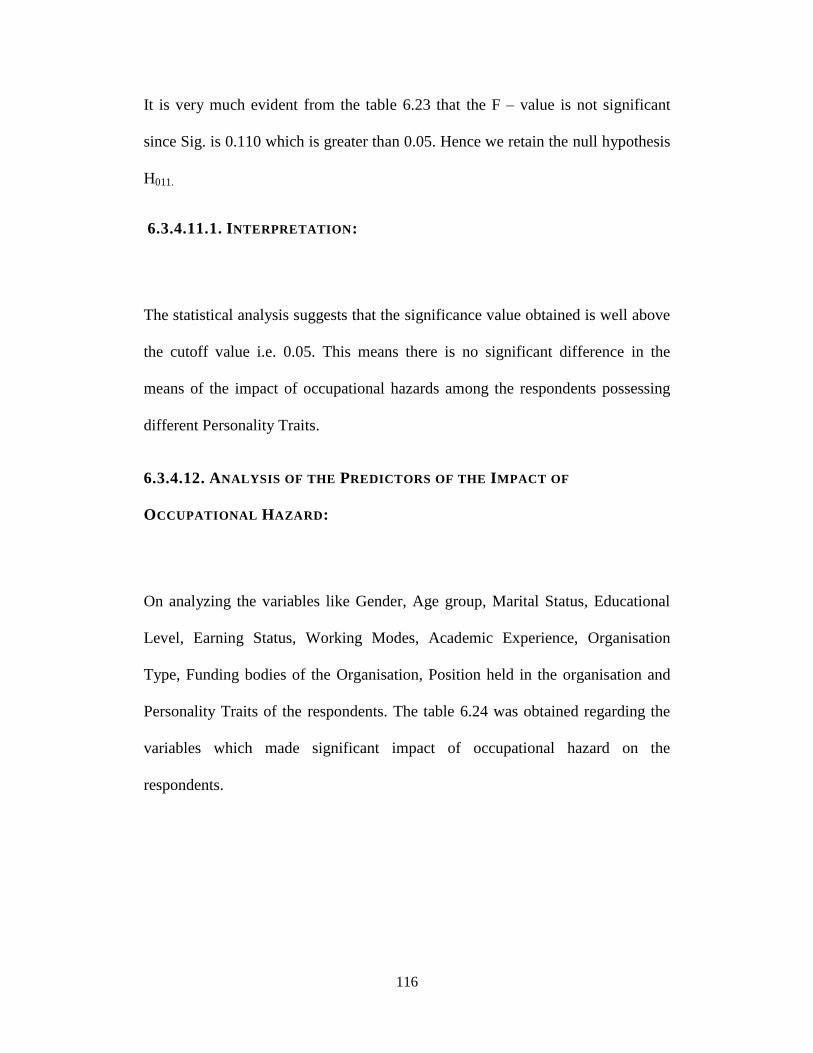
116
It is very much evident from the table 6.23 that the F – value is not significant
since Sig. is 0.110 which is greater than 0.05. Hence we retain the null hypothesis
H011.
6.3.4.11.1. INTERPRETATION:
The statistical analysis suggests that the significance value obtained is well above
the cutoff value i.e. 0.05. This means there is no significant difference in the
means of the impact of occupational hazards among the respondents possessing
different Personality Traits.
6.3.4.12. ANALYSIS OF THE PREDICTORS OF THE IMPACT OF
OCCUPATIONAL HAZARD:
On analyzing the variables like Gender, Age group, Marital Status, Educational
Level, Earning Status, Working Modes, Academic Experience, Organisation
Type, Funding bodies of the Organisation, Position held in the organisation and
Personality Traits of the respondents. The table 6.24 was obtained regarding the
variables which made significant impact of occupational hazard on the
respondents.
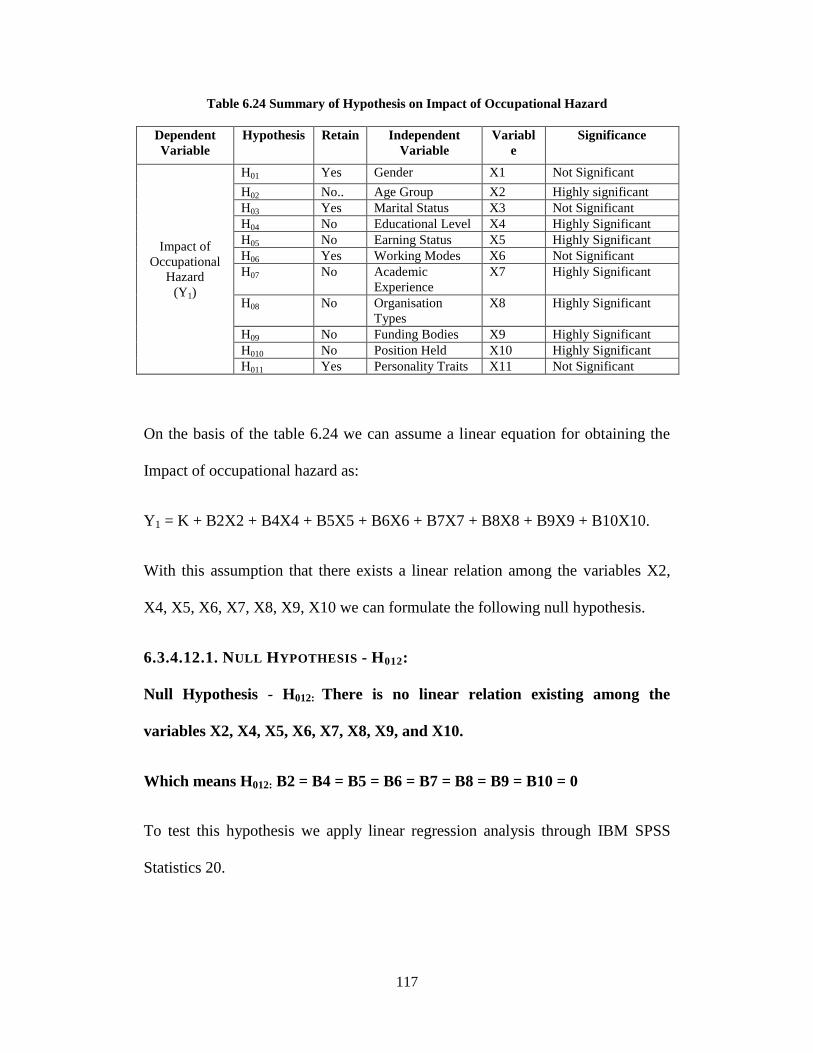
117
Table 6.24 Summary of Hypothesis on Impact of Occupational Hazard
Dependent
Variable
Hypothesis Retain Independent
Variable
Variabl
e
Significance
Impact of
Occupational
Hazard
(Y1)
H01 Yes Gender X1 Not Significant
H02 No.. Age Group X2 Highly significant
H03 Yes Marital Status X3 Not Significant
H04 No Educational Level X4 Highly Significant
H05 No Earning Status X5 Highly Significant
H06 Yes Working Modes X6 Not Significant
H07 No Academic
Experience
X7 Highly Significant
H08 No Organisation
Types
X8 Highly Significant
H09 No Funding Bodies X9 Highly Significant
H010 No Position Held X10 Highly Significant
H011 Yes Personality Traits X11 Not Significant
On the basis of the table 6.24 we can assume a linear equation for obtaining the
Impact of occupational hazard as:
Y1 = K + B2X2 + B4X4 + B5X5 + B6X6 + B7X7 + B8X8 + B9X9 + B10X10.
With this assumption that there exists a linear relation among the variables X2,
X4, X5, X6, X7, X8, X9, X10 we can formulate the following null hypothesis.
6.3.4.12.1. NULL HYPOTHESIS - H012:
Null Hypothesis - H012: There is no linear relation existing among the
variables X2, X4, X5, X6, X7, X8, X9, and X10.
Which means H012: B2 = B4 = B5 = B6 = B7 = B8 = B9 = B10 = 0
To test this hypothesis we apply linear regression analysis through IBM SPSS
Statistics 20.
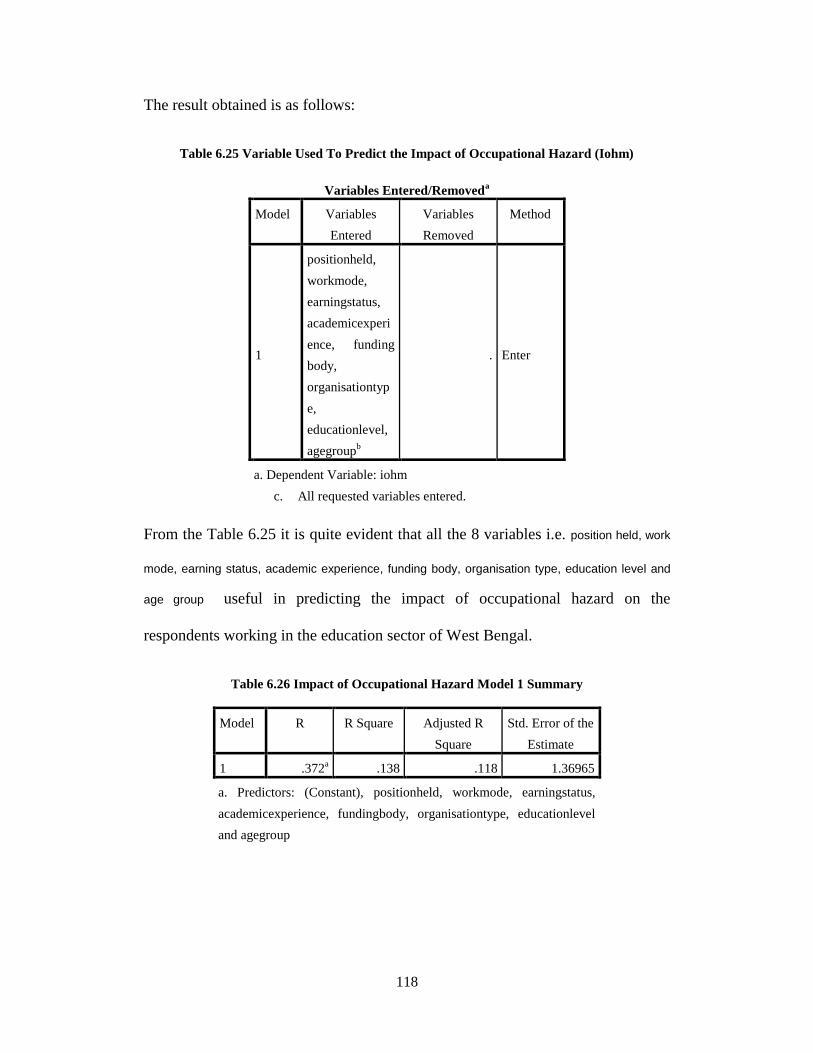
118
The result obtained is as follows:
Table 6.25 Variable Used To Predict the Impact of Occupational Hazard (Iohm)
Variables Entered/Removeda
Model Variables
Entered
Variables
Removed
Method
1
positionheld,
workmode,
earningstatus,
academicexperi
ence, funding
body,
organisationtyp
e,
educationlevel,
agegroupb
. Enter
a. Dependent Variable: iohm
c. All requested variables entered.
From the Table 6.25 it is quite evident that all the 8 variables i.e. position held, work
mode, earning status, academic experience, funding body, organisation type, education level and
age group useful in predicting the impact of occupational hazard on the
respondents working in the education sector of West Bengal.
Table 6.26 Impact of Occupational Hazard Model 1 Summary
Model R R Square Adjusted R
Square
Std. Error of the
Estimate
1 .372a .138 .118 1.36965
a. Predictors: (Constant), positionheld, workmode, earningstatus,
academicexperience, fundingbody, organisationtype, educationlevel
and agegroup
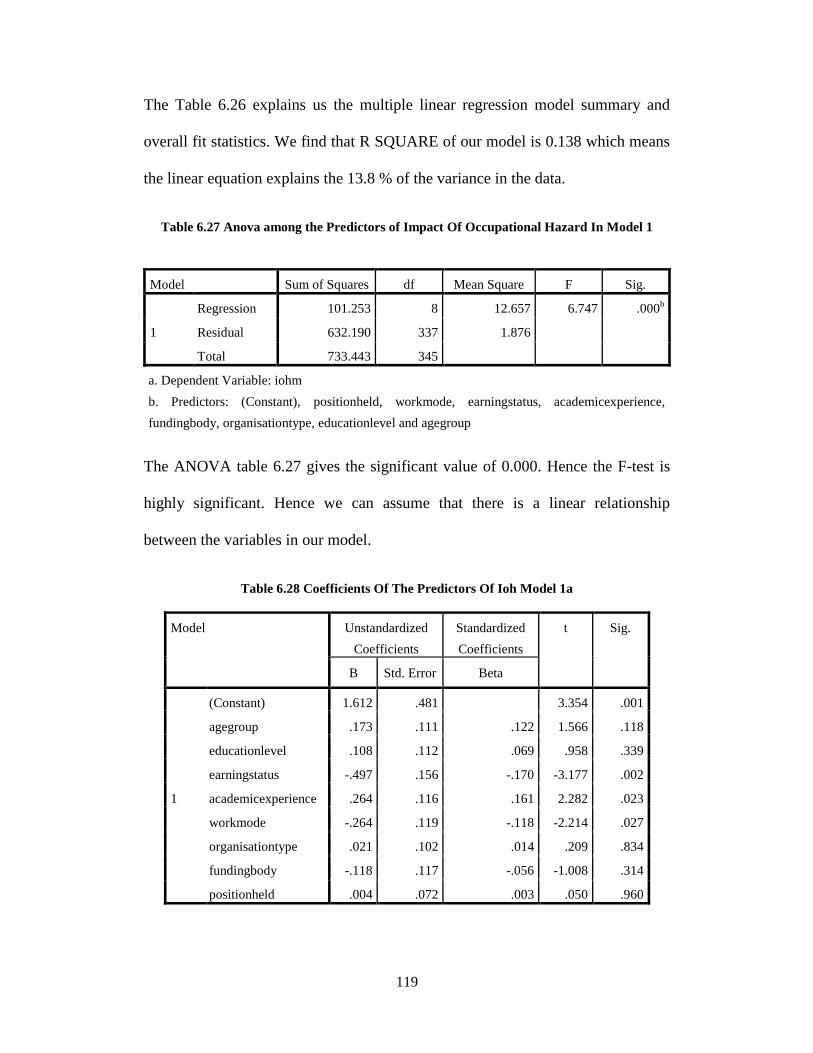
119
The Table 6.26 explains us the multiple linear regression model summary and
overall fit statistics. We find that R SQUARE of our model is 0.138 which means
the linear equation explains the 13.8 % of the variance in the data.
Table 6.27 Anova among the Predictors of Impact Of Occupational Hazard In Model 1
Model Sum of Squares df Mean Square F Sig.
1
Regression 101.253 8 12.657 6.747 .000b
Residual 632.190 337 1.876
Total 733.443 345
a. Dependent Variable: iohm
b. Predictors: (Constant), positionheld, workmode, earningstatus, academicexperience,
fundingbody, organisationtype, educationlevel and agegroup
The ANOVA table 6.27 gives the significant value of 0.000. Hence the F-test is
highly significant. Hence we can assume that there is a linear relationship
between the variables in our model.
Table 6.28 Coefficients Of The Predictors Of Ioh Model 1a
Model Unstandardized
Coefficients
Standardized
Coefficients
t Sig.
B Std. Error Beta
1
(Constant) 1.612 .481
3.354 .001
agegroup .173 .111 .122 1.566 .118
educationlevel .108 .112 .069 .958 .339
earningstatus -.497 .156 -.170 -3.177 .002
academicexperience .264 .116 .161 2.282 .023
workmode -.264 .119 -.118 -2.214 .027
organisationtype .021 .102 .014 .209 .834
fundingbody -.118 .117 -.056 -1.008 .314
positionheld .004 .072 .003 .050 .960
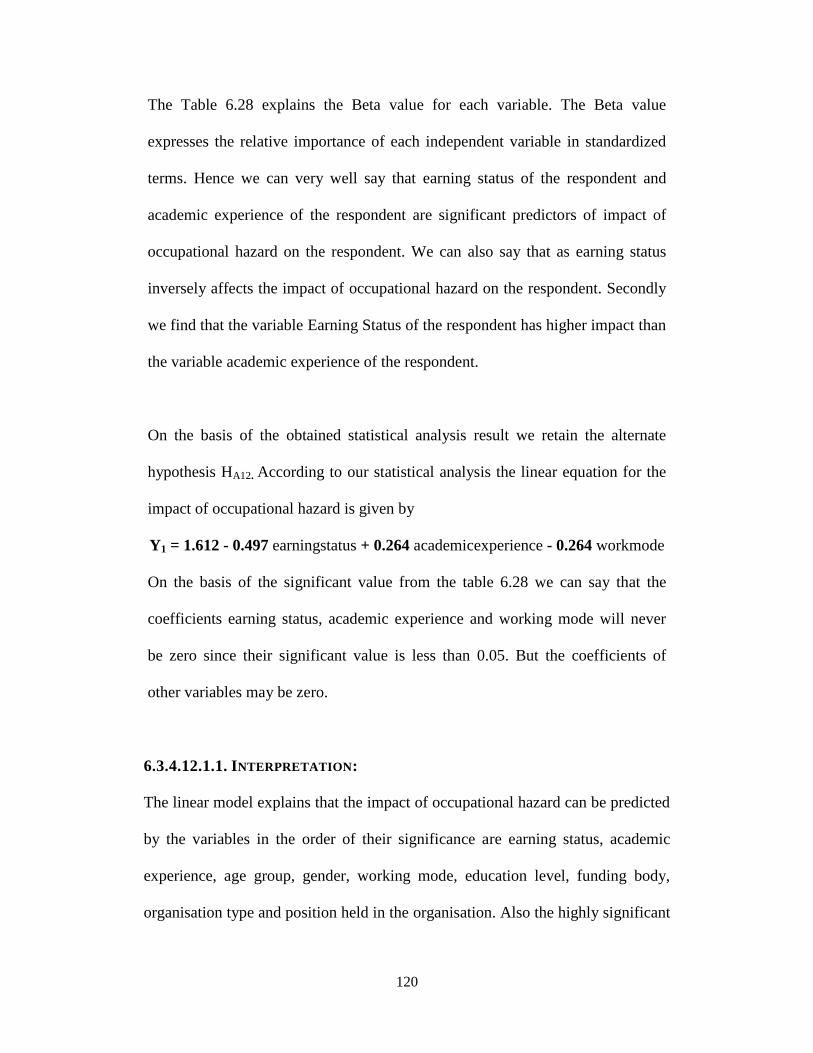
120
The Table 6.28 explains the Beta value for each variable. The Beta value
expresses the relative importance of each independent variable in standardized
terms. Hence we can very well say that earning status of the respondent and
academic experience of the respondent are significant predictors of impact of
occupational hazard on the respondent. We can also say that as earning status
inversely affects the impact of occupational hazard on the respondent. Secondly
we find that the variable Earning Status of the respondent has higher impact than
the variable academic experience of the respondent.
On the basis of the obtained statistical analysis result we retain the alternate
hypothesis HA12. According to our statistical analysis the linear equation for the
impact of occupational hazard is given by
Y1 = 1.612 - 0.497 earningstatus + 0.264 academicexperience - 0.264 workmode
On the basis of the significant value from the table 6.28 we can say that the
coefficients earning status, academic experience and working mode will never
be zero since their significant value is less than 0.05. But the coefficients of
other variables may be zero.
6.3.4.12.1.1. INTERPRETATION:
The linear model explains that the impact of occupational hazard can be predicted
by the variables in the order of their significance are earning status, academic
experience, age group, gender, working mode, education level, funding body,
organisation type and position held in the organisation. Also the highly significant
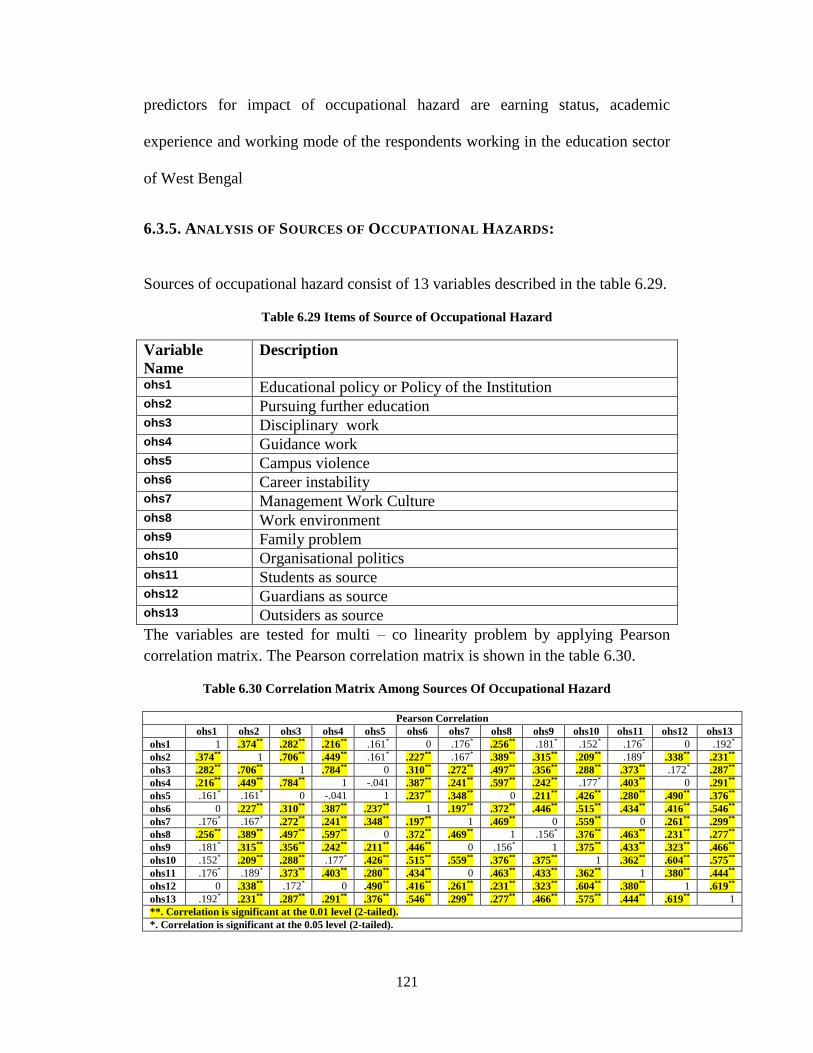
121
predictors for impact of occupational hazard are earning status, academic
experience and working mode of the respondents working in the education sector
of West Bengal
6.3.5. ANALYSIS OF SOURCES OF OCCUPATIONAL HAZARDS:
Sources of occupational hazard consist of 13 variables described in the table 6.29.
Table 6.29 Items of Source of Occupational Hazard
Variable
Name
Description
ohs1 Educational policy or Policy of the Institution ohs2 Pursuing further education ohs3 Disciplinary work ohs4 Guidance work ohs5 Campus violence ohs6 Career instability ohs7 Management Work Culture ohs8 Work environment ohs9 Family problem ohs10 Organisational politics ohs11 Students as source ohs12 Guardians as source ohs13 Outsiders as source
The variables are tested for multi – co linearity problem by applying Pearson
correlation matrix. The Pearson correlation matrix is shown in the table 6.30.
Table 6.30 Correlation Matrix Among Sources Of Occupational Hazard
Pearson Correlation
ohs1 ohs2 ohs3 ohs4 ohs5 ohs6 ohs7 ohs8 ohs9 ohs10 ohs11 ohs12 ohs13
ohs1 1 .374** .282** .216** .161* 0 .176* .256** .181* .152* .176* 0 .192*
ohs2 .374** 1 .706** .449** .161* .227** .167* .389** .315** .209** .189* .338** .231**
ohs3 .282** .706** 1 .784** 0 .310** .272** .497** .356** .288** .373** .172* .287**
ohs4 .216** .449** .784** 1 -.041 .387** .241** .597** .242** .177* .403** 0 .291**
ohs5 .161* .161* 0 -.041 1 .237** .348** 0 .211** .426** .280** .490** .376**
ohs6 0 .227** .310** .387** .237** 1 .197** .372** .446** .515** .434** .416** .546**
ohs7 .176* .167* .272** .241** .348** .197** 1 .469** 0 .559** 0 .261** .299**
ohs8 .256** .389** .497** .597** 0 .372** .469** 1 .156* .376** .463** .231** .277**
ohs9 .181* .315** .356** .242** .211** .446** 0 .156* 1 .375** .433** .323** .466**
ohs10 .152* .209** .288** .177* .426** .515** .559** .376** .375** 1 .362** .604** .575**
ohs11 .176* .189* .373** .403** .280** .434** 0 .463** .433** .362** 1 .380** .444**
ohs12 0 .338** .172* 0 .490** .416** .261** .231** .323** .604** .380** 1 .619**
ohs13 .192* .231** .287** .291** .376** .546** .299** .277** .466** .575** .444** .619** 1
**. Correlation is significant at the 0.01 level (2-tailed).
*. Correlation is significant at the 0.05 level (2-tailed).
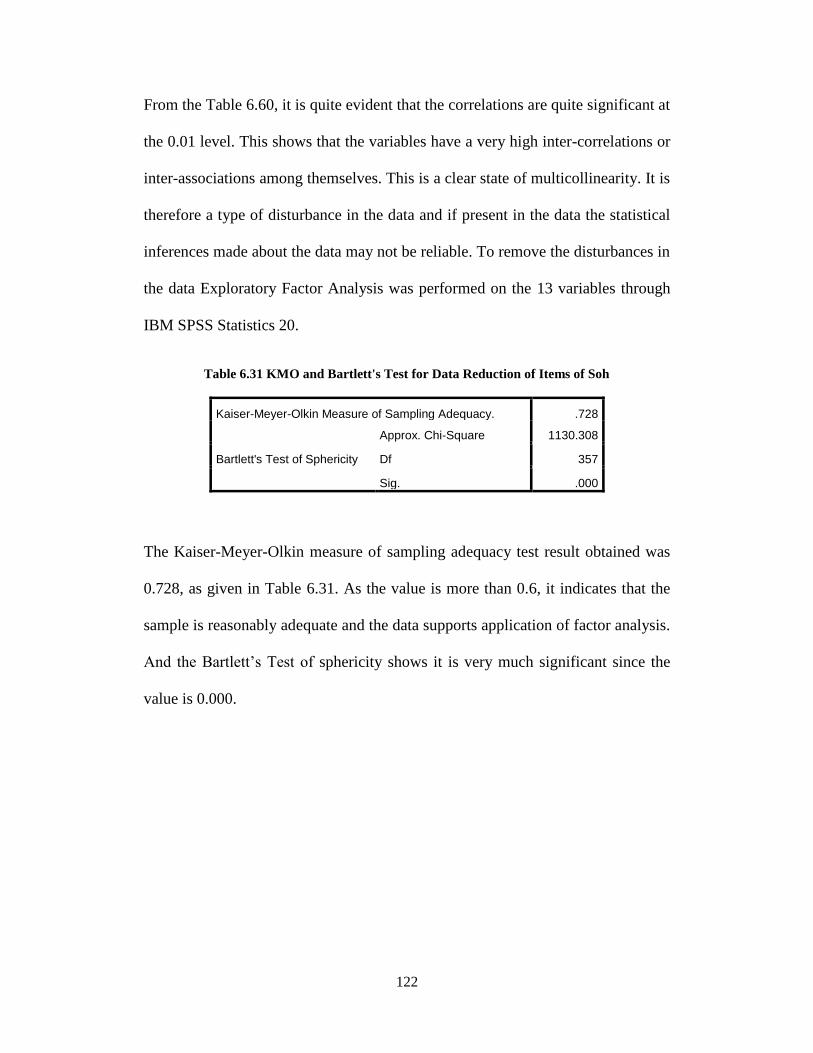
122
From the Table 6.60, it is quite evident that the correlations are quite significant at
the 0.01 level. This shows that the variables have a very high inter-correlations or
inter-associations among themselves. This is a clear state of multicollinearity. It is
therefore a type of disturbance in the data and if present in the data the statistical
inferences made about the data may not be reliable. To remove the disturbances in
the data Exploratory Factor Analysis was performed on the 13 variables through
IBM SPSS Statistics 20.
Table 6.31 KMO and Bartlett's Test for Data Reduction of Items of Soh
Kaiser-Meyer-Olkin Measure of Sampling Adequacy. .728
Bartlett's Test of Sphericity
Approx. Chi-Square 1130.308
Df 357
Sig. .000
The Kaiser-Meyer-Olkin measure of sampling adequacy test result obtained was
0.728, as given in Table 6.31. As the value is more than 0.6, it indicates that the
sample is reasonably adequate and the data supports application of factor analysis.
And the Bartlett’s Test of sphericity shows it is very much significant since the
value is 0.000.
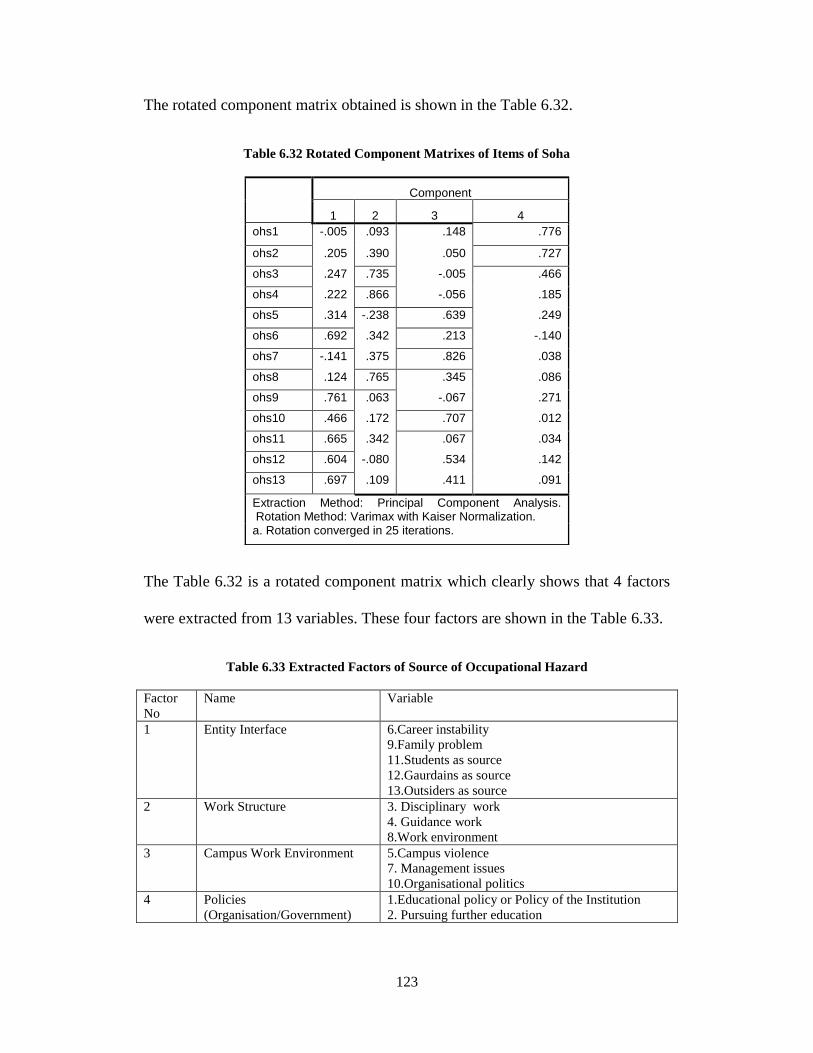
123
The rotated component matrix obtained is shown in the Table 6.32.
Table 6.32 Rotated Component Matrixes of Items of Soha
The Table 6.32 is a rotated component matrix which clearly shows that 4 factors
were extracted from 13 variables. These four factors are shown in the Table 6.33.
Table 6.33 Extracted Factors of Source of Occupational Hazard
Factor
No
Name Variable
1 Entity Interface 6.Career instability
9.Family problem
11.Students as source
12.Gaurdains as source
13.Outsiders as source
2 Work Structure 3. Disciplinary work
4. Guidance work
8.Work environment
3 Campus Work Environment 5.Campus violence
7. Management issues
10.Organisational politics
4 Policies
(Organisation/Government)
1.Educational policy or Policy of the Institution
2. Pursuing further education
Component
1 2 3 4
ohs1 -.005 .093 .148 .776
ohs2 .205 .390 .050 .727
ohs3 .247 .735 -.005 .466
ohs4 .222 .866 -.056 .185
ohs5 .314 -.238 .639 .249
ohs6 .692 .342 .213 -.140
ohs7 -.141 .375 .826 .038
ohs8 .124 .765 .345 .086
ohs9 .761 .063 -.067 .271
ohs10 .466 .172 .707 .012
ohs11 .665 .342 .067 .034
ohs12 .604 -.080 .534 .142
ohs13 .697 .109 .411 .091
Extraction Method: Principal Component Analysis. Rotation Method: Varimax with Kaiser Normalization. a. Rotation converged in 25 iterations.
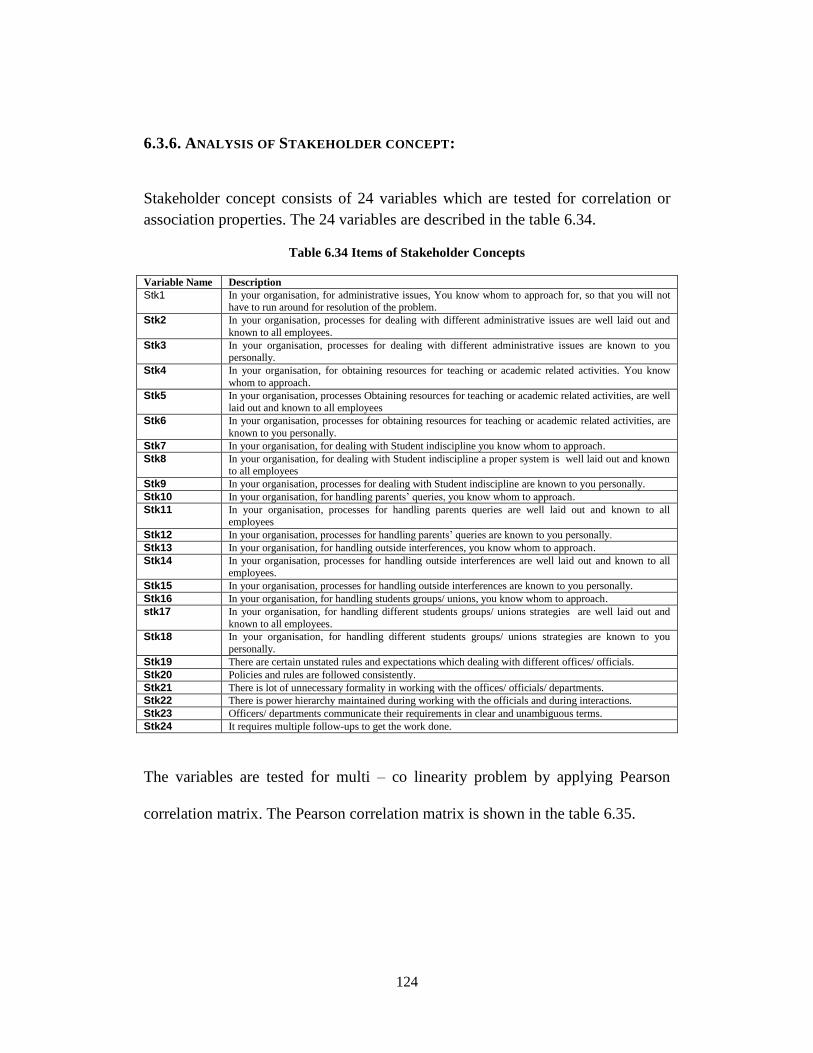
124
6.3.6. ANALYSIS OF STAKEHOLDER CONCEPT:
Stakeholder concept consists of 24 variables which are tested for correlation or
association properties. The 24 variables are described in the table 6.34.
Table 6.34 Items of Stakeholder Concepts
Variable Name Description
Stk1 In your organisation, for administrative issues, You know whom to approach for, so that you will not have to run around for resolution of the problem.
Stk2 In your organisation, processes for dealing with different administrative issues are well laid out and
known to all employees.
Stk3 In your organisation, processes for dealing with different administrative issues are known to you personally.
Stk4 In your organisation, for obtaining resources for teaching or academic related activities. You know
whom to approach.
Stk5 In your organisation, processes Obtaining resources for teaching or academic related activities, are well laid out and known to all employees
Stk6 In your organisation, processes for obtaining resources for teaching or academic related activities, are
known to you personally.
Stk7 In your organisation, for dealing with Student indiscipline you know whom to approach.
Stk8 In your organisation, for dealing with Student indiscipline a proper system is well laid out and known to all employees
Stk9 In your organisation, processes for dealing with Student indiscipline are known to you personally.
Stk10 In your organisation, for handling parents’ queries, you know whom to approach.
Stk11 In your organisation, processes for handling parents queries are well laid out and known to all employees
Stk12 In your organisation, processes for handling parents’ queries are known to you personally.
Stk13 In your organisation, for handling outside interferences, you know whom to approach.
Stk14 In your organisation, processes for handling outside interferences are well laid out and known to all employees.
Stk15 In your organisation, processes for handling outside interferences are known to you personally.
Stk16 In your organisation, for handling students groups/ unions, you know whom to approach.
stk17 In your organisation, for handling different students groups/ unions strategies are well laid out and
known to all employees.
Stk18 In your organisation, for handling different students groups/ unions strategies are known to you
personally.
Stk19 There are certain unstated rules and expectations which dealing with different offices/ officials.
Stk20 Policies and rules are followed consistently.
Stk21 There is lot of unnecessary formality in working with the offices/ officials/ departments.
Stk22 There is power hierarchy maintained during working with the officials and during interactions.
Stk23 Officers/ departments communicate their requirements in clear and unambiguous terms.
Stk24 It requires multiple follow-ups to get the work done.
The variables are tested for multi – co linearity problem by applying Pearson
correlation matrix. The Pearson correlation matrix is shown in the table 6.35.
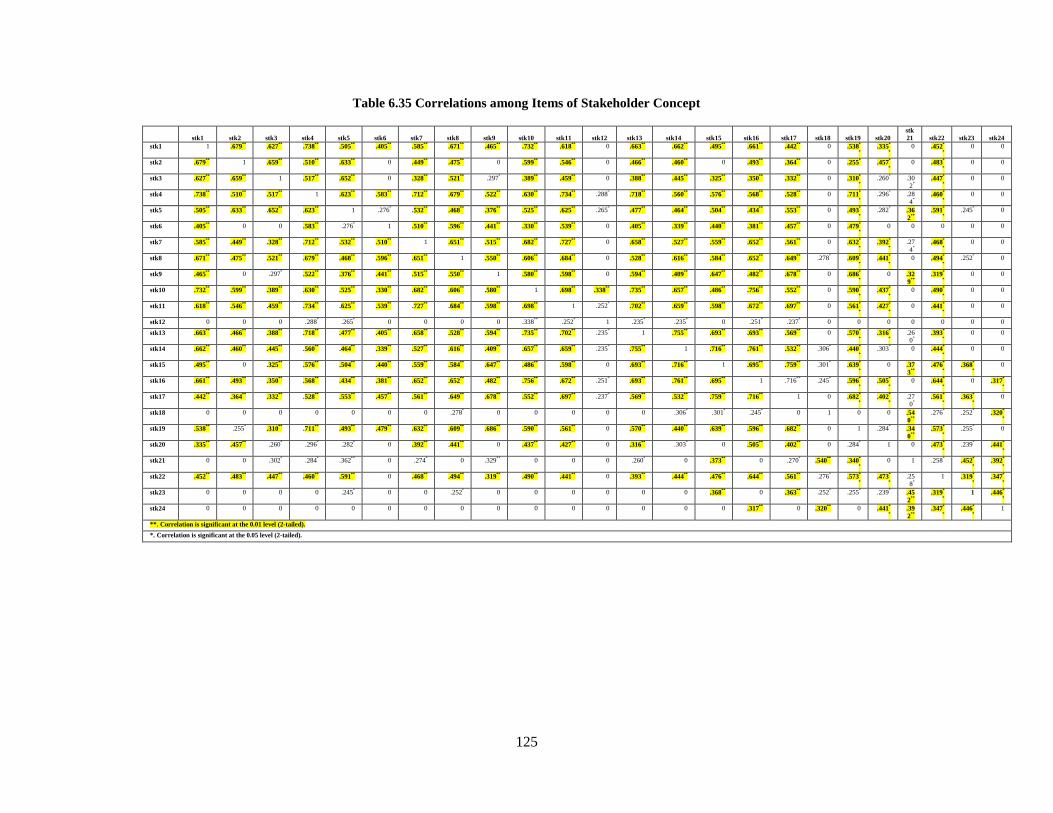
125
Table 6.35 Correlations among Items of Stakeholder Concept
stk1 stk2 stk3 stk4 stk5 stk6 stk7 stk8 stk9 stk10 stk11 stk12 stk13 stk14 stk15 stk16 stk17 stk18 stk19 stk20
stk
21 stk22 stk23 stk24
stk1 1 .679**
.627**
.738**
.505**
.405**
.585**
.671**
.465**
.732**
.618**
0 .663**
.662**
.495**
.661**
.442**
0 .538*
*
.335*
*
0 .452*
*
0 0
stk2 .679**
1 .659**
.510**
.633**
0 .449**
.475**
0 .599**
.546**
0 .466**
.460**
0 .493**
.364**
0 .255* .457
*
*
0 .483*
*
0 0
stk3 .627**
.659**
1 .517**
.652**
0 .328**
.521**
.297* .389
** .459
** 0 .388
** .445
** .325
** .350
** .332
** 0 .310
*
*
.260* .30
2*
.447*
*
0 0
stk4 .738**
.510**
.517**
1 .623**
.583**
.712**
.679**
.522**
.630**
.734**
.288* .718
** .560
** .576
** .568
** .528
** 0 .711
*
*
.296* .28
4*
.460*
*
0 0
stk5 .505**
.633**
.652**
.623**
1 .276* .532
** .468
** .376
** .525
** .625
** .265
* .477
** .464
** .504
** .434
** .553
** 0 .493
*
*
.282* .36
2**
.591*
*
.245* 0
stk6 .405**
0 0 .583**
.276* 1 .510
** .596
** .441
** .330
** .539
** 0 .405
** .339
** .440
** .381
** .457
** 0 .479
*
*
0 0 0 0 0
stk7 .585**
.449**
.328**
.712**
.532**
.510**
1 .651**
.515**
.682**
.727**
0 .658**
.527**
.559**
.652**
.561**
0 .632*
*
.392*
*
.27
4*
.468*
*
0 0
stk8 .671**
.475**
.521**
.679**
.468**
.596**
.651**
1 .550**
.606**
.684**
0 .528**
.616**
.584**
.652**
.649**
.278* .609
*
*
.441*
*
0 .494*
*
.252* 0
stk9 .465**
0 .297* .522
** .376
** .441
** .515
** .550
** 1 .580
** .598
** 0 .594
** .409
** .647
** .482
** .678
** 0 .686
*
*
0 .32
9**
.319*
*
0 0
stk10 .732**
.599**
.389**
.630**
.525**
.330**
.682**
.606**
.580**
1 .698**
.338**
.735**
.657**
.486**
.756**
.552**
0 .590*
*
.437*
*
0 .490*
*
0 0
stk11 .618**
.546**
.459**
.734**
.625**
.539**
.727**
.684**
.598**
.698**
1 .252* .702
** .659
** .598
** .672
** .697
** 0 .561
*
*
.427*
*
0 .441*
*
0 0
stk12 0 0 0 .288* .265
* 0 0 0 0 .338
** .252
* 1 .235
* .235
* 0 .251
* .237
* 0 0 0 0 0 0 0
stk13 .663**
.466**
.388**
.718**
.477**
.405**
.658**
.528**
.594**
.735**
.702**
.235* 1 .755
** .693
** .693
** .569
** 0 .570
*
*
.316*
*
.26
0*
.393*
*
0 0
stk14 .662**
.460**
.445**
.560**
.464**
.339**
.527**
.616**
.409**
.657**
.659**
.235* .755
** 1 .716
** .761
** .532
** .306
* .440
*
*
.303* 0 .444
*
*
0 0
stk15 .495**
0 .325**
.576**
.504**
.440**
.559**
.584**
.647**
.486**
.598**
0 .693**
.716**
1 .695**
.759**
.301* .639
*
*
0 .37
3**
.476*
*
.368*
*
0
stk16 .661**
.493**
.350**
.568**
.434**
.381**
.652**
.652**
.482**
.756**
.672**
.251* .693
** .761
** .695
** 1 .716
** .245
* .596
*
*
.505*
*
0 .644*
*
0 .317*
*
stk17 .442**
.364**
.332**
.528**
.553**
.457**
.561**
.649**
.678**
.552**
.697**
.237* .569
** .532
** .759
** .716
** 1 0 .682
*
*
.402*
*
.27
0*
.561*
*
.363*
*
0
stk18 0 0 0 0 0 0 0 .278* 0 0 0 0 0 .306
* .301
* .245
* 0 1 0 0 .54
0**
.276* .252
* .320
*
*
stk19 .538**
.255* .310
** .711
** .493
** .479
** .632
** .609
** .686
** .590
** .561
** 0 .570
** .440
** .639
** .596
** .682
** 0 1 .284
* .34
0**
.573*
*
.255* 0
stk20 .335**
.457**
.260* .296
* .282
* 0 .392
** .441
** 0 .437
** .427
** 0 .316
** .303
* 0 .505
** .402
** 0 .284
* 1 0 .473
*
*
.239* .441
*
*
stk21 0 0 .302* .284
* .362
** 0 .274
* 0 .329
** 0 0 0 .260
* 0 .373
** 0 .270
* .540
** .340
*
*
0 1 .258* .452
*
*
.392*
*
stk22 .452**
.483**
.447**
.460**
.591**
0 .468**
.494**
.319**
.490**
.441**
0 .393**
.444**
.476**
.644**
.561**
.276* .573
*
*
.473*
*
.25
8*
1 .319*
*
.347*
*
stk23 0 0 0 0 .245* 0 0 .252
* 0 0 0 0 0 0 .368
** 0 .363
** .252
* .255
* .239
* .45
2**
.319*
*
1 .446*
*
stk24 0 0 0 0 0 0 0 0 0 0 0 0 0 0 0 .317**
0 .320**
0 .441*
*
.39
2**
.347*
*
.446*
*
1
**. Correlation is significant at the 0.01 level (2-tailed).
*. Correlation is significant at the 0.05 level (2-tailed).
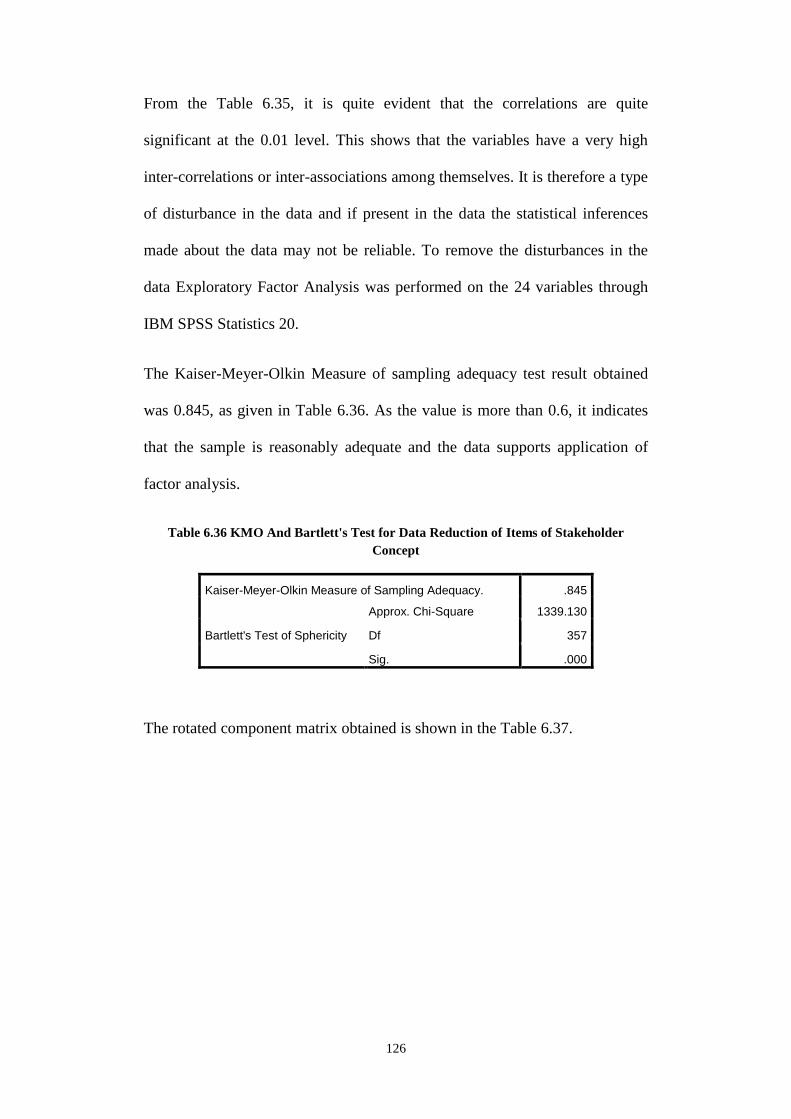
126
From the Table 6.35, it is quite evident that the correlations are quite
significant at the 0.01 level. This shows that the variables have a very high
inter-correlations or inter-associations among themselves. It is therefore a type
of disturbance in the data and if present in the data the statistical inferences
made about the data may not be reliable. To remove the disturbances in the
data Exploratory Factor Analysis was performed on the 24 variables through
IBM SPSS Statistics 20.
The Kaiser-Meyer-Olkin Measure of sampling adequacy test result obtained
was 0.845, as given in Table 6.36. As the value is more than 0.6, it indicates
that the sample is reasonably adequate and the data supports application of
factor analysis.
Table 6.36 KMO And Bartlett's Test for Data Reduction of Items of Stakeholder
Concept
Kaiser-Meyer-Olkin Measure of Sampling Adequacy. .845
Bartlett's Test of Sphericity
Approx. Chi-Square 1339.130
Df 357
Sig. .000
The rotated component matrix obtained is shown in the Table 6.37.
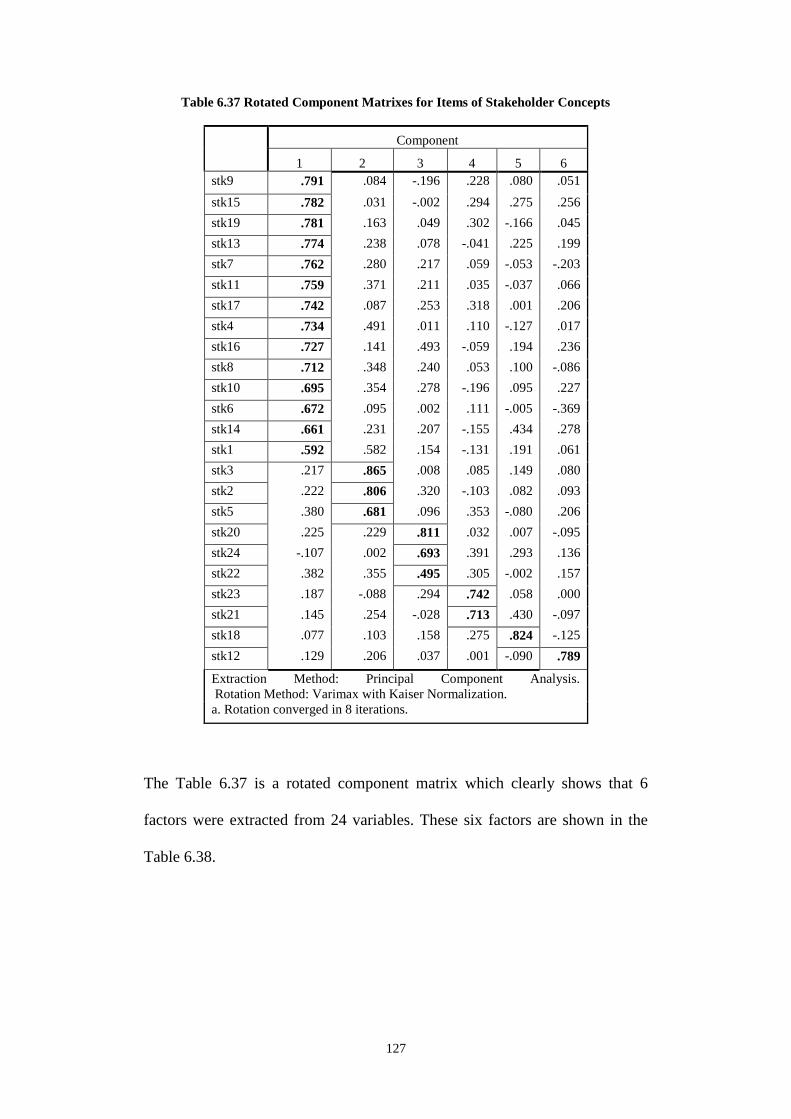
127
Table 6.37 Rotated Component Matrixes for Items of Stakeholder Concepts
Component
1 2 3 4 5 6
stk9 .791 .084 -.196 .228 .080 .051
stk15 .782 .031 -.002 .294 .275 .256
stk19 .781 .163 .049 .302 -.166 .045
stk13 .774 .238 .078 -.041 .225 .199
stk7 .762 .280 .217 .059 -.053 -.203
stk11 .759 .371 .211 .035 -.037 .066
stk17 .742 .087 .253 .318 .001 .206
stk4 .734 .491 .011 .110 -.127 .017
stk16 .727 .141 .493 -.059 .194 .236
stk8 .712 .348 .240 .053 .100 -.086
stk10 .695 .354 .278 -.196 .095 .227
stk6 .672 .095 .002 .111 -.005 -.369
stk14 .661 .231 .207 -.155 .434 .278
stk1 .592 .582 .154 -.131 .191 .061
stk3 .217 .865 .008 .085 .149 .080
stk2 .222 .806 .320 -.103 .082 .093
stk5 .380 .681 .096 .353 -.080 .206
stk20 .225 .229 .811 .032 .007 -.095
stk24 -.107 .002 .693 .391 .293 .136
stk22 .382 .355 .495 .305 -.002 .157
stk23 .187 -.088 .294 .742 .058 .000
stk21 .145 .254 -.028 .713 .430 -.097
stk18 .077 .103 .158 .275 .824 -.125
stk12 .129 .206 .037 .001 -.090 .789
Extraction Method: Principal Component Analysis.
Rotation Method: Varimax with Kaiser Normalization.
a. Rotation converged in 8 iterations.
The Table 6.37 is a rotated component matrix which clearly shows that 6
factors were extracted from 24 variables. These six factors are shown in the
Table 6.38.
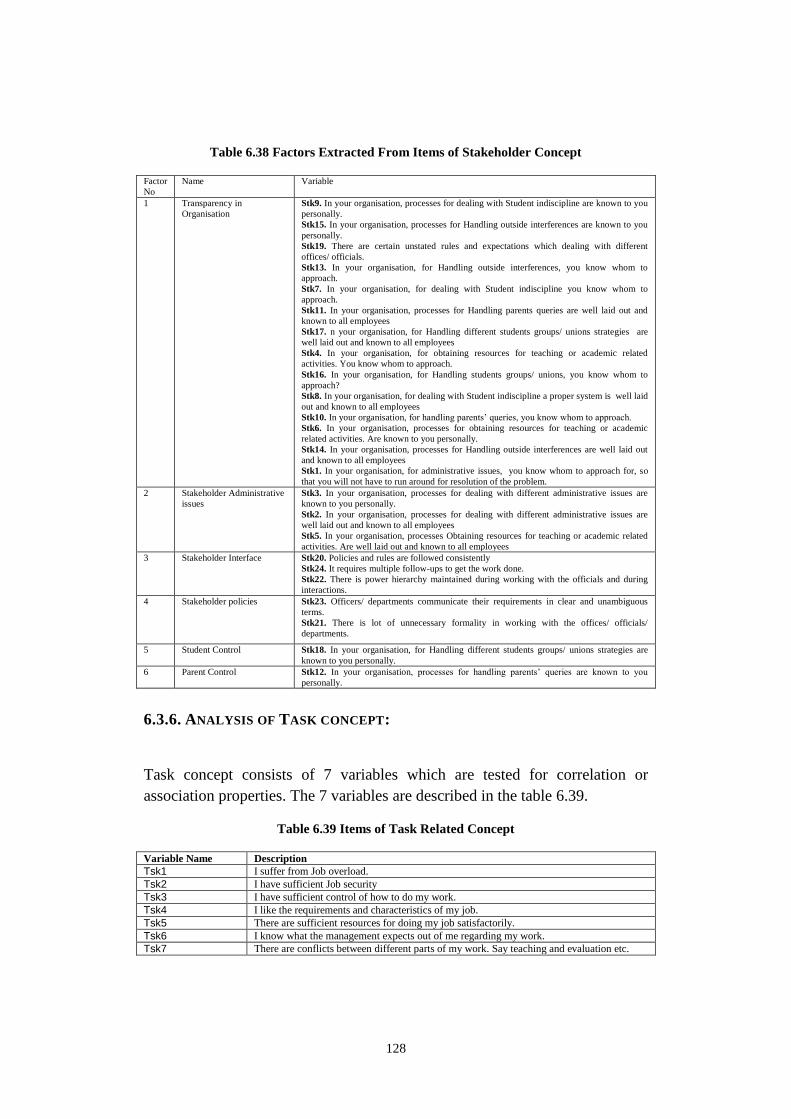
128
Table 6.38 Factors Extracted From Items of Stakeholder Concept
Factor
No
Name Variable
1 Transparency in
Organisation
Stk9. In your organisation, processes for dealing with Student indiscipline are known to you
personally.
Stk15. In your organisation, processes for Handling outside interferences are known to you
personally.
Stk19. There are certain unstated rules and expectations which dealing with different
offices/ officials.
Stk13. In your organisation, for Handling outside interferences, you know whom to
approach.
Stk7. In your organisation, for dealing with Student indiscipline you know whom to
approach.
Stk11. In your organisation, processes for Handling parents queries are well laid out and
known to all employees
Stk17. n your organisation, for Handling different students groups/ unions strategies are
well laid out and known to all employees
Stk4. In your organisation, for obtaining resources for teaching or academic related
activities. You know whom to approach.
Stk16. In your organisation, for Handling students groups/ unions, you know whom to
approach?
Stk8. In your organisation, for dealing with Student indiscipline a proper system is well laid
out and known to all employees
Stk10. In your organisation, for handling parents’ queries, you know whom to approach.
Stk6. In your organisation, processes for obtaining resources for teaching or academic
related activities. Are known to you personally.
Stk14. In your organisation, processes for Handling outside interferences are well laid out
and known to all employees
Stk1. In your organisation, for administrative issues, you know whom to approach for, so
that you will not have to run around for resolution of the problem.
2 Stakeholder Administrative
issues
Stk3. In your organisation, processes for dealing with different administrative issues are
known to you personally.
Stk2. In your organisation, processes for dealing with different administrative issues are
well laid out and known to all employees
Stk5. In your organisation, processes Obtaining resources for teaching or academic related
activities. Are well laid out and known to all employees
3 Stakeholder Interface Stk20. Policies and rules are followed consistently
Stk24. It requires multiple follow-ups to get the work done.
Stk22. There is power hierarchy maintained during working with the officials and during
interactions.
4 Stakeholder policies Stk23. Officers/ departments communicate their requirements in clear and unambiguous
terms.
Stk21. There is lot of unnecessary formality in working with the offices/ officials/
departments.
5 Student Control Stk18. In your organisation, for Handling different students groups/ unions strategies are
known to you personally.
6 Parent Control Stk12. In your organisation, processes for handling parents’ queries are known to you
personally.
6.3.6. ANALYSIS OF TASK CONCEPT:
Task concept consists of 7 variables which are tested for correlation or
association properties. The 7 variables are described in the table 6.39.
Table 6.39 Items of Task Related Concept
Variable Name Description
Tsk1 I suffer from Job overload.
Tsk2 I have sufficient Job security
Tsk3 I have sufficient control of how to do my work.
Tsk4 I like the requirements and characteristics of my job.
Tsk5 There are sufficient resources for doing my job satisfactorily.
Tsk6 I know what the management expects out of me regarding my work.
Tsk7 There are conflicts between different parts of my work. Say teaching and evaluation etc.
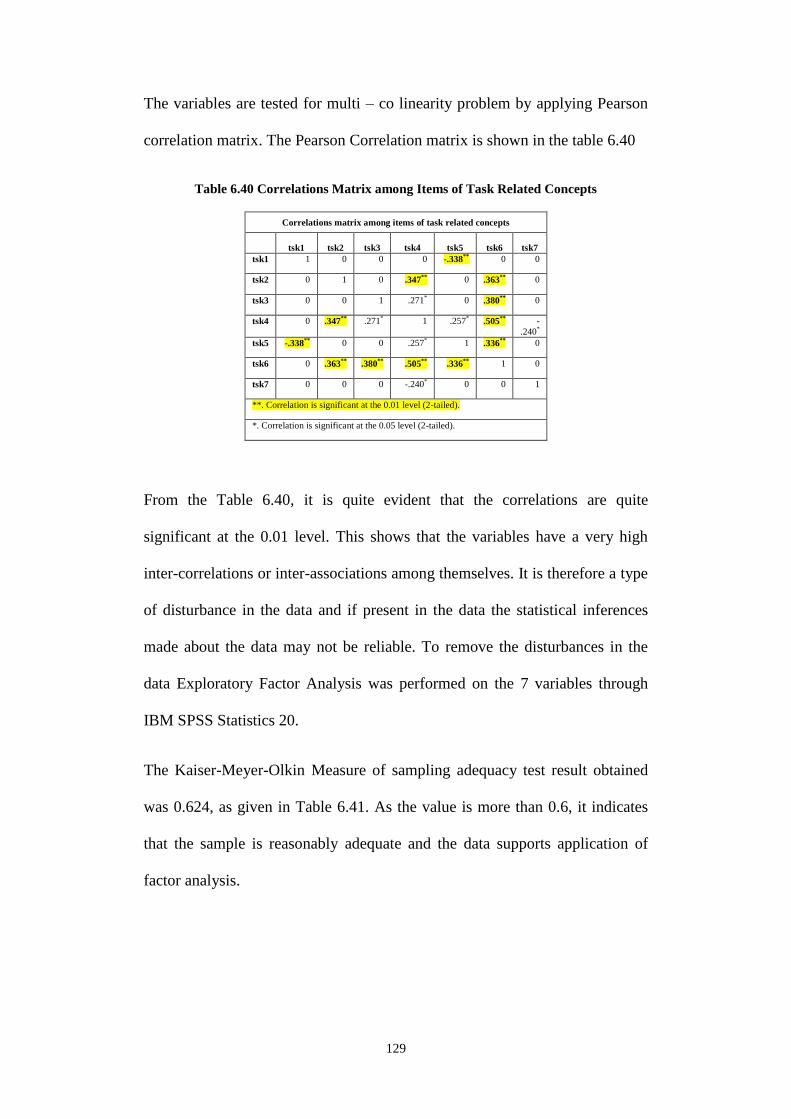
129
The variables are tested for multi – co linearity problem by applying Pearson
correlation matrix. The Pearson Correlation matrix is shown in the table 6.40
Table 6.40 Correlations Matrix among Items of Task Related Concepts
Correlations matrix among items of task related concepts
tsk1 tsk2 tsk3 tsk4 tsk5 tsk6 tsk7
tsk1 1 0 0 0 -.338** 0 0
tsk2 0 1 0 .347** 0 .363** 0
tsk3 0 0 1 .271* 0 .380** 0
tsk4 0 .347** .271* 1 .257* .505** -
.240*
tsk5 -.338** 0 0 .257* 1 .336** 0
tsk6 0 .363** .380** .505** .336** 1 0
tsk7 0 0 0 -.240* 0 0 1
**. Correlation is significant at the 0.01 level (2-tailed).
*. Correlation is significant at the 0.05 level (2-tailed).
From the Table 6.40, it is quite evident that the correlations are quite
significant at the 0.01 level. This shows that the variables have a very high
inter-correlations or inter-associations among themselves. It is therefore a type
of disturbance in the data and if present in the data the statistical inferences
made about the data may not be reliable. To remove the disturbances in the
data Exploratory Factor Analysis was performed on the 7 variables through
IBM SPSS Statistics 20.
The Kaiser-Meyer-Olkin Measure of sampling adequacy test result obtained
was 0.624, as given in Table 6.41. As the value is more than 0.6, it indicates
that the sample is reasonably adequate and the data supports application of
factor analysis.
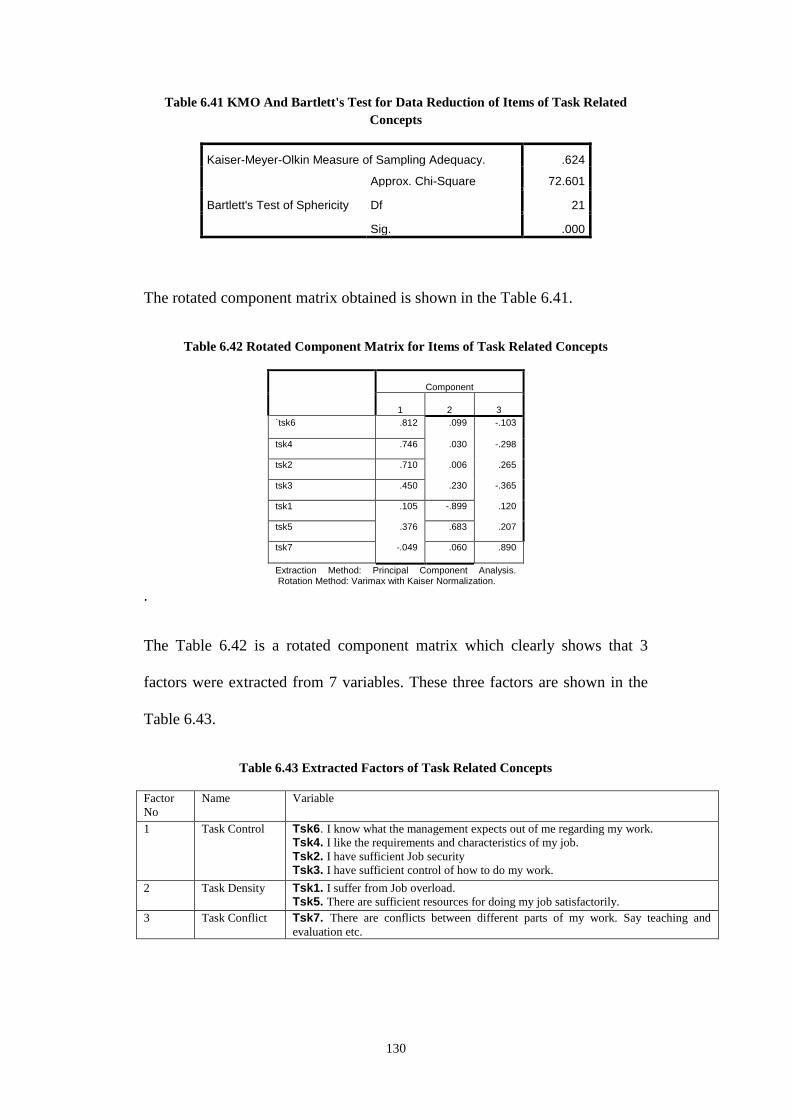
130
Table 6.41 KMO And Bartlett's Test for Data Reduction of Items of Task Related
Concepts
Kaiser-Meyer-Olkin Measure of Sampling Adequacy. .624
Bartlett's Test of Sphericity
Approx. Chi-Square 72.601
Df 21
Sig. .000
The rotated component matrix obtained is shown in the Table 6.41.
Table 6.42 Rotated Component Matrix for Items of Task Related Concepts
Component
1 2 3
`tsk6 .812 .099 -.103
tsk4 .746 .030 -.298
tsk2 .710 .006 .265
tsk3 .450 .230 -.365
tsk1 .105 -.899 .120
tsk5 .376 .683 .207
tsk7 -.049 .060 .890
Extraction Method: Principal Component Analysis. Rotation Method: Varimax with Kaiser Normalization.
.
The Table 6.42 is a rotated component matrix which clearly shows that 3
factors were extracted from 7 variables. These three factors are shown in the
Table 6.43.
Table 6.43 Extracted Factors of Task Related Concepts
Factor
No
Name Variable
1 Task Control Tsk6. I know what the management expects out of me regarding my work.
Tsk4. I like the requirements and characteristics of my job.
Tsk2. I have sufficient Job security
Tsk3. I have sufficient control of how to do my work.
2 Task Density Tsk1. I suffer from Job overload.
Tsk5. There are sufficient resources for doing my job satisfactorily.
3 Task Conflict Tsk7. There are conflicts between different parts of my work. Say teaching and
evaluation etc.
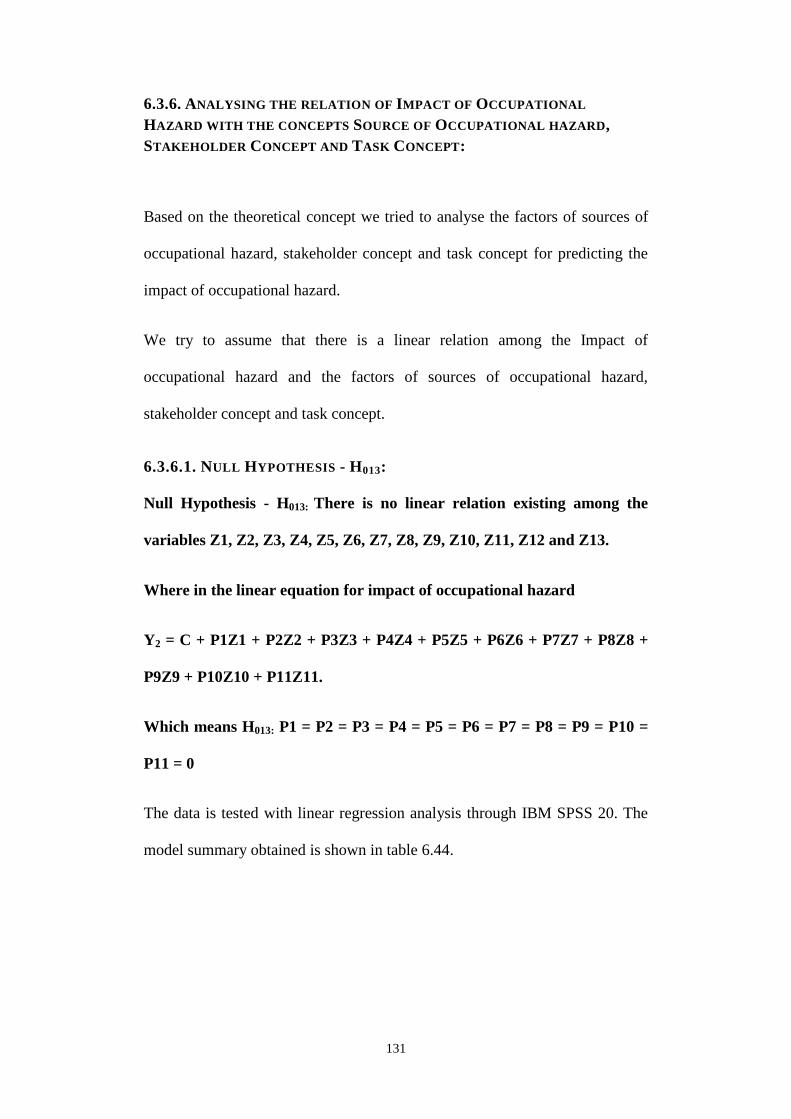
131
6.3.6. ANALYSING THE RELATION OF IMPACT OF OCCUPATIONAL
HAZARD WITH THE CONCEPTS SOURCE OF OCCUPATIONAL HAZARD,
STAKEHOLDER CONCEPT AND TASK CONCEPT:
Based on the theoretical concept we tried to analyse the factors of sources of
occupational hazard, stakeholder concept and task concept for predicting the
impact of occupational hazard.
We try to assume that there is a linear relation among the Impact of
occupational hazard and the factors of sources of occupational hazard,
stakeholder concept and task concept.
6.3.6.1. NULL HYPOTHESIS - H013:
Null Hypothesis - H013: There is no linear relation existing among the
variables Z1, Z2, Z3, Z4, Z5, Z6, Z7, Z8, Z9, Z10, Z11, Z12 and Z13.
Where in the linear equation for impact of occupational hazard
Y2 = C + P1Z1 + P2Z2 + P3Z3 + P4Z4 + P5Z5 + P6Z6 + P7Z7 + P8Z8 +
P9Z9 + P10Z10 + P11Z11.
Which means H013: P1 = P2 = P3 = P4 = P5 = P6 = P7 = P8 = P9 = P10 =
P11 = 0
The data is tested with linear regression analysis through IBM SPSS 20. The
model summary obtained is shown in table 6.44.
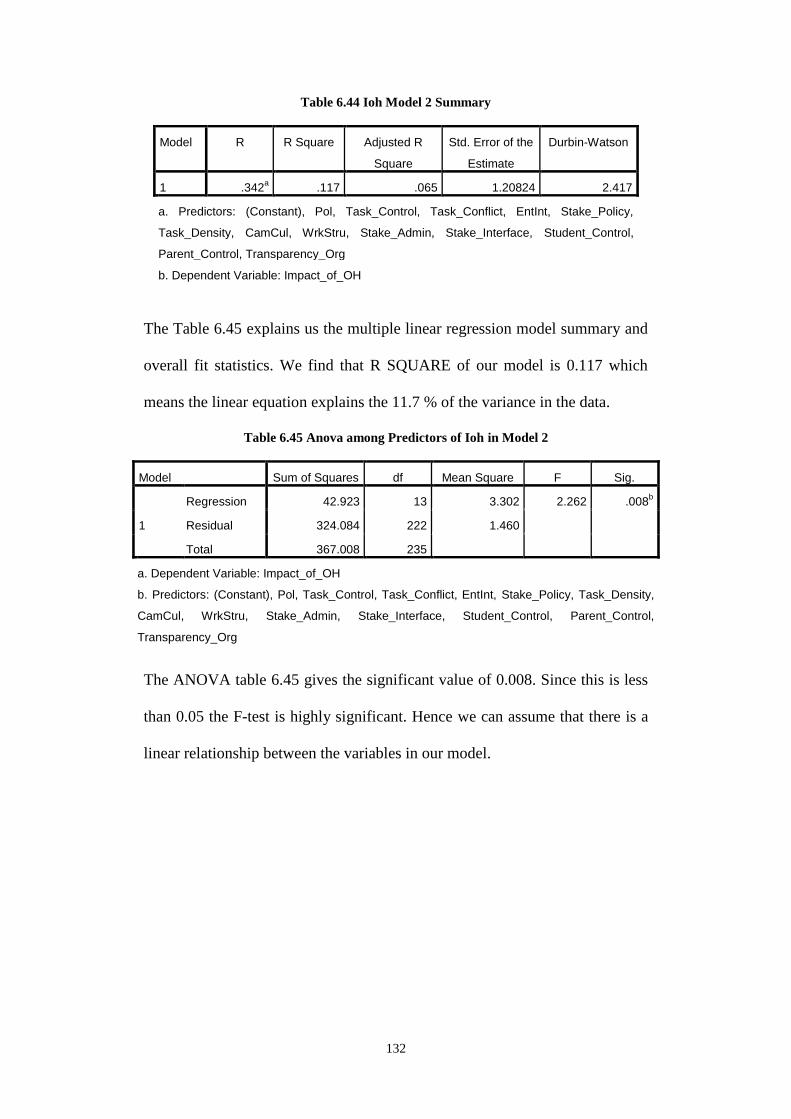
132
Table 6.44 Ioh Model 2 Summary
Model R R Square Adjusted R
Square
Std. Error of the
Estimate
Durbin-Watson
1 .342a .117 .065 1.20824 2.417
a. Predictors: (Constant), Pol, Task_Control, Task_Conflict, EntInt, Stake_Policy,
Task_Density, CamCul, WrkStru, Stake_Admin, Stake_Interface, Student_Control,
Parent_Control, Transparency_Org
b. Dependent Variable: Impact_of_OH
The Table 6.45 explains us the multiple linear regression model summary and
overall fit statistics. We find that R SQUARE of our model is 0.117 which
means the linear equation explains the 11.7 % of the variance in the data.
Table 6.45 Anova among Predictors of Ioh in Model 2
Model Sum of Squares df Mean Square F Sig.
1
Regression 42.923 13 3.302 2.262 .008b
Residual 324.084 222 1.460
Total 367.008 235
a. Dependent Variable: Impact_of_OH
b. Predictors: (Constant), Pol, Task_Control, Task_Conflict, EntInt, Stake_Policy, Task_Density,
CamCul, WrkStru, Stake_Admin, Stake_Interface, Student_Control, Parent_Control,
Transparency_Org
The ANOVA table 6.45 gives the significant value of 0.008. Since this is less
than 0.05 the F-test is highly significant. Hence we can assume that there is a
linear relationship between the variables in our model.
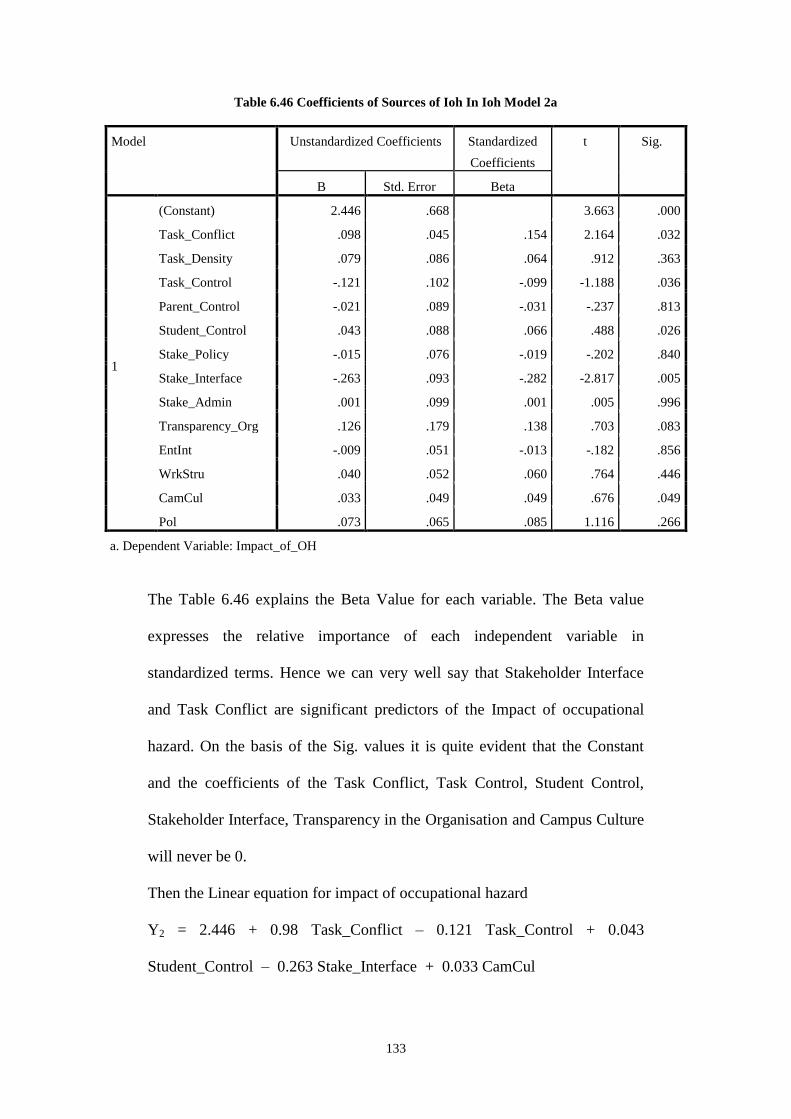
133
Table 6.46 Coefficients of Sources of Ioh In Ioh Model 2a
Model Unstandardized Coefficients Standardized
Coefficients
t Sig.
B Std. Error Beta
1
(Constant) 2.446 .668
3.663 .000
Task_Conflict .098 .045 .154 2.164 .032
Task_Density .079 .086 .064 .912 .363
Task_Control -.121 .102 -.099 -1.188 .036
Parent_Control -.021 .089 -.031 -.237 .813
Student_Control .043 .088 .066 .488 .026
Stake_Policy -.015 .076 -.019 -.202 .840
Stake_Interface -.263 .093 -.282 -2.817 .005
Stake_Admin .001 .099 .001 .005 .996
Transparency_Org .126 .179 .138 .703 .083
EntInt -.009 .051 -.013 -.182 .856
WrkStru .040 .052 .060 .764 .446
CamCul .033 .049 .049 .676 .049
Pol .073 .065 .085 1.116 .266
a. Dependent Variable: Impact_of_OH
The Table 6.46 explains the Beta Value for each variable. The Beta value
expresses the relative importance of each independent variable in
standardized terms. Hence we can very well say that Stakeholder Interface
and Task Conflict are significant predictors of the Impact of occupational
hazard. On the basis of the Sig. values it is quite evident that the Constant
and the coefficients of the Task Conflict, Task Control, Student Control,
Stakeholder Interface, Transparency in the Organisation and Campus Culture
will never be 0.
Then the Linear equation for impact of occupational hazard
Y2 = 2.446 + 0.98 Task_Conflict – 0.121 Task_Control + 0.043
Student_Control – 0.263 Stake_Interface + 0.033 CamCul
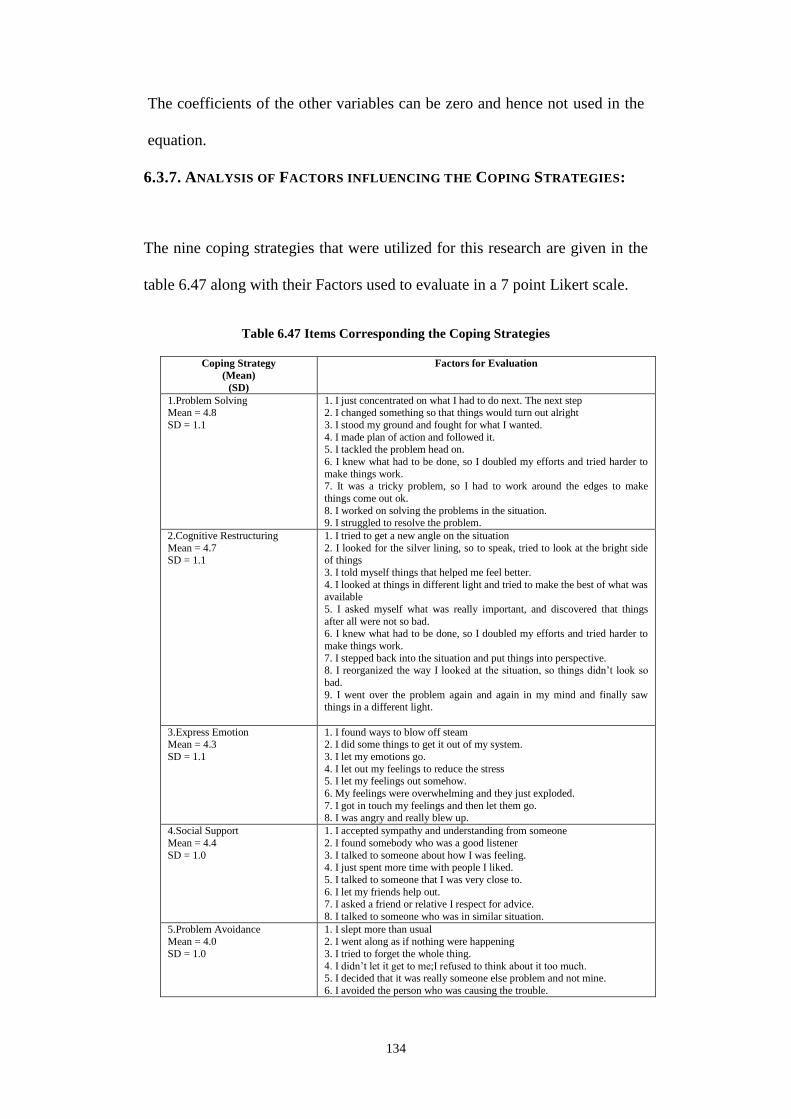
134
The coefficients of the other variables can be zero and hence not used in the
equation.
6.3.7. ANALYSIS OF FACTORS INFLUENCING THE COPING STRATEGIES:
The nine coping strategies that were utilized for this research are given in the
table 6.47 along with their Factors used to evaluate in a 7 point Likert scale.
Table 6.47 Items Corresponding the Coping Strategies
Coping Strategy
(Mean)
(SD)
Factors for Evaluation
1.Problem Solving Mean = 4.8
SD = 1.1
1. I just concentrated on what I had to do next. The next step 2. I changed something so that things would turn out alright
3. I stood my ground and fought for what I wanted.
4. I made plan of action and followed it. 5. I tackled the problem head on.
6. I knew what had to be done, so I doubled my efforts and tried harder to
make things work. 7. It was a tricky problem, so I had to work around the edges to make
things come out ok.
8. I worked on solving the problems in the situation. 9. I struggled to resolve the problem.
2.Cognitive Restructuring
Mean = 4.7 SD = 1.1
1. I tried to get a new angle on the situation
2. I looked for the silver lining, so to speak, tried to look at the bright side of things
3. I told myself things that helped me feel better.
4. I looked at things in different light and tried to make the best of what was available
5. I asked myself what was really important, and discovered that things
after all were not so bad. 6. I knew what had to be done, so I doubled my efforts and tried harder to
make things work.
7. I stepped back into the situation and put things into perspective. 8. I reorganized the way I looked at the situation, so things didn’t look so
bad.
9. I went over the problem again and again in my mind and finally saw things in a different light.
3.Express Emotion Mean = 4.3
SD = 1.1
1. I found ways to blow off steam 2. I did some things to get it out of my system.
3. I let my emotions go.
4. I let out my feelings to reduce the stress 5. I let my feelings out somehow.
6. My feelings were overwhelming and they just exploded.
7. I got in touch my feelings and then let them go. 8. I was angry and really blew up.
4.Social Support
Mean = 4.4
SD = 1.0
1. I accepted sympathy and understanding from someone
2. I found somebody who was a good listener
3. I talked to someone about how I was feeling. 4. I just spent more time with people I liked.
5. I talked to someone that I was very close to.
6. I let my friends help out. 7. I asked a friend or relative I respect for advice.
8. I talked to someone who was in similar situation.
5.Problem Avoidance Mean = 4.0
SD = 1.0
1. I slept more than usual 2. I went along as if nothing were happening
3. I tried to forget the whole thing.
4. I didn’t let it get to me;I refused to think about it too much. 5. I decided that it was really someone else problem and not mine.
6. I avoided the person who was causing the trouble.
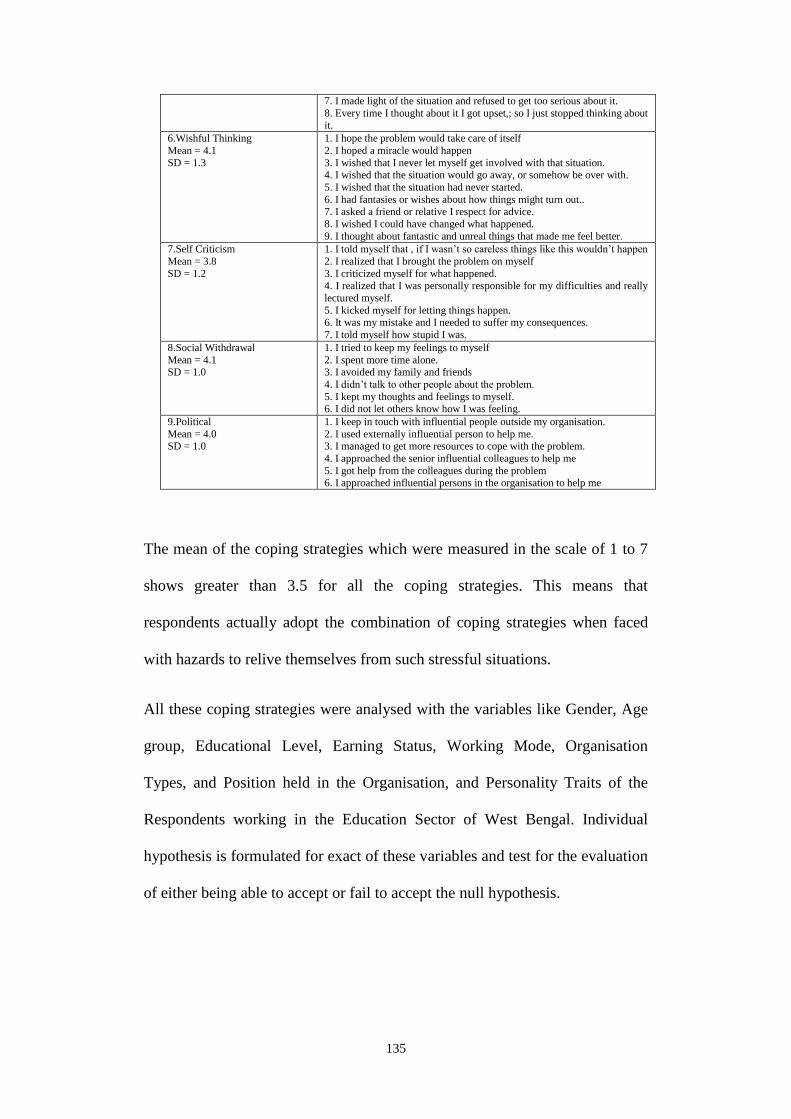
135
7. I made light of the situation and refused to get too serious about it.
8. Every time I thought about it I got upset,; so I just stopped thinking about it.
6.Wishful Thinking
Mean = 4.1
SD = 1.3
1. I hope the problem would take care of itself
2. I hoped a miracle would happen
3. I wished that I never let myself get involved with that situation. 4. I wished that the situation would go away, or somehow be over with.
5. I wished that the situation had never started.
6. I had fantasies or wishes about how things might turn out.. 7. I asked a friend or relative I respect for advice.
8. I wished I could have changed what happened.
9. I thought about fantastic and unreal things that made me feel better.
7.Self Criticism
Mean = 3.8
SD = 1.2
1. I told myself that , if I wasn’t so careless things like this wouldn’t happen
2. I realized that I brought the problem on myself
3. I criticized myself for what happened. 4. I realized that I was personally responsible for my difficulties and really
lectured myself.
5. I kicked myself for letting things happen. 6. It was my mistake and I needed to suffer my consequences.
7. I told myself how stupid I was.
8.Social Withdrawal
Mean = 4.1 SD = 1.0
1. I tried to keep my feelings to myself
2. I spent more time alone. 3. I avoided my family and friends
4. I didn’t talk to other people about the problem.
5. I kept my thoughts and feelings to myself. 6. I did not let others know how I was feeling.
9.Political
Mean = 4.0 SD = 1.0
1. I keep in touch with influential people outside my organisation.
2. I used externally influential person to help me. 3. I managed to get more resources to cope with the problem.
4. I approached the senior influential colleagues to help me
5. I got help from the colleagues during the problem 6. I approached influential persons in the organisation to help me
The mean of the coping strategies which were measured in the scale of 1 to 7
shows greater than 3.5 for all the coping strategies. This means that
respondents actually adopt the combination of coping strategies when faced
with hazards to relive themselves from such stressful situations.
All these coping strategies were analysed with the variables like Gender, Age
group, Educational Level, Earning Status, Working Mode, Organisation
Types, and Position held in the Organisation, and Personality Traits of the
Respondents working in the Education Sector of West Bengal. Individual
hypothesis is formulated for exact of these variables and test for the evaluation
of either being able to accept or fail to accept the null hypothesis.
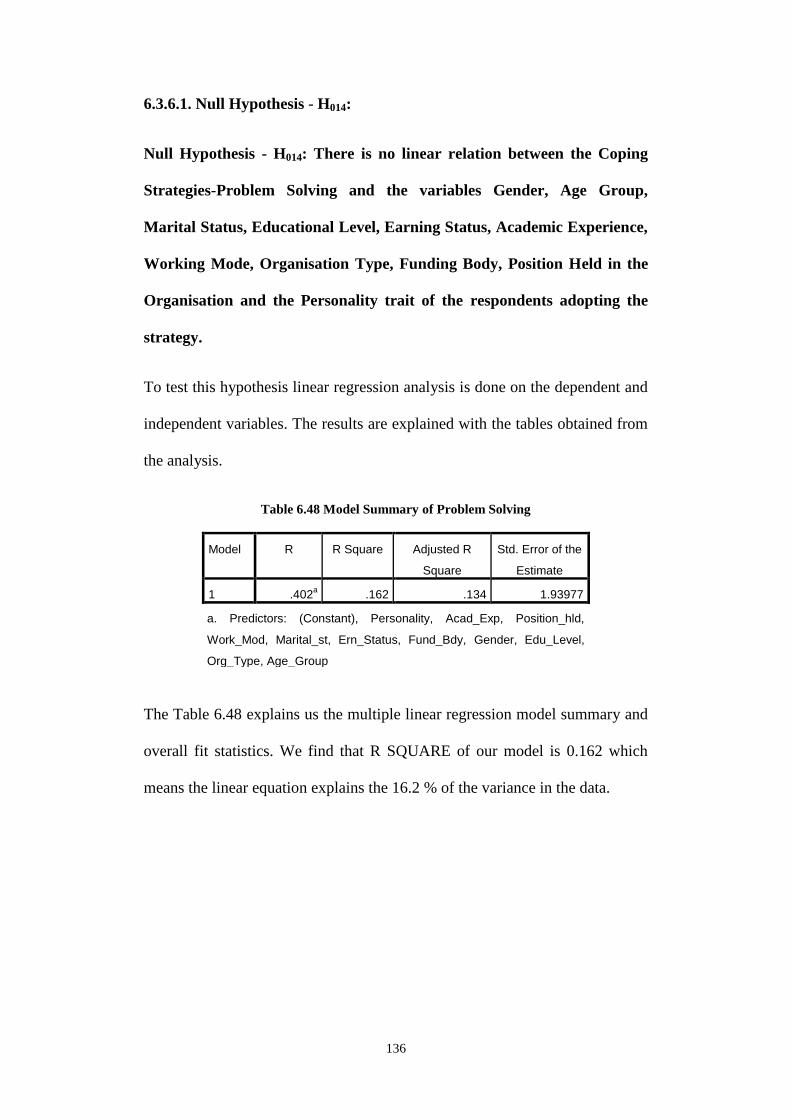
136
6.3.6.1. Null Hypothesis - H014:
Null Hypothesis - H014: There is no linear relation between the Coping
Strategies-Problem Solving and the variables Gender, Age Group,
Marital Status, Educational Level, Earning Status, Academic Experience,
Working Mode, Organisation Type, Funding Body, Position Held in the
Organisation and the Personality trait of the respondents adopting the
strategy.
To test this hypothesis linear regression analysis is done on the dependent and
independent variables. The results are explained with the tables obtained from
the analysis.
Table 6.48 Model Summary of Problem Solving
Model R R Square Adjusted R
Square
Std. Error of the
Estimate
1 .402a .162 .134 1.93977
a. Predictors: (Constant), Personality, Acad_Exp, Position_hld,
Work_Mod, Marital_st, Ern_Status, Fund_Bdy, Gender, Edu_Level,
Org_Type, Age_Group
The Table 6.48 explains us the multiple linear regression model summary and
overall fit statistics. We find that R SQUARE of our model is 0.162 which
means the linear equation explains the 16.2 % of the variance in the data.
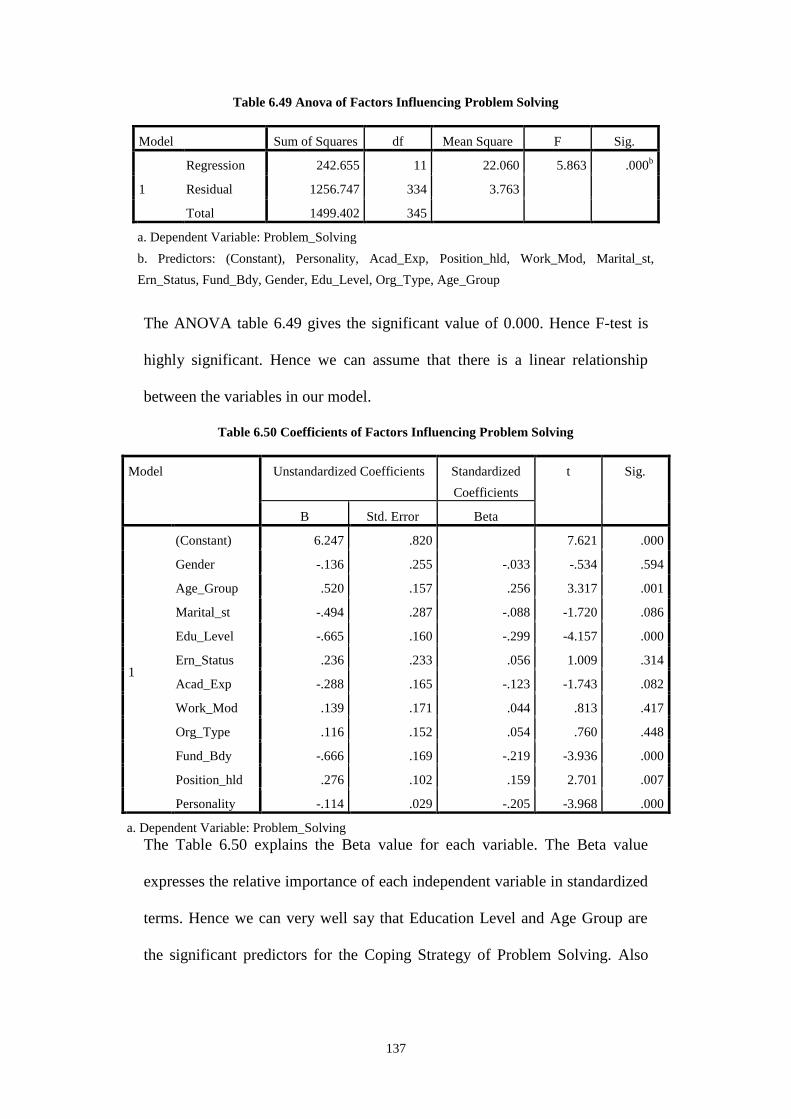
137
Table 6.49 Anova of Factors Influencing Problem Solving
Model Sum of Squares df Mean Square F Sig.
1
Regression 242.655 11 22.060 5.863 .000b
Residual 1256.747 334 3.763
Total 1499.402 345
a. Dependent Variable: Problem_Solving
b. Predictors: (Constant), Personality, Acad_Exp, Position_hld, Work_Mod, Marital_st,
Ern_Status, Fund_Bdy, Gender, Edu_Level, Org_Type, Age_Group
The ANOVA table 6.49 gives the significant value of 0.000. Hence F-test is
highly significant. Hence we can assume that there is a linear relationship
between the variables in our model.
Table 6.50 Coefficients of Factors Influencing Problem Solving
Model Unstandardized Coefficients Standardized
Coefficients
t Sig.
B Std. Error Beta
1
(Constant) 6.247 .820
7.621 .000
Gender -.136 .255 -.033 -.534 .594
Age_Group .520 .157 .256 3.317 .001
Marital_st -.494 .287 -.088 -1.720 .086
Edu_Level -.665 .160 -.299 -4.157 .000
Ern_Status .236 .233 .056 1.009 .314
Acad_Exp -.288 .165 -.123 -1.743 .082
Work_Mod .139 .171 .044 .813 .417
Org_Type .116 .152 .054 .760 .448
Fund_Bdy -.666 .169 -.219 -3.936 .000
Position_hld .276 .102 .159 2.701 .007
Personality -.114 .029 -.205 -3.968 .000
a. Dependent Variable: Problem_Solving
The Table 6.50 explains the Beta value for each variable. The Beta value
expresses the relative importance of each independent variable in standardized
terms. Hence we can very well say that Education Level and Age Group are
the significant predictors for the Coping Strategy of Problem Solving. Also
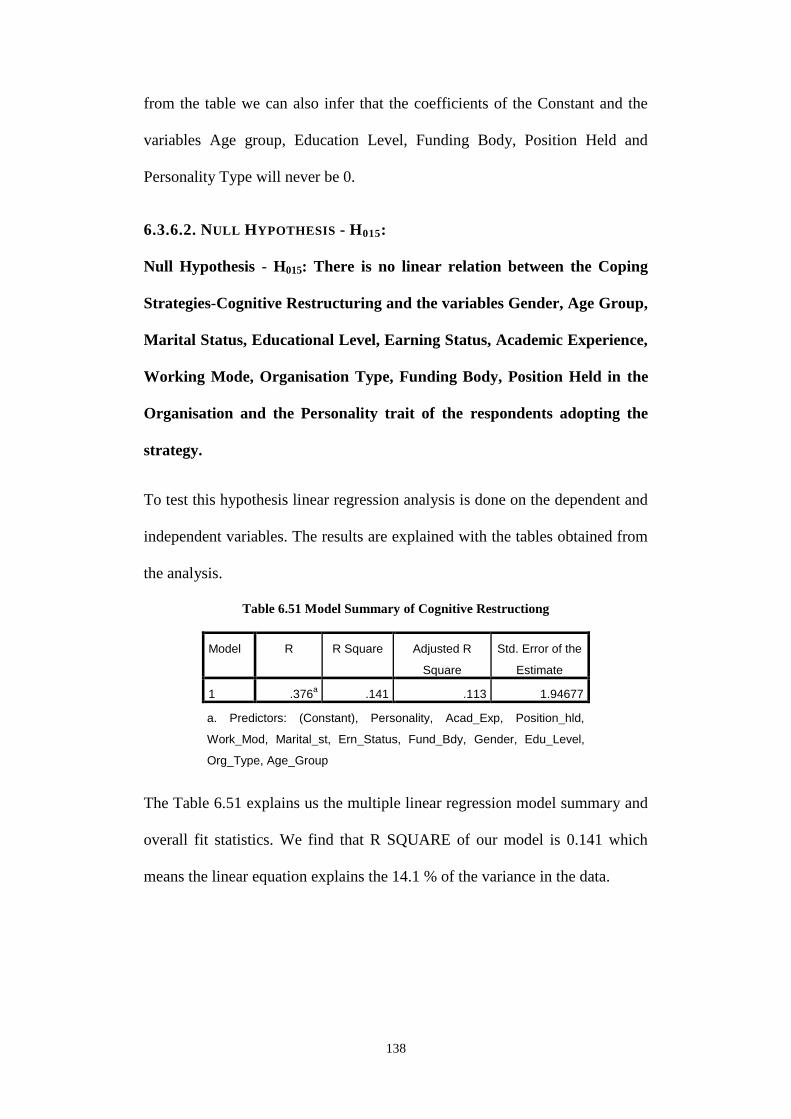
138
from the table we can also infer that the coefficients of the Constant and the
variables Age group, Education Level, Funding Body, Position Held and
Personality Type will never be 0.
6.3.6.2. NULL HYPOTHESIS - H015:
Null Hypothesis - H015: There is no linear relation between the Coping
Strategies-Cognitive Restructuring and the variables Gender, Age Group,
Marital Status, Educational Level, Earning Status, Academic Experience,
Working Mode, Organisation Type, Funding Body, Position Held in the
Organisation and the Personality trait of the respondents adopting the
strategy.
To test this hypothesis linear regression analysis is done on the dependent and
independent variables. The results are explained with the tables obtained from
the analysis.
Table 6.51 Model Summary of Cognitive Restructiong
Model R R Square Adjusted R
Square
Std. Error of the
Estimate
1 .376a .141 .113 1.94677
a. Predictors: (Constant), Personality, Acad_Exp, Position_hld,
Work_Mod, Marital_st, Ern_Status, Fund_Bdy, Gender, Edu_Level,
Org_Type, Age_Group
The Table 6.51 explains us the multiple linear regression model summary and
overall fit statistics. We find that R SQUARE of our model is 0.141 which
means the linear equation explains the 14.1 % of the variance in the data.
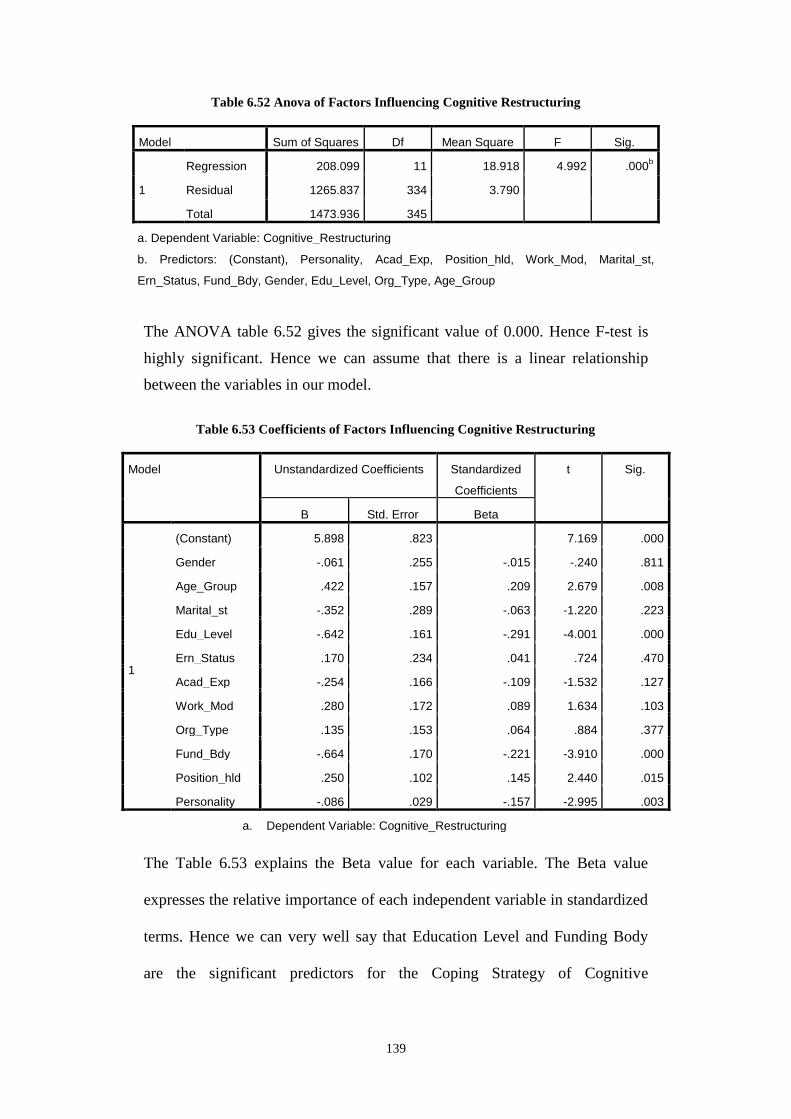
139
Table 6.52 Anova of Factors Influencing Cognitive Restructuring
The ANOVA table 6.52 gives the significant value of 0.000. Hence F-test is
highly significant. Hence we can assume that there is a linear relationship
between the variables in our model.
Table 6.53 Coefficients of Factors Influencing Cognitive Restructuring
Model Unstandardized Coefficients Standardized
Coefficients
t Sig.
B Std. Error Beta
1
(Constant) 5.898 .823 7.169 .000
Gender -.061 .255 -.015 -.240 .811
Age_Group .422 .157 .209 2.679 .008
Marital_st -.352 .289 -.063 -1.220 .223
Edu_Level -.642 .161 -.291 -4.001 .000
Ern_Status .170 .234 .041 .724 .470
Acad_Exp -.254 .166 -.109 -1.532 .127
Work_Mod .280 .172 .089 1.634 .103
Org_Type .135 .153 .064 .884 .377
Fund_Bdy -.664 .170 -.221 -3.910 .000
Position_hld .250 .102 .145 2.440 .015
Personality -.086 .029 -.157 -2.995 .003
a. Dependent Variable: Cognitive_Restructuring
The Table 6.53 explains the Beta value for each variable. The Beta value
expresses the relative importance of each independent variable in standardized
terms. Hence we can very well say that Education Level and Funding Body
are the significant predictors for the Coping Strategy of Cognitive
Model Sum of Squares Df Mean Square F Sig.
1
Regression 208.099 11 18.918 4.992 .000b
Residual 1265.837 334 3.790
Total 1473.936 345
a. Dependent Variable: Cognitive_Restructuring
b. Predictors: (Constant), Personality, Acad_Exp, Position_hld, Work_Mod, Marital_st,
Ern_Status, Fund_Bdy, Gender, Edu_Level, Org_Type, Age_Group
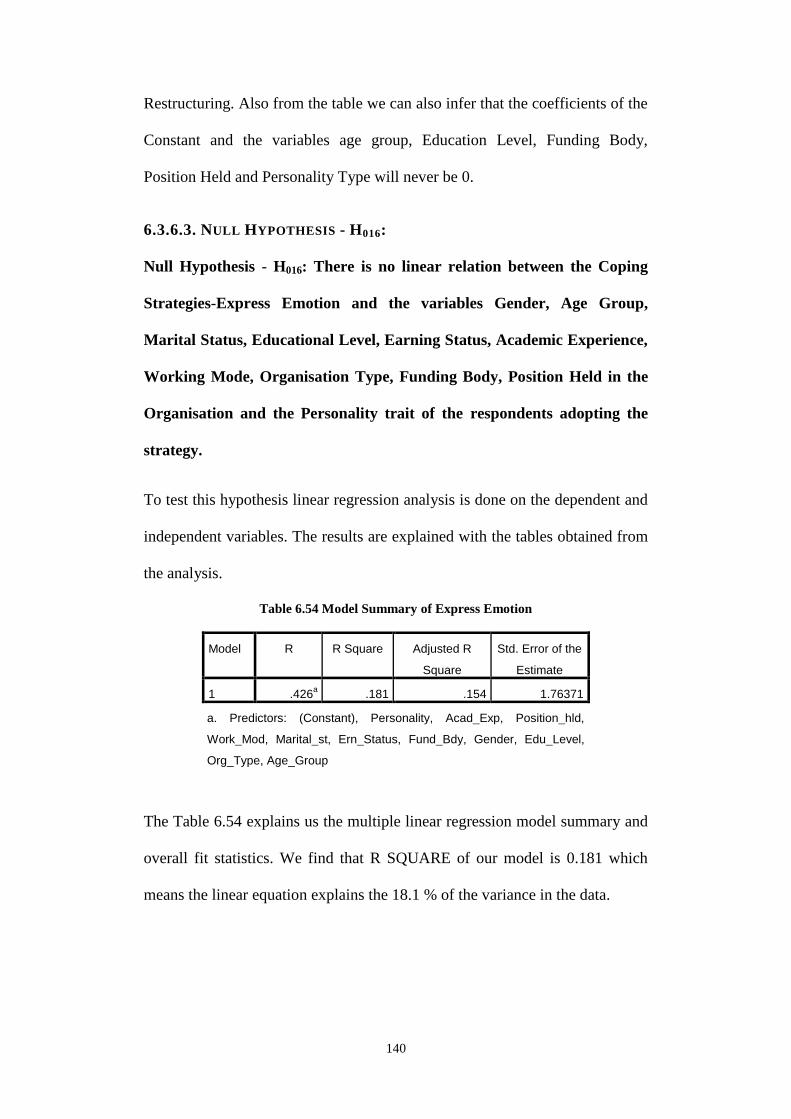
140
Restructuring. Also from the table we can also infer that the coefficients of the
Constant and the variables age group, Education Level, Funding Body,
Position Held and Personality Type will never be 0.
6.3.6.3. NULL HYPOTHESIS - H016:
Null Hypothesis - H016: There is no linear relation between the Coping
Strategies-Express Emotion and the variables Gender, Age Group,
Marital Status, Educational Level, Earning Status, Academic Experience,
Working Mode, Organisation Type, Funding Body, Position Held in the
Organisation and the Personality trait of the respondents adopting the
strategy.
To test this hypothesis linear regression analysis is done on the dependent and
independent variables. The results are explained with the tables obtained from
the analysis.
Table 6.54 Model Summary of Express Emotion
Model R R Square Adjusted R
Square
Std. Error of the
Estimate
1 .426a .181 .154 1.76371
a. Predictors: (Constant), Personality, Acad_Exp, Position_hld,
Work_Mod, Marital_st, Ern_Status, Fund_Bdy, Gender, Edu_Level,
Org_Type, Age_Group
The Table 6.54 explains us the multiple linear regression model summary and
overall fit statistics. We find that R SQUARE of our model is 0.181 which
means the linear equation explains the 18.1 % of the variance in the data.
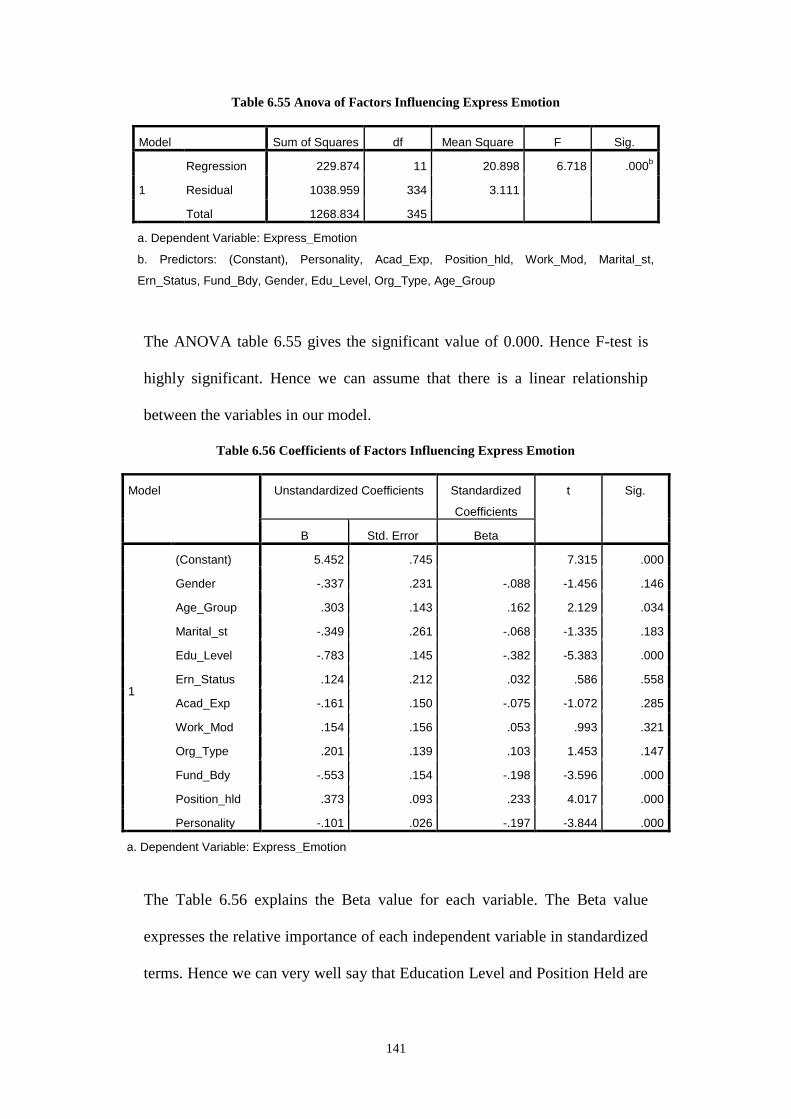
141
Table 6.55 Anova of Factors Influencing Express Emotion
Model Sum of Squares df Mean Square F Sig.
1
Regression 229.874 11 20.898 6.718 .000b
Residual 1038.959 334 3.111
Total 1268.834 345
a. Dependent Variable: Express_Emotion
b. Predictors: (Constant), Personality, Acad_Exp, Position_hld, Work_Mod, Marital_st,
Ern_Status, Fund_Bdy, Gender, Edu_Level, Org_Type, Age_Group
The ANOVA table 6.55 gives the significant value of 0.000. Hence F-test is
highly significant. Hence we can assume that there is a linear relationship
between the variables in our model.
Table 6.56 Coefficients of Factors Influencing Express Emotion
Model Unstandardized Coefficients Standardized
Coefficients
t Sig.
B Std. Error Beta
1
(Constant) 5.452 .745 7.315 .000
Gender -.337 .231 -.088 -1.456 .146
Age_Group .303 .143 .162 2.129 .034
Marital_st -.349 .261 -.068 -1.335 .183
Edu_Level -.783 .145 -.382 -5.383 .000
Ern_Status .124 .212 .032 .586 .558
Acad_Exp -.161 .150 -.075 -1.072 .285
Work_Mod .154 .156 .053 .993 .321
Org_Type .201 .139 .103 1.453 .147
Fund_Bdy -.553 .154 -.198 -3.596 .000
Position_hld .373 .093 .233 4.017 .000
Personality -.101 .026 -.197 -3.844 .000
a. Dependent Variable: Express_Emotion
The Table 6.56 explains the Beta value for each variable. The Beta value
expresses the relative importance of each independent variable in standardized
terms. Hence we can very well say that Education Level and Position Held are
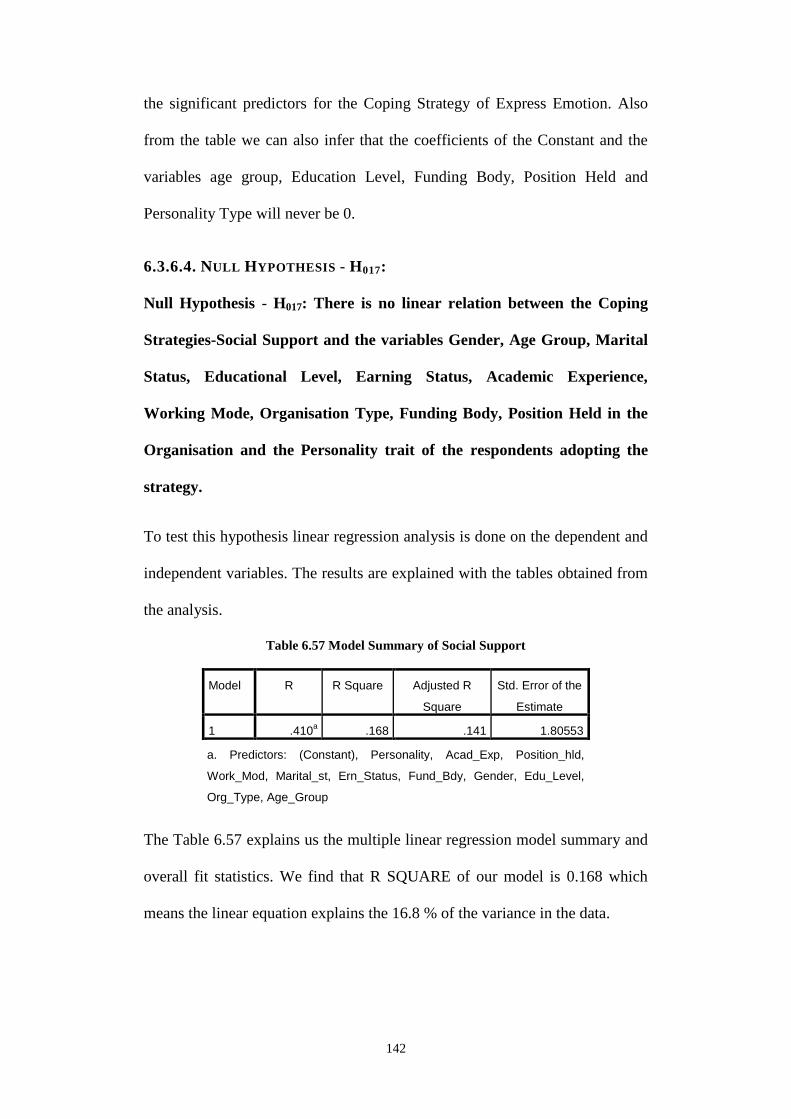
142
the significant predictors for the Coping Strategy of Express Emotion. Also
from the table we can also infer that the coefficients of the Constant and the
variables age group, Education Level, Funding Body, Position Held and
Personality Type will never be 0.
6.3.6.4. NULL HYPOTHESIS - H017:
Null Hypothesis - H017: There is no linear relation between the Coping
Strategies-Social Support and the variables Gender, Age Group, Marital
Status, Educational Level, Earning Status, Academic Experience,
Working Mode, Organisation Type, Funding Body, Position Held in the
Organisation and the Personality trait of the respondents adopting the
strategy.
To test this hypothesis linear regression analysis is done on the dependent and
independent variables. The results are explained with the tables obtained from
the analysis.
Table 6.57 Model Summary of Social Support
Model R R Square Adjusted R
Square
Std. Error of the
Estimate
1 .410a .168 .141 1.80553
a. Predictors: (Constant), Personality, Acad_Exp, Position_hld,
Work_Mod, Marital_st, Ern_Status, Fund_Bdy, Gender, Edu_Level,
Org_Type, Age_Group
The Table 6.57 explains us the multiple linear regression model summary and
overall fit statistics. We find that R SQUARE of our model is 0.168 which
means the linear equation explains the 16.8 % of the variance in the data.
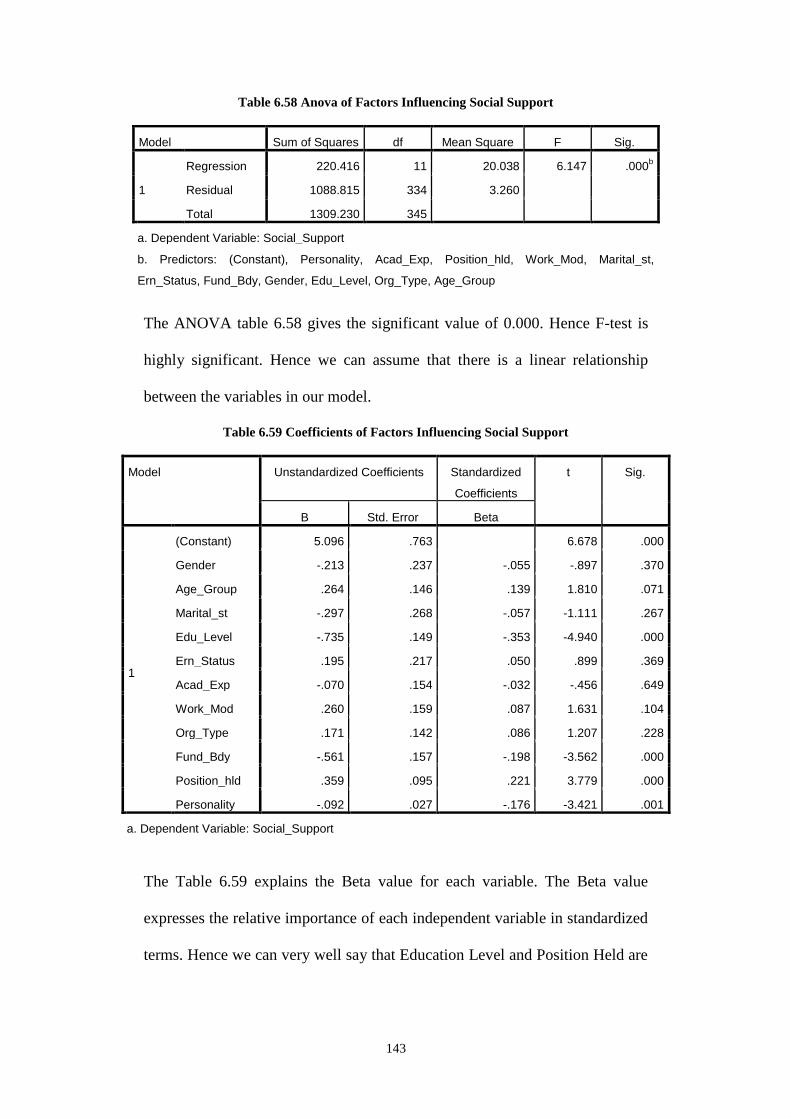
143
Table 6.58 Anova of Factors Influencing Social Support
Model Sum of Squares df Mean Square F Sig.
1
Regression 220.416 11 20.038 6.147 .000b
Residual 1088.815 334 3.260
Total 1309.230 345
a. Dependent Variable: Social_Support
b. Predictors: (Constant), Personality, Acad_Exp, Position_hld, Work_Mod, Marital_st,
Ern_Status, Fund_Bdy, Gender, Edu_Level, Org_Type, Age_Group
The ANOVA table 6.58 gives the significant value of 0.000. Hence F-test is
highly significant. Hence we can assume that there is a linear relationship
between the variables in our model.
Table 6.59 Coefficients of Factors Influencing Social Support
Model Unstandardized Coefficients Standardized
Coefficients
t Sig.
B Std. Error Beta
1
(Constant) 5.096 .763 6.678 .000
Gender -.213 .237 -.055 -.897 .370
Age_Group .264 .146 .139 1.810 .071
Marital_st -.297 .268 -.057 -1.111 .267
Edu_Level -.735 .149 -.353 -4.940 .000
Ern_Status .195 .217 .050 .899 .369
Acad_Exp -.070 .154 -.032 -.456 .649
Work_Mod .260 .159 .087 1.631 .104
Org_Type .171 .142 .086 1.207 .228
Fund_Bdy -.561 .157 -.198 -3.562 .000
Position_hld .359 .095 .221 3.779 .000
Personality -.092 .027 -.176 -3.421 .001
a. Dependent Variable: Social_Support
The Table 6.59 explains the Beta value for each variable. The Beta value
expresses the relative importance of each independent variable in standardized
terms. Hence we can very well say that Education Level and Position Held are
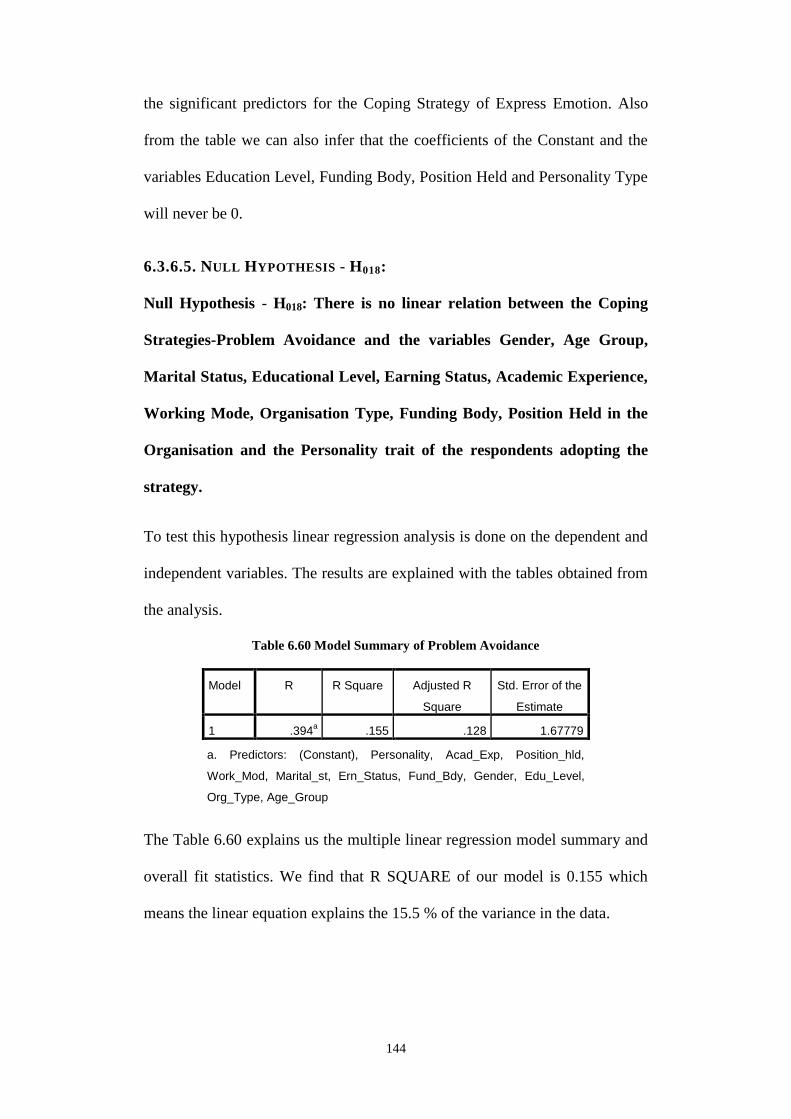
144
the significant predictors for the Coping Strategy of Express Emotion. Also
from the table we can also infer that the coefficients of the Constant and the
variables Education Level, Funding Body, Position Held and Personality Type
will never be 0.
6.3.6.5. NULL HYPOTHESIS - H018:
Null Hypothesis - H018: There is no linear relation between the Coping
Strategies-Problem Avoidance and the variables Gender, Age Group,
Marital Status, Educational Level, Earning Status, Academic Experience,
Working Mode, Organisation Type, Funding Body, Position Held in the
Organisation and the Personality trait of the respondents adopting the
strategy.
To test this hypothesis linear regression analysis is done on the dependent and
independent variables. The results are explained with the tables obtained from
the analysis.
Table 6.60 Model Summary of Problem Avoidance
Model R R Square Adjusted R
Square
Std. Error of the
Estimate
1 .394a .155 .128 1.67779
a. Predictors: (Constant), Personality, Acad_Exp, Position_hld,
Work_Mod, Marital_st, Ern_Status, Fund_Bdy, Gender, Edu_Level,
Org_Type, Age_Group
The Table 6.60 explains us the multiple linear regression model summary and
overall fit statistics. We find that R SQUARE of our model is 0.155 which
means the linear equation explains the 15.5 % of the variance in the data.

145
Table 6.61 Anova of Factors Influencing Problem Avoidance
Model Sum of Squares df Mean Square F Sig.
1
Regression 172.928 11 15.721 5.585 .000b
Residual 940.201 334 2.815
Total 1113.129 345
a. Dependent Variable: Problem_Avoidance
b. Predictors: (Constant), Personality, Acad_Exp, Position_hld, Work_Mod, Marital_st,
Ern_Status, Fund_Bdy, Gender, Edu_Level, Org_Type, Age_Group
The ANOVA table 6.61 gives the significant value of 0.000. Hence F-test is
highly significant. Hence we can assume that there is a linear relationship
between the variables in our model.
Table 6.62 Coefficients of Factors Influencing Problem Avoidance
Model Unstandardized Coefficients Standardized
Coefficients
t Sig.
B Std. Error Beta
1
(Constant) 5.274 .709 7.437 .000
Gender -.004 .220 -.001 -.020 .984
Age_Group .393 .136 .224 2.895 .004
Marital_st -.249 .249 -.052 -.999 .318
Edu_Level -.700 .138 -.365 -5.057 .000
Ern_Status -.121 .202 -.034 -.599 .550
Acad_Exp -.256 .143 -.127 -1.790 .074
Work_Mod .083 .148 .030 .560 .576
Org_Type .110 .132 .060 .833 .405
Fund_Bdy -.637 .146 -.244 -4.358 .000
Position_hld .317 .088 .212 3.594 .000
Personality -.067 .025 -.141 -2.709 .007
a. Dependent Variable: Problem_Avoidance
The Table 6.62 explains the Beta value for each variable. The Beta value
expresses the relative importance of each independent variable in standardized
terms. Hence we can very well say that Education Level and Funding Body
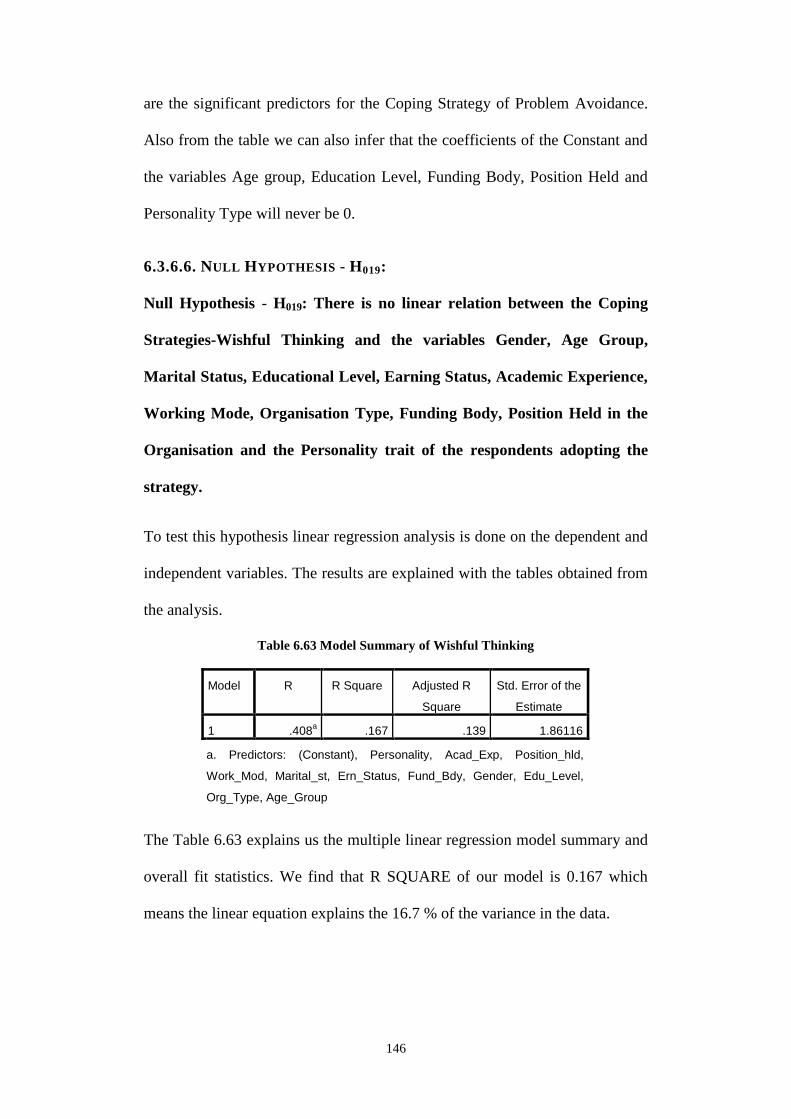
146
are the significant predictors for the Coping Strategy of Problem Avoidance.
Also from the table we can also infer that the coefficients of the Constant and
the variables Age group, Education Level, Funding Body, Position Held and
Personality Type will never be 0.
6.3.6.6. NULL HYPOTHESIS - H019:
Null Hypothesis - H019: There is no linear relation between the Coping
Strategies-Wishful Thinking and the variables Gender, Age Group,
Marital Status, Educational Level, Earning Status, Academic Experience,
Working Mode, Organisation Type, Funding Body, Position Held in the
Organisation and the Personality trait of the respondents adopting the
strategy.
To test this hypothesis linear regression analysis is done on the dependent and
independent variables. The results are explained with the tables obtained from
the analysis.
Table 6.63 Model Summary of Wishful Thinking
The Table 6.63 explains us the multiple linear regression model summary and
overall fit statistics. We find that R SQUARE of our model is 0.167 which
means the linear equation explains the 16.7 % of the variance in the data.
Model R R Square Adjusted R
Square
Std. Error of the
Estimate
1 .408a .167 .139 1.86116
a. Predictors: (Constant), Personality, Acad_Exp, Position_hld,
Work_Mod, Marital_st, Ern_Status, Fund_Bdy, Gender, Edu_Level,
Org_Type, Age_Group
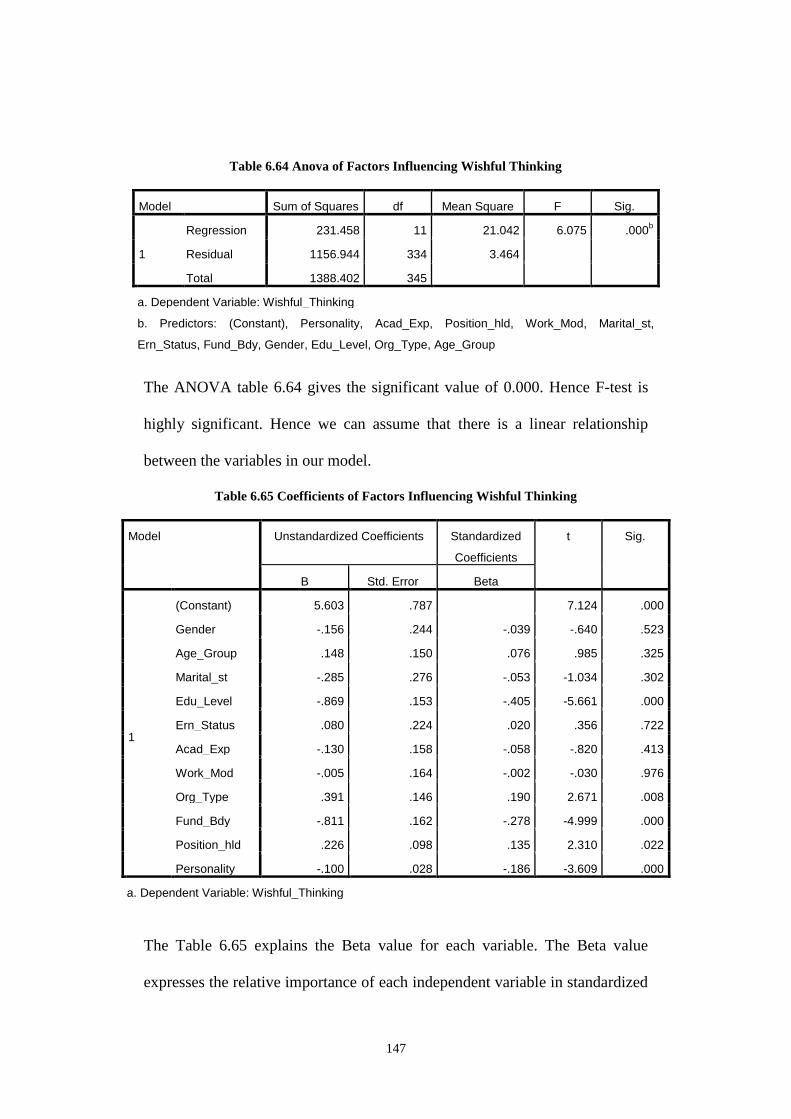
147
Table 6.64 Anova of Factors Influencing Wishful Thinking
Model Sum of Squares df Mean Square F Sig.
1
Regression 231.458 11 21.042 6.075 .000b
Residual 1156.944 334 3.464
Total 1388.402 345
a. Dependent Variable: Wishful_Thinking
b. Predictors: (Constant), Personality, Acad_Exp, Position_hld, Work_Mod, Marital_st,
Ern_Status, Fund_Bdy, Gender, Edu_Level, Org_Type, Age_Group
The ANOVA table 6.64 gives the significant value of 0.000. Hence F-test is
highly significant. Hence we can assume that there is a linear relationship
between the variables in our model.
Table 6.65 Coefficients of Factors Influencing Wishful Thinking
Model Unstandardized Coefficients Standardized
Coefficients
t Sig.
B Std. Error Beta
1
(Constant) 5.603 .787 7.124 .000
Gender -.156 .244 -.039 -.640 .523
Age_Group .148 .150 .076 .985 .325
Marital_st -.285 .276 -.053 -1.034 .302
Edu_Level -.869 .153 -.405 -5.661 .000
Ern_Status .080 .224 .020 .356 .722
Acad_Exp -.130 .158 -.058 -.820 .413
Work_Mod -.005 .164 -.002 -.030 .976
Org_Type .391 .146 .190 2.671 .008
Fund_Bdy -.811 .162 -.278 -4.999 .000
Position_hld .226 .098 .135 2.310 .022
Personality -.100 .028 -.186 -3.609 .000
a. Dependent Variable: Wishful_Thinking
The Table 6.65 explains the Beta value for each variable. The Beta value
expresses the relative importance of each independent variable in standardized
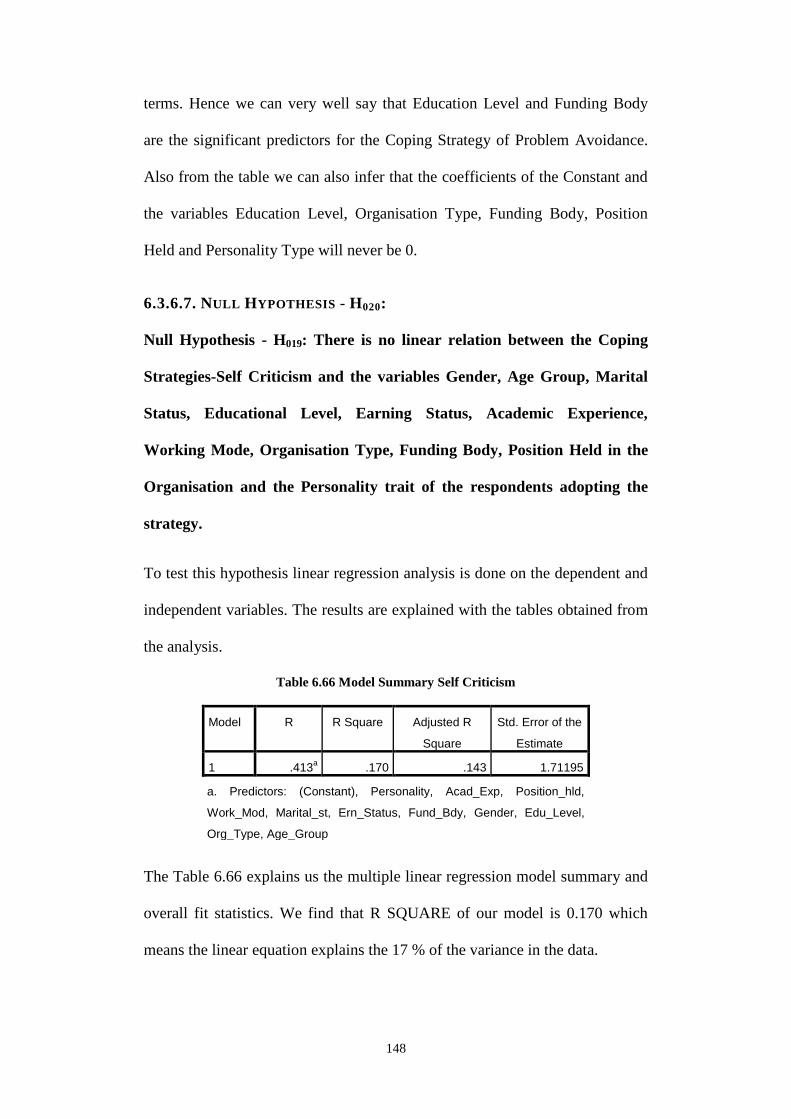
148
terms. Hence we can very well say that Education Level and Funding Body
are the significant predictors for the Coping Strategy of Problem Avoidance.
Also from the table we can also infer that the coefficients of the Constant and
the variables Education Level, Organisation Type, Funding Body, Position
Held and Personality Type will never be 0.
6.3.6.7. NULL HYPOTHESIS - H020:
Null Hypothesis - H019: There is no linear relation between the Coping
Strategies-Self Criticism and the variables Gender, Age Group, Marital
Status, Educational Level, Earning Status, Academic Experience,
Working Mode, Organisation Type, Funding Body, Position Held in the
Organisation and the Personality trait of the respondents adopting the
strategy.
To test this hypothesis linear regression analysis is done on the dependent and
independent variables. The results are explained with the tables obtained from
the analysis.
Table 6.66 Model Summary Self Criticism
Model R R Square Adjusted R
Square
Std. Error of the
Estimate
1 .413a .170 .143 1.71195
a. Predictors: (Constant), Personality, Acad_Exp, Position_hld,
Work_Mod, Marital_st, Ern_Status, Fund_Bdy, Gender, Edu_Level,
Org_Type, Age_Group
The Table 6.66 explains us the multiple linear regression model summary and
overall fit statistics. We find that R SQUARE of our model is 0.170 which
means the linear equation explains the 17 % of the variance in the data.
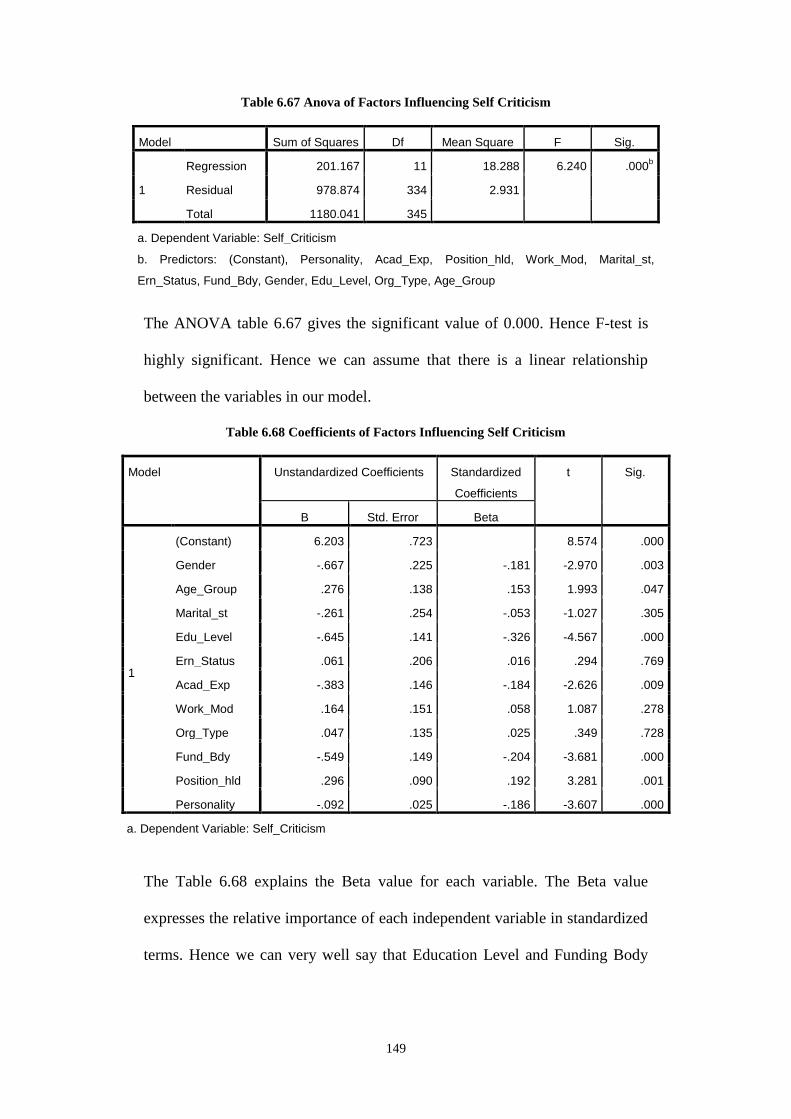
149
Table 6.67 Anova of Factors Influencing Self Criticism
Model Sum of Squares Df Mean Square F Sig.
1
Regression 201.167 11 18.288 6.240 .000b
Residual 978.874 334 2.931
Total 1180.041 345
a. Dependent Variable: Self_Criticism
b. Predictors: (Constant), Personality, Acad_Exp, Position_hld, Work_Mod, Marital_st,
Ern_Status, Fund_Bdy, Gender, Edu_Level, Org_Type, Age_Group
The ANOVA table 6.67 gives the significant value of 0.000. Hence F-test is
highly significant. Hence we can assume that there is a linear relationship
between the variables in our model.
Table 6.68 Coefficients of Factors Influencing Self Criticism
Model Unstandardized Coefficients Standardized
Coefficients
t Sig.
B Std. Error Beta
1
(Constant) 6.203 .723 8.574 .000
Gender -.667 .225 -.181 -2.970 .003
Age_Group .276 .138 .153 1.993 .047
Marital_st -.261 .254 -.053 -1.027 .305
Edu_Level -.645 .141 -.326 -4.567 .000
Ern_Status .061 .206 .016 .294 .769
Acad_Exp -.383 .146 -.184 -2.626 .009
Work_Mod .164 .151 .058 1.087 .278
Org_Type .047 .135 .025 .349 .728
Fund_Bdy -.549 .149 -.204 -3.681 .000
Position_hld .296 .090 .192 3.281 .001
Personality -.092 .025 -.186 -3.607 .000
a. Dependent Variable: Self_Criticism
The Table 6.68 explains the Beta value for each variable. The Beta value
expresses the relative importance of each independent variable in standardized
terms. Hence we can very well say that Education Level and Funding Body
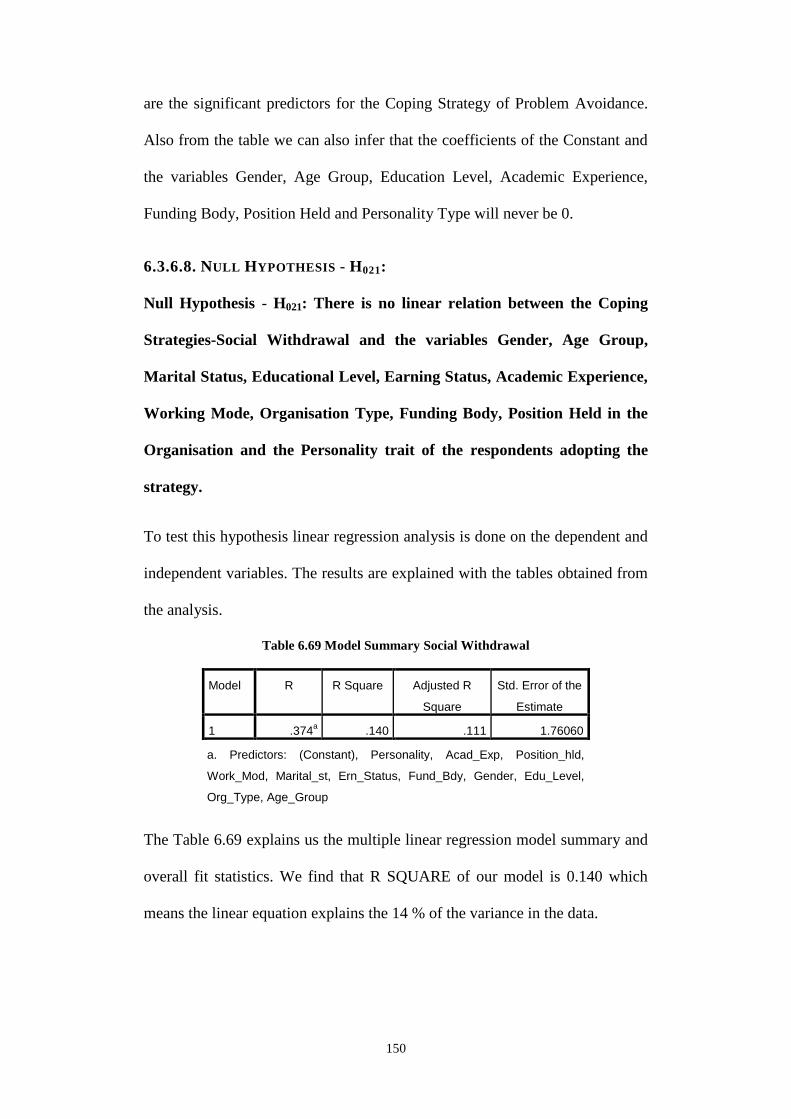
150
are the significant predictors for the Coping Strategy of Problem Avoidance.
Also from the table we can also infer that the coefficients of the Constant and
the variables Gender, Age Group, Education Level, Academic Experience,
Funding Body, Position Held and Personality Type will never be 0.
6.3.6.8. NULL HYPOTHESIS - H021:
Null Hypothesis - H021: There is no linear relation between the Coping
Strategies-Social Withdrawal and the variables Gender, Age Group,
Marital Status, Educational Level, Earning Status, Academic Experience,
Working Mode, Organisation Type, Funding Body, Position Held in the
Organisation and the Personality trait of the respondents adopting the
strategy.
To test this hypothesis linear regression analysis is done on the dependent and
independent variables. The results are explained with the tables obtained from
the analysis.
Table 6.69 Model Summary Social Withdrawal
Model R R Square Adjusted R
Square
Std. Error of the
Estimate
1 .374a .140 .111 1.76060
a. Predictors: (Constant), Personality, Acad_Exp, Position_hld,
Work_Mod, Marital_st, Ern_Status, Fund_Bdy, Gender, Edu_Level,
Org_Type, Age_Group
The Table 6.69 explains us the multiple linear regression model summary and
overall fit statistics. We find that R SQUARE of our model is 0.140 which
means the linear equation explains the 14 % of the variance in the data.
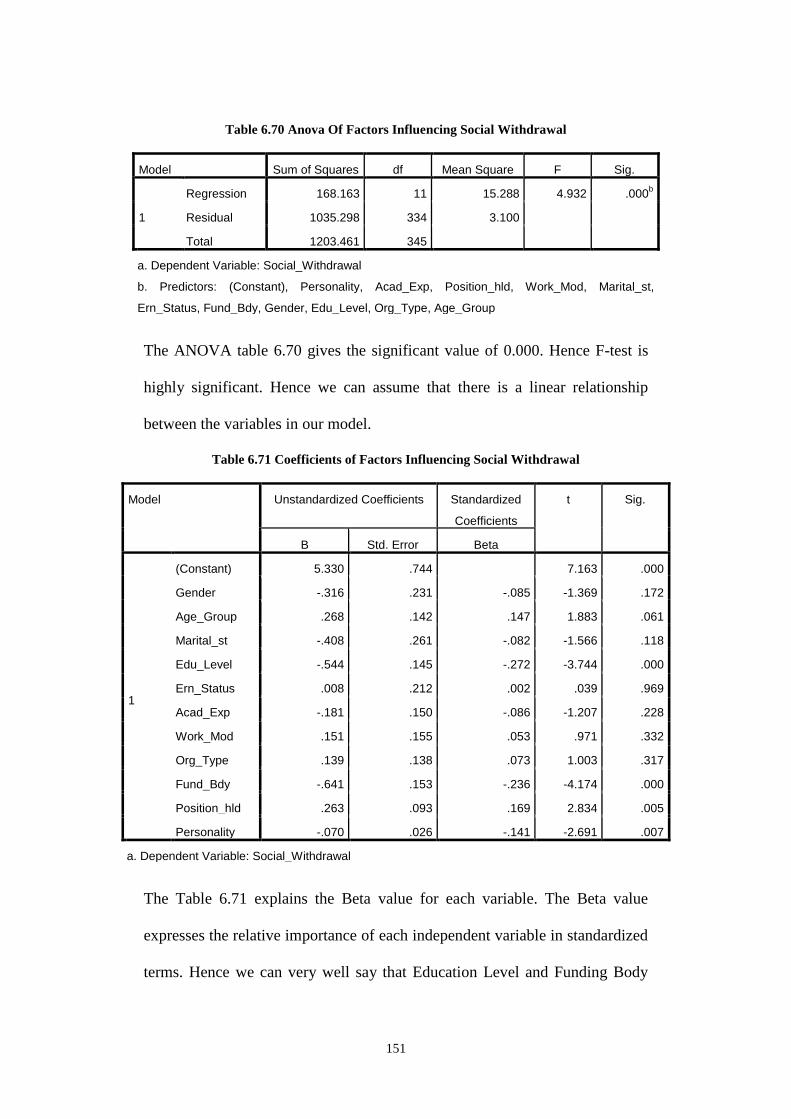
151
Table 6.70 Anova Of Factors Influencing Social Withdrawal
Model Sum of Squares df Mean Square F Sig.
1
Regression 168.163 11 15.288 4.932 .000b
Residual 1035.298 334 3.100
Total 1203.461 345
a. Dependent Variable: Social_Withdrawal
b. Predictors: (Constant), Personality, Acad_Exp, Position_hld, Work_Mod, Marital_st,
Ern_Status, Fund_Bdy, Gender, Edu_Level, Org_Type, Age_Group
The ANOVA table 6.70 gives the significant value of 0.000. Hence F-test is
highly significant. Hence we can assume that there is a linear relationship
between the variables in our model.
Table 6.71 Coefficients of Factors Influencing Social Withdrawal
Model Unstandardized Coefficients Standardized
Coefficients
t Sig.
B Std. Error Beta
1
(Constant) 5.330 .744 7.163 .000
Gender -.316 .231 -.085 -1.369 .172
Age_Group .268 .142 .147 1.883 .061
Marital_st -.408 .261 -.082 -1.566 .118
Edu_Level -.544 .145 -.272 -3.744 .000
Ern_Status .008 .212 .002 .039 .969
Acad_Exp -.181 .150 -.086 -1.207 .228
Work_Mod .151 .155 .053 .971 .332
Org_Type .139 .138 .073 1.003 .317
Fund_Bdy -.641 .153 -.236 -4.174 .000
Position_hld .263 .093 .169 2.834 .005
Personality -.070 .026 -.141 -2.691 .007
a. Dependent Variable: Social_Withdrawal
The Table 6.71 explains the Beta value for each variable. The Beta value
expresses the relative importance of each independent variable in standardized
terms. Hence we can very well say that Education Level and Funding Body
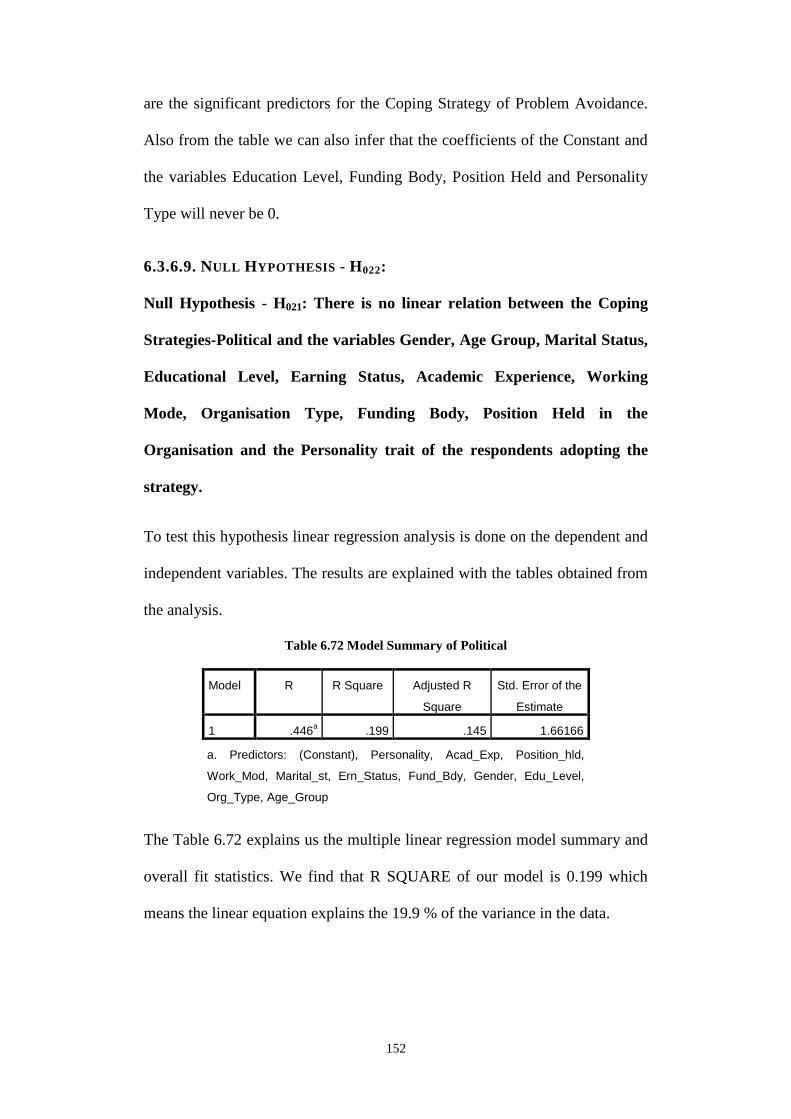
152
are the significant predictors for the Coping Strategy of Problem Avoidance.
Also from the table we can also infer that the coefficients of the Constant and
the variables Education Level, Funding Body, Position Held and Personality
Type will never be 0.
6.3.6.9. NULL HYPOTHESIS - H022:
Null Hypothesis - H021: There is no linear relation between the Coping
Strategies-Political and the variables Gender, Age Group, Marital Status,
Educational Level, Earning Status, Academic Experience, Working
Mode, Organisation Type, Funding Body, Position Held in the
Organisation and the Personality trait of the respondents adopting the
strategy.
To test this hypothesis linear regression analysis is done on the dependent and
independent variables. The results are explained with the tables obtained from
the analysis.
Table 6.72 Model Summary of Political
Model R R Square Adjusted R
Square
Std. Error of the
Estimate
1 .446a .199 .145 1.66166
a. Predictors: (Constant), Personality, Acad_Exp, Position_hld,
Work_Mod, Marital_st, Ern_Status, Fund_Bdy, Gender, Edu_Level,
Org_Type, Age_Group
The Table 6.72 explains us the multiple linear regression model summary and
overall fit statistics. We find that R SQUARE of our model is 0.199 which
means the linear equation explains the 19.9 % of the variance in the data.
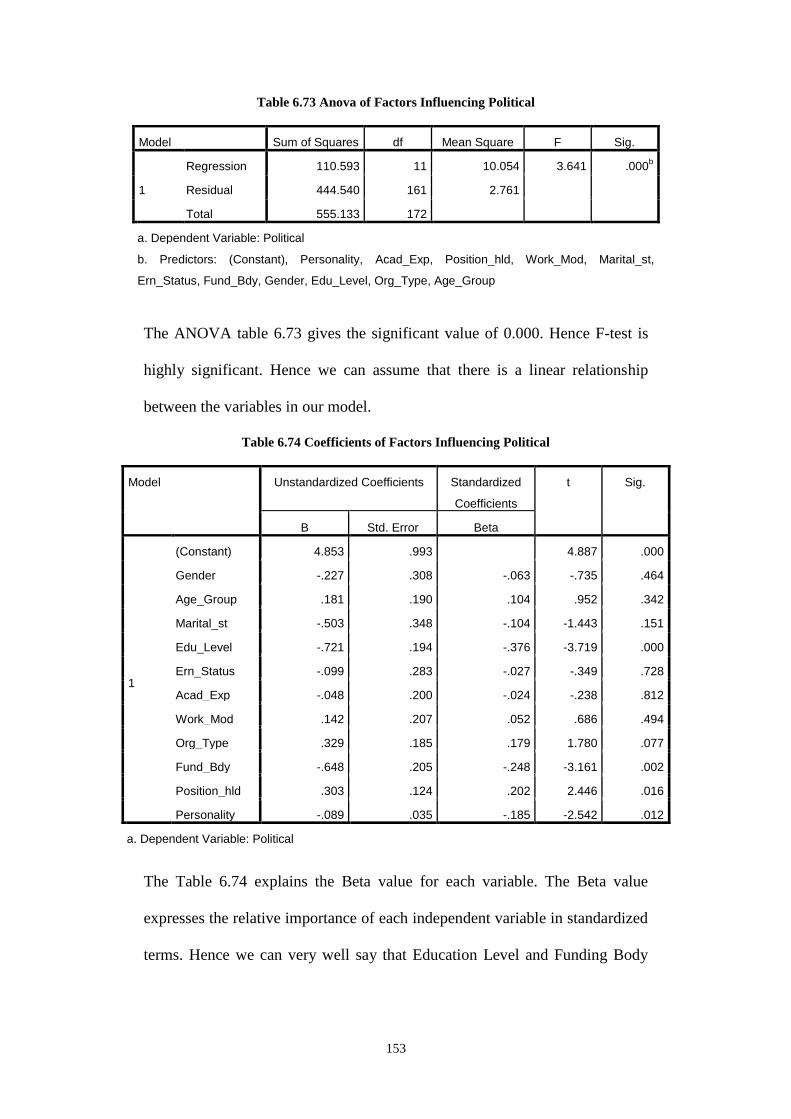
153
Table 6.73 Anova of Factors Influencing Political
Model Sum of Squares df Mean Square F Sig.
1
Regression 110.593 11 10.054 3.641 .000b
Residual 444.540 161 2.761
Total 555.133 172
a. Dependent Variable: Political
b. Predictors: (Constant), Personality, Acad_Exp, Position_hld, Work_Mod, Marital_st,
Ern_Status, Fund_Bdy, Gender, Edu_Level, Org_Type, Age_Group
The ANOVA table 6.73 gives the significant value of 0.000. Hence F-test is
highly significant. Hence we can assume that there is a linear relationship
between the variables in our model.
Table 6.74 Coefficients of Factors Influencing Political
Model Unstandardized Coefficients Standardized
Coefficients
t Sig.
B Std. Error Beta
1
(Constant) 4.853 .993 4.887 .000
Gender -.227 .308 -.063 -.735 .464
Age_Group .181 .190 .104 .952 .342
Marital_st -.503 .348 -.104 -1.443 .151
Edu_Level -.721 .194 -.376 -3.719 .000
Ern_Status -.099 .283 -.027 -.349 .728
Acad_Exp -.048 .200 -.024 -.238 .812
Work_Mod .142 .207 .052 .686 .494
Org_Type .329 .185 .179 1.780 .077
Fund_Bdy -.648 .205 -.248 -3.161 .002
Position_hld .303 .124 .202 2.446 .016
Personality -.089 .035 -.185 -2.542 .012
a. Dependent Variable: Political
The Table 6.74 explains the Beta value for each variable. The Beta value
expresses the relative importance of each independent variable in standardized
terms. Hence we can very well say that Education Level and Funding Body
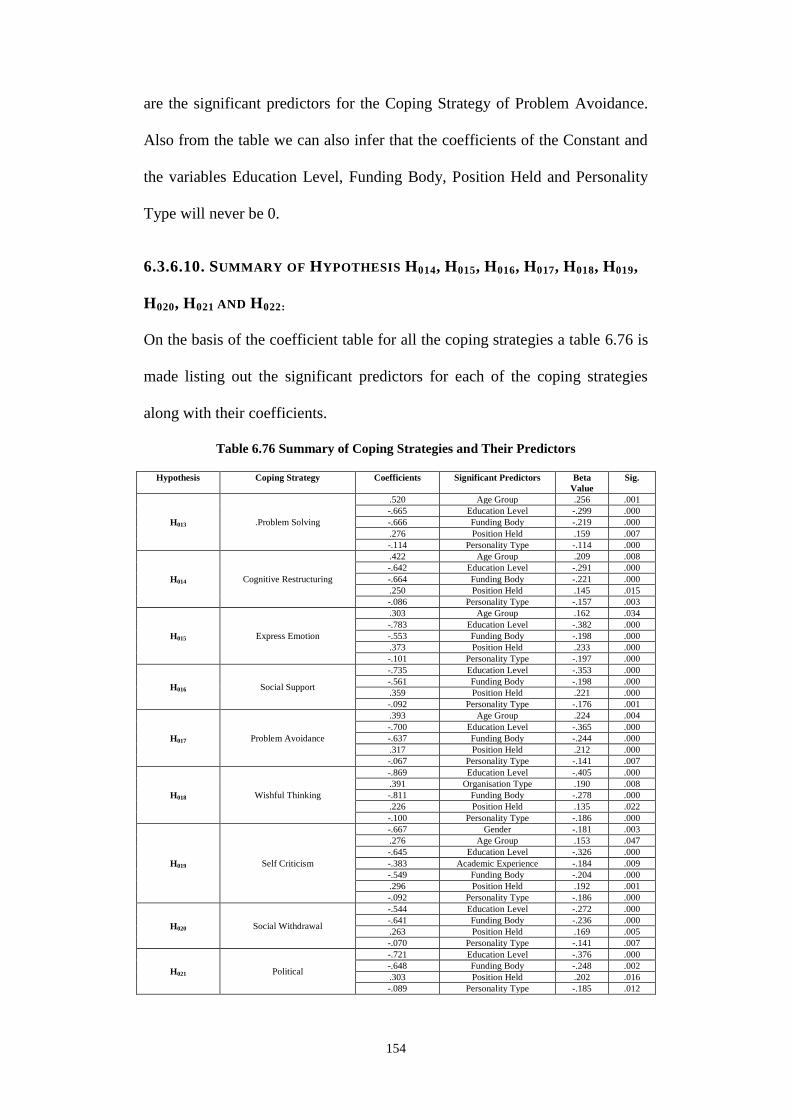
154
are the significant predictors for the Coping Strategy of Problem Avoidance.
Also from the table we can also infer that the coefficients of the Constant and
the variables Education Level, Funding Body, Position Held and Personality
Type will never be 0.
6.3.6.10. SUMMARY OF HYPOTHESIS H014, H015, H016, H017, H018, H019,
H020, H021 AND H022:
On the basis of the coefficient table for all the coping strategies a table 6.76 is
made listing out the significant predictors for each of the coping strategies
along with their coefficients.
Table 6.76 Summary of Coping Strategies and Their Predictors
Hypothesis Coping Strategy Coefficients Significant Predictors Beta
Value
Sig.
H013 .Problem Solving
.520 Age Group .256 .001
-.665 Education Level -.299 .000
-.666 Funding Body -.219 .000
.276 Position Held .159 .007
-.114 Personality Type -.114 .000
H014 Cognitive Restructuring
.422 Age Group .209 .008
-.642 Education Level -.291 .000
-.664 Funding Body -.221 .000
.250 Position Held .145 .015
-.086 Personality Type -.157 .003
H015 Express Emotion
.303 Age Group .162 .034
-.783 Education Level -.382 .000
-.553 Funding Body -.198 .000
.373 Position Held .233 .000
-.101 Personality Type -.197 .000
H016 Social Support
-.735 Education Level -.353 .000
-.561 Funding Body -.198 .000
.359 Position Held .221 .000
-.092 Personality Type -.176 .001
H017 Problem Avoidance
.393 Age Group .224 .004
-.700 Education Level -.365 .000
-.637 Funding Body -.244 .000
.317 Position Held .212 .000
-.067 Personality Type -.141 .007
H018 Wishful Thinking
-.869 Education Level -.405 .000
.391 Organisation Type .190 .008
-.811 Funding Body -.278 .000
.226 Position Held .135 .022
-.100 Personality Type -.186 .000
H019 Self Criticism
-.667 Gender -.181 .003
.276 Age Group .153 .047
-.645 Education Level -.326 .000
-.383 Academic Experience -.184 .009
-.549 Funding Body -.204 .000
.296 Position Held .192 .001
-.092 Personality Type -.186 .000
H020 Social Withdrawal
-.544 Education Level -.272 .000
-.641 Funding Body -.236 .000
.263 Position Held .169 .005
-.070 Personality Type -.141 .007
H021 Political
-.721 Education Level -.376 .000
-.648 Funding Body -.248 .002
.303 Position Held .202 .016
-.089 Personality Type -.185 .012
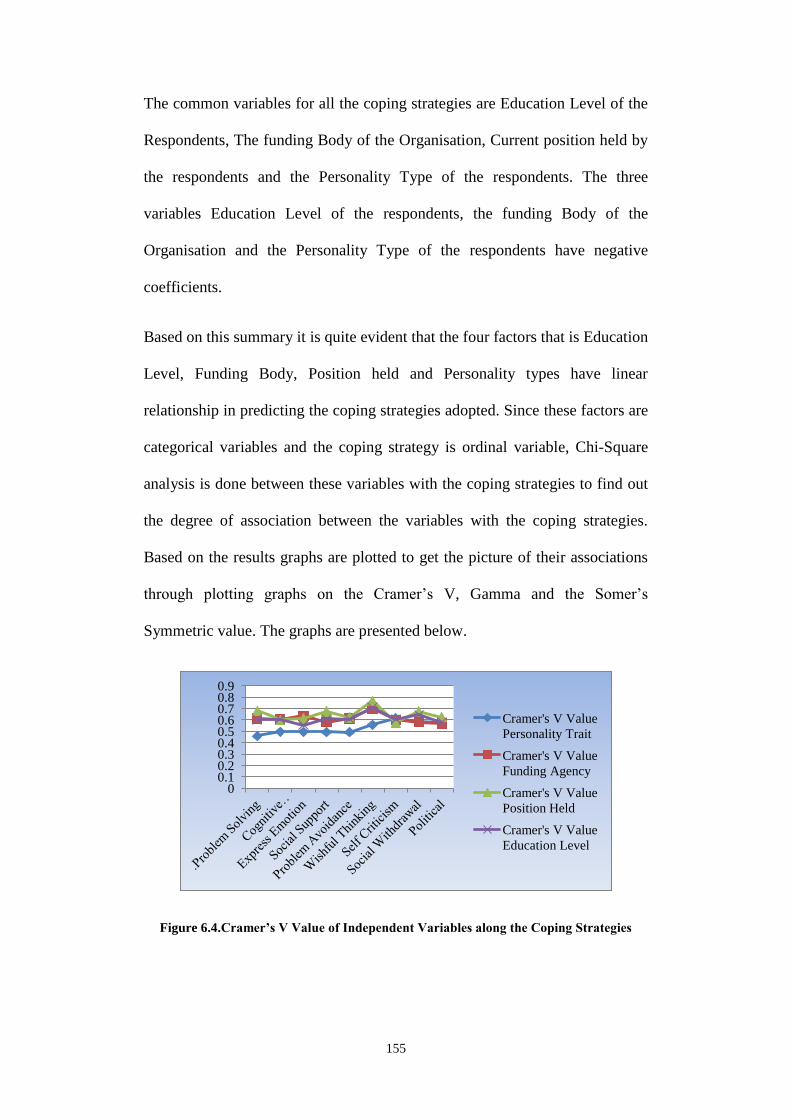
155
The common variables for all the coping strategies are Education Level of the
Respondents, The funding Body of the Organisation, Current position held by
the respondents and the Personality Type of the respondents. The three
variables Education Level of the respondents, the funding Body of the
Organisation and the Personality Type of the respondents have negative
coefficients.
Based on this summary it is quite evident that the four factors that is Education
Level, Funding Body, Position held and Personality types have linear
relationship in predicting the coping strategies adopted. Since these factors are
categorical variables and the coping strategy is ordinal variable, Chi-Square
analysis is done between these variables with the coping strategies to find out
the degree of association between the variables with the coping strategies.
Based on the results graphs are plotted to get the picture of their associations
through plotting graphs on the Cramer’s V, Gamma and the Somer’s
Symmetric value. The graphs are presented below.
Figure 6.4.Cramer’s V Value of Independent Variables along the Coping Strategies
0 0.1 0.2 0.3 0.4 0.5 0.6 0.7 0.8 0.9
Cramer's V Value
Personality Trait
Cramer's V Value
Funding Agency
Cramer's V Value
Position Held
Cramer's V Value
Education Level
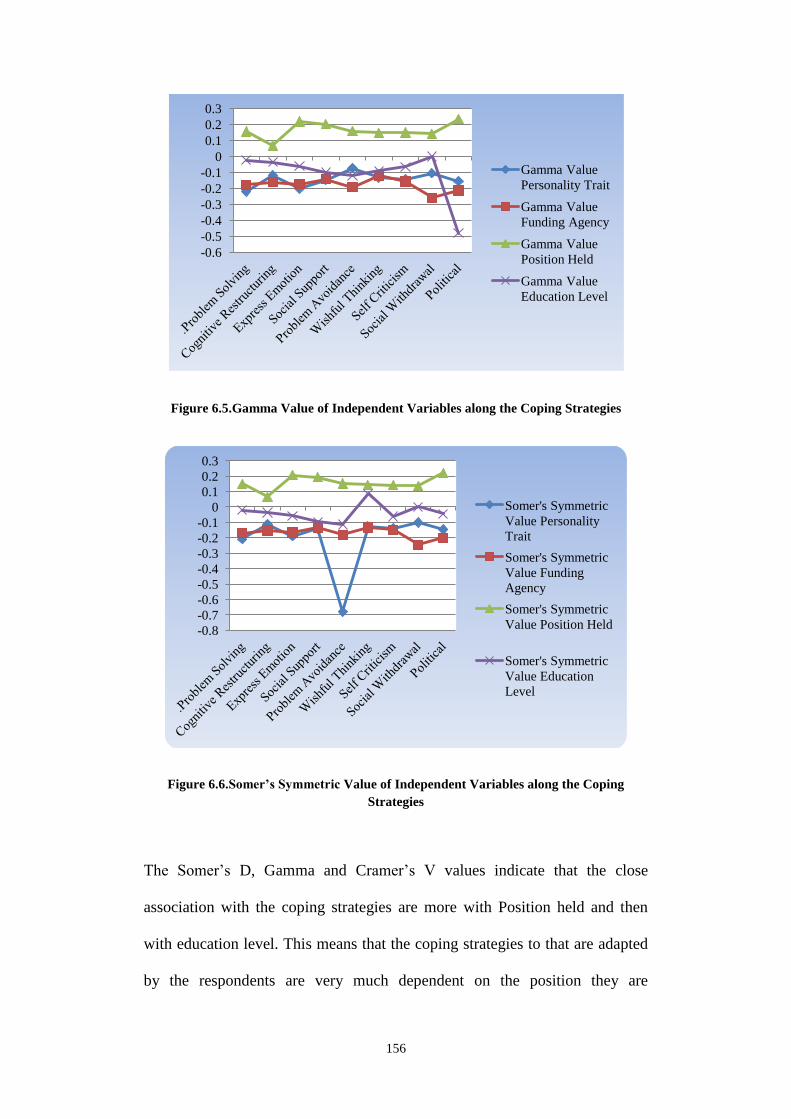
156
Figure 6.5.Gamma Value of Independent Variables along the Coping Strategies
Figure 6.6.Somer’s Symmetric Value of Independent Variables along the Coping
Strategies
The Somer’s D, Gamma and Cramer’s V values indicate that the close
association with the coping strategies are more with Position held and then
with education level. This means that the coping strategies to that are adapted
by the respondents are very much dependent on the position they are
-0.6
-0.5
-0.4
-0.3
-0.2
-0.1
0
0.1
0.2
0.3
Gamma Value
Personality Trait
Gamma Value
Funding Agency
Gamma Value
Position Held
Gamma Value
Education Level
-0.8
-0.7
-0.6
-0.5
-0.4
-0.3
-0.2
-0.1
0
0.1
0.2
0.3
Somer's Symmetric
Value Personality
Trait
Somer's Symmetric
Value Funding
Agency
Somer's Symmetric
Value Position Held
Somer's Symmetric
Value Education
Level
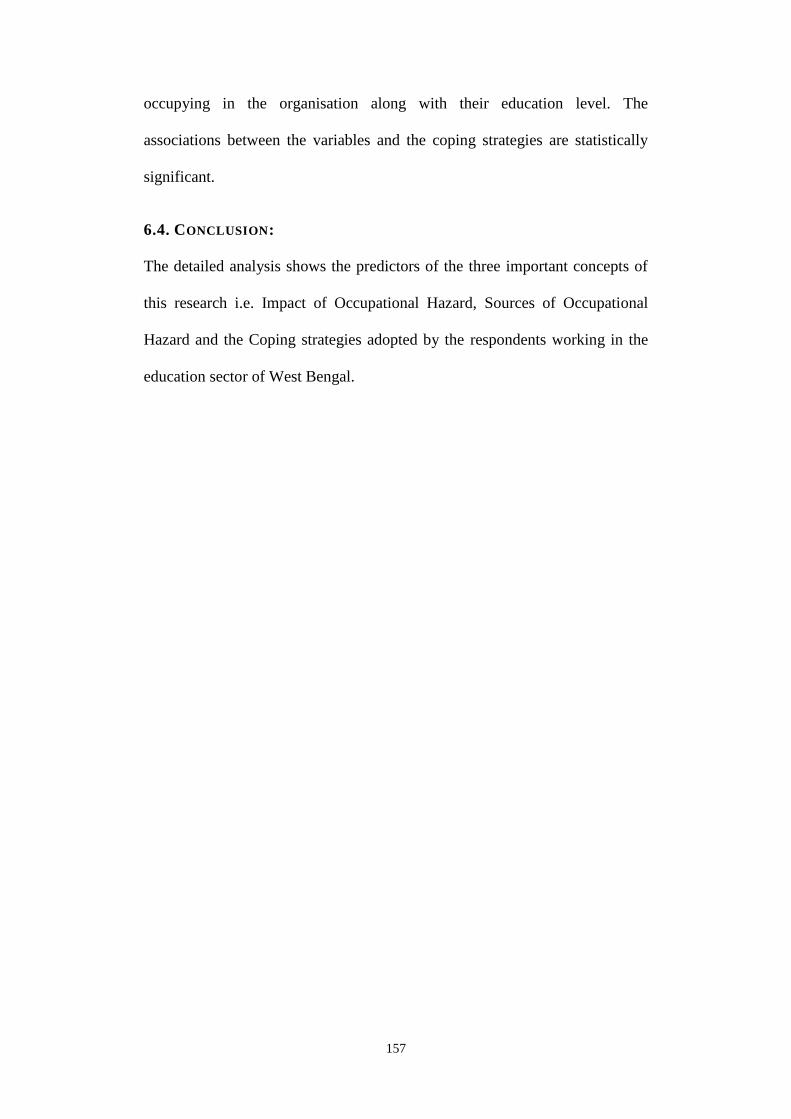
157
occupying in the organisation along with their education level. The
associations between the variables and the coping strategies are statistically
significant.
6.4. CONCLUSION:
The detailed analysis shows the predictors of the three important concepts of
this research i.e. Impact of Occupational Hazard, Sources of Occupational
Hazard and the Coping strategies adopted by the respondents working in the
education sector of West Bengal.
158
CHAPTER – 7
7. CONCLUSION AND RECOMMENDATION
7.1. FINDINGS:
The findings of this research are divided into qualitative data analysis findings
and quantitative data analysis findings.
7.1.1. QUALITATIVE DATA ANALYSIS FINDINGS:
The first research question was about the existence to the hazard among the
employees of the education sector. On the basis of the in-depth interview it is
very clear that the employees working in the education sector of West Bengal
are not free from the perils of dangers in the occupation. Though the
maximum employees speak of the common hazard like occupational stress,
still the other hazards are Burnout, Musculo-Skeletal Disorder, and False
Accusation. It was also found that the musculo-skeletal disorder was found
more in primary and secondary schools of West Bengal which are mostly run
by the government of West Bengal. The reason for the musculo-skeletal
disorder is due to very poor infrastructure and resources provided for teaching.
Since the change of the political power in West Bengal the violence in
college/university campus has increased to a considerable number.
159
(Chattopadhyay, Campus Violence In Educational Institution: An Experience
(With Reference To West Bengal), 2013), There are number of occasions
when teachers and principals are beaten to the extent that it led them to lose
their life.
The second research question was to know what could be the factors of the
hazards. The sources of these hazards as perceived by the employees working
in the education sector are due to no proper organisational or governmental
policies. The management culture or the work culture is also not very
amicable and comfortable. These factors also aggravate the hazards. Another
main source of the hazard is the job itself. Today the job descriptions of the
employees who are working in the education sector are very much different
from what it was earlier. The jobs are not just limited to academics like
teaching, evaluating, assessing and managing the classes. They have to
perform non-teaching jobs also like clerical jobs of recording the data and
maintenance of data, they have to participate in the school/college reviews,
they have to undergo continuous professional development like participating
in seminars, writing articles for publications apart from their current
educational qualification they have to go for continuous up gradation in their
qualifications. They also have to satisfy their stakeholders like their
authorities, management, students, guardians, approving bodies and
government agencies. They have to handle administrative duties when they are
in the positions of head of the institution, department heads and manage all
resources like library, computer or science laboratories etc. They are even
entrusted with the responsibility of maintaining student discipline, train and
160
mentor the students in different skills and sports. They also have to maintain a
cordial relation with the guardians of the students and also accompany
students in field visits and other trips. All these activities not only eat into their
time but also keep them into high pressures both physically as well as
mentally. This creates lots of stress in an individual. Moreover in West Bengal
campus violence is quite a common phenomenon. The sources for the campus
violence can be attributed to many reasons. Researchers have identified many
determinants like student teacher relation, campus culture, policies of the
organisation in terms of law enforcement and discipline, etc. The source for
false accusations could be attributed to organisational politics, difficult teacher
– parent relationships etc. Apart from the above mentioned sources the other
sources are stakeholder related concepts and task related concepts. The
stakeholder related concepts are stakeholder multiplicity, stakeholder
complexity, and stakeholder interface and stakeholder administration. The task
related concepts are task complexity, task ambiguity and task description.
To the question how these hazards have impacted the majority of the
respondents answered that they had to take the help of medication due to the
stress that incurred in their jobs. Many respondents also complained of
sleeplessness, boredom and also losing interest in their jobs. Few respondents
also complained of the damage that occurred in the relationship with their
colleagues. Few respondents also pointed out on not being able to balance
between their work life and their home life.
The next research question was to how to cope with these hazards. To this the
respondents had a view of adopting multiple coping strategies based on the
161
phases of the hazards. According to the respondents in the initial phase of the
hazard they normally adopted emotion focused strategy or avoidance
strategies. Some respondents even tried the self-criticism strategies. Few of
them tried to adopt humour strategies to decrease the intensity of the hazard.
But as the intensity of the hazard starts increasing some respondents tend to
lose their patience. This made them adopt the confronting strategies. In spite
of adopting these strategies if the hazard gets aggravated respondents
complained of lot of health related problems like losing appetite,
sleeplessness, nightmares, headaches and fatigues. In this phase of the hazard
most respondents spoke of social support as the common coping mechanism
adopted by them. They even tried to adopt problem focused strategy like
seeking support of their higher authorities, management, supervisors and
colleagues. When the impact of the hazard was extensive and respondents felt
totally helpless and unable to cope with the hazard they tried to adopt the
withdrawal strategy or attacking strategy. The withdrawal strategy was in the
form of taking more of sick leaves, avoiding few tasks, coming late to
workplace or intentionally leaving early. When none of the strategies worked
then the respondents aimed to end the hazard by quitting like resigning,
requesting for transfer to different location, department or branch.
The final research question was to analyse the factors that influence the
employees to adopt a coping strategy. To this all the respondents answered
that their personality and their experience helped them to adopt any particular
strategy.
162
Based on the findings from qualitative analysis we can form the following
theories:
1. Stake holder related concepts, task related concepts, organisational
policies, organisational culture, management issues, job related
variables like job profile, job security etc,, relationship with
parents, student handling and control process all contribute to
escalate the occupational hazards among the employees of the
education sector of West Bengal.
2. The hazards impact the employees both physically and mentally.
Physically by causing damage to their health and body and
mentally by making them to loose interest in their jobs, causing
boredom and fatigue impacting their performance and quality of
work life.
3. To cope with these hazards the employees adopt various strategies
like emotion focused, problem focused, self criticism, social
withdrawal , seeking support and if they can’t cope then they exit
either by resigning or re-locating themselves from the place of
hazard.
4. To adopt any coping mechanism the employee’s personality trait
and their experience in their jobs influences a lot.
7.1.2. QUANTITATIVE DATA ANALYSIS FINDINGS:
The theories formed from the findings of the qualitative phase are tested
through the help of a questionnaire and collecting primary data with his
163
questionnaire. Initially the impact of occupational hazard was analysed with
the demographic variables like gender, age group, marital status, educational
level and earning status. On analysis with these variables the following
findings were obtained:
1. The impact of occupational hazard is not significantly different for male or
female employees. It means that the impact is same as to making them
exhausted sleepless, losing appetite and sometimes even have to take the
help of medicines.
2. When it comes to the various age groups it has been confirmed that the
impact has a significant difference when the employees belong to different
age groups. The employees belonging to higher age groups are impacted
by the hazards more than those belonging to lower age groups. This could
be because of high commitments to the job as well as family that
employees get stressed or exhausted soon.
3. The marital status has no influence when it comes to the impact of the
hazards on the respondents. It means that whether an employee is married
or not married makes no difference in the impact of the hazard.
4. In the case of the educational level of the respondents it was found from
the data that the higher the education level the higher is the impact. This
could be because that education has the potential to change the
expectations, beliefs and behaviours. Few literatures also support this
concept. (Feinstein, 2005). Hence higher expectations lead to higher
impacts of hazards.
164
5. When the earning status of the employees with respect to whether they
were the sole earners or shared earners was analysed in context to impact
of occupational hazard it was found from the data that there was a
significant difference in the impact of the hazard on the individual with
respect to their earning status. It was found that the impact was quite
higher for respondents who were sole earners. Where as in case of shared
earners the impact was less. This could be because of the financial security
of the respondents who were shared earners. Because of the existence of a
partner who is also contributing to the financial needs of the family the
respondents can have to some extent a carefree attitude enabling them to
avoid all critical situations or exit for such unpleasant environment.
The impact of the occupational hazard after being analysed with the
demographic variable were analysed with organisational variables like
academic experience, mode of working, type or category of the organisation in
which the respondents are working, the type of funding mode of the
organisation, and also the position held by the respondents in their
organisation. The findings obtained by this analysis are as follows:-
1. The analysis showed that the impact of the hazard has significant
difference among the respondents with different groups of employee
with different academic experiences. The higher the academic
experience the higher is the impact. This could be because more
responsibilities are entrusted to employees with higher academic
experience. The greater the responsibilities the greater is the potential
for the hazards and hence the impact.
165
2. The analysis of the impact of occupational hazard with respect to the
working mode of the employees revealed a significant difference in
case of employees who are permanently employed and who are
temporarily employed. It has been found from the data that the
employees who are permanently employed are having high potential of
impact compared to temporary employees. As the temporary
employees are quite free to avoid the unpleasant situations in their jobs
either by changing the organisation or by remaining away from the
situation.
3. The analysis or the impact of the hazard with respect to the
organisation type revealed that there is significant difference in the
impact of the hazard of different organisation categories. In West
Bengal the hazard is near to negligible in case of primary schools and
secondary schools. This could be because the employees of these
categories of organisations do not perceive of any hazards as they are
more comfortable working here because of leave policies and financial
security. The responsibilities are also not much as the whole system is
controlled by the government policies. Where as though the same
facilities are present in colleges and universities, employees of these
types of organisations are loaded with lots of responsibilities. Today
Professors, Associate Professors and Assistant professors are entrusted
with clerical duties like maintenance of attendance records, Defaulter’s
list, evaluation data, assessment data etc, administrative work, social
work, counseling, mentoring, participation in conferences and
workshops, paper publications, paper corrections, handling
166
examinations, working with students in their projects and also in
private colleges additional responsibility is given to the professors to
get students a type of marketing job also. Targets are there for all these
activities and pressure is also given on them for these activities.
4. The data analysis has also revealed a significant difference in the
impact of the hazard based on the funding agency of the organisations.
In West Bengal there are both private and public players in the
organisations belonging to the educational sector. The school is run by
both state government and private organisations. Even in case of
universities in West Bengal there are universities run by state
government, private universities, deemed universities and also one
university run by the central government. Hence the impacts of the
hazards are different for organisations run by state government or
private organisations.
5. There is significant difference in the means of the Impact of
Occupational Hazards among the respondents working in different
Positions in the Organisations. The data analysis in this perspective
revealed that higher the positions occupied are more prone to the
hazard and hence the impact is also high. It is quite evident that
employees who occupy higher positions in the organisations have more
responsibilities and commitments to their jobs. Hence more the
responsibility more prone to hazards likes stress and burnouts.
One more important finding that was observed from this study is that the
personality trait that emerged as maximum number among the respondents is
167
ESTJ. As per the definition of the personality traits from Annexure- IV ESTJ
means Extraverted Thinking Sensing and Judging. Robert Heyward suggests
in his personality page that ESTJ’s primary mode of living is focused
externally where they deal with issues rationally and logically. Their
secondary mode is internal where they take things via five senses in literal and
concrete fashion. These people live in a world of facts and concrete needs.
They have a clear set of standard beliefs. They are extremely talented at
devising systems and plans for actions. They are self confident and aggressive.
They are usually considered as model citizen and pillars of the community.
The weaknesses of this trait are:-
1. Tendency to believe that they are always right.
2. Tendency to need to always be in charge.
3. Tendency to be materialistic and status conscious
4. Generally uncomfortable with change and moving into new territories.
5. Not naturally in tune with what others are feeling.
The next emerging personality trait is ISTJ. ISTJ as per Annexure - IV means
Introverted Sensing Thinking Judging. ISTJ’s are quiet and reserved
individuals who are interested in security and peaceful living. They are very
loyal, faithful and dependent. They believe in laws and traditions and insist on
doing things “by the book”. The weaknesses of this trait are:-
1. Tendency to believe they are always right.
2. Tendency to get involved in win-lose conversation.
3. Not naturally in tune with what others are feeling.
4. Their value for structure may seem rigid for others.
168
Various researchers have suggested that the careers chosen by people
belonging to ESTJ personality types are law, human resources, and training,
nursing, management, project management and administration. Careers chosen
by most of people with personality traits of ISTJ are medical, science,
engineering, analysis, accountancy, academia, law, computing, and project
management.
On analysis of the demographic variables and organisation variable the
analysis focuses on the sources of the hazards. Three groups of sources were
identified. They are individual and organisational sources, stakeholder related
sources and task related sources.
The research started with 13 variables of individual and organisational
sources, 24 variables of stakeholder related sources and 7 variables of task
related sources. On applying correlation among these variables it was found
that there was multi-co linearity problem among the variables. So to reduce
the variables factor analysis was done. The factor analysis reduced individual
and organisational variables into 4 factors, stakeholder related variables into 6
factors and task related variables into 3 factors. So the research identified 7 +
4 + 3 = 14 factors as sources of the hazards in the education sector of West
Bengal. These 14 factors are entity interface, work structure, work
environment, policies, and transparency in organisation, stakeholder
administrative issues, stakeholder interface, stakeholder policies, student
control, parent control, task control, task density and task conflict.
These 14 factors were then analysed using a linear regression model. The
model derived the significant sources for the hazards as Task Conflict, Task
169
Control, Student Control, Stakeholder Interface, Transparency in Organisation
and Work Environment. Hence these sources have a great role to play in either
escalation or de-escalation of the hazards.
Let us examine the factors individually to enhance the understanding of how
the sources are very significant in their influence in creating the potential to
the occupational hazards.
The first factor that was highly significant in escalating the occupational
hazard is task conflict. It is quite evident from the study that the employees of
the education sector of West Bengal are involved in multiple and yet diverse
tasks. There is always a probability as to the expectations and demands of each
task. Many times it is seen the objective of one task is conflicting with the
other task. For example today in most private organisations in the education
sector apart from teaching which being the core task of any teachers they are
entrusted with tasks like marketing or placement. Where the performance is
monitored based on their numbers of achievements. To increase the number of
admissions they are compelled to compromise on quality of the students. This
conflicts with their objective of training students for good academic results
and also in various skills. This conflict issues in their task creates hazards like
student aggression, stress, false accusation etc.
The second factor that emerged from the study as significant in predicting
occupational hazard is task control. It is quite clear from the definition of task
control that an employee can achieve the best performance when he or she
possesses all the necessary competencies and tools to do the job. In most of
the cases it is not so when it comes to the recruitments in West Bengal
170
education sector. Most of the recruitments happen to those candidates who
have political affiliations with the ruling party (Primary Teachers Recruitment
Scam in West Bengal, 2016). Their ability and competencies are not tested.
Hence the task control becomes a major factor in creating occupational
hazards in the education sector of West Bengal.
The third predictor that emerged as a significant source for the occupational
hazard is the student control. It is a very common scenario in West Bengal
where we find students becoming aggressive to the extent that they even
manhandle the school headmaster and ransack his office (Banerjie, 2015).
These incidents lead to campus violence and also become serious hazards to
the employees of those organisations.
The fourth significant predictor of the occupational hazard in West Bengal is
the stakeholder interface. The organisations belonging to the education sector
has a number of stakeholders. These are people or organisations with a stake
or interest in education. A category of stakeholders are those who have
immediate and direct interest in education. This group consists of students,
parents, educators, and governing bodies, potential employees etc. Each of
these stakeholders has different interests and expectations. To meet these
expectation and do the job smoothly becomes quite challenging to the
employees and hence is exposed to various types of hazards.
The fifth significant predictor for occupational hazard is transparency in the
organisation. It is known to all and also supported by many researchers that
transparency is a key to performance both of the organisation and also its
employees nicely coined by David Gebler in his blog business ethics, culture
171
and performance in 2011. Transparency in organisation implies visibility into
the functions of the organisation to its stakeholders. Today organisations can
use the new information technologies to increase the transparency in the
organisation. In spite of this to increase transparency the management and the
employees require to change their existing behavior and practices which
threatens people of their security. Absence of transparency can lead to
duplicate work, bad decision making and inability to innovate. Hence absence
of transparency has a high probability to increase the occupational hazards of
the employees of the organisations.
The sixth significant predictor of the occupational hazards in an organisation
is its work environment. Many researchers have supported the fact that an
unhealthy work environment creates more stress and lowers employees well
being. If the work environment is not supportive it can lead to increased
absenteeism, withdrawal behavior, conflict, strain and greater risk of
accidents, incidents and injuries. The most adequate work environment is
having trust, honesty and fairness.
After the analysis of occupational hazard and the sources of the occupational
hazard we now focus on the coping strategies adopted by the personnel to
cope with the hazards. A very interesting finding in this case is that the coping
strategies that are adopted by the individual to cope with the occupational
hazard are a combination of multiple coping strategies. As per the theory of
Niedl (1996), Zapf and Gross (2001) the individuals adopt avoidance
strategies in the beginning of the hazards. But the finding of this study says
that most of the individuals adopt to the problem focused strategies. As per the
172
descriptive statistics the coping strategies with the highest to the lowest means
are in the order of Problem solving, Cognitive restructuring, Social support,
Express emotion, Wishful thinking, Social withdrawal, Problem avoidance,
Political and Self Criticism respectively. Coping strategies are basically a
conscious effort to solve problems of both personal and inter-personal nature
to overcome, minimize or tolerate any hazards like stress or conflict. As per
various researches the two main types of coping strategies are emotion
focused and problem focused coping.
The emotion focused coping changes a person’s emotional response to
stressor’s. Emotion focused coping techniques are focused on reducing the
negative emotional responses, an individual might experience because of
stressors. Normally the type of behavior visible in the case of emotion focused
coping strategies is letting off steam by venting to friends and family, Keeping
busy to keep the mind away from the stressors, Seeking encouragement, moral
support, sympathy and understanding from others, turning to rigorous
activities like sports to distract attention from stressors etc. People are more
likely to adopt emotion focused coping when they don’t think their actions can
affect the stressor itself, so they alter their response to the stressor. Coping
strategies belonging to the group of emotion focused strategies include
Express emotion, Social Support, Self Criticism and Social Withdrawal.
The problem focused coping strategy is about trying to deal with the stressor
itself so as to avoid the stress response it is causing. Problem focused coping
involves finding practical ways to deal with stressful situations. Some
behaviours administered by individuals who adopt this coping strategy include
173
put other activities on hold in order to concentrate and cope with the stressor,
Actively try to remove or work around the stressor, Wait to act until the
appropriate time, Seek concrete advice, assistance and information etc. This
coping method is more common when individuals believe that the action can
affect the stressor. Coping strategies belonging to the group of problem
focused strategies include Problem solving, Cognitive Restructuring, Problem
avoidance, Wishful thinking and Political.
After understanding the coping strategies adopted by the individuals the next
analysis was to find the demographic and organisational factors which are
influencing the employee to adopt the particular coping strategy.
On analysis of the demographic variables with the coping strategies it was
found that the variables like gender, age group and educational level of the
employees are significantly associated with the coping strategies. To analyse
individually gender is significantly associated with the coping strategy of self
criticism only. Age group of the employees is significantly associated with
coping strategies like problem solving, cognitive restructuring, express
emotion, problem avoidance and self criticism. Educational level is
significantly associated with all the nine coping strategies. Hence we can say
that the factors which enable an individual to adopt a particular coping
strategy are employee’s age and their educational level. Many relations
between personality and coping were stronger in older samples.
On analysis of Organisational variable with coping strategies it was found that
the variables like organisation type, the funding agency of the organisation and
the position held by the employees are significantly associated with the coping
174
strategy adopted by them. Out of these three variables the organisation type is
significantly associated with only one coping strategy that is wishful thinking.
The other two variables like funding agency of the organisation and the
position held by the individual is significantly associated with all the nine
coping strategies.
Many researchers have supported the theory that individuals who were post
graduates, individuals who were in the position of head of the department or
organisation and individuals with greater work experience adopted the
problem focused coping strategies to a greater extent. Another research also
stressed on the fact that the female employees adopted emotion focused
strategies to a greater extent.
The study also revealed that the personality trait of an individual has a greater
influence in the adoption of the coping strategy by the individual. Personality
influences coping in many ways. Even prior to coping, personality influences
the frequency of exposure to hazards and also the type of hazards experiences.
We have from theories that neuroticism predicts exposure to interpersonal
stress and tendencies to appraise events as highly threatening.
7.2. CONCLUSIONS
The research can be concluded by revisiting the objectives of the research and
finding out whether the research has fulfilled these objectives.
The first objective of the research was to provide the discussion on
occupational hazards faced by the employees working in white collar jobs in
175
the educational sector in West Bengal. To this there was in-depth interview
taken with ten different employees working in different positions in different
organisations. The discussion resulted in highlighting few of the hazards like
burnouts, campus violence, stress and false accusations. Among them majority
spoke of burnout. According to the respondents the cause for the burnouts was
due to job overload, meeting expectations of management and peers, students
and their guardian’s etc. The respondents working in schools spoke of
musckulo-skeletal disorders (MSD) due to the board work and furniture’s used
in the schools.
The second objective was to review and summarize the impacts of these
occupational hazards on the employees. The research results showed that the
highest impact was on health and they had to take medicines for hypertensions
etc. Most of the people complained of sleeplessness, exhaustion, and boredom
and losing interest in the job. Few of them also complained that such
unpleasant situations have damaged their relationships with their colleagues.
According to self reporting the employees spoke of difficulties in maintaining
work – home balance.
The third objective was to identify the factors causing occupational hazards to
the employees working in education sector. According to the in-depth
interview of the respondents and their perception of the factors causing the
hazards are grouped into three categories. They are general factors,
stakeholder related concepts and task related concepts. The factors belonging
to the group of general categories are organisational policies, management
issues, job profile, job security, organisational politics, student handling,
176
parents and outsiders interactions. The outsiders are political parties,
community etc. The factors belonging to the stakeholder concepts are
stakeholder multiplicity, interface, complexity, administration and operating
paradigm. The task related concepts involve factors like task ambiguity, task
complexity, task description and task control.
The fourth objective is to identify and prioritise the sources of these hazards.
According to the study result it was found that the most significant sources of
the hazards are task conflict, task control, and student control, stakeholder
interface and campus culture. Among these the highest in priority is in the
order is stakeholder interface, task conflict, student control, task control and
campus culture.
The fifth objective was to analyse the coping strategies adopted by the
employees of education sector. The study showed that the major and common
coping strategies that are adopted by the employees of education sector were
problem solving, cognitive restructuring, social support and express emotion.
Though it was found from the study that an individual uses a combination of
coping strategies to cope with unpleasant situations in their work, but few
strategies that were mentioned above were commonly used by most of the
employees to cope with their problems.
The sixth objective was to analyse the factors influencing the coping strategy.
The qualitative analysis revealed that personality trait and experience in this
sector has a major influence on the coping strategies. The quantitative analysis
revealed that personality trait if the employee, funding agency of the
organisation, position held by the employee in the current organisation and
177
education level of the employee are the important and major factors
influencing the employees selection of coping strategies to cope with any
unpleasant situation.
These findings may have some important implications regarding the
interventions in the hazards at work. Accordingly, the organisation as a whole
needs to be aware of the consequences of occupational hazards and
confronting these hazards within a problem-focused framework. Therefore
training managers, supervisors and employees should identify the pattern of
the hazards and help to stop the destructive behavior of the respondents being
the stakeholders of these hazards.
Furthermore, by developing preventive programmes at the organisational level
and by establishing effective and safe grievance procedure organisations can
intervene to prevent or mitigate the impact of occupational hazards.
The results point to the need of Government policies targeting specifically to
towards the employees working in the education sector if there has to be
tangible improvements in the quality of education in West Bengal.
7.3. RECOMMENDATIONS:
On the basis of my research results the following recommendations can be
made:-
1. The research report highlights the major personality type the
employee’s posses in the education sector. This information can be
used to recruit the employees in this sector.
178
2. The report also investigates the different occupational hazards and its
impacts on the employees facing them. This information can be used in
induction training programmes to make the new recruits aware of the
problems and consecutive solutions.
3. The research report also prioritises the different sources which could
predict the occupational hazards. This information can be used to de-
escalate the impacts of the occupational hazard.
4. The knowledge of health hazards mentioned in this report could help
the policy makers to focus on the health and safety issues of the
employees working in this sector.
5. The report also brings out the information of various coping strategies
adopted by the employees in education sector. This could be further
analysed and used for training the employees to overcome the
unpleasant situations experienced in their job making them more
successful in the tasks they are to perform.
7.4. CONTRIBUTIONS:
To sum up the present research contributes to the occupational hazard in
education sector researches by describing the process of occupational hazards
in which the employees coping strategies to these hazards are analysed. This
research reports the existence of different hazards in the education sector and
also its impacts on different employees are different. The research also
identifies that the variable which influence the adoptions of coping strategies.
Employees can be trained in adopting specific coping strategies for specific
179
hazards to become successful in their career. This research report also
contributes the knowledge of important sources of the identified hazards. This
knowledge will help the policy makers to make policies for the well being of
the academic employees. Education sector being one of the service sectors,
this research can give direction to analyse the other hazards of the service
industry and what could be the possible coping strategies to make the
employees successful in their jobs.
7.5. LIMITATIONS:
The limitations of this research are:
1. Self-reporting on survey questions was dependent on the participation
and honesty of the respondents.
2. The willingness of interviewees to share truthful information may have
been limited by current employment status within the institution.
3. Maslach et al. (1996) recommend that subjects should not be sensitized
to the topic of occupational hazard since it may influence their
responses. However, to ensure transparency, participants were made
aware of the nature of this study.
4. Although the sample size is comparable to most of the studies, where
the population is above fifty thousand, still it is relatively small to give
a clear picture of all the categories of educational institutions.
5. Nearly 50% of the sample is represented by the employees working in
universities. Hence it would not be appropriate to generalize the study
across all other educational institution categories.
180
6. The potential risk of response bias could be another limitation. Since
the exploration of interaction between coping strategies and
occupational hazard process mainly depends on respondent’s
perception, feelings and reactions.
7. Focusing on the education sector only one personality trait that is ESTJ
has emerged as a major personality trait occupying more than 50% of
the sample. Hence any analysis or co-relation with personality traits
cannot be generalized.
8. Using the MBTI instrument to study the personality type of the
respondent belonging to West Bengal poses several difficulties like:
a. The MBTI was developed keeping the western culture in mind
which might not align with the West Bengal culture, hence
creating difficulty to the respondent to respond.
b. The questions being presented in English language most of the
respondents belonging to primary and upper primary schools of
West Bengal have problems in understanding and
comprehending the actual meaning of the questions.
9. The instrument for securing data being English large portion of the
population of this research could not be approached as the majority of
the population in West Bengal finds it difficult to apprehend and
understand the questions to respond to the instrument.
10. Transforming qualitative research to quantitative form made the
questionnaire very detailed and lengthy making the respondents
fatigued and losing interest while responding. This resulted in more
number of non-response and partially filled questionnaire.
181
11. Awareness of the idea of hazards and its remedies are so less as too
many respondents perceive of no hazards in this profession. As a result
there was a loss of rich data.
12. Personality does not constitute one trait at a time. Similarly hazard
exposure and responses to hazards are influence not by one trait at a
time but by all of personality at once.
13. Cumulative character of the hazard develops the impact of the hazard
very slowly and after a period of time. Hence many respondents’
responses were not the exact impacts.
7.6. SCOPE FOR FUTURE RESEARCH:
The quest for knowledge, solutions to problems and research questions leading
to improved quality of life is synonymous with progress of human civilization.
Whereas the current research provided answers to the research questions, it
also highlighted its limitations in the previous section. This section provides
brief directions for future researchers to pursue, in the domain of occupational
hazards and coping strategies of the employees working in the service sector.
I. Future studies can be done by increasing the sample size of all the
other categories of organisations belonging to the education sector to
have an extensive understanding of the coping strategies and the
occupational hazards.
II. Future research should explore joint and interactive impacts of
multiple coping responses.
182
III. Future research can improve generalisability of the findings of this
research by extending this study to include the following:
a. comparing rural and urban areas for occupational hazards
b. other geographies like different states
IV. Further research can be done on identifying the relation of personality
types with the adoption of coping strategies including other
instruments for measuring personality and coping strategies like:
a. The 'Big Five' Factors i.e. the BFQ instrument
b. Katherine Benziger's personality and brain-type theory
V. Future researchers are invited to enrich the research work by finding
the relation of adoption of coping strategy to consequences faced
directly linked to performance attributes.
VI. Time period of research being limited only for two years, future
research can be done on seeing the escalation or de-escalation of the
impact of occupational hazard over the period of the service tenure.
VII. Future research of similar type can be extended to other service sectors
like: Hospitals, Hotels, Banks, IT services etc.
VIII. Recommendations are presented for future research can expand on the
growing understanding of how personality and coping shape
adjustments to hazards.
IX. Despite hundreds of studies the influence of personality and coping is
only partly understood. Impediments include problems in the
measurement of personality and coping.
183
X. Research should consider joint influence of traits on coping whether by
examining personality profiles, controlling for one trait when studying
others, or looking at interactions among the trait.
184
BIBLIOGRAPHY
1. Asthana, A. (2009). Teachers fight back against false claims of pupil assault. UK.
2. Banerjie, M. (2015). Students in Uniform Run Riot in West Bengal School, Beat Up
Teacher. Kolkata: NDTV.
3. Barkhuizen, N., & Rothmann, S. (2008). Occupational stress of academic staff in South
African higher education institutions. South African Journal of Psychology , 321 - 336.
4. Berelson, B. (1952). Content analysis in communication research. New York: The Free
Press.
5. Berens, L. (2007). Essential Qualities of the Personality Patterns. Retrieved 2008, from
Interstrength: www.interstrength.com/articles/essentialqualities.html,
6. Berger, R. (2013, February 16). The Difference Between White Collar and Blue Collar.
Retrieved December 18, 2015, from doughroller-personal finance:
http://www.doughroller.net/
7. Bocar, A. C. (2012). Learning and Teaching Styles in La Salle University – Ozamiz.
8. Boje, D. (2004). Welcome to Mindscapes. Retrieved 2007, from Mindscape Website:
http://peaceaware.com/mindscape/,
9. Bulmer, M. (1979). Concepts in the Analysis of Qualitative Data. In The sociological
Review (pp. 651 - 677).
10. Carver, C. a. (1994). Situational coping and coping dispositions in a stressful transaction.
J. of Personality and Social Psychology, , 184 - 195.
11. Carver, C. W. (1989). Assessing coping strategies: A theoretically based approach. J. of
Personality and Social Psychology , 267 - 283.
12. Chan, D. (1998). Stress, coping strategies, and psychological distress among secondary
school teachers in Hong Kong. An Educational Resource Journal , 145 - 163.
13. Charmaz, K. (2012). Constructing Grounded Theory. London: SAGE.
14. Chattopadhyay, D. S. (2013). Campus Violence In Educational Institution: An Experience
(With Reference To West Bengal). International Journal of Humanities and Social
Science Invention , 31-38.
15. Chattopadhyay, D. S. (2013). Campus Violence In Educational Institution: An Experience
(With Reference To West Bengal). International Journal of Humanities and Social
Science Invention , 31 - 38.
185
16. Chong, E. Y., & Chan, A. H. (2010). Subjective Health Complaints of Teachers From
Primary and Secondary Schools. International Journal of Occupational Safety and
Ergonomics , 23-39.
17. Clifton C. Addison, B. W.-J. (2007). Psychometric Evaluation of a Coping Strategies
Inventory Short-Form (CSI-SF) in the Jackson Heart Study Cohort. International Journal
of Environmental Research and Public Health , 289 - 295.
18. Coffey A., A. P. (1996). Narratives and stories in making sense of qualitative data. In A.
P. Coffey A., Complimentary Research Strategies. Sage Publications.
19. Connor-Smith2, C. S. (2010). Personality and Coping. The Annual Review of Psycholog .
20. Dasgupta, D. S. (2013). National Workshop on Quality Assurance and Accreditation.
Directorate of Technical Education.
21. De, R. (2010). Survey of ICTs for Education in India. PricewaterhouseCoopers.
22. Denzin NK, L. Y. (2000). Handbook of Qualitative Research. London: Sage Publications.
23. Department of School Education. (2008). Department of School Education. Retrieved
2016, from www.wbsed.gov.in: http://www.wbsed.gov.in/wbsed/default.html
24. Dey, A. (2015, January 31). Where is West Bengal's education system headed? (News
Analysis). Business Standard .
25. Dey, I. (1993). Qualitative Data Analysis. London: Routledge.
26. Educational Information. (2014). Educational Information. Retrieved 2016, from
Educational Information web site: http://www.indiaeduinfo.co.in/state/bengal.htm
27. Endler, N. a. (1990). Multidimensional assessment of coping: a critical evaluation. J. of
Personality and Social Psychology , 844 - 854.
28. European Trade Union Committee for Education . (1999). The cause of stress for
teachers, its effects, and suggested approaches to reduce it. .
29. Evers, J., & Van Staa, A. (2010). Qualitative Analysis in case study. In A. Mills, G.
Durepos, & E. Wieb, Encyclopedia of Case Study Research Part 2 (pp. 749-775). CA:
Sage.
30. Feinstein, L. (2005). MEASURING THE EFFECTS OF EDUCATION ON HEALTH AND
CIVIC ENGAGEMENT: PROCEEDINGS OF THE COPENHAGEN SYMPOSIUM.
London: National Survey of Health and Development.
31. Fisher, M. H. (2011). Factors Influencing Stress, Burnout, and Retention of Secondary
Teachers. Current Issues in Educatio. Retrieved 2015, from http://cie.asu.edu.
32. Fisher, S. (1994). Stress in academic life: The mental assembly line. Buckingham: Open
University Press.
33. Folkman, S. a. (1985). If it changes it must be a process: Study of emotion and coping
during three stages of a college examination. J. of Personality and Social Psychology ,
150 - 170.
186
34. Garner, R. (2015). Innocent teachers increasingly quitting their jobs over false
accusations by pupils. UK.
35. Gillespie, N. A., Walsh, Winefield, & Stough, C. (2001). Occupational stress
inuniversities: Staff perceptions of the causes, consequences and moderators of stress.
Work & Stress , 53 - 72.
36. Graneheim, U., & Lundman, B. (2004). Qualitative content analysis in nursing research:
concepts, procedures and measures to achieve trustworthiness. Nurse Education Today ,
105-112.
37. Grant, A. (2013). The Art of Motivation Maintenance. In Viking, In Give and take: A
revolutionary approach to success (p. 165). New York.
38. Halstead, M. J. (1993). Measuring coping in adolescents: An application of the ways of
coping checklist. J. of Clinical Child Psychology , 337 - 344.
39. Hayford, D. M. (2014). ERGONOMICS AND OCCUPATIONAL HEALTH HAZARDS
AND SAFETY OF TEACHERS IN GHANAIAN SCHOOLS. A CASE OF MAMPONG
MUNICIPALITY. WINNEBA-MAMPONG.
40. HMSO. (1991). Health and Safety Commission Occupational health services in higher
education. London.
41. INDIA BRAND EQUITY FOUNDATION. (2015, NOVEMBER). Retrieved DECEMBER
2015, from INDIA BRAND EQUITY FOUNDATION: http://www.ibef.org
42. Isil, K. (2015). Targets’ coping with workplace bullying: a qualitative study", Qualitative
Research in Organisations and Management:. An International Journal , 21-37.
43. Iwanaga, M. Y. (2004). Coping availability and stress reduction for optimistic and
pessimistic individuals. Personality and Individual Difference , 11 - 22.
44. Jennifer K. Connor-Smith, C. F. (2007). Relations Between Personality and Coping: A
Meta-Analysis. Journal of Personality and Social Psychology , 1080–1107.
45. Jose Maıa Garca-Alberca, B. C. (2012). Anxiety and depression are associated with
coping strategies in caregivers of Alzheimer’s disease patients: results from the
MALAGA-AD study. International Psychogeriatrics: , 1 - 10.
46. Justice, B. (1988). Stress, coping, and health outcomes. In M. L. Russell, Stress
management for chronic disease (pp. 14 - 29). New York: Pergamon.
47. Karademas, E. a.-A. (2004). The stress process, self-efficacy expectations, and
psychological health. Personality and Individual Differences , 1033-1043.
48. Kim, Y. a. (2002). Spirituality moderates the effect of stress on emotional and physical
adjustment. Personality and Individual Difference , 1377-1390.
49. King, N. (1994). The qualitative research interview. London: Sage.
50. Koellner, K. J. (1987). APPRAISAL OF STRESSFUL EVENTS AND COPING
STRATEGIES. Texas.
51. Krippendorf, K. (2004). Content Analysis: An Introduction to its Methodology. CA: Sage.

187
52. Kun, A. I. (2015). The Effect of Personality on Academic Performance: Evidence from
Two University Majors (2015). Business Education & Accreditation , 13-24.
53. Laux, L., & Weber, H. (1993). Coping with emotions, and self-presentation.
54. Lazarus, R. a. (1984). Stress, appraisal, and coping. New York: Springer.
55. Lazarus, R., & Folkman, S. (1985). If it changes it must be a process: study of emotion
and coping during three stages of a college examination. Journal of Personality and
Social Psychology , 150-170.
56. Lazarus.R.S., F. &. (1981). An Analysis of Coping in a middle aged coomunity Sample.
Journal of Health , 219 - 231.
57. Levine, J., Warrenburg, S., Kerns, R., & Schwartz, G. (1987). The role of denial in
recovery from coronary heart disease. . Psychosomatic Medicine , 109-117.
58. Maja Meško1, D. K. (2009). Personality profiles and stress-coping strategies of Slovenian
military pilots. Horizons of Psychology , 23-38.
59. Maslach, C. S. (2001). Job Burnout. Annual Review of Psychology, , 397 - 452.
60. Maxwell, J. A. (2005). Qualitative Research Design: An Interactive Approach. SAGE
Publications.
61. Ministry of Human Resource Department. (2013). All India Survey of Higher Education.
New Delhi: Government of India.
62. Misra, R. a. (2004). Academic stress among college students: A comparison of American
and international students. Inter. J. of Stress Management , 132 - 148.
63. Morgan, L. (2016). The Hazards of Being a Teacher. Houston Chronicle .
64. Moutafi, J. a. (2007). Is Managerial Level Related to Personality? British Journal of
Management , 277 - 280.
65. Nelson Roy, K. T. (2013, March). Vocal wear and tear is the greatest occupational hazard
for our nation's teachers. What have we learned from them? The ASHA Leader , pp. 36 -
40.
66. Parris, L. V. (2011). High School Student’s Perceptions of Coping With Cyberbullying.
Youth & Society , 1 - 23.
67. Pengying Yue, F. L. (2012). Neck/shoulder pain and low back pain among school
teachers in China, prevalence and risk factors. BMC Public Health , 789.
68. Pine, A. a. (1988). Career burnout and cures. New York: The Free.
69. (2016). Primary Teachers Recruitment Scam in West Bengal. Est Bengal: Primary
Teachers Recruitment Scam in West Bengal.
70. Riebel, J. J. (2009). Cyberbullying in Germany – an exploration of prevalence,
overlapping with real life bullying and coping strategies. Psychology Science Quarterly ,
298 - 314.
188
71. RodriguesI, A. B., & ChavesII, E. C. (2008). Stressing factors and coping strategies used
by oncology nurses. Revista Latino-Americana de Enfermagem .
72. Sarkar, P. P. (2004). State-wise Analysis of Accreditation Reports - West Bengal 2004.
bANGALORE: National Assessment and Accreditation Council.
73. Sarkar, Pabitra;. (2004). State Wise Analysis of Accredition Reports - West Bengal.
Bangalore: National Assessement and Acredition Council.
74. Scheier, M. W. (1986). Coping with stress: Divergent strategies of optimists and
pessimist. J. of Personality and Social Psychology , 1257-1264.
75. Scott, S. (2015). What Is a Blue-Collar Worker and a White-Collar Worker? Retrieved
december 18, 2015, from Chron.com: http://smallbusiness.chron.com/bluecollar-worker-
whitecollar-worker-11074.html
76. Shapiro, G. &. (1997). A matter of definition. In C. W. Roberts, Text Analysis for the
Social Sciences: Methods for Drawing Statistical Inferences from Texts and Transcripts
(pp. 9 - 31). NJ: : Lawrence Erlbaum Associates.
77. Shreshta, M. (2011). Occupational health hazards among university teachers of Nepal.
Nepal.
78. Siraj. (2003). Conversion of Parliamentarism to Social Fascism: An Indian Experience.
79. Snyder, C. (1999). Coping: The Psychology of What Works. New York: Oxford
University Press.
80. Snyder, C. (1999). Coping: The psycgology of what works. New York: Oxford University
Press.
81. Steele, R. L. (2005). An exploratory study of the concern of mature access to nursing
students and the coping strategies used to manage these adverse experiences. Nurse Educ.
Today , 573-581.
82. Stone, A. a. (1984). New measure of daily coping: Development preliminary results. J. of
Personality and Social Psychology, , 46, 4, 892-906.
83. Strauss, A. L. (1987). Qualitative Analysis for Social Scientist. Cambridge: Cambridge
University Press.
84. Suls, J., & Fletcher, B. (1985). The relative efficacy of avoidant and non-avoidant coping
strategies: -avoidant coping strategies: A meta-analysis. Health Psychology , 249-288.
85. Suttle, R. (1999). Retrieved from eHow.com.
86. Tavakol, M. (2011). Making sense of Cronbach’s alpha . International Journal of
Medical Education , 53-55.
87. Taylor, S. (1998, July). http://www.macses.ucsf.edu/research/psychosocial/coping.php.
Retrieved Feb 2015, from www.macses.ucsf.ed:
http://www.macses.ucsf.edu/research/psychosocial/coping.php
88. Teichmann. (2010). Sources of occupational stress in technical university academics.
Latest Trends on ENGINEERING EDUCATION , 448 - 453.
189
89. Teichmann, & Mare. (2010). Sources of occupational stress in technical university
academics., (pp. 448-453). Estonia.
90. Teichmann, & Mare. (2010). Sources of occupational stress in technical university
academics.
91. Tesch, R. (1990). Qualitative Research: Analysis Types & Software Tools. Bristol:
Falmer Press.
92. Thoits, P. (1995). Stress, coping and social support process. Where are we? What next? J.
of Health and Social Behavior , 53 - 79.
93. Timmins, F. a. (2002). Aspects of nurse education programmes that frequently cause
stress to nursing students – fact-finding sample survey. Nurse Educ. Today , 203 - 211.
94. Tobin. (1984). The influence of self-efficacy expectations on coin efforts. Philadelphia.
95. Tobin, D. L. (2001). User Manual For the Coping Strategy Inventory.
96. Tobin, D. L., Holroyd, K. A., Reynolds, R. V., & Wigul, J. K. (1989). The hierarchical
factor structure of the Coping Strategies Inventory. Cognitive Therapy and Research ,
343-361.
97. Twamley, E. H. (2004). Neuropsychological function in college students with and
without posttraumatic stress disorder. Psychiatry Research , 265- 274.
98. Venebles, K., & Allender, S. (2006). Occupational health needs of universities: a review
with an emphasis on the United Kingdom. Occupational Environmental Medicine , 159 -
167.
99. Veronika Šléglová, A. Č. (2011). Cyberbullying in Adolescent Victims: Perception and
Coping. Journal of Psychological Research on CyberSpace .
100. West Bengal Council for Higher Secondary Education. (n.d.). West Bengal Council for
Higher Secondary Education. Retrieved 2016, from West Bengal Council for Higher
Secondary Education: http://wbchse.nic.in/html/index.html
101. Wikipedia. (2016, april 22). Retrieved 2016, from Wikipedia, the free encyclopedia:
https://en.wikipedia.org/wiki/Occupational_hazard
102. wikipedia.org. (2014). Retrieved from www.thestatesman.net:
http://timesofindia.indiatimes.com/city/kolkata/Alipurduar-a-new-district-on-June-
25/articleshow/36916065.cms
103. Workcover Corporation. (2002, November). Managing the risks of Violence at work in
the education sector. South Australia: WorkCover Corporation of South Australia.
104. World Colleges Information. (2013). World Colleges Information. Retrieved 2016, from
World Colleges Information web site: http://www.worldcolleges.info/college-category/32
105. Yolles, M. a. (2009). Migrating Personality Theories Part 2: Towards a Theory of the
Balanced Personality? (. Kybernetes , 1461 - 1490.
106. Yolles, M. (2009). Migrating Personality Theories Part 2: Towards a Theory of the
Balanced Personality? Kybernetes , 1461-1490.
190
107. Zuroff, D. C. (1995). Dependency, self-criticism, and maladjustment. In K. J. J. S.
Auerbach, Relatedness, Self-definition and mental representation: Essays in honor of
Sidney J. Blat (pp. 75 - 90). London: BrunnerRoutledge.
108. Zyga, S. M. (2016). Assessing Factors That Affect Coping Strategies Among Nursing
Personnel . Materia Socio Medica , 146-150.
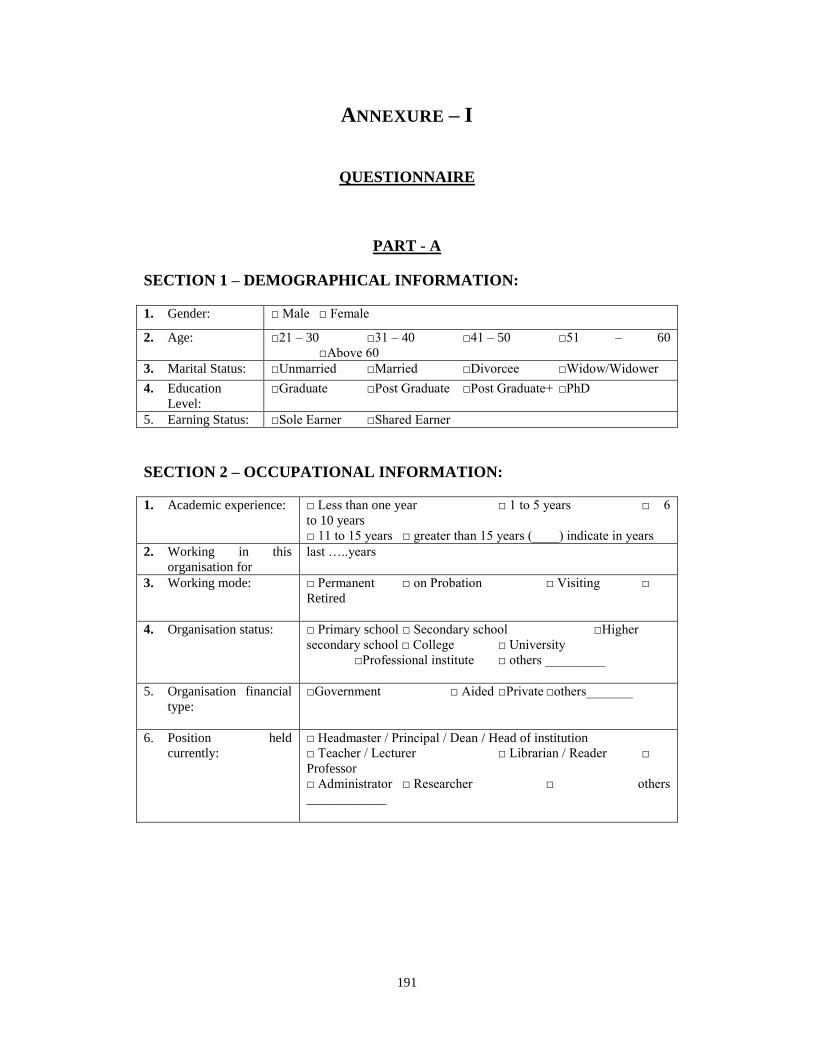
191
ANNEXURE – I
QUESTIONNAIRE
PART - A
SECTION 1 – DEMOGRAPHICAL INFORMATION:
1. Gender: □ Male □ Female
2. Age: □21 – 30 □31 – 40 □41 – 50 □51 – 60
□Above 60
3. Marital Status: □Unmarried □Married □Divorcee □Widow/Widower
4. Education
Level:
□Graduate □Post Graduate □Post Graduate+ □PhD
5. Earning Status: □Sole Earner □Shared Earner
SECTION 2 – OCCUPATIONAL INFORMATION:
1. Academic experience: □ Less than one year □ 1 to 5 years □ 6
to 10 years
□ 11 to 15 years □ greater than 15 years (____) indicate in years
2. Working in this
organisation for
last …..years
3. Working mode: □ Permanent □ on Probation □ Visiting □
Retired
4. Organisation status: □ Primary school □ Secondary school □Higher
secondary school □ College □ University
□Professional institute □ others _________
5. Organisation financial
type:
□Government □ Aided □Private □others_______
6. Position held
currently:
□ Headmaster / Principal / Dean / Head of institution
□ Teacher / Lecturer □ Librarian / Reader □
Professor
□ Administrator □ Researcher □ others
____________
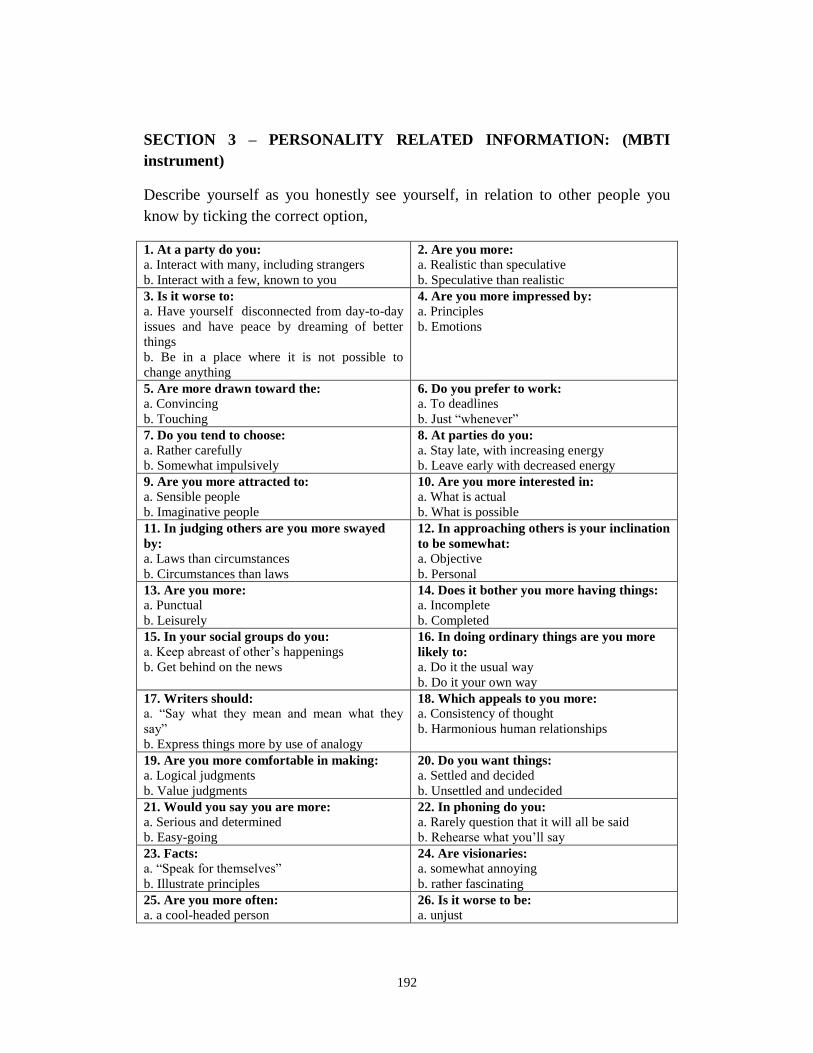
192
SECTION 3 – PERSONALITY RELATED INFORMATION: (MBTI
instrument)
Describe yourself as you honestly see yourself, in relation to other people you
know by ticking the correct option,
1. At a party do you:
a. Interact with many, including strangers
b. Interact with a few, known to you
2. Are you more:
a. Realistic than speculative
b. Speculative than realistic
3. Is it worse to:
a. Have yourself disconnected from day-to-day
issues and have peace by dreaming of better
things
b. Be in a place where it is not possible to
change anything
4. Are you more impressed by:
a. Principles
b. Emotions
5. Are more drawn toward the:
a. Convincing
b. Touching
6. Do you prefer to work:
a. To deadlines
b. Just “whenever”
7. Do you tend to choose:
a. Rather carefully
b. Somewhat impulsively
8. At parties do you:
a. Stay late, with increasing energy
b. Leave early with decreased energy
9. Are you more attracted to:
a. Sensible people
b. Imaginative people
10. Are you more interested in:
a. What is actual
b. What is possible
11. In judging others are you more swayed
by:
a. Laws than circumstances
b. Circumstances than laws
12. In approaching others is your inclination
to be somewhat:
a. Objective
b. Personal
13. Are you more:
a. Punctual
b. Leisurely
14. Does it bother you more having things:
a. Incomplete
b. Completed
15. In your social groups do you:
a. Keep abreast of other’s happenings
b. Get behind on the news
16. In doing ordinary things are you more
likely to:
a. Do it the usual way
b. Do it your own way
17. Writers should:
a. “Say what they mean and mean what they
say”
b. Express things more by use of analogy
18. Which appeals to you more:
a. Consistency of thought
b. Harmonious human relationships
19. Are you more comfortable in making:
a. Logical judgments
b. Value judgments
20. Do you want things:
a. Settled and decided
b. Unsettled and undecided
21. Would you say you are more:
a. Serious and determined
b. Easy-going
22. In phoning do you:
a. Rarely question that it will all be said
b. Rehearse what you’ll say
23. Facts:
a. “Speak for themselves”
b. Illustrate principles
24. Are visionaries:
a. somewhat annoying
b. rather fascinating
25. Are you more often:
a. a cool-headed person 26. Is it worse to be:
a. unjust
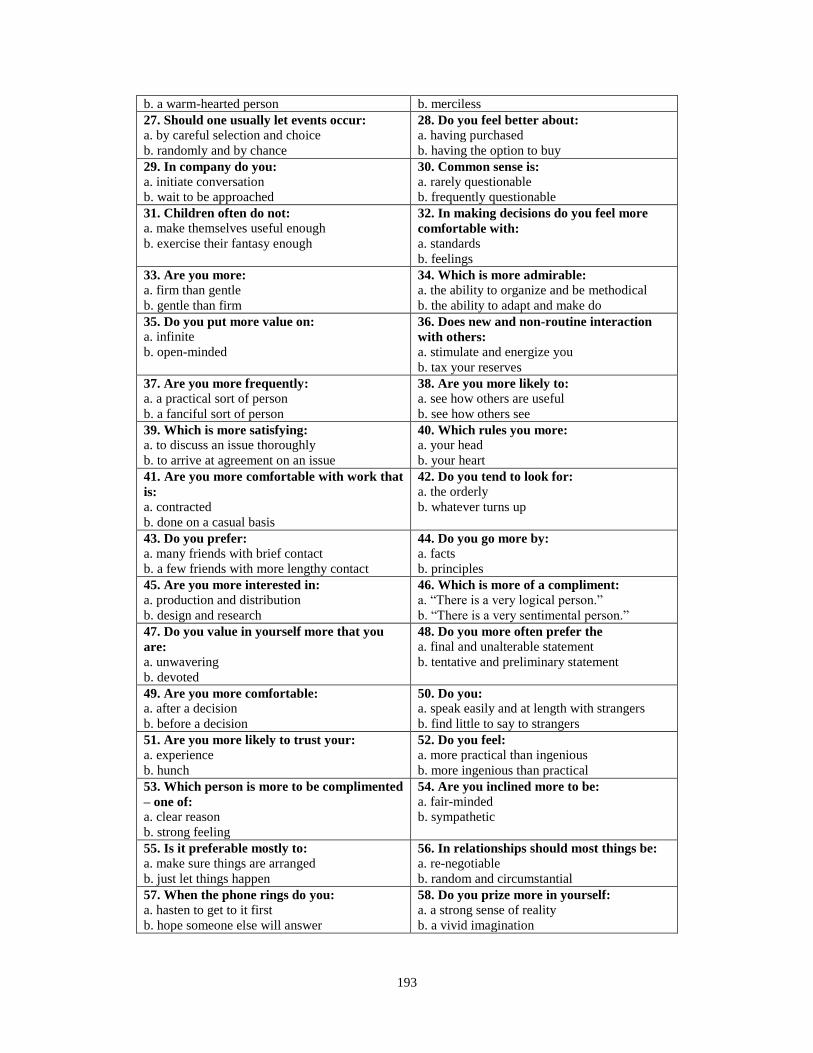
193
b. a warm-hearted person b. merciless
27. Should one usually let events occur:
a. by careful selection and choice
b. randomly and by chance
28. Do you feel better about:
a. having purchased
b. having the option to buy
29. In company do you:
a. initiate conversation
b. wait to be approached
30. Common sense is:
a. rarely questionable
b. frequently questionable
31. Children often do not:
a. make themselves useful enough
b. exercise their fantasy enough
32. In making decisions do you feel more
comfortable with:
a. standards
b. feelings
33. Are you more:
a. firm than gentle
b. gentle than firm
34. Which is more admirable:
a. the ability to organize and be methodical
b. the ability to adapt and make do
35. Do you put more value on:
a. infinite
b. open-minded
36. Does new and non-routine interaction
with others:
a. stimulate and energize you
b. tax your reserves
37. Are you more frequently:
a. a practical sort of person
b. a fanciful sort of person
38. Are you more likely to:
a. see how others are useful
b. see how others see
39. Which is more satisfying:
a. to discuss an issue thoroughly
b. to arrive at agreement on an issue
40. Which rules you more:
a. your head
b. your heart
41. Are you more comfortable with work that
is:
a. contracted
b. done on a casual basis
42. Do you tend to look for:
a. the orderly
b. whatever turns up
43. Do you prefer:
a. many friends with brief contact
b. a few friends with more lengthy contact
44. Do you go more by:
a. facts
b. principles
45. Are you more interested in:
a. production and distribution
b. design and research
46. Which is more of a compliment:
a. “There is a very logical person.”
b. “There is a very sentimental person.”
47. Do you value in yourself more that you
are:
a. unwavering
b. devoted
48. Do you more often prefer the
a. final and unalterable statement
b. tentative and preliminary statement
49. Are you more comfortable:
a. after a decision
b. before a decision
50. Do you:
a. speak easily and at length with strangers
b. find little to say to strangers
51. Are you more likely to trust your:
a. experience
b. hunch
52. Do you feel:
a. more practical than ingenious
b. more ingenious than practical
53. Which person is more to be complimented
– one of:
a. clear reason
b. strong feeling
54. Are you inclined more to be:
a. fair-minded
b. sympathetic
55. Is it preferable mostly to:
a. make sure things are arranged
b. just let things happen
56. In relationships should most things be:
a. re-negotiable
b. random and circumstantial
57. When the phone rings do you:
a. hasten to get to it first
b. hope someone else will answer
58. Do you prize more in yourself:
a. a strong sense of reality
b. a vivid imagination
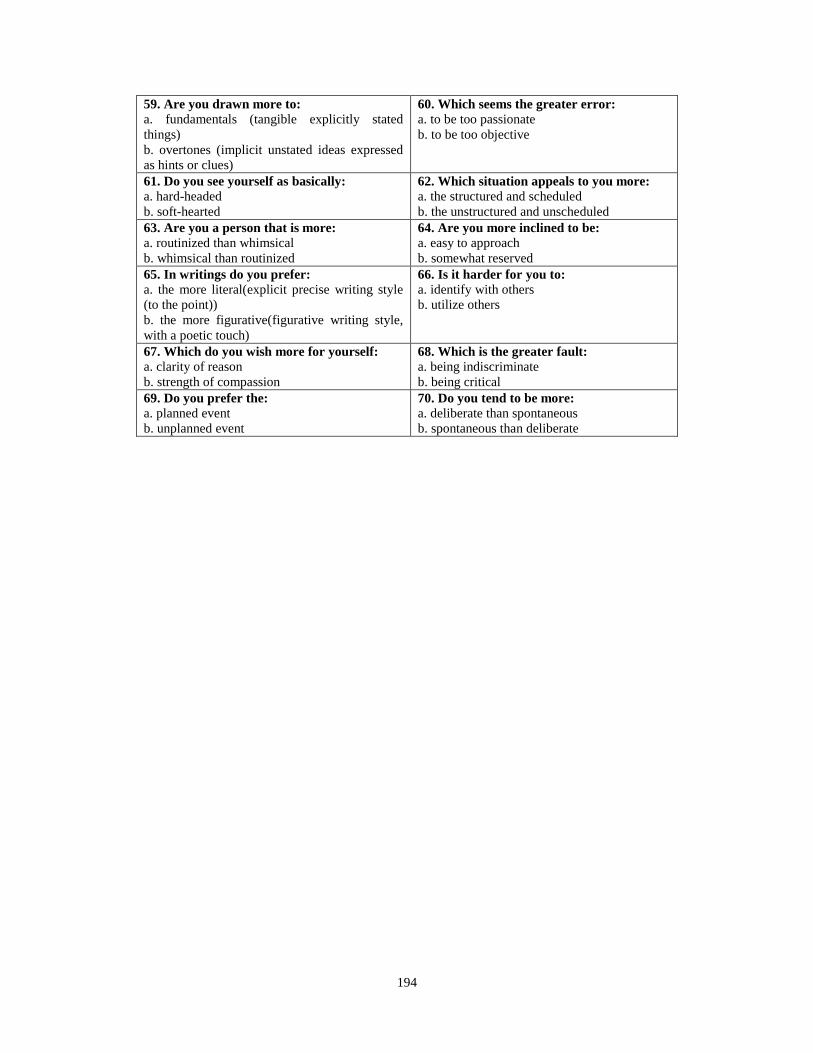
194
59. Are you drawn more to:
a. fundamentals (tangible explicitly stated
things)
b. overtones (implicit unstated ideas expressed
as hints or clues)
60. Which seems the greater error:
a. to be too passionate
b. to be too objective
61. Do you see yourself as basically:
a. hard-headed
b. soft-hearted
62. Which situation appeals to you more:
a. the structured and scheduled
b. the unstructured and unscheduled
63. Are you a person that is more:
a. routinized than whimsical
b. whimsical than routinized
64. Are you more inclined to be:
a. easy to approach
b. somewhat reserved
65. In writings do you prefer:
a. the more literal(explicit precise writing style
(to the point))
b. the more figurative(figurative writing style,
with a poetic touch)
66. Is it harder for you to:
a. identify with others
b. utilize others
67. Which do you wish more for yourself:
a. clarity of reason
b. strength of compassion
68. Which is the greater fault:
a. being indiscriminate
b. being critical
69. Do you prefer the:
a. planned event
b. unplanned event
70. Do you tend to be more:
a. deliberate than spontaneous
b. spontaneous than deliberate
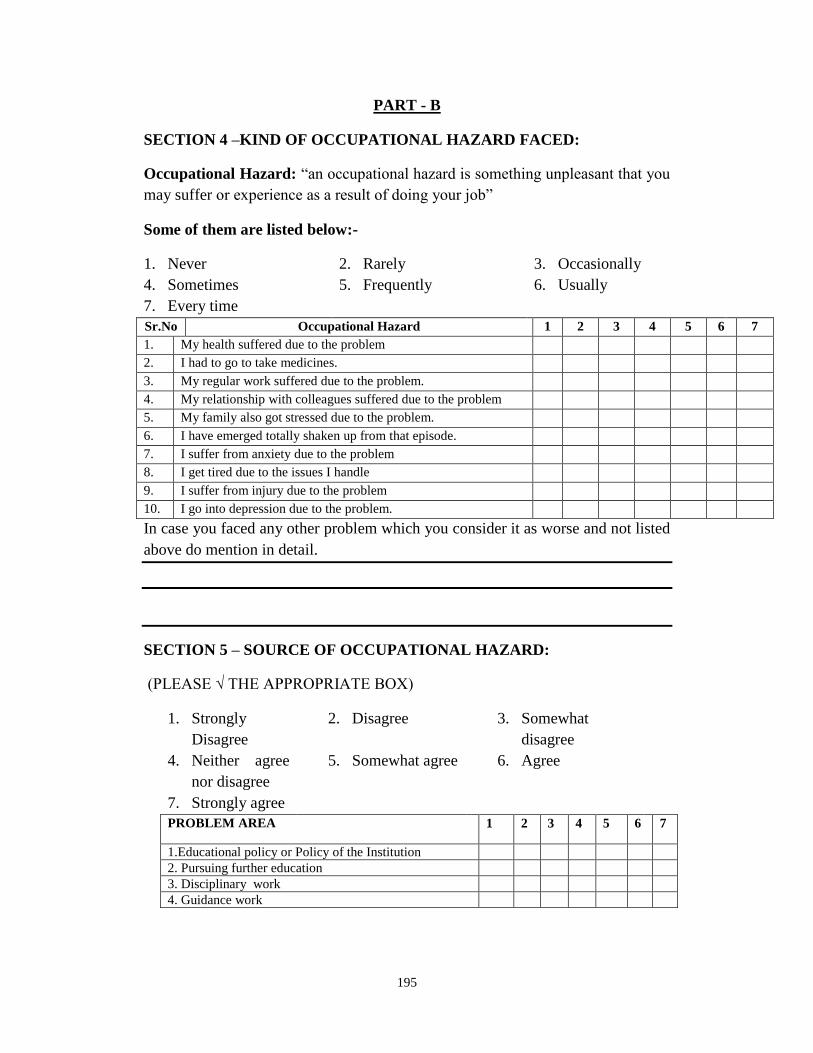
195
PART - B
SECTION 4 –KIND OF OCCUPATIONAL HAZARD FACED:
Occupational Hazard: “an occupational hazard is something unpleasant that you
may suffer or experience as a result of doing your job”
Some of them are listed below:-
1. Never 2. Rarely 3. Occasionally
4. Sometimes 5. Frequently 6. Usually
7. Every time
Sr.No Occupational Hazard 1 2 3 4 5 6 7
1. My health suffered due to the problem
2. I had to go to take medicines.
3. My regular work suffered due to the problem.
4. My relationship with colleagues suffered due to the problem
5. My family also got stressed due to the problem.
6. I have emerged totally shaken up from that episode.
7. I suffer from anxiety due to the problem
8. I get tired due to the issues I handle
9. I suffer from injury due to the problem
10. I go into depression due to the problem.
In case you faced any other problem which you consider it as worse and not listed
above do mention in detail.
SECTION 5 – SOURCE OF OCCUPATIONAL HAZARD:
(PLEASE √ THE APPROPRIATE BOX)
1. Strongly
Disagree
2. Disagree 3. Somewhat
disagree
4. Neither agree
nor disagree
5. Somewhat agree 6. Agree
7. Strongly agree
PROBLEM AREA 1 2 3 4 5 6 7
1.Educational policy or Policy of the Institution
2. Pursuing further education
3. Disciplinary work
4. Guidance work
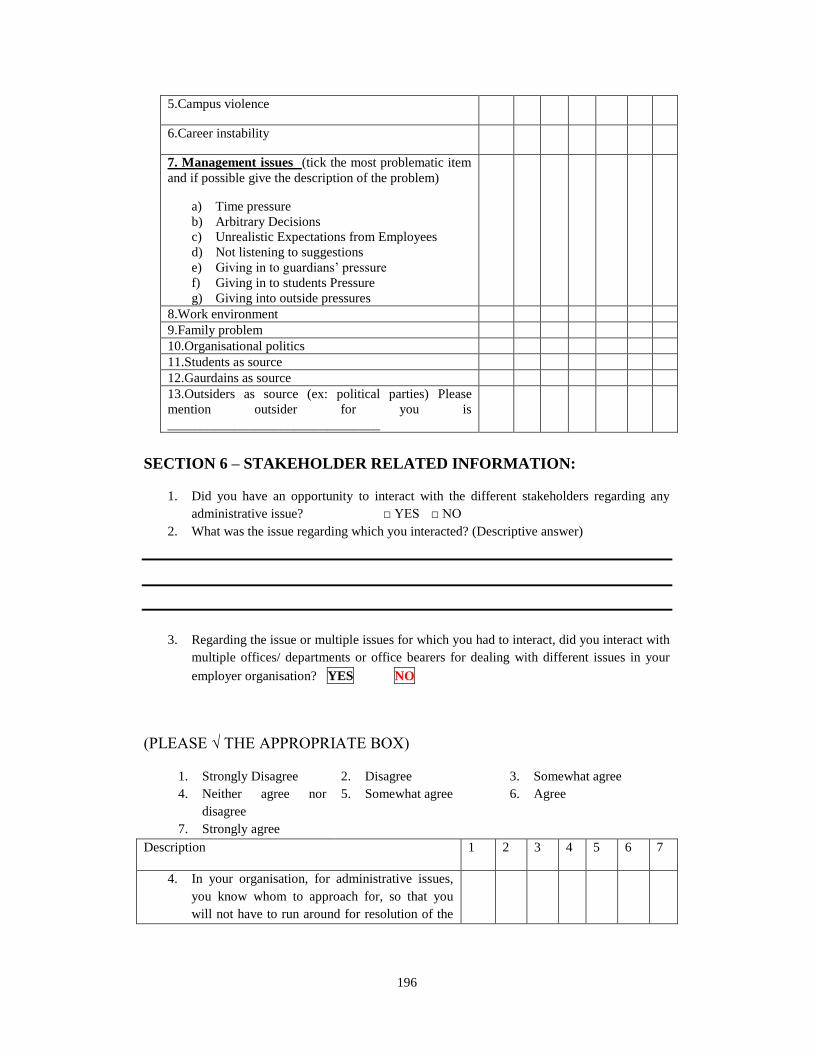
196
5.Campus violence
6.Career instability
7. Management issues (tick the most problematic item
and if possible give the description of the problem)
a) Time pressure
b) Arbitrary Decisions
c) Unrealistic Expectations from Employees
d) Not listening to suggestions
e) Giving in to guardians’ pressure
f) Giving in to students Pressure
g) Giving into outside pressures
8.Work environment
9.Family problem
10.Organisational politics
11.Students as source
12.Gaurdains as source
13.Outsiders as source (ex: political parties) Please
mention outsider for you is
________________________________
SECTION 6 – STAKEHOLDER RELATED INFORMATION:
1. Did you have an opportunity to interact with the different stakeholders regarding any
administrative issue? □ YES □ NO
2. What was the issue regarding which you interacted? (Descriptive answer)
3. Regarding the issue or multiple issues for which you had to interact, did you interact with
multiple offices/ departments or office bearers for dealing with different issues in your
employer organisation? YES NO
(PLEASE √ THE APPROPRIATE BOX)
1. Strongly Disagree 2. Disagree 3. Somewhat agree
4. Neither agree nor
disagree
5. Somewhat agree 6. Agree
7. Strongly agree
Description 1 2 3 4 5 6 7
4. In your organisation, for administrative issues,
you know whom to approach for, so that you
will not have to run around for resolution of the
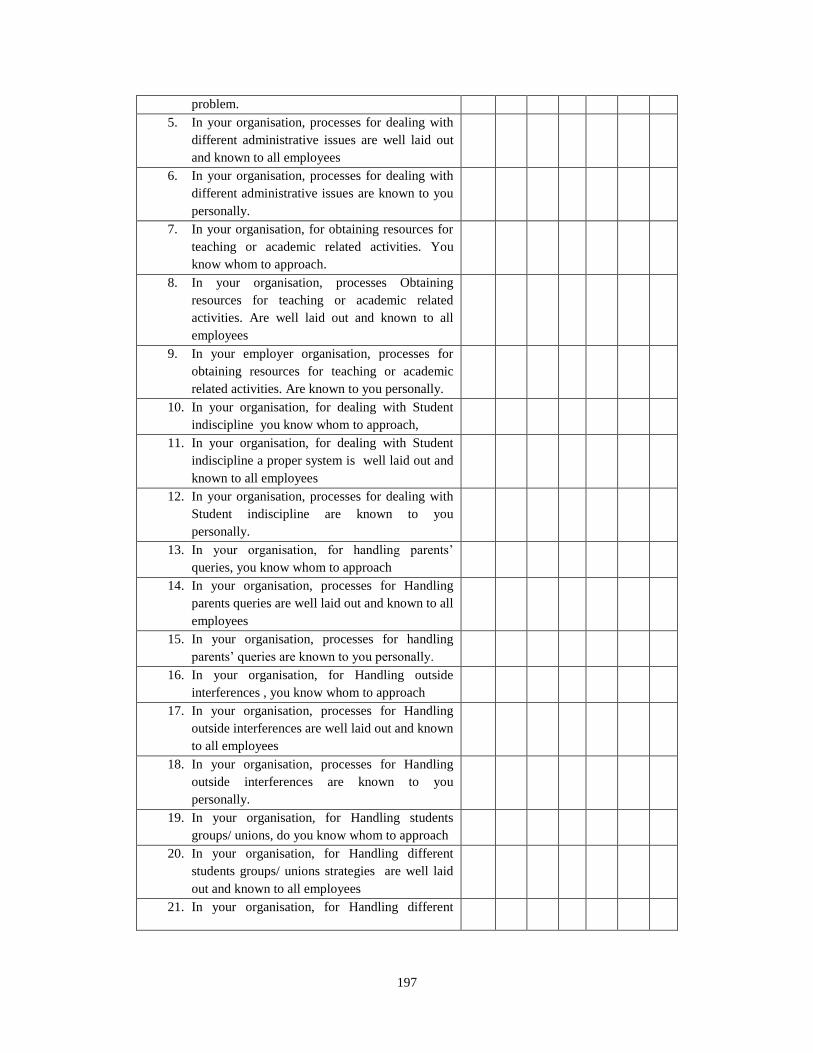
197
problem.
5. In your organisation, processes for dealing with
different administrative issues are well laid out
and known to all employees
6. In your organisation, processes for dealing with
different administrative issues are known to you
personally.
7. In your organisation, for obtaining resources for
teaching or academic related activities. You
know whom to approach.
8. In your organisation, processes Obtaining
resources for teaching or academic related
activities. Are well laid out and known to all
employees
9. In your employer organisation, processes for
obtaining resources for teaching or academic
related activities. Are known to you personally.
10. In your organisation, for dealing with Student
indiscipline you know whom to approach,
11. In your organisation, for dealing with Student
indiscipline a proper system is well laid out and
known to all employees
12. In your organisation, processes for dealing with
Student indiscipline are known to you
personally.
13. In your organisation, for handling parents’
queries, you know whom to approach
14. In your organisation, processes for Handling
parents queries are well laid out and known to all
employees
15. In your organisation, processes for handling
parents’ queries are known to you personally.
16. In your organisation, for Handling outside
interferences , you know whom to approach
17. In your organisation, processes for Handling
outside interferences are well laid out and known
to all employees
18. In your organisation, processes for Handling
outside interferences are known to you
personally.
19. In your organisation, for Handling students
groups/ unions, do you know whom to approach
20. In your organisation, for Handling different
students groups/ unions strategies are well laid
out and known to all employees
21. In your organisation, for Handling different
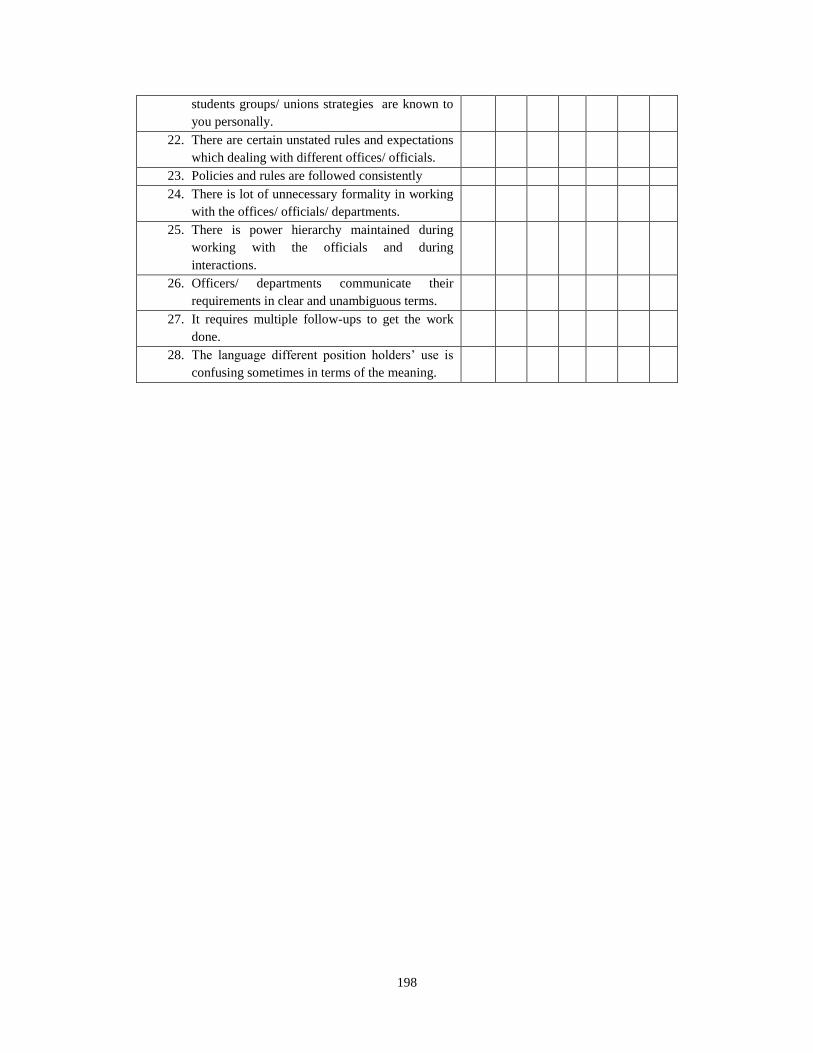
198
students groups/ unions strategies are known to
you personally.
22. There are certain unstated rules and expectations
which dealing with different offices/ officials.
23. Policies and rules are followed consistently
24. There is lot of unnecessary formality in working
with the offices/ officials/ departments.
25. There is power hierarchy maintained during
working with the officials and during
interactions.
26. Officers/ departments communicate their
requirements in clear and unambiguous terms.
27. It requires multiple follow-ups to get the work
done.
28. The language different position holders’ use is
confusing sometimes in terms of the meaning.
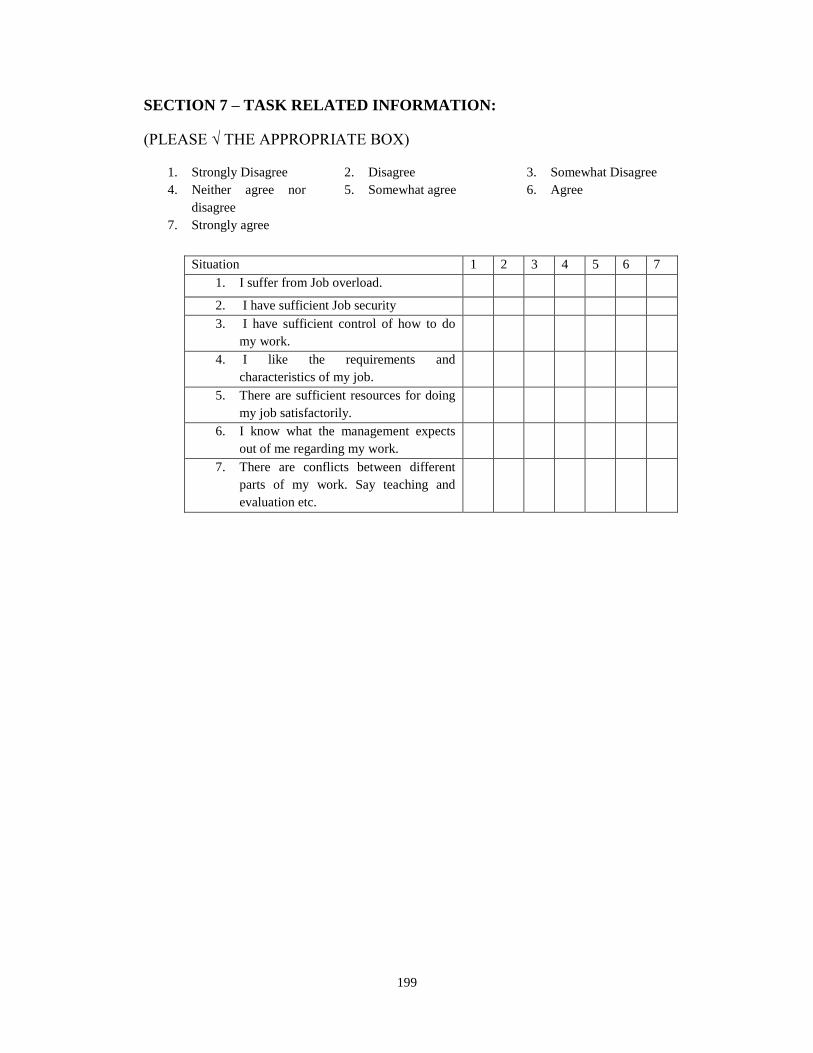
199
SECTION 7 – TASK RELATED INFORMATION:
(PLEASE √ THE APPROPRIATE BOX)
1. Strongly Disagree 2. Disagree 3. Somewhat Disagree
4. Neither agree nor
disagree
5. Somewhat agree 6. Agree
7. Strongly agree
Situation 1 2 3 4 5 6 7
1. I suffer from Job overload.
2. I have sufficient Job security
3. I have sufficient control of how to do
my work.
4. I like the requirements and
characteristics of my job.
5. There are sufficient resources for doing
my job satisfactorily.
6. I know what the management expects
out of me regarding my work.
7. There are conflicts between different
parts of my work. Say teaching and
evaluation etc.
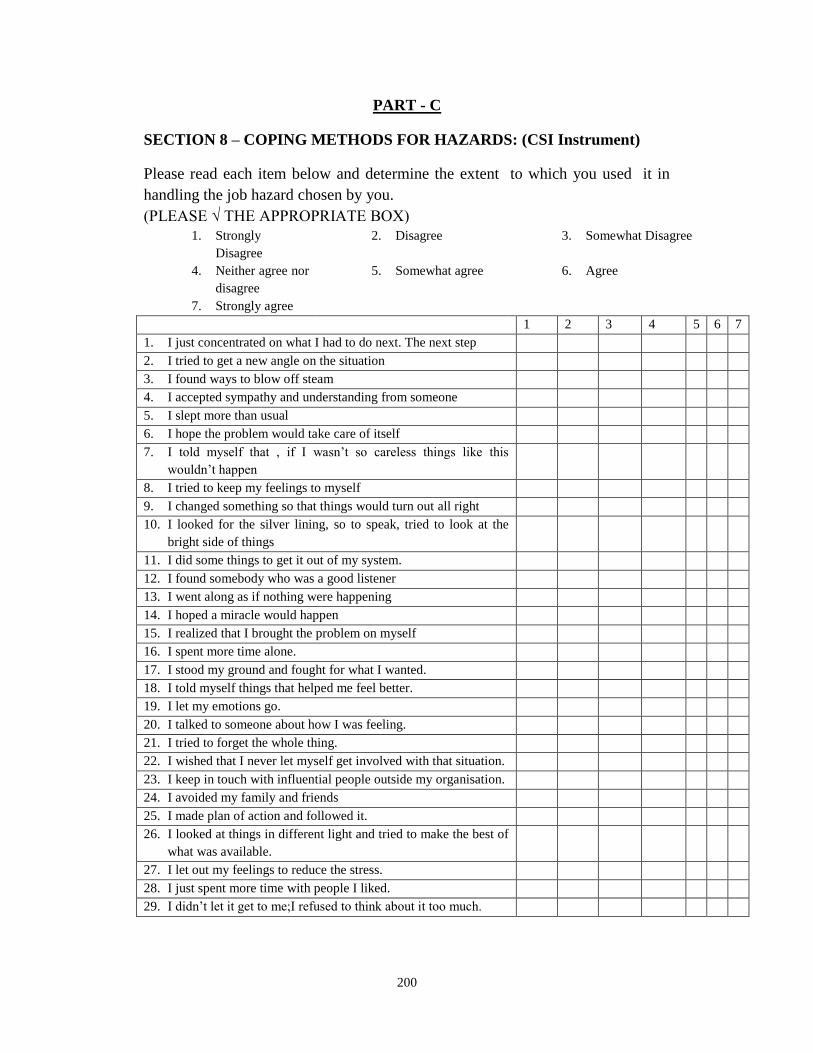
200
PART - C
SECTION 8 – COPING METHODS FOR HAZARDS: (CSI Instrument)
Please read each item below and determine the extent to which you used it in
handling the job hazard chosen by you.
(PLEASE √ THE APPROPRIATE BOX)
1. Strongly
Disagree
2. Disagree 3. Somewhat Disagree
4. Neither agree nor
disagree
5. Somewhat agree 6. Agree
7. Strongly agree
1 2 3 4 5 6 7
1. I just concentrated on what I had to do next. The next step
2. I tried to get a new angle on the situation
3. I found ways to blow off steam
4. I accepted sympathy and understanding from someone
5. I slept more than usual
6. I hope the problem would take care of itself
7. I told myself that , if I wasn’t so careless things like this
wouldn’t happen
8. I tried to keep my feelings to myself
9. I changed something so that things would turn out all right
10. I looked for the silver lining, so to speak, tried to look at the
bright side of things
11. I did some things to get it out of my system.
12. I found somebody who was a good listener
13. I went along as if nothing were happening
14. I hoped a miracle would happen
15. I realized that I brought the problem on myself
16. I spent more time alone.
17. I stood my ground and fought for what I wanted.
18. I told myself things that helped me feel better.
19. I let my emotions go.
20. I talked to someone about how I was feeling.
21. I tried to forget the whole thing.
22. I wished that I never let myself get involved with that situation.
23. I keep in touch with influential people outside my organisation.
24. I avoided my family and friends
25. I made plan of action and followed it.
26. I looked at things in different light and tried to make the best of
what was available.
27. I let out my feelings to reduce the stress.
28. I just spent more time with people I liked.
29. I didn’t let it get to me;I refused to think about it too much.
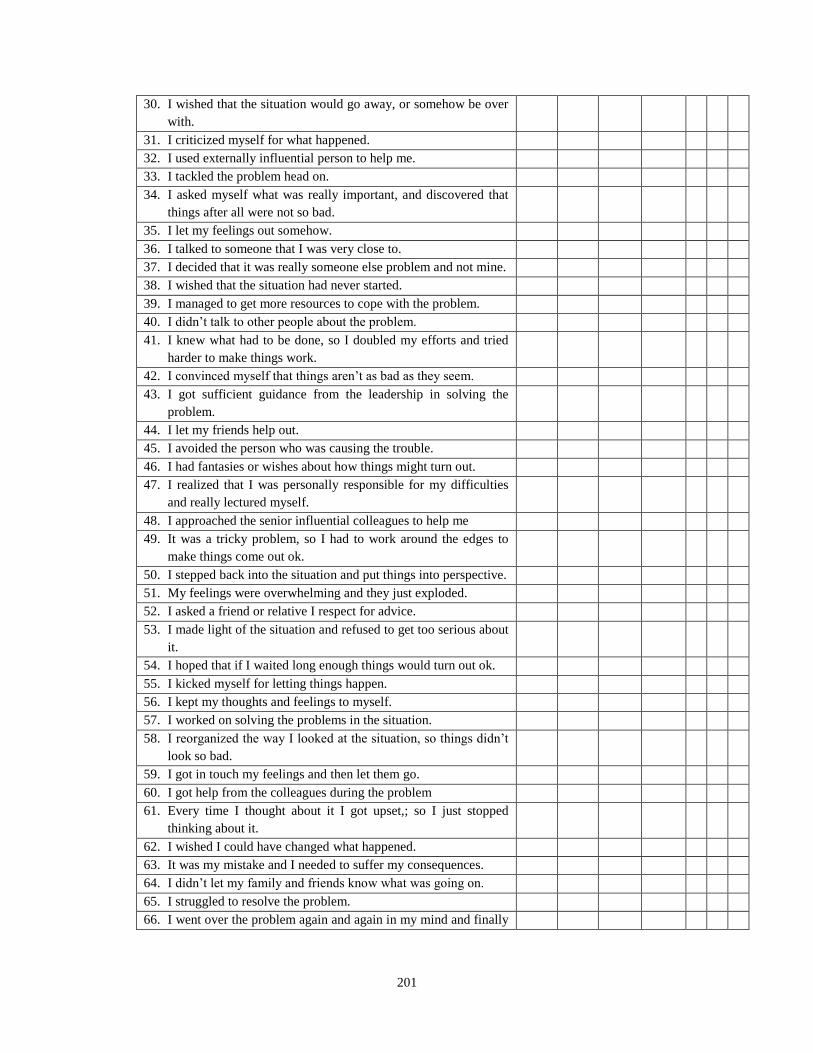
201
30. I wished that the situation would go away, or somehow be over
with.
31. I criticized myself for what happened.
32. I used externally influential person to help me.
33. I tackled the problem head on.
34. I asked myself what was really important, and discovered that
things after all were not so bad.
35. I let my feelings out somehow.
36. I talked to someone that I was very close to.
37. I decided that it was really someone else problem and not mine.
38. I wished that the situation had never started.
39. I managed to get more resources to cope with the problem.
40. I didn’t talk to other people about the problem.
41. I knew what had to be done, so I doubled my efforts and tried
harder to make things work.
42. I convinced myself that things aren’t as bad as they seem.
43. I got sufficient guidance from the leadership in solving the
problem.
44. I let my friends help out.
45. I avoided the person who was causing the trouble.
46. I had fantasies or wishes about how things might turn out.
47. I realized that I was personally responsible for my difficulties
and really lectured myself.
48. I approached the senior influential colleagues to help me
49. It was a tricky problem, so I had to work around the edges to
make things come out ok.
50. I stepped back into the situation and put things into perspective.
51. My feelings were overwhelming and they just exploded.
52. I asked a friend or relative I respect for advice.
53. I made light of the situation and refused to get too serious about
it.
54. I hoped that if I waited long enough things would turn out ok.
55. I kicked myself for letting things happen.
56. I kept my thoughts and feelings to myself.
57. I worked on solving the problems in the situation.
58. I reorganized the way I looked at the situation, so things didn’t
look so bad.
59. I got in touch my feelings and then let them go.
60. I got help from the colleagues during the problem
61. Every time I thought about it I got upset,; so I just stopped
thinking about it.
62. I wished I could have changed what happened.
63. It was my mistake and I needed to suffer my consequences.
64. I didn’t let my family and friends know what was going on.
65. I struggled to resolve the problem.
66. I went over the problem again and again in my mind and finally
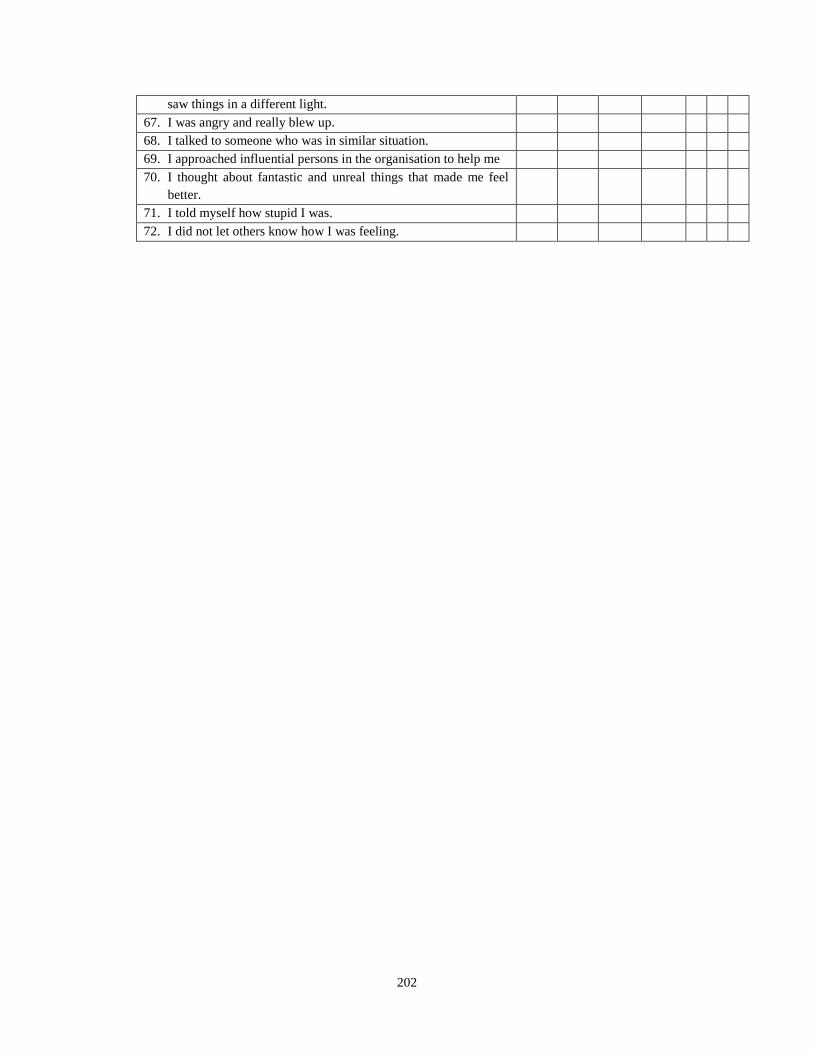
202
saw things in a different light.
67. I was angry and really blew up.
68. I talked to someone who was in similar situation.
69. I approached influential persons in the organisation to help me
70. I thought about fantastic and unreal things that made me feel
better.
71. I told myself how stupid I was.
72. I did not let others know how I was feeling.
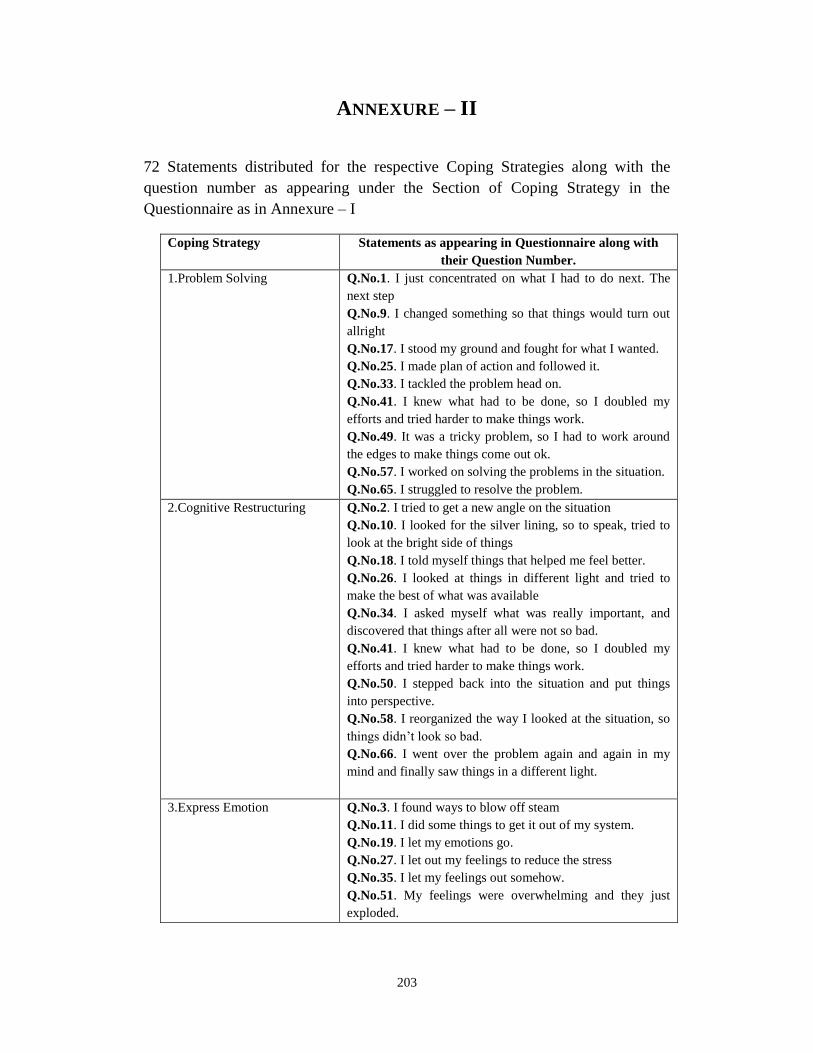
203
ANNEXURE – II
72 Statements distributed for the respective Coping Strategies along with the
question number as appearing under the Section of Coping Strategy in the
Questionnaire as in Annexure – I
Coping Strategy Statements as appearing in Questionnaire along with
their Question Number.
1.Problem Solving Q.No.1. I just concentrated on what I had to do next. The
next step
Q.No.9. I changed something so that things would turn out
allright
Q.No.17. I stood my ground and fought for what I wanted.
Q.No.25. I made plan of action and followed it.
Q.No.33. I tackled the problem head on.
Q.No.41. I knew what had to be done, so I doubled my
efforts and tried harder to make things work.
Q.No.49. It was a tricky problem, so I had to work around
the edges to make things come out ok.
Q.No.57. I worked on solving the problems in the situation.
Q.No.65. I struggled to resolve the problem.
2.Cognitive Restructuring Q.No.2. I tried to get a new angle on the situation
Q.No.10. I looked for the silver lining, so to speak, tried to
look at the bright side of things
Q.No.18. I told myself things that helped me feel better.
Q.No.26. I looked at things in different light and tried to
make the best of what was available
Q.No.34. I asked myself what was really important, and
discovered that things after all were not so bad.
Q.No.41. I knew what had to be done, so I doubled my
efforts and tried harder to make things work.
Q.No.50. I stepped back into the situation and put things
into perspective.
Q.No.58. I reorganized the way I looked at the situation, so
things didn’t look so bad.
Q.No.66. I went over the problem again and again in my
mind and finally saw things in a different light.
3.Express Emotion Q.No.3. I found ways to blow off steam
Q.No.11. I did some things to get it out of my system.
Q.No.19. I let my emotions go.
Q.No.27. I let out my feelings to reduce the stress
Q.No.35. I let my feelings out somehow.
Q.No.51. My feelings were overwhelming and they just
exploded.
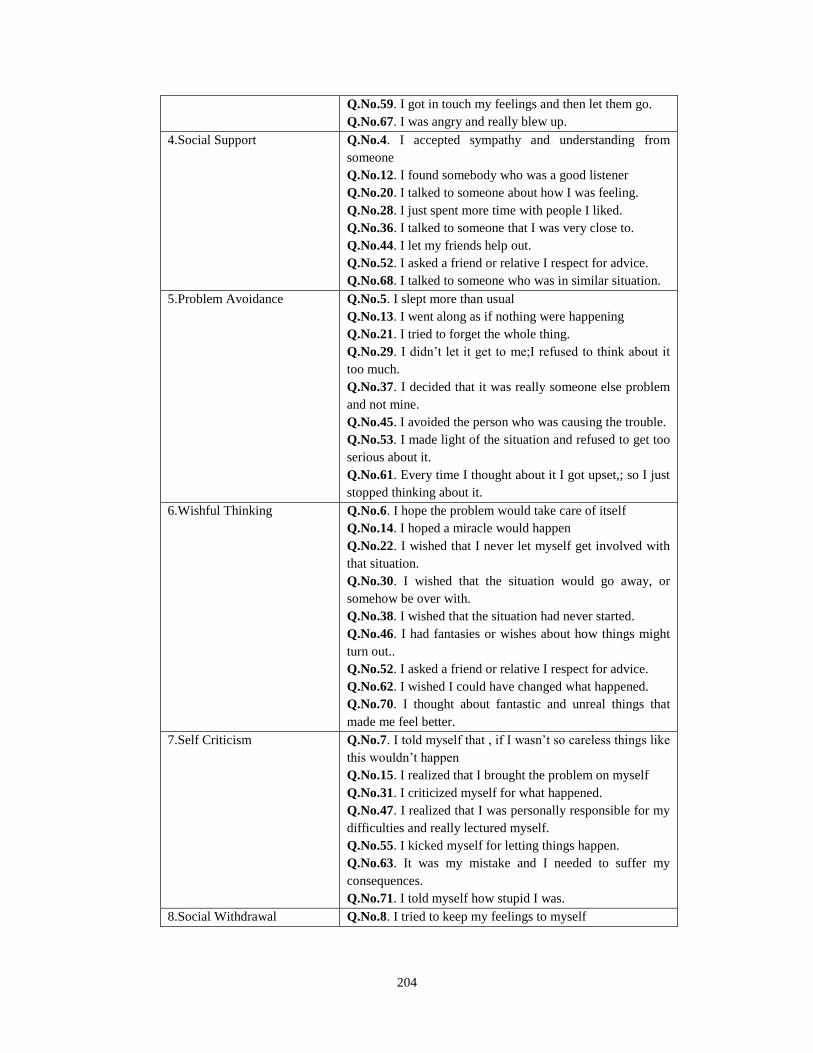
204
Q.No.59. I got in touch my feelings and then let them go.
Q.No.67. I was angry and really blew up.
4.Social Support Q.No.4. I accepted sympathy and understanding from
someone
Q.No.12. I found somebody who was a good listener
Q.No.20. I talked to someone about how I was feeling.
Q.No.28. I just spent more time with people I liked.
Q.No.36. I talked to someone that I was very close to.
Q.No.44. I let my friends help out.
Q.No.52. I asked a friend or relative I respect for advice.
Q.No.68. I talked to someone who was in similar situation.
5.Problem Avoidance Q.No.5. I slept more than usual
Q.No.13. I went along as if nothing were happening
Q.No.21. I tried to forget the whole thing.
Q.No.29. I didn’t let it get to me;I refused to think about it
too much.
Q.No.37. I decided that it was really someone else problem
and not mine.
Q.No.45. I avoided the person who was causing the trouble.
Q.No.53. I made light of the situation and refused to get too
serious about it.
Q.No.61. Every time I thought about it I got upset,; so I just
stopped thinking about it.
6.Wishful Thinking Q.No.6. I hope the problem would take care of itself
Q.No.14. I hoped a miracle would happen
Q.No.22. I wished that I never let myself get involved with
that situation.
Q.No.30. I wished that the situation would go away, or
somehow be over with.
Q.No.38. I wished that the situation had never started.
Q.No.46. I had fantasies or wishes about how things might
turn out..
Q.No.52. I asked a friend or relative I respect for advice.
Q.No.62. I wished I could have changed what happened.
Q.No.70. I thought about fantastic and unreal things that
made me feel better.
7.Self Criticism Q.No.7. I told myself that , if I wasn’t so careless things like
this wouldn’t happen
Q.No.15. I realized that I brought the problem on myself
Q.No.31. I criticized myself for what happened.
Q.No.47. I realized that I was personally responsible for my
difficulties and really lectured myself.
Q.No.55. I kicked myself for letting things happen.
Q.No.63. It was my mistake and I needed to suffer my
consequences.
Q.No.71. I told myself how stupid I was.
8.Social Withdrawal Q.No.8. I tried to keep my feelings to myself
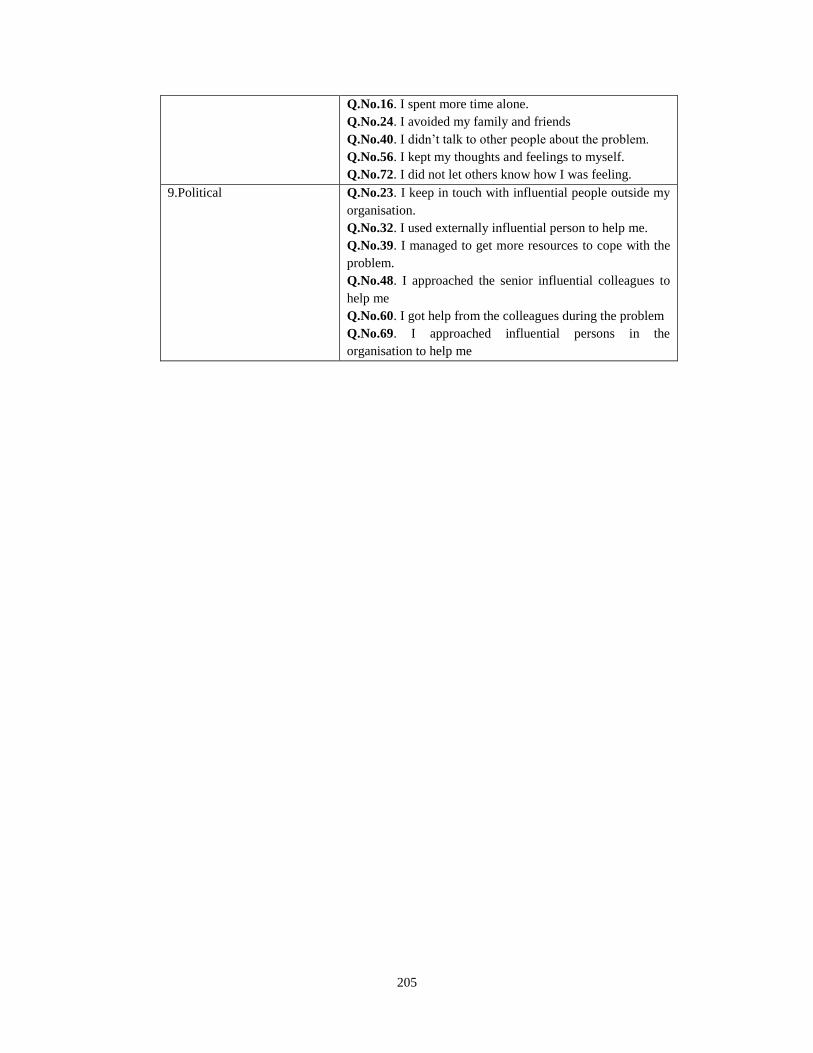
205
Q.No.16. I spent more time alone.
Q.No.24. I avoided my family and friends
Q.No.40. I didn’t talk to other people about the problem.
Q.No.56. I kept my thoughts and feelings to myself.
Q.No.72. I did not let others know how I was feeling.
9.Political Q.No.23. I keep in touch with influential people outside my
organisation.
Q.No.32. I used externally influential person to help me.
Q.No.39. I managed to get more resources to cope with the
problem.
Q.No.48. I approached the senior influential colleagues to
help me
Q.No.60. I got help from the colleagues during the problem
Q.No.69. I approached influential persons in the
organisation to help me
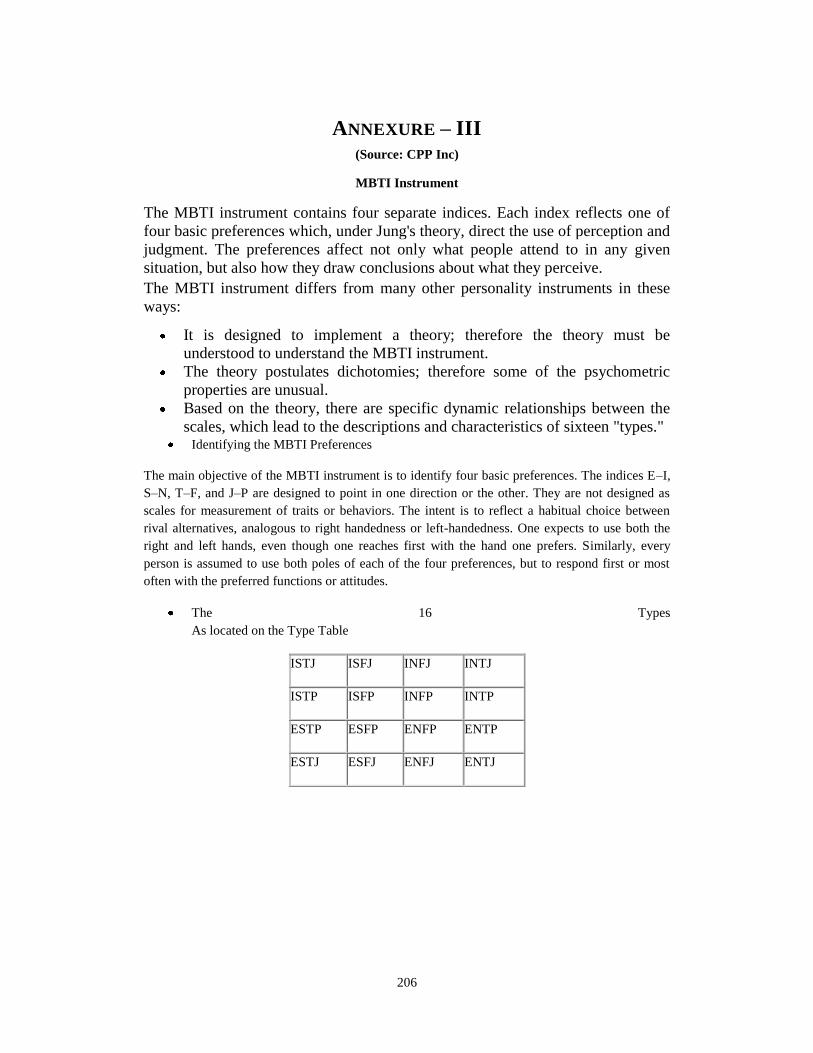
206
ANNEXURE – III (Source: CPP Inc)
MBTI Instrument
The MBTI instrument contains four separate indices. Each index reflects one of
four basic preferences which, under Jung's theory, direct the use of perception and
judgment. The preferences affect not only what people attend to in any given
situation, but also how they draw conclusions about what they perceive.
The MBTI instrument differs from many other personality instruments in these
ways:
It is designed to implement a theory; therefore the theory must be
understood to understand the MBTI instrument.
The theory postulates dichotomies; therefore some of the psychometric
properties are unusual.
Based on the theory, there are specific dynamic relationships between the
scales, which lead to the descriptions and characteristics of sixteen "types." Identifying the MBTI Preferences
The main objective of the MBTI instrument is to identify four basic preferences. The indices E–I,
S–N, T–F, and J–P are designed to point in one direction or the other. They are not designed as
scales for measurement of traits or behaviors. The intent is to reflect a habitual choice between
rival alternatives, analogous to right handedness or left-handedness. One expects to use both the
right and left hands, even though one reaches first with the hand one prefers. Similarly, every
person is assumed to use both poles of each of the four preferences, but to respond first or most
often with the preferred functions or attitudes.
The 16 Types
As located on the Type Table
ISTJ ISFJ INFJ INTJ
ISTP ISFP INFP INTP
ESTP ESFP ENFP ENTP
ESTJ ESFJ ENFJ ENTJ
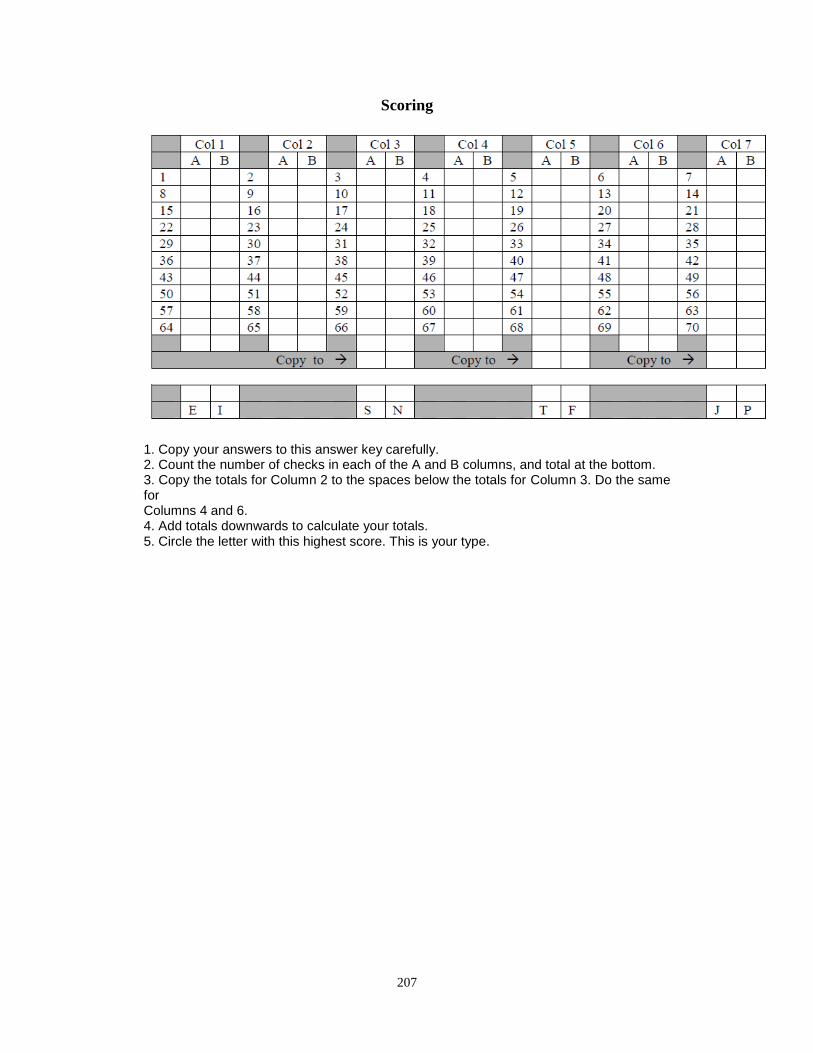
207
Scoring
1. Copy your answers to this answer key carefully. 2. Count the number of checks in each of the A and B columns, and total at the bottom. 3. Copy the totals for Column 2 to the spaces below the totals for Column 3. Do the same for Columns 4 and 6. 4. Add totals downwards to calculate your totals. 5. Circle the letter with this highest score. This is your type.
208
ANNEXURE – IV Definition of 16 Personality Traits
(Source: Centre for Application of Psychological Test)
(url: https://www.capt.org)
Jung's Theory of Psychological Types and the MBTI® Instrument
"The purpose of the Myers-Briggs Type Indicator® is to make the theory of psychological types
described by C. G. Jung (1921/1971) understandable and useful in people's lives. The essence of
the theory is that much seemingly random variation in behavior is actually quite orderly and
consistent, being due to basic differences in the way individuals prefers to use their perception and
judgment."
Extraversion–Introversion (E–I)
The E–I index is designed to reflect whether a person is an extravert or an introvert in the sense
intended by Jung. Jung regarded extraversion and introversion as "mutually complementary"
attitudes whose differences "generate the tension that both the individual and society need for the
maintenance of life." Extraverts are oriented primarily toward the outer world; thus they tend to
focus their perception and judgment on people and objects. Introverts are oriented primarily
toward the inner world; thus they tend to focus their perception and judgment upon concepts and
ideas.
Sensing–Intuition (S–N)
The S–N index is designed to reflect a person's preference between two opposite ways of
perceiving; one may rely primarily upon the process of sensing (S), which reports observable facts
or happenings through one or more of the five senses; or one may rely upon the less obvious
process of intuition (N), which reports meanings, relationships and/or possibilities that have been
worked out beyond the reach of the conscious mind.
Thinking–Feeling (T–F)
The T–F index is designed to reflect a person's preference between two contrasting ways of
judgment. A person may rely primarily through thinking (T) to decide impersonally on the basis of
logical consequences, or a person may rely primarily on feelings (F) to decide primarily on the
basis of personal or social values.
Judgment–Perception (J–P)
The J–P index is designed to describe the process a person uses primarily in dealing with the outer
world, that is, with the extraverted part of life. A person who prefers judgment (J) has reported a
preference for using a judgment process (either thinking or feeling) for dealing with the outer
world. A person who prefers perception (P) has reported a preference for using a perceptive
process (either S or N) for dealing with the outer world.
Index Preferences
209
Between E–I
E Extraversion or I Introversion - Affects Choices as to whether to direct perception judgment
mainly on the outer world (E) or mainly on the inner world of ideas.
Between S–N
S Sensing perception or N Intuitive perception - Affects Choices as to which kind of perception
is preferred when one needs or wishes to perceive
Between T–F
T Thinking judgment or F Feeling judgment - Affects Choices as to which kind of judgment to
trust when one needs or wishes to make a decision
Between J–P
J Judgment or P Perception - Affects Choices as to whether to deal with the outer world in
judging (J) attitude (using T or F) or in the perceptive (P) attitude (using S or N)
The Sixteen Types
According to theory, by definition, one pole of each of the four preferences is preferred over the
other pole for each of the sixteen MBTI types. The preferences on each index are independent of
preferences for the other three indices, so that the four indices yield sixteen possible combinations
called "types," denoted by the four letters of the preferences (e.g., ESTJ, INFP). The theory
postulates specific dynamic relationships between the preferences. For each type, one process is
the leading or dominant process and a second process serves as an auxiliary. Each type has its
own pattern of dominant and auxiliary processes and the attitudes (E or I) in which these are
habitually used. The characteristics of each type follow from the dynamic interplay of these
processes and attitudes.
Processes and attitudes
Attitudes refer to extraversion (E) or introversion (I).
Processes of perception are sensing (S) and intuition (N).
Processes of judgment are thinking (T) and feeling (F).
The style of dealing with the outside world is shown by judgment (J) or perception (P).
In terms of the theory, people may reasonably be expected to develop greater skill with the
processes they prefer to use and with the attitudes in which they prefer to use these processes. For
example, if they prefer the extraverted attitude (E), they are likely to be more mature and effective
in dealing with the world around them than with the inner world of concepts and ideas. If they
prefer the perceptive process of sensing (S), they are likely to be more effective in perceiving facts
and realities than theories and possibilities, which are in the sphere of intuition. If they prefer the
judgment process of thinking (T), they are likely to have better developed Thinking judgments
than feeling judgments. And if they prefer to use judgment (J) rather than perception (P) in their
attitude to the world around them, they are likely to be better organizing the events of their lives
than they are to experiencing and adapting to them. On the other hand, if a person prefers
210
introversion, intuition, feeling, and the perceptive attitude (INFP), then the converse of the
description above is likely to be true.
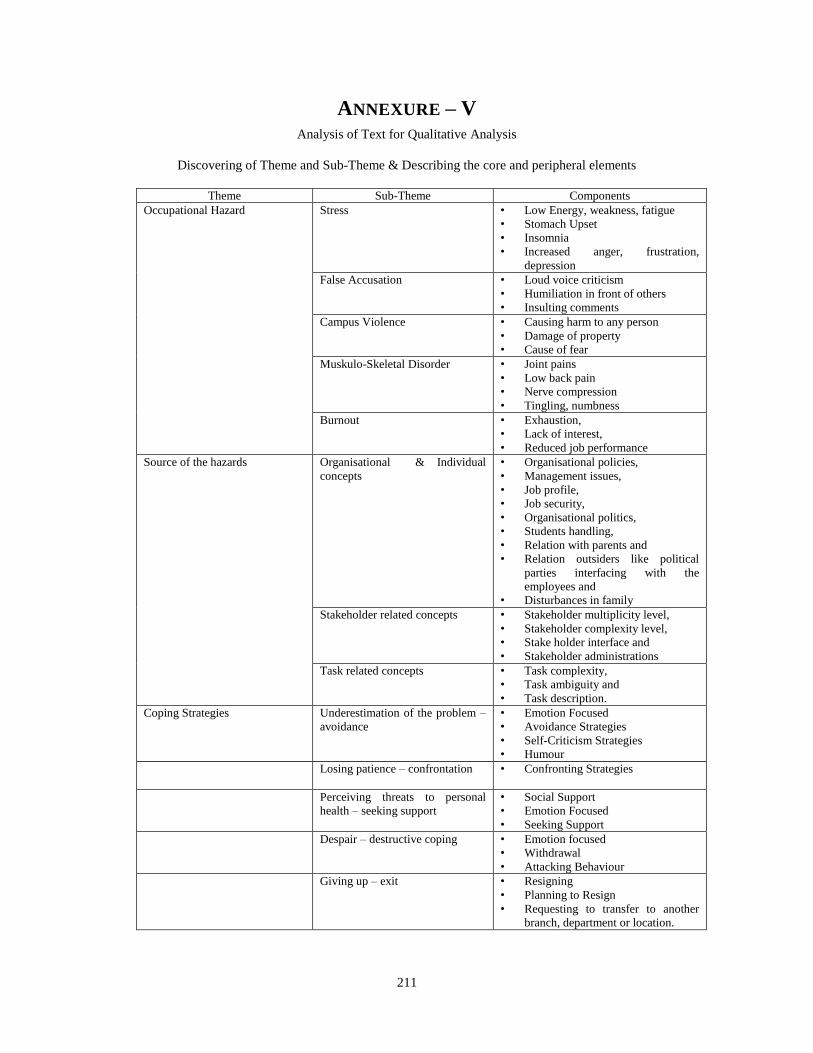
211
ANNEXURE – V Analysis of Text for Qualitative Analysis
Discovering of Theme and Sub-Theme & Describing the core and peripheral elements
Theme Sub-Theme Components
Occupational Hazard Stress • Low Energy, weakness, fatigue
• Stomach Upset
• Insomnia
• Increased anger, frustration,
depression
False Accusation • Loud voice criticism
• Humiliation in front of others
• Insulting comments
Campus Violence • Causing harm to any person
• Damage of property
• Cause of fear
Muskulo-Skeletal Disorder • Joint pains
• Low back pain
• Nerve compression
• Tingling, numbness
Burnout • Exhaustion,
• Lack of interest,
• Reduced job performance
Source of the hazards Organisational & Individual
concepts
• Organisational policies,
• Management issues,
• Job profile,
• Job security,
• Organisational politics,
• Students handling,
• Relation with parents and
• Relation outsiders like political
parties interfacing with the
employees and
• Disturbances in family
Stakeholder related concepts • Stakeholder multiplicity level,
• Stakeholder complexity level,
• Stake holder interface and
• Stakeholder administrations
Task related concepts • Task complexity,
• Task ambiguity and
• Task description.
Coping Strategies Underestimation of the problem –
avoidance
• Emotion Focused
• Avoidance Strategies
• Self-Criticism Strategies
• Humour
Losing patience – confrontation
• Confronting Strategies
Perceiving threats to personal
health – seeking support
• Social Support
• Emotion Focused
• Seeking Support
Despair – destructive coping
• Emotion focused
• Withdrawal
• Attacking Behaviour
Giving up – exit • Resigning
• Planning to Resign
• Requesting to transfer to another
branch, department or location.
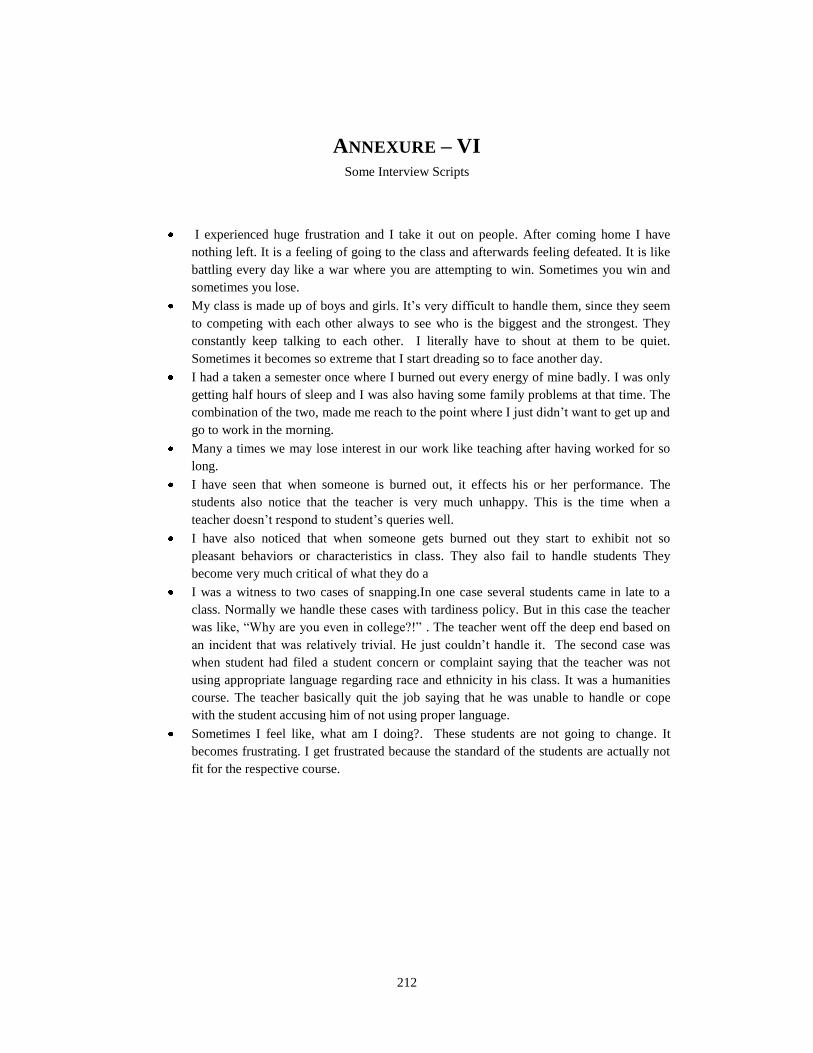
212
ANNEXURE – VI Some Interview Scripts
I experienced huge frustration and I take it out on people. After coming home I have
nothing left. It is a feeling of going to the class and afterwards feeling defeated. It is like
battling every day like a war where you are attempting to win. Sometimes you win and
sometimes you lose.
My class is made up of boys and girls. It’s very difficult to handle them, since they seem
to competing with each other always to see who is the biggest and the strongest. They
constantly keep talking to each other. I literally have to shout at them to be quiet.
Sometimes it becomes so extreme that I start dreading so to face another day.
I had a taken a semester once where I burned out every energy of mine badly. I was only
getting half hours of sleep and I was also having some family problems at that time. The
combination of the two, made me reach to the point where I just didn’t want to get up and
go to work in the morning.
Many a times we may lose interest in our work like teaching after having worked for so
long.
I have seen that when someone is burned out, it effects his or her performance. The
students also notice that the teacher is very much unhappy. This is the time when a
teacher doesn’t respond to student’s queries well.
I have also noticed that when someone gets burned out they start to exhibit not so
pleasant behaviors or characteristics in class. They also fail to handle students They
become very much critical of what they do a
I was a witness to two cases of snapping.In one case several students came in late to a
class. Normally we handle these cases with tardiness policy. But in this case the teacher
was like, “Why are you even in college?!” . The teacher went off the deep end based on
an incident that was relatively trivial. He just couldn’t handle it. The second case was
when student had filed a student concern or complaint saying that the teacher was not
using appropriate language regarding race and ethnicity in his class. It was a humanities
course. The teacher basically quit the job saying that he was unable to handle or cope
with the student accusing him of not using proper language.
Sometimes I feel like, what am I doing?. These students are not going to change. It
becomes frustrating. I get frustrated because the standard of the students are actually not
fit for the respective course.


![Emotional Feeling, Coping Strategies and Apathy in Amyotrophic … · 2017. 1. 27. · Coping with Health Injuries and Problems (CHIP) [22,23], assesses several coping strategies](https://img.pdfslide.us/doc/110x75/6042c8f4159a7b45501045b4/emotional-feeling-coping-strategies-and-apathy-in-amyotrophic-2017-1-27-coping.jpg)