Embed Size (px)
Citation preview
8/11/2019 Analysis of Condenser Shell Side Pressure Drop Based on the Mechanical Energy Loss
http://slidepdf.com/reader/full/analysis-of-condenser-shell-side-pressure-drop-based-on-the-mechanical-energy 1/8
© The Author(s) 2012. This article is published with open access at Springerlink.com csb.scichina.com www.springer.com/scp
*Corresponding author (email: [email protected])
rti le
Calorifics December 2012 Vol.57 No.36: 47184725
doi: 10.1007/s11434-012-5558-4
Analysis of condenser shell side pressure drop based on
the mechanical energy loss
ZENG Hui, MENG JiAn & LI ZhiXin*
Key Laboratory of Thermal Science and Power Engineering of Ministry of Education, School of Aerospace, Tsinghua University,
Beijing 100084, China
Received May 16, 2012; accepted July 13, 2012
The condenser performance is strongly affected by the tube arrangement. The steam pressure drop in the tube bundle influences
the condenser back pressure, which is an important indicator of the condenser performance used to compare different condenser
tube arrangements. The condenser shell side pressure drop is studied here using the mechanical energy loss of the steam flow in
the condensers. The mechanical energy loss is due to the flow resistance of the tube bundle and the steam condensation. Three
typical tube arrangements are analyzed numerically. The results show that a higher condenser shell side pressure drop for different
tube arrangements always corresponds to a larger mechanical energy loss. The mechanical energy loss is mainly in the periphery
of the tube bundle, indicating that the flow pattern and the mechanical energy losses are markedly determined by the tube bundle
profile. The condenser shell side pressure drop can be reduced by reducing the total mechanical energy loss when the steam enters
the tube bundle more uniformly. Thus, a well designed tube arrangement will reduce the mechanical energy loss, and also the
shell side pressure drop.
power plant condenser, tube arrangement, shell side pressure drop, mechanical energy loss
Citation: Zeng H, Meng J A, Li Z X. Analysis of condenser shell side pressure drop based on the mechanical energy loss. Chin Sci Bull, 2012, 57: 47184725,
doi: 10.1007/s11434-012-5558-4
Condensers, normally complex shell-and-tube heat exchang-
ers, are the most important auxiliary equipments in a power
plant. The thermal efficiency of power unit strongly de-
pends on the condenser back pressure. A condenser has a
large number of cooling tubes. For example, a condenser for
a 300 MW unit has approximately 20000 cooling tubes. The
condenser performance is then highly dependent on the tube
arrangement. The shell side pressure drop in the tube bundleis an important indicator of the condenser performance,
which can be used to compare different condenser tube ar-
rangements.
Power plant condenser designs are traditionally based on
recommendations from previous designs and experimental
results, often based on the standards developed by the Heat
Exchange Institute (HEI Standards) [1]. However, this
method does not take a number of factors into account, in-
cluding the tube arrangement. Numerical simulations of the
fluid flow and heat transfer in condensers have been con-
ducted by many researchers [2–10], with predictions agree-
ing well with experimental data. The advantage of numerical
simulations is that they can give more detailed information
on the fluid flow and heat transfer in the condenser, which
provides a more effective means for condenser design.
However, there is still a lack of a good optimization methodfor the tube arrangement, which can improve the condenser
performance by reducing the shell side pressure drop.
Guo et al. [11] recently introduced a new physical quan-
tity, entransy, for optimizing heat transfer processes, which
describes the heat transfer ability of a body. The heat con-
duction equation is multiplied by the temperature to get an
entransy balance equation, with (T )2 as the entransy dis-
sipation rate. The entransy dissipation rate is a measure of
the irreversibility of a heat transfer process. Then, Guo et al.
[11] proposed the extremum entransy dissipation principle
8/11/2019 Analysis of Condenser Shell Side Pressure Drop Based on the Mechanical Energy Loss
http://slidepdf.com/reader/full/analysis-of-condenser-shell-side-pressure-drop-based-on-the-mechanical-energy 2/8
Zeng H, et al . Chin Sci Bull December (2012) Vol.57 No.36 4719
for optimizing heat transfer processes where the extremum
entransy dissipation corresponds to the optimal heat transfer
performance when a thermodynamic cycle is not involved.
This new principle has been applied to optimizing heat
conduction [11–19], convective heat transfer [20–23], ther-
mal radiation [24] processes and the heat transfer in heat
exchanger [25–33], with all the studies confirming that the
optimal results can be obtained based on the extremum en-
transy dissipation principle.
Chen et al. [34–36] analyzed the heat, mass and momen-
tum transfer to extend the entransy concept to convective
mass transfer and fluid flow processes. The mass entransy
and momentum entransy dissipations were defined for op-
timizing convective mass transfer and fluid flow processes.
The momentum entransy dissipation is equivalent to the
mechanical energy loss during a fluid flow process.
In order to improve the condenser performance, this
study analyzes the condenser shell side pressure drop based
on the mechanical energy loss for the steam flow. Threetypical tube arrangements are taken into consideration to
study the impact of the tube arrangement on the condenser
shell side pressure drop.
1 Physical model
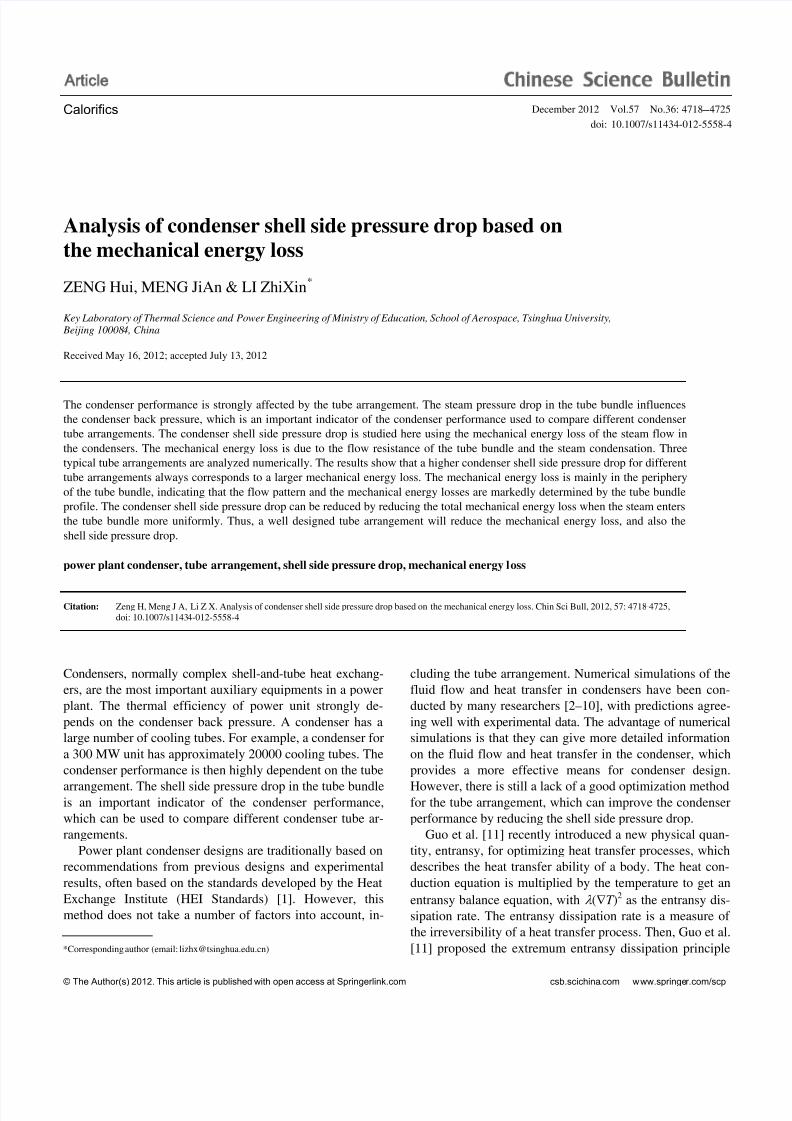
Figure 1 shows the entire cross section of a condenser with
the cap-shaped tube arrangement. The shell side of the con-
denser can be divided into two distinct flow regions, one is
the tube bundle region where the cooling tubes are densely
positioned, and the other is the free flow region. The steamexhaust from the turbine enters the condenser from the top
and flows through the tube bundle to condense. The non-
condensable gases (mainly air) and the non-condensed
steam are extracted by the vents in the centre of each tube
bundle. Baffles guide the steam flow. Some tube arrange-
ments have an independent tube bundle in front of the vent,
which is called air cooling region.
Figure 1 Condenser cross-section.
As in previous studies, the shell side of the condenser is
modeled as a porous medium. An isotropic porosity, , is
defined as the ratio of the volume occupied by the fluid to
the total volume. In the present work, = f =1 in the free flow
region, and in the tube bundle region, where the tubes are
laid out in an equilateral triangular pattern, = t, it is set to
2
o
t
t
1 ,2 3
D
P
(1)
where Do is the tube outer diameter and Pt is the tube pitch.
The complex shell side flow in the condenser is simpli-
fied as a two dimensional gas (a mixture of steam and air)
flow through a porous medium. The two-dimensional steady-
state governing equations for mass, momentum, and the air
mass fraction in the Cartesian coordinate system are as fol-
lows [6].
Mass conservation equation for the steam and air mixture:
;u v m x y
(2)
Momentum conservation equations for the steam and air
mixture:
t t,
u
uu vu x y
u u Pmu F
x x y y x
(3)
t t;
v
uv vv x y
v v Pmv F
x x y y y
(4)
Conservation of air mass fraction:
a a
a a
t t ,
uY vY x y
Y Y D D D D
x x y y
(5)
where m is the steam condensate rate per unit volume, F u
and F v are the flow resistance force components in the x and
y directions due to the tube bundle, is the dynamic viscos-
ity, D is the diffusivity of air in the vapor, t is the turbulent
dynamic viscosity, Dt is the turbulent diffusivity of air in the
vapor, and Y a is the air mass fraction.
2 Mechanical energy loss for the condenser
shell side flow
The expression of the mechanical energy loss can be derived
8/11/2019 Analysis of Condenser Shell Side Pressure Drop Based on the Mechanical Energy Loss
http://slidepdf.com/reader/full/analysis-of-condenser-shell-side-pressure-drop-based-on-the-mechanical-energy 3/8
4720 Zeng H, et al . Chin Sci Bull December (2012) Vol.57 No.36
from the governing equations. The porosities in both the
tube bundle region and the free flow region are uniform and
change only at the interface between the two regions, so the
mechanical energy dissipation caused by the porosity varia-
tion is neglected. Multiplying eqs. (3) and (4) by the veloc-
ity components u and v respectively gives
t t
2
,u
u uu u vu x y
u u Pu u u
x x y y x
mu F u
(6)
t t
2
.v
v uv v vv x y
v v Pv v v
x x y y y
mv F v
(7)
Combining eqs. (6) and (7) and make some transfor-
mations, and substituting eq. (2) into it yields
2 2 2 2
2 2
1 1
2 2
1,
2u v
Puu u v v u v
x y x
Pv
y
Pm u v m F u F v
(8)
where is the viscous dissipation function, which is ex-
pressed as
2 22
t2 2 .
u v u v
x y y x
(9)
Integrating eq. (8) over the whole flow region and using
Gauss’ rule gives
2 2
2 2
1d d
2
1 d .2
A A
u vV
u v ui vj n A P ui vj n A
P m u v m F u F v V
(10)
Eq. (10) is the mechanical energy conservation equation
for the condenser shell side flow. The left side of eq. (10) is
the mechanical energy transport through the boundary, and
the right side is the mechanical energy loss during the fluid
flow.
Since most of the steam will condense in the condenser,
the mechanical energy transport through the vents can be
neglected. Thus, the mechanical energy conservation equa-
tion can be simplified to
2
i i
2 2
1
2
1d ,
2
i
u vV
PU Q
Pm u v m F u F v V
(11)where U i and Qi are the inlet velocity and mass flow rate
determined by the condenser operating conditions. Pi is the
inlet pressure.
The absolute pressure in eq. (11) can be changed to a rel-
ative pressure with the vent pressure, Po, as the reference:
o.P P P (12)
The relative inlet pressure,iP , is then equal to the shell
side pressure drop, P. Then eq. (11) can be written as
2i i
2 2
12
1d .
2u v
V
PU Q
Pm u v m F u F v V
(13)
The physical meanings of each term in the mechanical
energy conservation equation, eq. (13), are
2
i i
1
2U Q , the kinetic energy input through the inlet;
i
PQ
, the potential energy input through the inlet;
dV
Pm V
, the potential energy loss due to the
steam condensation in the tube bundle region;
2 21d
2V
u v m V , the kinetic energy loss due to
the steam condensation in the tube bundle region;
du v
V
F u F v V , the mechanical energy loss due
to the flow resistance in the tube bundle region;
dV
V
, the mechanical energy loss due to viscous
dissipation in the free flow region.
Because there is steam condensation during the fluid
flow process, the total mechanical energy loss consists of
not only the mechanical energy loss due to the flow re-
sistance, but also the mechanical energy loss due to the
steam condensation.
Based on eq. (13), the total mechanical energy input, E i,
and the total mechanical energy loss rate, e, can be defined
as
2
i i
1,
2
PE U Q
(14)
8/11/2019 Analysis of Condenser Shell Side Pressure Drop Based on the Mechanical Energy Loss
http://slidepdf.com/reader/full/analysis-of-condenser-shell-side-pressure-drop-based-on-the-mechanical-energy 4/8
Zeng H, et al . Chin Sci Bull December (2012) Vol.57 No.36 4721
e ed ,
V
V (15)
where
2 2
e
1
2
u v
Pm u v m F u F v
(16)
is the mechanical energy loss rate.
In eq. (13), U i and Qi are fixed values for the given oper-
ating conditions, indicating that the condenser shell side
pressure drop can be measured by the mechanical energy
loss. The mechanical energy loss is related to the tube ar-
rangement, so it provides a way to study the impact of the
tube arrangement on the condenser shell side pressure drop.
3 Numerical analyses of typical tube arrange-
ments
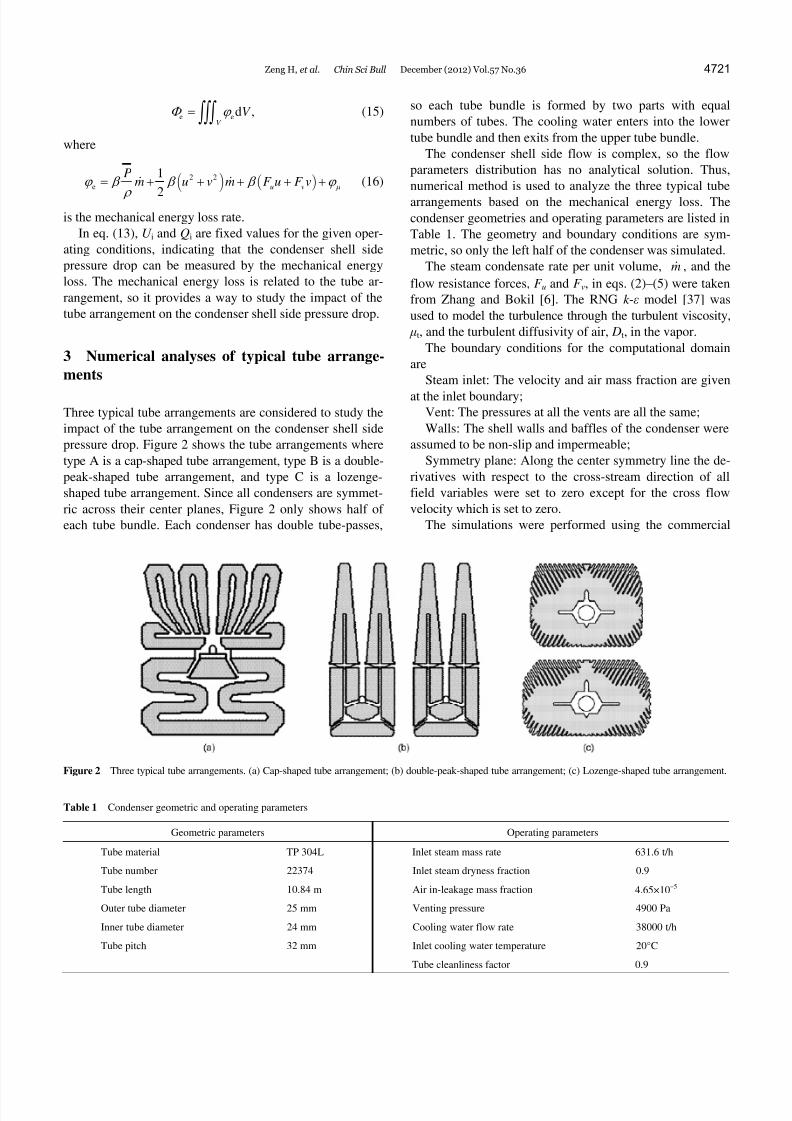
Three typical tube arrangements are considered to study the
impact of the tube arrangement on the condenser shell side
pressure drop. Figure 2 shows the tube arrangements where
type A is a cap-shaped tube arrangement, type B is a double-
peak-shaped tube arrangement, and type C is a lozenge-
shaped tube arrangement. Since all condensers are symmet-
ric across their center planes, Figure 2 only shows half of
each tube bundle. Each condenser has double tube-passes,
so each tube bundle is formed by two parts with equal
numbers of tubes. The cooling water enters into the lower
tube bundle and then exits from the upper tube bundle.
The condenser shell side flow is complex, so the flow
parameters distribution has no analytical solution. Thus,
numerical method is used to analyze the three typical tube
arrangements based on the mechanical energy loss. The
condenser geometries and operating parameters are listed in
Table 1. The geometry and boundary conditions are sym-
metric, so only the left half of the condenser was simulated.
The steam condensate rate per unit volume, m , and the
flow resistance forces, F u and F v, in eqs. (2)–(5) were taken
from Zhang and Bokil [6]. The RNG k -ε model [37] was
used to model the turbulence through the turbulent viscosity,
μt, and the turbulent diffusivity of air, Dt, in the vapor.
The boundary conditions for the computational domain
are
Steam inlet: The velocity and air mass fraction are given
at the inlet boundary;Vent: The pressures at all the vents are all the same;
Walls: The shell walls and baffles of the condenser were
assumed to be non-slip and impermeable;
Symmetry plane: Along the center symmetry line the de-
rivatives with respect to the cross-stream direction of all
field variables were set to zero except for the cross flow
velocity which is set to zero.
The simulations were performed using the commercial
Figure 2 Three typical tube arrangements. (a) Cap-shaped tube arrangement; (b) double-peak-shaped tube arrangement; (c) Lozenge-shaped tube arrangement.
Table 1 Condenser geometric and operating parameters
Geometric parameters Operating parameters
Tube material TP 304L Inlet steam mass rate 631.6 t/h
Tube number 22374 Inlet steam dryness fraction 0.9
Tube length 10.84 m Air in-leakage mass fraction 4.65×10⁵
Outer tube diameter 25 mm Venting pressure 4900 Pa
Inner tube diameter 24 mm Cooling water flow rate 38000 t/h
Tube pitch 32 mm Inlet cooling water temperature 20°C
Tube cleanliness factor 0.9
8/11/2019 Analysis of Condenser Shell Side Pressure Drop Based on the Mechanical Energy Loss
http://slidepdf.com/reader/full/analysis-of-condenser-shell-side-pressure-drop-based-on-the-mechanical-energy 5/8
4722 Zeng H, et al . Chin Sci Bull December (2012) Vol.57 No.36
software FLUENT 6.2. The discretization used the SIMPLEC
algorithm with the QUICK scheme.
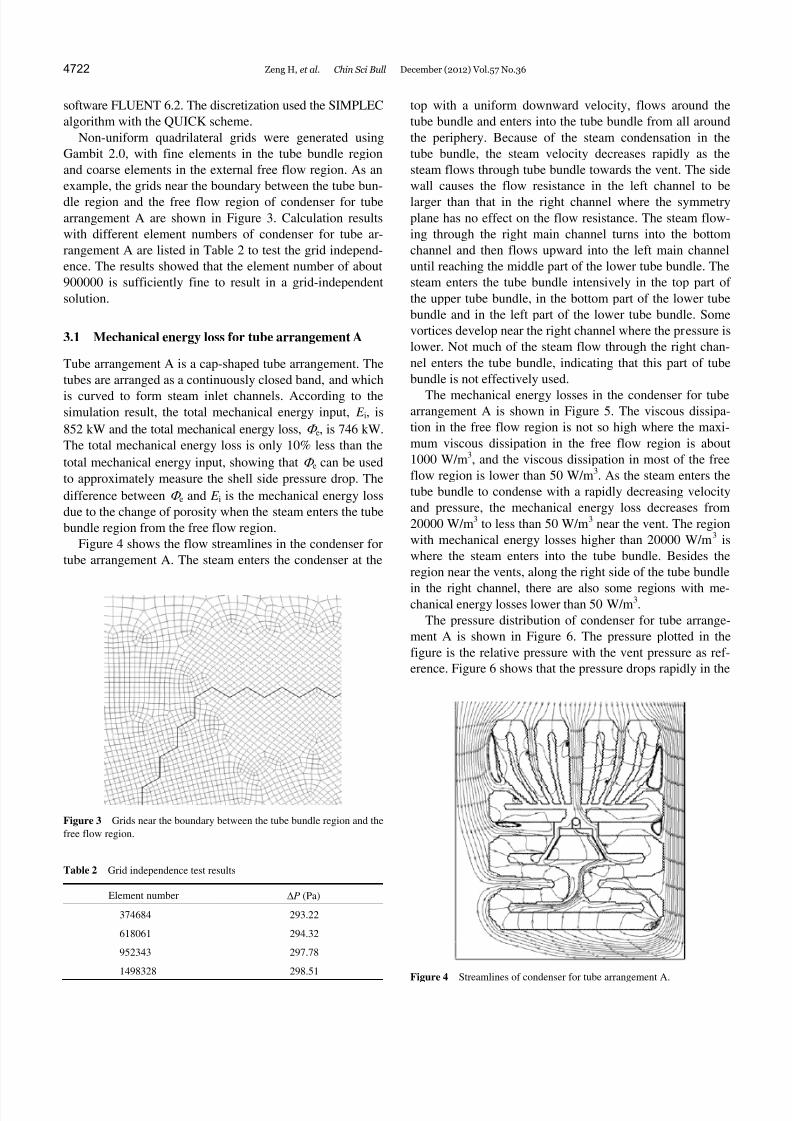
Non-uniform quadrilateral grids were generated using
Gambit 2.0, with fine elements in the tube bundle region
and coarse elements in the external free flow region. As an
example, the grids near the boundary between the tube bun-
dle region and the free flow region of condenser for tube
arrangement A are shown in Figure 3. Calculation results
with different element numbers of condenser for tube ar-
rangement A are listed in Table 2 to test the grid independ-
ence. The results showed that the element number of about
900000 is sufficiently fine to result in a grid-independent
solution.
3.1 Mechanical energy loss for tube arrangement A
Tube arrangement A is a cap-shaped tube arrangement. The
tubes are arranged as a continuously closed band, and which
is curved to form steam inlet channels. According to thesimulation result, the total mechanical energy input, E i, is
852 kW and the total mechanical energy loss, e, is 746 kW.
The total mechanical energy loss is only 10% less than the
total mechanical energy input, showing that e can be used
to approximately measure the shell side pressure drop. The
difference between e and E i is the mechanical energy loss
due to the change of porosity when the steam enters the tube
bundle region from the free flow region.
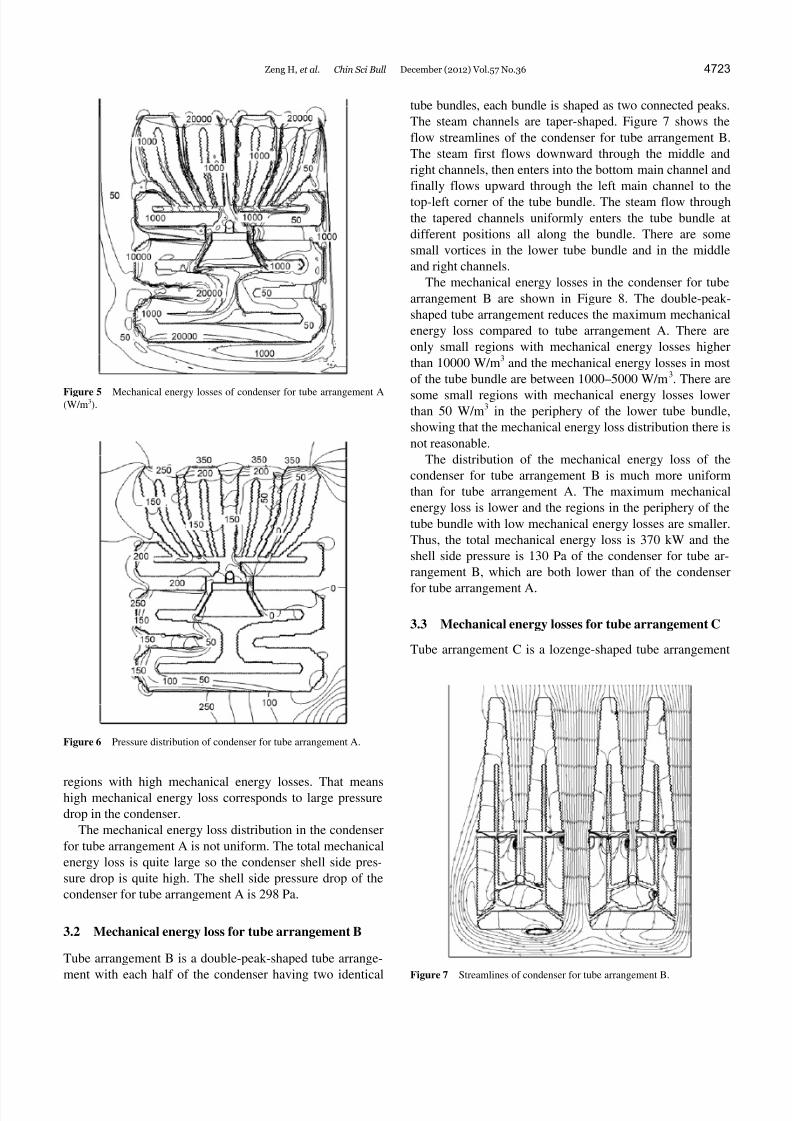
Figure 4 shows the flow streamlines in the condenser for
tube arrangement A. The steam enters the condenser at the
Figure 3 Grids near the boundary between the tube bundle region and the
free flow region.
Table 2 Grid independence test results
Element number P (Pa)
374684 293.22
618061 294.32
952343 297.78
1498328 298.51
top with a uniform downward velocity, flows around the
tube bundle and enters into the tube bundle from all around
the periphery. Because of the steam condensation in the
tube bundle, the steam velocity decreases rapidly as the
steam flows through tube bundle towards the vent. The side
wall causes the flow resistance in the left channel to be
larger than that in the right channel where the symmetry
plane has no effect on the flow resistance. The steam flow-
ing through the right main channel turns into the bottom
channel and then flows upward into the left main channel
until reaching the middle part of the lower tube bundle. The
steam enters the tube bundle intensively in the top part of
the upper tube bundle, in the bottom part of the lower tube
bundle and in the left part of the lower tube bundle. Some
vortices develop near the right channel where the pressure is
lower. Not much of the steam flow through the right chan-
nel enters the tube bundle, indicating that this part of tube
bundle is not effectively used.
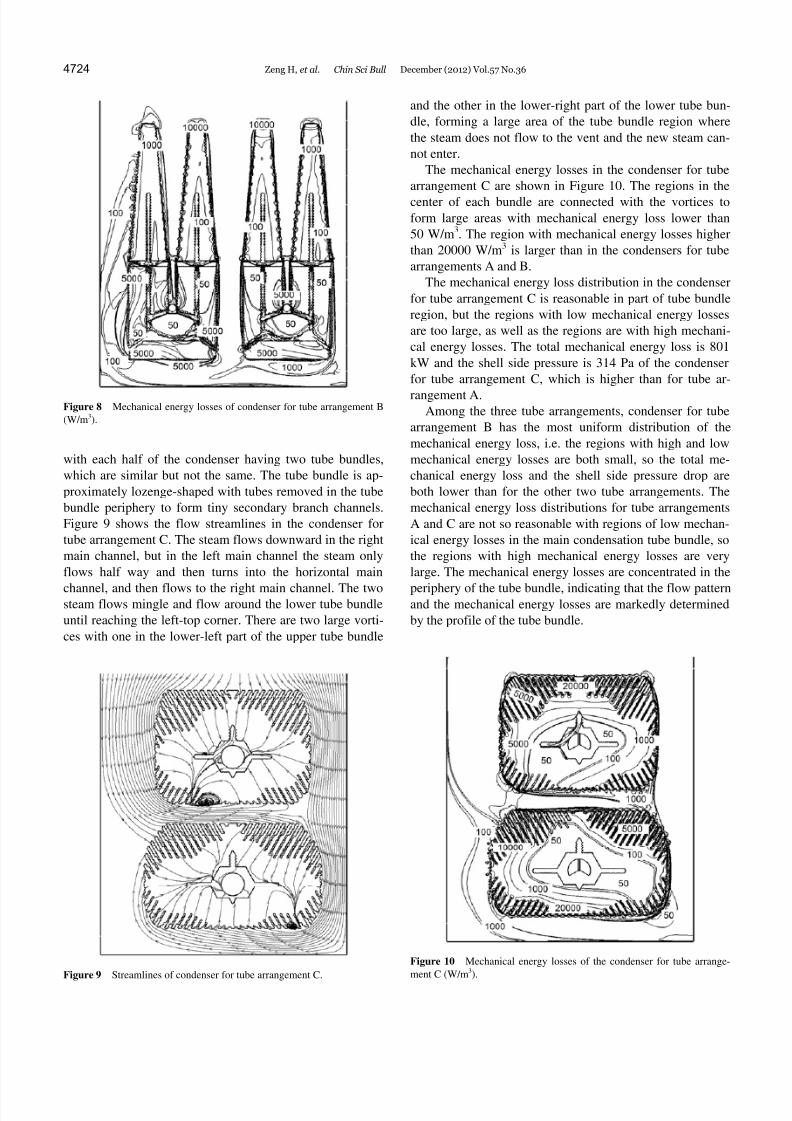
The mechanical energy losses in the condenser for tubearrangement A is shown in Figure 5. The viscous dissipa-
tion in the free flow region is not so high where the maxi-
mum viscous dissipation in the free flow region is about
1000 W/m3, and the viscous dissipation in most of the free
flow region is lower than 50 W/m3. As the steam enters the
tube bundle to condense with a rapidly decreasing velocity
and pressure, the mechanical energy loss decreases from
20000 W/m3 to less than 50 W/m3 near the vent. The region
with mechanical energy losses higher than 20000 W/m3 is
where the steam enters into the tube bundle. Besides the
region near the vents, along the right side of the tube bundle
in the right channel, there are also some regions with me-chanical energy losses lower than 50 W/m3.
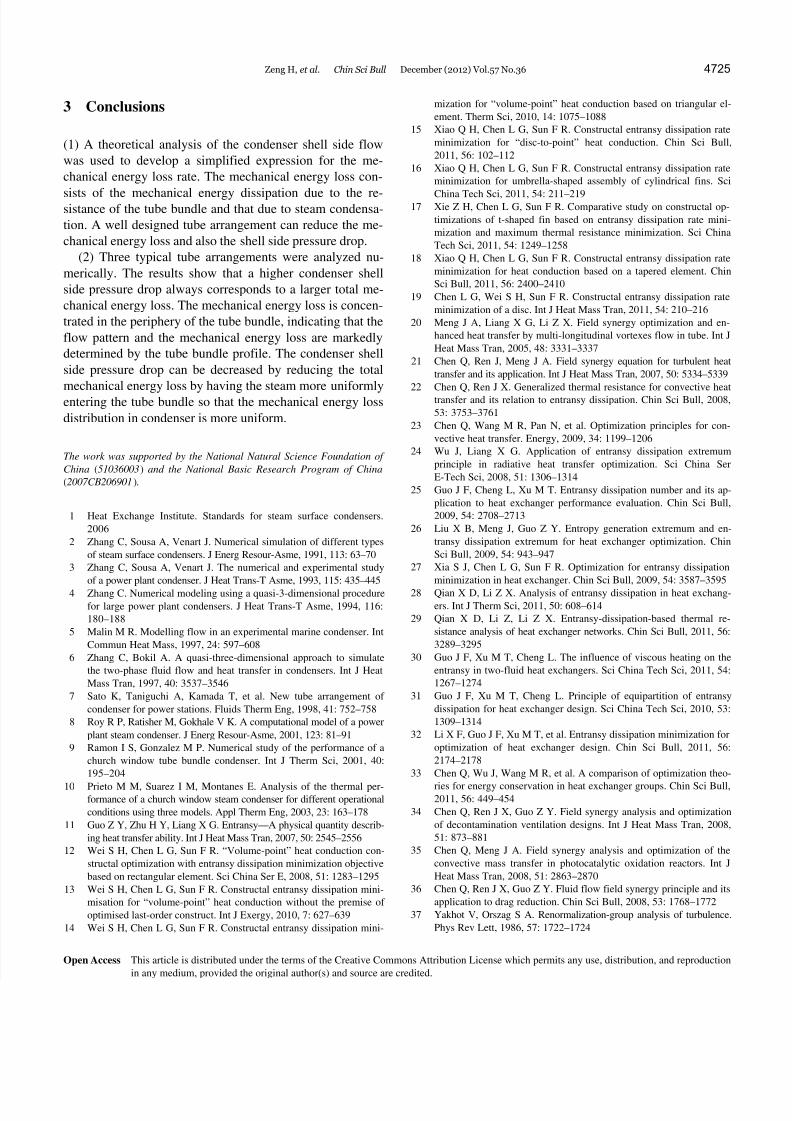
The pressure distribution of condenser for tube arrange-
ment A is shown in Figure 6. The pressure plotted in the
figure is the relative pressure with the vent pressure as ref-
erence. Figure 6 shows that the pressure drops rapidly in the
Figure 4 Streamlines of condenser for tube arrangement A.
8/11/2019 Analysis of Condenser Shell Side Pressure Drop Based on the Mechanical Energy Loss
http://slidepdf.com/reader/full/analysis-of-condenser-shell-side-pressure-drop-based-on-the-mechanical-energy 6/8
Zeng H, et al . Chin Sci Bull December (2012) Vol.57 No.36 4723
Figure 5 Mechanical energy losses of condenser for tube arrangement A(W/m3).
Figure 6 Pressure distribution of condenser for tube arrangement A.
regions with high mechanical energy losses. That meanshigh mechanical energy loss corresponds to large pressure
drop in the condenser.
The mechanical energy loss distribution in the condenser
for tube arrangement A is not uniform. The total mechanical
energy loss is quite large so the condenser shell side pres-
sure drop is quite high. The shell side pressure drop of the
condenser for tube arrangement A is 298 Pa.
3.2 Mechanical energy loss for tube arrangement B
Tube arrangement B is a double-peak-shaped tube arrange-
ment with each half of the condenser having two identical
tube bundles, each bundle is shaped as two connected peaks.
The steam channels are taper-shaped. Figure 7 shows the
flow streamlines of the condenser for tube arrangement B.
The steam first flows downward through the middle and
right channels, then enters into the bottom main channel and
finally flows upward through the left main channel to the
top-left corner of the tube bundle. The steam flow through
the tapered channels uniformly enters the tube bundle at
different positions all along the bundle. There are some
small vortices in the lower tube bundle and in the middle
and right channels.
The mechanical energy losses in the condenser for tube
arrangement B are shown in Figure 8. The double-peak-
shaped tube arrangement reduces the maximum mechanical
energy loss compared to tube arrangement A. There are
only small regions with mechanical energy losses higher
than 10000 W/m3 and the mechanical energy losses in most
of the tube bundle are between 1000–5000 W/m3. There are
some small regions with mechanical energy losses lowerthan 50 W/m3 in the periphery of the lower tube bundle,
showing that the mechanical energy loss distribution there is
not reasonable.
The distribution of the mechanical energy loss of the
condenser for tube arrangement B is much more uniform
than for tube arrangement A. The maximum mechanical
energy loss is lower and the regions in the periphery of the
tube bundle with low mechanical energy losses are smaller.
Thus, the total mechanical energy loss is 370 kW and the
shell side pressure is 130 Pa of the condenser for tube ar-
rangement B, which are both lower than of the condenser
for tube arrangement A.
3.3 Mechanical energy losses for tube arrangement C
Tube arrangement C is a lozenge-shaped tube arrangement
Figure 7 Streamlines of condenser for tube arrangement B.
8/11/2019 Analysis of Condenser Shell Side Pressure Drop Based on the Mechanical Energy Loss
http://slidepdf.com/reader/full/analysis-of-condenser-shell-side-pressure-drop-based-on-the-mechanical-energy 7/8
4724 Zeng H, et al . Chin Sci Bull December (2012) Vol.57 No.36
Figure 8 Mechanical energy losses of condenser for tube arrangement B
(W/m3).
with each half of the condenser having two tube bundles,
which are similar but not the same. The tube bundle is ap-
proximately lozenge-shaped with tubes removed in the tube
bundle periphery to form tiny secondary branch channels.
Figure 9 shows the flow streamlines in the condenser for
tube arrangement C. The steam flows downward in the right
main channel, but in the left main channel the steam only
flows half way and then turns into the horizontal main
channel, and then flows to the right main channel. The twosteam flows mingle and flow around the lower tube bundle
until reaching the left-top corner. There are two large vorti-
ces with one in the lower-left part of the upper tube bundle
Figure 9 Streamlines of condenser for tube arrangement C.
and the other in the lower-right part of the lower tube bun-
dle, forming a large area of the tube bundle region where
the steam does not flow to the vent and the new steam can-
not enter.
The mechanical energy losses in the condenser for tube
arrangement C are shown in Figure 10. The regions in the
center of each bundle are connected with the vortices to
form large areas with mechanical energy loss lower than
50 W/m3. The region with mechanical energy losses higher
than 20000 W/m3 is larger than in the condensers for tube
arrangements A and B.
The mechanical energy loss distribution in the condenser
for tube arrangement C is reasonable in part of tube bundle
region, but the regions with low mechanical energy losses
are too large, as well as the regions are with high mechani-
cal energy losses. The total mechanical energy loss is 801
kW and the shell side pressure is 314 Pa of the condenser
for tube arrangement C, which is higher than for tube ar-
rangement A.Among the three tube arrangements, condenser for tube
arrangement B has the most uniform distribution of the
mechanical energy loss, i.e. the regions with high and low
mechanical energy losses are both small, so the total me-
chanical energy loss and the shell side pressure drop are
both lower than for the other two tube arrangements. The
mechanical energy loss distributions for tube arrangements
A and C are not so reasonable with regions of low mechan-
ical energy losses in the main condensation tube bundle, so
the regions with high mechanical energy losses are very
large. The mechanical energy losses are concentrated in the
periphery of the tube bundle, indicating that the flow patternand the mechanical energy losses are markedly determined
by the profile of the tube bundle.
Figure 10 Mechanical energy losses of the condenser for tube arrange-
ment C (W/m3).
8/11/2019 Analysis of Condenser Shell Side Pressure Drop Based on the Mechanical Energy Loss
http://slidepdf.com/reader/full/analysis-of-condenser-shell-side-pressure-drop-based-on-the-mechanical-energy 8/8
Zeng H, et al . Chin Sci Bull December (2012) Vol.57 No.36 4725
3 Conclusions
(1) A theoretical analysis of the condenser shell side flow
was used to develop a simplified expression for the me-
chanical energy loss rate. The mechanical energy loss con-
sists of the mechanical energy dissipation due to the re-sistance of the tube bundle and that due to steam condensa-
tion. A well designed tube arrangement can reduce the me-
chanical energy loss and also the shell side pressure drop.
(2) Three typical tube arrangements were analyzed nu-
merically. The results show that a higher condenser shell
side pressure drop always corresponds to a larger total me-
chanical energy loss. The mechanical energy loss is concen-
trated in the periphery of the tube bundle, indicating that the
flow pattern and the mechanical energy loss are markedly
determined by the tube bundle profile. The condenser shell
side pressure drop can be decreased by reducing the total
mechanical energy loss by having the steam more uniformly
entering the tube bundle so that the mechanical energy loss
distribution in condenser is more uniform.
The work was supported by the National Natural Science Foundation of
China (51036003) and the National Basic Research Program of China
(2007CB206901).
1 Heat Exchange Institute. Standards for steam surface condensers.
2006
2 Zhang C, Sousa A, Venart J. Numerical simulation of different types
of steam surface condensers. J Energ Resour-Asme, 1991, 113: 63–70
3 Zhang C, Sousa A, Venart J. The numerical and experimental study
of a power plant condenser. J Heat Trans-T Asme, 1993, 115: 435–445
4 Zhang C. Numerical modeling using a quasi-3-dimensional procedure
for large power plant condensers. J Heat Trans-T Asme, 1994, 116:
180–188
5 Malin M R. Modelling flow in an experimental marine condenser. Int
Commun Heat Mass, 1997, 24: 597–608
6 Zhang C, Bokil A. A quasi-three-dimensional approach to simulate
the two-phase fluid flow and heat transfer in condensers. Int J Heat
Mass Tran, 1997, 40: 3537–3546
7 Sato K, Taniguchi A, Kamada T, et al. New tube arrangement of
condenser for power stations. Fluids Therm Eng, 1998, 41: 752–758
8 Roy R P, Ratisher M, Gokhale V K. A computational model of a power
plant steam condenser. J Energ Resour-Asme, 2001, 123: 81–91
9 Ramon I S, Gonzalez M P. Numerical study of the performance of a
church window tube bundle condenser. Int J Therm Sci, 2001, 40:
195–204
10 Prieto M M, Suarez I M, Montanes E. Analysis of the thermal per-formance of a church window steam condenser for different operational
conditions using three models. Appl Therm Eng, 2003, 23: 163–178
11 Guo Z Y, Zhu H Y, Liang X G. Entransy—A physical quantity describ-
ing heat transfer ability. Int J Heat Mass Tran, 2007, 50: 2545–2556
12 Wei S H, Chen L G, Sun F R. “Volume-point” heat conduction con-
structal optimization with entransy dissipation minimization objective
based on rectangular element. Sci China Ser E, 2008, 51: 1283–1295
13 Wei S H, Chen L G, Sun F R. Constructal entransy dissipation mini-
misation for “volume-point” heat conduction without the premise of
optimised last-order construct. Int J Exergy, 2010, 7: 627–639
14 Wei S H, Chen L G, Sun F R. Constructal entransy dissipation mini-
mization for “volume-point” heat conduction based on triangular el-
ement. Therm Sci, 2010, 14: 1075–1088
15 Xiao Q H, Chen L G, Sun F R. Constructal entransy dissipation rate
minimization for “disc-to-point” heat conduction. Chin Sci Bull,
2011, 56: 102–112
16 Xiao Q H, Chen L G, Sun F R. Constructal entransy dissipation rate
minimization for umbrella-shaped assembly of cylindrical fins. Sci
China Tech Sci, 2011, 54: 211–219
17 Xie Z H, Chen L G, Sun F R. Comparative study on constructal op-
timizations of t-shaped fin based on entransy dissipation rate mini-
mization and maximum thermal resistance minimization. Sci China
Tech Sci, 2011, 54: 1249–1258
18 Xiao Q H, Chen L G, Sun F R. Constructal entransy dissipation rate
minimization for heat conduction based on a tapered element. Chin
Sci Bull, 2011, 56: 2400–2410
19 Chen L G, Wei S H, Sun F R. Constructal entransy dissipation rate
minimization of a disc. Int J Heat Mass Tran, 2011, 54: 210–216
20 Meng J A, Liang X G, Li Z X. Field synergy optimization and en-
hanced heat transfer by multi-longitudinal vortexes flow in tube. Int J
Heat Mass Tran, 2005, 48: 3331–3337
21 Chen Q, Ren J, Meng J A. Field synergy equation for turbulent heat
transfer and its application. Int J Heat Mass Tran, 2007, 50: 5334–5339
22 Chen Q, Ren J X. Generalized thermal resistance for convective heat
transfer and its relation to entransy dissipation. Chin Sci Bull, 2008,
53: 3753–3761
23 Chen Q, Wang M R, Pan N, et al. Optimization principles for con-
vective heat transfer. Energy, 2009, 34: 1199–1206
24 Wu J, Liang X G. Application of entransy dissipation extremum
principle in radiative heat transfer optimization. Sci China Ser
E-Tech Sci, 2008, 51: 1306–1314
25 Guo J F, Cheng L, Xu M T. Entransy dissipation number and its ap-
plication to heat exchanger performance evaluation. Chin Sci Bull,
2009, 54: 2708–2713
26 Liu X B, Meng J, Guo Z Y. Entropy generation extremum and en-
transy dissipation extremum for heat exchanger optimization. Chin
Sci Bull, 2009, 54: 943–947
27 Xia S J, Chen L G, Sun F R. Optimization for entransy dissipation
minimization in heat exchanger. Chin Sci Bull, 2009, 54: 3587–3595
28 Qian X D, Li Z X. Analysis of entransy dissipation in heat exchang-
ers. Int J Therm Sci, 2011, 50: 608–614
29 Qian X D, Li Z, Li Z X. Entransy-dissipation-based thermal re-
sistance analysis of heat exchanger networks. Chin Sci Bull, 2011, 56:
3289–3295
30 Guo J F, Xu M T, Cheng L. The influence of viscous heating on the
entransy in two-fluid heat exchangers. Sci China Tech Sci, 2011, 54:
1267–1274
31 Guo J F, Xu M T, Cheng L. Principle of equipartition of entransy
dissipation for heat exchanger design. Sci China Tech Sci, 2010, 53:
1309–1314
32 Li X F, Guo J F, Xu M T, et al. Entransy dissipation minimization for
optimization of heat exchanger design. Chin Sci Bull, 2011, 56:
2174–2178
33 Chen Q, Wu J, Wang M R, et al. A comparison of optimization theo-
ries for energy conservation in heat exchanger groups. Chin Sci Bull,2011, 56: 449–454
34 Chen Q, Ren J X, Guo Z Y. Field synergy analysis and optimization
of decontamination ventilation designs. Int J Heat Mass Tran, 2008,
51: 873–881
35 Chen Q, Meng J A. Field synergy analysis and optimization of the
convective mass transfer in photocatalytic oxidation reactors. Int J
Heat Mass Tran, 2008, 51: 2863–2870
36 Chen Q, Ren J X, Guo Z Y. Fluid flow field synergy principle and its
application to drag reduction. Chin Sci Bull, 2008, 53: 1768–1772
37 Yakhot V, Orszag S A. Renormalization-group analysis of turbulence.
Phys Rev Lett, 1986, 57: 1722–1724
Open Access This article is distributed under the terms of the Creative Commons Attribution License which permits any use, distribution, and reproduction
in any medium, provided the original author(s) and source are credited.