Embed Size (px)
Citation preview

Analysis of Cardiac Myocyte Activity Dynamics with Micro-Electrode Arrays
Introduction
The analysis of cardiac electrical potentials through electrocardiograms (ECG) in vivo is a well-known technique to reveal information about system properties of the heart, arrhythmia, indications of conduction failures, and so on. Although such recordings are indispensable, the spatial resolution and the opportunities for manipulation in vivo are limited. In contrast, in vitro investigations of isolated organs and tissues (e.g., Purkinje fibers, papillary muscle, Langendorff heart, or patches of cardiac muscle; Yamamoto et al., 1998), are routinely employed to study the mechanisms of the generation and propagation of cardiac potentials at a higher spatial resolution using intracellular, extracellular, or optical recording (Hirota et al., 1987; Mastrototaro et al., 1992; Hofer et al., 1994).
Cultures of cardiac myocytes harvested from cardiac tissue after enzymatic digestion of the tissue offer the opportunity for analyses of single-cell or cell- aggregate properties, for example, for developmental, pharmacological, and biophysical studies (Furshpan et al., 1976; Guevara et al., 1981; Scott et al., 1986; Metzger et al., 1994, 1995; Nag et al., 1996; Egert et al., 2003; Banach et al., 2003). Although these cultures do not maintain the structure of cardiac tissue, the functional properties of action potential (AP) generation and propagation, the contractility, and the ion channel composition of the original cells are conserved or re-established, depending to some extent on the culture system. The facility of pro- duction and the simple anatomical structure of these cell and tissue culture systems thus allow the researcher to address questions otherwise not easily approachable in organs or animal preparations. The contractions of the cells in most of these prepa- rations, however, hinder electrophysiological studies with conventional electrodes, in particular intracellular or patch-clamp recording, and in optical recordings with voltage-sensitive dyes, causing various artifacts in the signal.
Although the chemical decoupling of the contractile apparatus can in princi- ple reduce motility, it may have side effects and is thus generally not desirable. Extracellular recording of field potentials (FP) from contracting myocyte cul- tures is, however, facilitated considerably when the cells are grown directly on the recording electrodes, that is, in culture dishes with integrated microelectrode arrays

11. Analysis of Cardiac Myocyte Activity Dynamics with Micro-Electrode Arrays 275
(see Chapter 2; Thomas et al., 1972; Israel et al., 1984; Rohr, 1990; Igelmund et al., 1999; Kehat et al., 2002; Meiry et al., 2001; Banach et al., 2003; Halbach et al., 2003). Cells grown on MEAs will adhere tightly to the substrate and contract iso- metrically, avoiding the motion artifacts that usually deteriorate the signal-to-noise ratio (SNR). These devices enable noninvasive simultaneous, multi-site, extracel- lular recordings from myocytes, excluding the mechanical stimulation of the cell that can hardly be avoided with conventional wire- and micro-pipette recording techniques.
The multiplicity of recording sites also allows us to keep track of slow struc- tural displacements during proliferation of excitable tissue when the tissue grows, shifting propagation pathways during differentiation of the cellular network, and during pharmacological manipulation of, for example, the excitability or the inter- cellular coupling via gap junctions. The combination of these properties enables studies that were hitherto not possible because they required sterile long-term mon- itoring of activity patterns, re-identification of relevant regions or measurements that would be confounded by mechanical, chemical, or photochemical stress (as in recordings with voltage-sensitive dyes). In addition, the spatiotemporal structure of activity and of the FP waveform can be monitored in real-time even during irregular activity, with changing pacemaker dominance or propagation pathways.
In this chapter, we introduce the recording of cell cultures prepared from cardiac tissue on MEAs, and the basis for the visualization and interpretation of the data obtained in such extracellular recordings. Our intention is to give the user a general starting point without specializing too much towards a particular application, and to illustrate what can be gained from such data. Detailed protocols appear in Egert and Meyer (2005).
MEAs with 60 to 70 electrodes are produced with thin-film photolithographic techniques and have become commercially available. Dedicated full recording systems are currently available as the "MEA1060 system from Multi Channel Systems (Reutlingen, Germany)* and as "MED64" from Alpha MED Sciences (Tokyo, ~ a ~ a n ) . t Other groups have fitted their own setups or use similar MEAs produced elsewhere.$
11.1 Methods
11.1.1 Recording Equipment The MEAs used in our experiments have 60 microelectrodes, with a diameter of 30 Fm, positioned on an 8 x 8 grid with 200 pm spacing (see Chapter 2). The recording area thus covers 1.4 x 1.4 mm2. The electrodes themselves are flat, with a rough surface of titanium nitride (TiN), 80 to 200 MO impedance (at 1 kHz) and
* www.multichannelsystems.com. t www.med64.com.
For example, Ayanda Biosystems

276 Ulrich Egert, Kathrin Banach, and Thomas Meyer
a max. 1 pm recess into the substrate. The culture chamber is formed by a 2 cm diameter glass ring of 6 mm height glued to the MEA base plate, resulting in a chamber volume of ca. 1.8 ml. Recordings were carried out with an MEA1060 system (Multi Channel Systems, Reutlingen, Germany), amplifier bandwidth 0.1, 1, or 10 Hz to 3.2 kHz, amplification 1000x or 1200~) .
The sampling frequency was 10 to 25 kHz. Further analyses were carried out offline, using tools written for MATLAB (The Mathworks, Natick, USA).
11.1.2 Cell Culture
To promote the adhesion of cells, MEAs were coated with polyethylenimine (PEI, all chemicals were obtained from Sigma-Aldrich, Deisenhofen, Germany, unless stated otherwise), cellulose nitrate (Schleicher & Schuell, Dassel, Germany (Egert et al., 2002)) or fibronectin (Becton Dickinson, Heidelberg, Germany). A suspen- sion of cardiac cells was prepared from embryonic chicken ventricles (El 0 to El 3). The ventricular myocardium was isolated, minced, and digested with 0.05% tryp- sine (original activity 10400 Ulmg) in phosphate buffered saline (PBS) at 37"C, washed and re-suspended in DMEM with 3% FCS to approximately 10' cells/ml. Approximately 2 x 10⁵ cells from this suspension were placed onto the electrode field of a MEA and supplemented with 1 ml medium after 1 to 2 min. The cell cul- ture medium was exchanged every other day. Cultures with spontaneous activity were recorded after 3 to 7 days.
The isolated or weakly coupled islets of contracting cells and cell aggregates each have their individual pacemakers. With increasing incubation time the cells proliferate and after a few days the islets merge into a continuous sheet. The con- tractions become increasingly dominated by one site, which interferes with and eventually entrains the initiation centers and the surrounding cellular network. The extent and completeness of this entrainment depends on the intercellular re- sistance across the gap junctions, the Naf -channel density, the current generated by the pacemakers, and other factors. Under suitable conditions, the contraction cycle eventually becomes stable and regular, and is initiated from one region only. The exact time course of this sequence depends on the initial seeding density, the substrate coating, and the age of the animal from which the cells were prepared. Cardiac myocytes easily proliferate and become spontaneously active if harvested from embryonal or perinatal animals. The number of spontaneously active cells and the contraction rate decrease with increasing age of the animal.
11.1.3 Analysis of MEA Recordings from Cardiac Myocytes
As with conventional recording techniques, FPs correlate in time with the contrac- tion cycle (FP spike rate) and can therefore be analyzed for contraction rate and spatiotemporal patterns of arrhythmia. Several aspects need to be considered in these analyses.
Shortly after seeding of the cardiac myocytes onto the MEA, some cells started to contract spontaneously. During the transition period, when the contraction of the

I 1. Analysis o f Cardiac Myocyte Activity Dynamics with Micro-Electrode Arrays 277
cell sheet was still initiated by several pacemaker regions, the current produced by the eventually dominating pacemaker and other excitable cells was often not large enough to depolarize the cell membrane across larger distances. This led to the interference of additional pacemakers. The effectiveness of this interference often depended on the phase of the beating cycles relative to each other, causing irregular beating with variable FP waveforms (similar to the Wenckebach periodicity in the intact heart (Castellanos et al., 1998a,b; Schwab et al., 2004)). The propagation pathways varied for FP cycles initiated at different pacemaker regions, resulting in different latencies between the peak time of FP,,, at the MEA electrodes. Although these arrhythmias are an interesting subject themselves, analyses of delay times between electrodes and arrhythmia patterns need a preliminary detection of this situation to correctly assign the originating pacemaker in each contraction cycle and correctly identify the propagation sequence. This is often possible based on the different waveforms of FPs generated by the two pacemakers at a particular electrode. Please see Figure 1 1 . l .
In particular in arrhythmic tissue, it is obvious that the beat-to-beat variation of the peak timing prohibits the reconstruction of the efficacy and path of propagation based on sequential recordings at different locations. The MEA recording tech- nique enables the detailed simultaneous assessment of event times, their variability across beats, the correlation of timing and variability between locations, and thus of the dynamic processes in the tissue at many positions. Besides regularity analyses, the most salient aspect of this is the propagation of the AP wave across the tissue. The propagation pathway, speed, and variability depend on a number of variables, and particularly on the intercellular resistance across gap junctions and the mag- nitude of the depolarizing sodium current (Spach et al., 1979; Spach, 1983; Spach and Heidlage, 1995). Although the spatial resolution of MEAs is not as good as in video-enhanced microscopy, we can easily identify the sharp peak associated with the Naf current, and thus determine the temporal succession of the depolarization across the tissue with high temporal resolution and describe the propagation of excitation (Kleber et al., 1996; Rohr and Kucera, 1997; Rohr et al., 1997a,b).
11.2 Results
Even though the timing of FP peaks can be determined with high temporal resolu- tion, it does not allow a straightforward determination of the conduction velocity. The pathway of excitation propagation can only be projected from the succession of the peak times at the electrodes. With an electrode spacing of 200 pm this may not be unequivocally feasible as the real propagation pathway may be tortuous and narrow. Furthermore, the density of Naf -channels and the local intercellular resis- tance contribute to the conduction velocity. Local variations (e.g., delays caused by high-resistance sections, bifurcations, etc.) contribute to the variability of the conduction velocity. Because of these sources of ambiguity, a general "conduction velocity" is often difficult to determine and verify satisfactorily. In most cases, however, the interpretation of experimental findings can be based equally well

FIGURE 11.1. Comparison of extracellular FP and action potentials recorded intracellularly. Simultaneous paired recordings of APs (upper traces) and FPs (lower traces) in sponta- neously active cardiac myocyte cultures. Whereas the FP minima correlate in time with the AP upstroke, the repolarization of the AP coincides with the subsequent FP maximum. APs ((AB) and (CD), respectively) were recorded successively from different cells around the same MEA electrode as illustrated in the sketch. The FP recorded simultaneously with this MEA electrode is shown underneath. The examples shown in (AB) and (CD) were obtained from two different cultures (Adapted with permission from Halbach et al., 2003, Figure 3).

11. Analysis of Cardiac Myocyte Activity Dynamics with Micro-Electrode Arrays 279
on interelectrode delays directly, avoiding the need to determine the length and homogeneity of the propagation pathway.
11.2.1 Origin of the Signal Recorded
As described by Rall (Rall, 1969; Plonsey, 1977) for neuronal axons, the time course of the potential recorded extracellularly at an axon is related to the time course of the first derivative of the membrane potential of the cell studied. This corresponds to the sum of the depolarizing and hyperpolarizing currents across the membrane. Transient inward currents would be detected as negative volt- ages, outward currents as positive deflections. The main part of these currents is carried by Na+, K+, and C1- ions flowing through channels in the mem- brane and of compensating capacitive currents simultaneously flowing in the respective opposite directions. The spatial distribution of the latter very much depends on the distribution of the internal and leak resistances of the cell, which in turn depend on the morphology of the cells. Because of the complex and ramified dendritic tree of neurons it is essentially impossible to fully reconstruct the trans- membrane potential or its time course from an extracellular recording in nervous tissue (Henze et al., 2000). In addition, at any one site in the extracellular space the local potential will be the sum of contributions from all current sources within the recording horizon of the electrode (Egert et al., 2002; Halbach et al., 2003). In native tissue this encompasses a large number of cells.
The situation is simplified, however, if the cell or tissue under study can be considered large with respect to the electrode, homogeneous in its morphology, and if the resistance between the recording electrode and the reference electrode is high. These conditions are largely met when cardiac myocytes with their extensive network of cells coupled through gap junctions are cultured on MEAs. In contrast to recordings from neuronal tissue, the time course of FPs recorded in cardiac tissue should therefore more closely correspond to that expected from theoretical considerations.
The stable mechanical situation during MEA recordings from cardiac myocyte cultures enables intracellular recordings to be performed simultaneously with the extracellular MEA recordings (Halbach et al., 2003). An analysis of the intra- and extracellular time course indicated that the current components mentioned above could in part be identified in the MEA recording. In the region initiating the activity, a sharp negative peak in the FP accompanied the depolarizing upstroke of the intracellular AP that is mainly driven by Naf. Conversely, a positive peak paralleled the repolarization phase carried by K+. At recording sites along the propagation pathway a positive peak, reflecting passive outward currents, preceded the negative peak. This TTX-sensitive current likely corresponds to a compensating outward current matching the depolarizing inward Na+-current (Figure 1 1.1).
Detailed analyses of the FP shape that can reveal the spatial distribution of fea- tures of the FP are therefore possible (Figure 11.2; Sprossler et al., 1999; Halbach et al., 2003). The basis of this interpretation is the correlation between changes of some transmembrane currents and those of certain components of the FP. This

280 Ulrich Egert, Kathrin Banach, and Thomas Meyer
B - 4
- 6 z E
' 8; (I)
3 -10; 2 -12%
5 H - 14 8
X -16;
'18-
5 ms - 20 b c d
MEA columns
c FPmin D FPpre
500 1500 ZJ5O0 [V]
FIGURE 11.2. Two-dimensional analysis of excitation spread and FP parameters. The con- tracting region of this culture of chicken cardiac myocytes covered the left part of the MEA. (A) FP traces recorded at 5 MEA electrodes in the presumed initiation region (a) with the earliest spike detected and at positions along the propagation pathway (b-e) with increas- ing delays to (a). The FP recorded in the initiation region is small and has only a minor positive peak (FP,,) preceding the minimum (FP,,,,). This suggests that the electrode does not record from the pacemaker site proper, where we would expect no preceding positive peak. FPs recorded at positions with increasing delays had a prominent FP,, and domi- nating FP,,,;,. (B) Contour plot of the isochrones of the FPmi, with respect to position (a). The dense lines to the right stem from border artifacts. The arrow indicates a likely path of propagation of the underlying AP. (C) Map of the magnitude of FPmi,,. (D) Map of the magnitude of FP,,,. These maps indicate that larger peaks coincide with positions along the path of propagation, rather than the initiation region of the spike, which is similar to the situation in native tissue.

1 1. Analysis of Cardiac Myocyte Activity Dynamics with Micro-Electrode Arrays 281
0 20 40 60 time [s]
FIGURE 11.3. Origin of the FP: (A) FPs recorded in a cardiac myocyte culture during Na+ withdrawal by superfusion with nominally Na+-free buffer at the points in time indicated in (B). (B) FP,,i, magnitude decreased continuously during the washout of Na+ starting at 20 min. Blocking Na+-channels with tetrodotoxin produced a similar effect and increased the conduction delay, which is known to correlate with the magnitude of the Na+-current (Spach and Kootsey, 1983). (C) This experiment illustrates another current component directly influencing the FP shape. Superfusion of the culture with nominally Ca2+-free solution resulted in a magnitude decrease of the delayed second minimum of the FP, indicating its Ca2+ dependence (two recording sites of the same culture). This period of the FP coincides with the plateau phase of the AP. (scale bars are 100 pV/20 msec). (Reproduced with permission from Halbach et al., 2003, Figures 7AB and 9AB.)
allows relating the waveform recorded extracellularly and changes thereof to changes of the shape of the underlying APs and to the known sequence of Na+-, Kf - and ca2+ -currents (Figures 1 1.1 and 1 1.3).
11.2.2 Spatial Resolution
Even though the recording horizon of MEA electrodes was estimated in several simulation studies (Fromherz et al., 1991; Buitenweg et al., 2000; Heuschkel et al., 2002), it is not clear how this translates into the detectability of a signal in native

282 Ulrich Egert, Kathrin Banach, and Thomas Meyer
FIGURE 11.4. Spike activity in acute brain slice: (A) cerebellar slice from a juvenile rat in the recordings situation on an MEA. (B) Raw signal recorded at the electrodes marked in (A). Spikes can be readily detected. The signal-to-noise ratio is typical for this preparation.
tissue considering the noise from technical and biological sources, or the geometry of the dendritic tree.
Because of the extensive and overlapping dendritic trees of many neurons it is not possible to identify straightforwardly where the neuronal signal recorded at an electrode was generated. Obviously, neuronal spikes will decrease in amplitude with distance from the neuron. A second scaling factor is the size of a neuron; or rather its membrane area that in part determines the cells input resistance. Small neurons procure only weak currents to depolarize the capacitance formed by their cell membrane. Their extracellular signal is therefore smaller than that of larger cells (large cell bias). This ambiguity impairs the identification of the signal source and its distance to the recording electrode in single-unit recordings.
We further investigated this question and measured the relative change of the amplitude of neuronal spikes in MEA recordings from acute parasagittal slices from the rat cerebellum (Figure 11.4). To assess the decay of the neuronal spike with distance from the origin a compact source is necessary. The structure of the cerebellum is such that in these slices the large, essentially two-dimensional dendritic tree of the Purkinje cells (PC) lies flat on the MEA, extending into the molecular layer only. Their cell bodies are aligned in the Purkinje cell layer (PCL) and the neurons are spontaneously active. PC neurites do not extend into the plane of the PCL and only the axon of the cell passes through the granule cell layer. Within the PCL the spikes detected therefore essentially originate from the somata of the PCs only. Probing the region around an MEA electrode that picked up large spikes with a single micro-pipette electrode, we measured the amplitude distribution of the potential recorded with a micro-pipette. The change of the ratio of the signals recorded simultaneously at both electrodes as afunction of the distance between the electrodes yielded an estimate of the detectable FP of the cell studied (Figure 1 1.5).

-100 \
-100 -50 0 ' 50 100 x-distance [lrn]'
0 0.2 0.4 0.6 0.8
ratio of minima
FIGURE 11.5. Recording horizon of an MEA electrode: The extent of the FP correspond- ing to a neuronal action potential was estimated by comparing the amplitude of a spike presumably recorded from a Purkinje cell soma with an MEA electrode to the signal simul- taneously recorded at sites around the MEA electrode with a micro-pipette electrode. The ratio of the peak voltage on these electrodes was used to estimate the range within which an MEA electrode would likely pick up the spike from the noise. For somatic spikes this was 60 pm at best. This value will scale with the current produced by the cell, and hence generally with the cell size. Unitary myocyte FPs, as the basic component of the compound FPs recorded in a culture, are therefore likely detectable at a larger distance. (Reproduced with permission from Egert et al., 2002, Flgure 4, 0 Springer-Verlag.)

284 Ulrich Egert, Kathrin Banach, and Thomas Meyer
The resulting potential surface indicated that the recording horizon of such an electrode has a radius of approximately 60 pm (Egert et al., 2002) at best for PCs; the fields of view of the MEA electrodes spaced on a 200 pm grid therefore do not overlap.
This footprint is obviously valid for unit spikes only and the electrode horizon scales with the size of the cell for reasons explained above. In addition, exten- sive dendritic trees in some cases will allow the recording of spikes at greater distances. In recordings from the neocortex in vivo with single electrodes spikes are often detected first at approximately 80 pm from the point of maximal SNR which is still within the range of our estimate measured above. Cardiac myocytes, on the other hand, form a special case in that neighboring myocytes are coupled by gap junctions, effectively forming a large cell in which membrane depolarizations spread across the cell, similar to the situation in long axons and dendrites. The fre- quently large amplitude of spikes found in MEA recordings from cardiac myocytes can be attributed to this extensive sheet of membrane, de- and hyperpolarized by comparatively large currents.
11.2.3 Evaluation of Cardioactive Drugs The interpretation of the FP shape given above suggests that an analysis of changes of the FP in cultures of cardiac myocytes might be used to assess the effect of car- dioactive drugs under conditions similar to those in intact tissue. In contrast to isolated cells, the cells in culture interact and differentiate to form an excitable network, generating and propagating excitation with pacemaker regions and prop- agation pathways. A comparison of the FP amplitude in the pacemaker region with those along the propagation pathways shows increased SNRs along the path- way, indicating larger currents generated there. The interaction between the car- diomyocytes in culture also induces a differential expression of ion channels. Compared to single-channel studies revealing detailed information on the site of action of a drug, studies in celi cultures with analyses of the FP shape could yield information on the response of cardiomyocytes as a whole and of the czllular network.
1 1.2.3.1 Extracting Action Potential Properties from Extracellular Recordings
An important parameter for the functional interplay in the heart is, for instance, the duration of the action potential (AP). In the ECG this is determined from the delay between the Q and the T waves (QT-interval) that marks the depolarization and repolarization phases of the AP in the ventricular myocardium. A lengthening of the QT-interval has been associated with lethal side effects of certain drugs (Vieweg, 2002; Redfern et al., 2003; Fermini and Fossa, 2003). Tests for QT prolongation have therefore become obligatory in safety pharmacology (Fermini and Fossa, 2003). On the basis of data and c~nsiderations on cell cultures we analyzed the changes of the FP duration in response to the application of several drugs known to prolong the cardiac AP during the recording. We observed a

11. Analysis of Cardiac Myocyte Activity Dynamics with Micro-Electrode Arrays 285
Quinidine,
1 80 1 . ......., . . ...... . ....... . ....... . . ..,... . . ...... . ..... I
I o - ~ 10-1 I bO I b1 I b2 I b3 I b4 G5
concentration [nM]
FIGURE 11.6. Estimating QT duration changes by cardioactive drugs with extracellular recordings: MEA recordings from cardiac myocytes facilitate in vitro prescreening for QT prolongation in cardiac myocytes. These dose-response curves were determined from cardiac myocyte cultures on 96-well arrays (see Figure 11.7). All drugs tested thus far changed the field potential duration as expected from ECG recordings (Lazzara, 1993; Redfern et al., 2003).
concentration-dependent prolongation of the FP duration, which is closely related to the QT-intrrval with E403 1, a specific blocker of the HERG channel, and the anti- arrhythmic drugs Quinidine, and Sotalol. Verapamil, a Ca2+-ion influx inhibitor, and Amiodarone, both substances with anti-arrhythmic properties, did not change the QT-interval (Figure 11.6). These effects, and the concentration ranges in which they occur, are comparable to those reported in the literature (Lazzara, 1993; De Ponti et al., 2002; Redfern et al., 2003). In particular the results with Verapamil match the in vivo profile, which is not predictable from HERG-channel data alone (De Ponti et al., 2002).
11.3 Discussion
11.3.1 Other Appmaches to the Analysis of Spatio-Temporal Cardiac Excitation Patterns
In addition to the approaches described thus far, other techniques have been developed to investigate the structure of cardiac excitation patterns in differ- ent preparations and on various time scales. Cultures of dissociated cardiomy- ocytes from neonatal rats on MEAs have been used, for example, to investigate structure-dependent impulse conduction and beat rate variability (Rohr et al., 1997b; Kucera et al., 2000).

286 Ulrich Egert, Kathrin Banach, and Thomas Meyer
In cardiology, the spread of activity, its embryonic development, and its pathological conditions, such as arrhythmias, are highly important issues. The combination of MEA recording with cultures of cardiac myocytes thus marks a significant progress, supported by the fortuitous situation that the contraction is essentially isometric at the tissue surface adhering to the substrate. The signal amplitude can be very high and motion artifacts are not observed. This allows the observation and analysis of physiological processes in active cardiac tissue over periods of several days, enabling a new class of experiments on cardiac develop- ment (Rohr et al., 1997a; Igelmund et al., 1999). Lu et al. (2003) explanted whole mouse hearts, and even whole mouse embryos on MEAs to study the differenti- ation of cardiac activity (Reppel et al., 2004). Myocyte cultures have also been recorded with transistor-based electrode arrays (Sprossler et al., 1999).
The requirement for QT-evaluation in safety pharmacology necessitates tests on a large number of drugs, either under development or already on the mar- ket. Using in vivo tests is inconvenient because of the associated high costs and low throughput. Because several ion channels and receptors are involved in the dynamics determining the AP duration, with the HERG channel being the most important one, data obtained from cell lines expressing a single ion-channel type can be misleading, resulting in false negatives or false positives (De Ponti et al., 2002). The interplay of the various cellular mechanisms is better captured in native cells. MEAs provide a simple tool to implement semi-automatic arrays on such cultures.
11.4 Outlook
The applications and techniques presented above illustrate the wide range of ques- tions that can be approached with substrate-integrated microelectrode arrays.
To increase the throughput and cut the costs of corresponding experiments in drug research it is desirable to run several preparations simultaneously. This requires that such systems can be run largely unsupervised during the experiment, necessitating highly stable recording, stimulation, perfusion, and drug application configurations. MEAs enable this approach, in particular with the perspective for new, multi-well plate arrays (Figure 11.7). Perforation of MEAs to optimize perfusion will further improve this tool.
The option to combine MEAs with conventional electrophysiological tech- niques, and transparent indium-tin oxide (ITO) electrodes facilitating optical mea- surements, for example, with Ca2+-sensitive dyes (Banach et al., 2002), promises further uses for this technique.
We expect that the availability of these techniques, of the corresponding data acquisition and data analysis tools, and an increasing number of experimental pro- tocols will contribute to our understanding of signal propagation and information processing in neuronal and cardiac networks, as well as pathological conditions thereof and approaches for their treatment.
11. Analysis of Cardiac Myocyte Activity Dynamics withMicro-Electrode Arrays 287
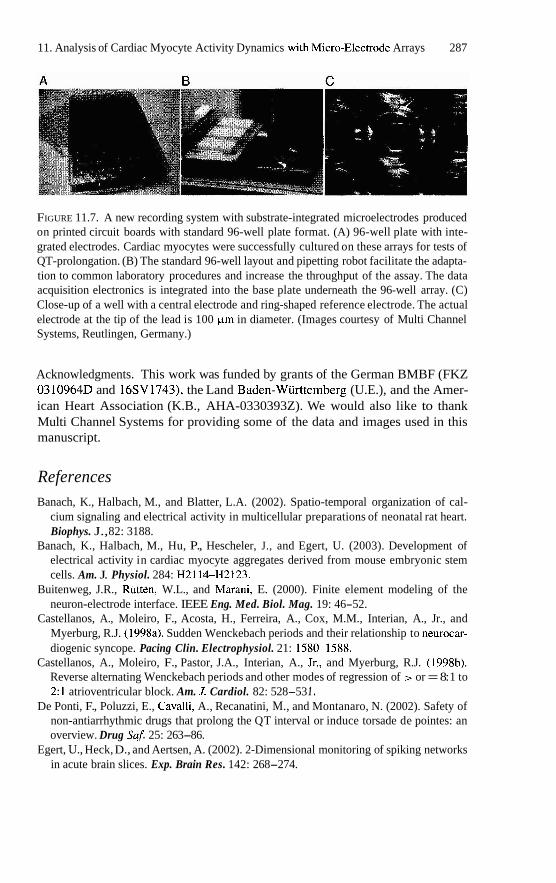
FIGURE 11.7. A new recording system with substrate-integrated microelectrodes produced on printed circuit boards with standard 96-well plate format. (A) 96-well plate with inte- grated electrodes. Cardiac myocytes were successfully cultured on these arrays for tests of QT-prolongation. (B) The standard 96-well layout and pipetting robot facilitate the adapta- tion to common laboratory procedures and increase the throughput of the assay. The data acquisition electronics is integrated into the base plate underneath the 96-well array. (C) Close-up of a well with a central electrode and ring-shaped reference electrode. The actual electrode at the tip of the lead is 100 Fm in diameter. (Images courtesy of Multi Channel Systems, Reutlingen, Germany.)
Acknowledgments. This work was funded by grants of the German BMBF (FKZ 0310964D and 16SV1743), the Land Baden-Wiirttemberg (U.E.), and the Amer- ican Heart Association (K.B., AHA-0330393Z). We would also like to thank Multi Channel Systems for providing some of the data and images used in this manuscript.
References Banach, K., Halbach, M., and Blatter, L.A. (2002). Spatio-temporal organization of cal-
cium signaling and electrical activity in multicellular preparations of neonatal rat heart. Biophys. J., 82: 3188.
Banach, K., Halbach, M., Hu, P., Hescheler, J., and Egert, U. (2003). Development of electrical activity in cardiac myocyte aggregates derived from mouse embryonic stem cells. Am. J. Physiol. 284: H2114-H2123.
Buitenweg, J.R., Rutten, W.L., and Marani, E. (2000). Finite element modeling of the neuron-electrode interface. IEEE Eng. Med. Biol. Mag. 19: 46-52.
Castellanos, A., Moleiro, F., Acosta, H., Ferreira, A., Cox, M.M., Interian, A., Jr., and Myerburg, R.J. (1998a). Sudden Wenckebach periods and their relationship to neurocar- diogenic syncope. Pacing Clin. Electrophysiol. 21: 158&1588.
Castellanos, A., Moleiro, F., Pastor, J.A., Interian, A., Jr., and Myerburg, R.J. (1998b). Reverse alternating Wenckebach periods and other modes of regression of > or = 8: 1 to 2:l atrioventricular block. Am. J. Cardiol. 82: 528-53 1 .
De Ponti, F., Poluzzi, E., Cavalli, A., Recanatini, M., and Montanaro, N. (2002). Safety of non-antiarrhythmic drugs that prolong the QT interval or induce torsade de pointes: an overview. Drug Saf. 25: 263-86.
Egert, U., Heck, D., and Aertsen, A. (2002). 2-Dimensional monitoring of spiking networks in acute brain slices. Exp. Brain Res. 142: 268-274.
288 Ulrich Egert, Kathrin Banach, and Thomas Meyer
Egert, U. and Meyer, T. (2005). Heart on a chip-Extracellular multielectrode recordings from cardiac myocytes in vitro, In: Dhein, S., Mohr, F.W., and Delmar, M., eds., Practical Methods in Cardiovascular Research. Springer, Stuttgart.
Egert, U., Meyer, T., and Banach, K. (2003). Heart on a chip, In: Dhein, S. and Delmar, M., eds., Methods in Cardiovascular Research. Springer, Stuttgart.
Fermini, B. and Fossa, A.A. (2003). The impact of drug-induced QT interval prolongation on drug discovery and development. Nut. Rev. Drug Discov. 2: 439-447.
Frornherz, P., Offenhausser, A., Vetter, T., and Weis, J. (1991). A neuron-silicon junction: A Retzius cell of the leech on an insulated-gate field-effect transistor. Science 252: 1290.
Furshpan, E.J., Macleish, P.R., O'Lague, P.H., and Potter, D.D. (1976). Chemical transmis- sion between rat sympathetic neurons and cardiac myocytes developing in microcultures: Evidence for cholinergic, adrenergic, and dual-function neurons. Proc. Nut. Acad. Sci. U. S. A. 73: 42254229.
Guevara, M.R., Glass, L., and Shrier, A. (1981). Phase locking, period-doubling bifur- cations, and irregular dynamics in periodically stimulated cardiac cells. Science 214: 1350-1353.
Halbach, M.D., Egert, U., Hescheler, J., and Banach, K. (2003). Estimation of action po- tential changes from field potential recordings in multicellular mouse cardiac myocyte cultures. Cell. Physiol. Biochem. 13: 271-284.
Henze, D.A., Borhegyi, Z., Csicsvari, J., Mamiya, A,, Hanis, K.D., and Buzs*, G. (2000). Intracellular features predicted by extracellular recordings in the hippocampus in vivo. J. Neurophysiol. 84: 390400.
Heuschkel, M.O., Fejtl, M., Raggenbass, M., Bertrand, D., and Renaud, P. (2002). A three- dimensional multi-electrode array for multi-site stimulation and recording in acute brain slices. J. Neurosci. Meth. 114: 135-148.
Hirota, A,, Kamino, K., Komuro, H., and Sakai, T. (1987). Mapping of early development of electrical activity in the embryonic chick heart using multiple-site optical recording. J. Physiol. ( h n d . ) 383: 711-728.
Hofer, E., Urban, G., Spach, M.S., Schafferhofer, I., Mohr, G., and Platzer, D. (1994). Measuring activation patterns of the heart a t a microscopic size scale with thin-film sensors. Am. J. Physiol. 266: H2136-H2145.
Igelmund, P., Fleischmann, B.K.,Fischer, I.V., Soest, J.;Gryshchenko, O., Sauer, H., Liu, Q., and Hescheler, J. (1999). Action potential propagation failures in long-term recordings from embryonic stem cell-derived cardiomyocytes in tissue-culture. PfEug. Arch. Eur: J. Phys. 437: 669-679.
Israel, D.A., Bany, W.H., Edell, DY., and Mark, R.G. (1984). An array of microelectrodes to stimulate and record from cardiac cells in culture. Am. J. Physiol. 247: H669-H674.
Kehat, I., ~ e ~ s t e i n , A., Spira, A., Itskovitz-Eldor, J., and Gepstein, L. (2002). High- resolution electrophysiological assessment of human embryonic stem cell-derived car- diomyocytes: a novel in vitro model for the study of conduction. Circ. Res. 91: 659-661.
Kleber, A.G., Fast, V.G., Kucera, J., and Rohr, S. (1996). Physiology and pathophysiology of cardiac impulse conduction. Zeitschrift fur Kardiologie 85: 25-33.
Kucera, J.P., Heuschkel, M.O., Renaud, P., and Rohr, S. (2000). Power-law behavior of beat-rate variability in monolayer cultures of neonatal rat ventricular myocytes. Circ. Res. 86: 1140-1 145.
Lazzara, R. (1993). Antiarrhythmic drugs and torsade de pointes. Eur: Heart J. 44: 88-92. Mastrototaro, J.J., Massoud, H.Z., Pilkington, T.C., and Ideker, R.E. (1992). Rigid and
flexible thin-film multielectrode arrays for transmural cardiac recording. IEEE Trans. Biomed. Eng. 39: 271-379.

11. Analysis of Cardiac Myocyte Activity Dynamics withMicro-Electrode Arrays 289
Meiry, G., Reisner, Y., Feld, Y., Goldberg, S., Rosen, M., Ziv, N., and Binah, 0 . (2001). Evolution of action potential propagation and repolarization in cultured neonatal rat ventricular myocytes. J. Cardiovasc. Electrophysiol. 12: 1269-1277.
Metzger, J. M., Lin, W.I., and Sarnuelson, L.C. (1994). Transition in cardiac contractile sensitivity to calcium during the in vitro differentiation of mouse embryonic stem cells. J. Cell Biol. 126: 701-71 1.
Metzger, J.M., Lin, W.I., Johnston, R.A., Westfall, M.V., and Samuelson, L.C. (1995). Myosin heavy chain expression in contracting myocytes isolated during embryonic stem cell cardiogenesis. Circ. Res. 76: 7 10-7 19.
Nag, A.C., Lee, M.L., and Sarkar, F.H. (1996). Remodelling of adult cardiac muscle cells in culture: Dynamic process of disorganization and reorganization of myofibrils. J Muscle Res. Cell. Motil. 17: 3 13-34.
Plonsey, R. (1977). Action potential sources and their volume conductor fields. Proc. IEEE 65: 601-611.
Rall, W. (1969). Distribution of potential in cylindrical coordinates and time constants for a membrane cylmder. Biophys. J. 9: 1509-1541.
Redfern, W.S., Carlsson, L., Davis, A.S., Lynch, W.G., MacKenzie, I., Palethorpe, S., Siegl, P.K., Strang, I., Sullivan, A.T., Wallis, R., Camm, A.J., and Hammond, T.G. (2003). Relationships between preclinical cardiac electrophysiology, clinical QT interval pro- longation and torsade de pointes for a broad range of drugs: Evidence for a provisional safety margin in drug development. Cardiovasc. Res. 58: 3 2 4 5 .
Reppel, M., Pillekamp, F., Lu, Z.J., Halbach, M., Brockmeier, K., Fleischmann, B.K., Hascheler, J. (2004). Microelectrode arrays: a new tool to measure embryonic heart activity. J. Electrocardiol. 37 Suppl: 104-109.
Rohr, S. (1990). A computerized device for long-term measurements of the contraction frequency of cultured rat heart cells under stable incubating conditions. Pjug. Arch. Eur J. Phys. 416: 201-206.
Rohr, S. and Kucera, J. P. (1997). Involvement of the calcium inward current in cardiac impulse propagation: Induction of unidirectional conduction block by nifedipine and reversal by Bay K 8644. Biophys. J. 72: 754-766.
Rohr, S., Kucera, J.P., and Kleber, A.G. (199713). Form and function: Impulse propagation in designer cultures of cardiomyocytes. News Physiol. Sci. 12: 171-177.
Rohr, S., Kucera, J.P., Fast, V.G., and Kleber, A.G. (1997a). Paradoxical improvement of impulse conduction in cardiac tissue by partial cellular uncoupling. Science 275: 841- 844.
Schwab, J.O., Eichner, G., Schmitt, H., Schrickel, J., Yang, A,, Balta, O., Luderitz, B., and Lewalter, T. (2004). Heart rate variability in patients suffering from structural heart disease and decreased AV-nodal conduction capacity. Insights into the formation of heart rate variability. Z. Kardzol. 93: 229-233.
Scott, J.A., Khaw, B.A., Fallon, J.T., Locke, E., Rabito, C.A., Peto, C.A., and Homcy, C.J. (1986). The effect of phenothiazines upon maintenance of membrane integrity in the cultured myocardial cell. J. Mol. Cell Cardiol. 18: 1243-1254.
Spach, M.S. (1983). The role of cell-to-cell coupling in cardiac conduction disturbances. Adv. Exper Med. Biol. 161: 61-77.
Spach, M.S. and Heidlage, J.F. (1995). The stochastic nature of cardiac propagation at a microscopic level: Electrical description of myocardial architecture and its application to conduction. Circ. Res. 76: 366-380.
Spach, M.S. and Kootsey, J.M. (1983). The nature of electrical propagation in cardiac muscle. Am. J. Physiol. 244: H3-22.

290 Ulrich Egert, Kathrin Banach, and Thomas Meyer
Spach, M.S., Miller, W.T., Miller-Jones, E., Warren, R.B., and Barr, R.C. (1979). Extra- cellular potentials related to intracellular action potentials during impulse conduction in anisotropic canine cardiac muscle. Circ. Res. 45: 188-204.
Sprossler, C., Denyer, M., Britland, S., Knoll, W., and Offenhausser, A. (1999). Electrical recordings from rat cardiac muscle cells using field-effect transistors. Phys. Rev. E 60: 2171-2176.
Thomas, C.A., Springer, P.A., Loeb, G.W., Benvald-Netter, Y., and Okun, L.M. (1972). A miniature microelectrode array to monitor the bioelectric activity of cultured cells. Exp. Cell Res. 74: 61-66.
Vieweg, W.V.R. (2002). Mechanisms and risks of electrocardiographic QT interval prolon- gation when using antipsychotic drugs. J. Clin. Psychiatry 63: 18-24.
Yamamoto, M., Honjo, H., Niwa, R., and Kodama, I. (1998). Low-frequency extracellular potentials recorded from the sinoatrial node. Cardiovasc. Res. 39: 360-372.


![Preeti Ahuja, Patima Sdek and W. Robb MacLellan - Cardiac Myocyte Cell Control.pdf · [Abstract]€ [Full Text]€ Am J Physiol Heart Circ Physiol, September 1,€2007; 293€(3):](https://img.pdfslide.us/doc/110x75/5fb616448002a10025158b21/preeti-ahuja-patima-sdek-and-w-robb-cardiac-myocyte-cell-controlpdf-abstracta.jpg)