Embed Size (px)
Citation preview
ANALYSIS OF BUSINESS DEVELOPMENT STRATEGY
FORMULATION IN FURNITURE MANUFACTURING
COMPANY (A Case Study of UD. Karangjati Furniture, Bekasi, West Java)
By
Nirmala Tilami
ID No. 014200900117
A Thesis presented to the
Faculty of Economics President University
in partial fulfillment of the requirements of
Bachelor Degree in Economics Major in Management
February 2013
i
PANEL OF EXAMINERS
APPROVAL SHEET
The Panel of Examiners declares that the thesis entitled “ANALYSIS OF BUSINESS
DEVELOPMENT STRATEGY FORMULATION IN FURNITURE
MANUFACTURING COMPANY (A Case Study of UD. Karangjati Furniture,
Bekasi, West Java)” that was submitted by Nirmala Tilami majoring in Management
from the Faculty of Economics was assessed and approved to have passed the Oral
Examinations on February 13, 2013.
Purwanto, ST, MM Chair Panel of Examiners
Ir. Iman Heru Wijayanto, MBA Examiner I
Irfan Habsjah, MBA, CMA Examiner II
ii
THESIS ADVISER
RECOMMENDATION LETTER
This thesis entitled “ANALYSIS OF BUSINESS DEVELOPMENT
STRATEGY FORMULATION IN FURNITURE MANUFACTURING
COMPANY (A Case Study of UD. Karangjati Furniture, Bekasi, West Java)”
prepared and submitted by Nirmala Tilami in partial fulfillment of the requirements
for the degree of Bachelor of Science in the Faculty of Management has been
reviewed and found to have satisfied the requirement for a thesis fit to be examined.
I therefore recommend this thesis for Oral Defense.
Cikarang, Indonesia, January 29, 2013
Acknowledged by, Recommended by,
Irfan Habsjah, MBA, CMA Drs. Agus B. Adidi, MA, CCA Head of Management Study Program Thesis Advisor
iii
DECLARATION OF ORIGINALITY
I declare that this thesis, “ANALYSIS OF BUSINESS DEVELOPMENT
STRATEGY FORMULATION IN FURNITURE MANUFACTURING
COMPANY (A Case Study of UD. Karangjati Furniture, Bekasi, West Java)” is
to the best of my knowledge and belief, an original piece of work that has not been
submitted, either in whole or in part to another university to obtain a degree.
Cikarang, Indonesia, January 29, 2013
Researcher,
Nirmala Tilami
014200900117

iv
ABSTRACT
Furniture is one of the human necessary which can give the impression of
artistic and functional in any room of any building. A variety of raw materials for the furniture are also offered so that consumers can choose according to their needs and wants. UD. Karangjati Furniture is a furniture company in medium-scale that manufactures a variety of minimalist teak furniture that has the potential to develop. This research aims to identify the internal and external factors affecting the business and recommend the alternative strategies to address the problems faced by company. The data collection began in October to December 2012 at UD. Karangjati Furniture located in Bekasi, West Java.
Internal Analysis (IFE) produces the main strength which is having brand advantage and quality of goods, with scores of 0.376. As for the main weakness which owned by this business unit is the Quality Control process that has not been performing well with scores of 0.149. The merging of two internal factors resulted in a total average score of 2.519.
External Analysis (EFE) produces the main opportunity that can be exploited by UD. Karangjati Furniture to face the competition is the quality of teak wood that has been known since before with score of 0.314. The main threat which obtained from the calculations are bargaining power of consumers is very high with scores of 0.220. The merging of two external factors resulted in a total average score of 2.474. IE matrix analysis determines the position of UD. Karangjati Furniture in cell V which called as hold and maintain strategy.
SWOT analysis produced eight alternative strategies based on IE matrix. In the end, according to the processing of QSPM, produces the priority strategy that can be applied by company. The priority strategy is doing evaluate and study about the ability of company in facing the competition with a total score of TAS is 6.594. Keywords: Business Development Strategy, IFE and EFE Matrix, IE Matrix,
SWOT Matrix, and QSPM Matrix
v
ACKNOWLEDGEMENT First of all, I would like to express my deepest gratitude to the Lord
Almighty, Allah SWT for His blessings, guidance, and joys He gave to me so I can
accomplish this final project. My special thanks given to my family who always
support me with the patience, guidance, and a very valuable advice that is really
useful for me in making this final project. Thank you so much for the never ending
support and everlasting love.
My gratitude also given to my final project advisor, Mr. Irfan Habsjah, MBA,
CMA for the support, advices, and guidance during this final project which is really
helped me in writing and accomplishing this final project. Great thanks for all staffs
and non-staffs in UD. Karangjati Furniture who can give me the chance to do
research in this company and always help me in getting the information and data for
this final project. It was really grateful experience and I hope the result of my
research can be useful and implemented by the management of company in order to
get the best development for now and future.
My great thanks also given to all my friends, my lecturers, and staffs in
President University, BF’ers 2009, and my beloved friends Monita Eggy, Meutia
Rahmi, Stefi Primawati, Emanda Setyorini, Shinta Amalina, Vitra Leonita and
Shareen Gagnani for the sharing, joking, helps, and supports, it was an unforgettable
moments to spend our times together from the first semester until last semester. And
also for Rista Marliyani, Nurul Anggari, and Sabrina Kusuma who always give me
spirit, suggestion, and motivation during the processing of this final project.
Last but not least, thanks to others who cannot be mentioned one by one in
here. Thank you for the helps and supports.
Sincerely,
Nirmala Tilami
vi
TABLE OF CONTENTS
PANEL OF EXAMINERS APPROVAL SHEET .................................................... i
THESIS ADVISER RECOMMENDATION LETTER ......................................... ii
DECLARATION OF ORIGINALITY ................................................................... iii
ABSTRACT ................................................................................................................ iv
ACKNOWLEDGEMENT .......................................................................................... v
TABLE OF CONTENT ............................................................................................. vi
LIST OF TABLES ..................................................................................................... ix
LIST OF FIGURES .................................................................................................... x
LIST OF APPENDICES ........................................................................................... xi
I. INTRODUCTION
1.1 Background of the Study .................................................................................. 1
1.2 Company Profile ............................................................................................... 3
1.2.1 Company History and Development ..................................................... 3
1.2.2 Vision, Mission and Decision of Company .......................................... 4
1.2.3 Location of Company ........................................................................... 4
1.2.4 Organizational Structure of Company .................................................. 5
1.2.5 Operational Activity of Company ......................................................... 7
1.2.6 The Current Business Development Strategy of UD. Karangjati Furniture ................................................................................................ 9
1.3 Problem’s Identified ........................................................................................ 10
1.4 Statement of the Problem ................................................................................ 11
1.5 Research Objective ......................................................................................... 11
1.6 Significance of the Study ................................................................................ 11
1.7 Scope and Limitations of the Study ................................................................ 12
1.8 Research Outlines ........................................................................................... 12
vii
1.9 Definition of Terms ......................................................................................... 13
II. LITERATURE REVIEW
2.1 Strategy Concepts ........................................................................................... 16
2.2 Strategic Management Concepts ..................................................................... 16
2.3 Strategic Management Process ....................................................................... 17
2.4 Strategy Formulation ...................................................................................... 18
2.4.1 Vision, Mission and Decision of Company ........................................ 19
2.4.2 Internal Environmental Analysis ........................................................ 20
2.4.3 External Environmental Analysis ....................................................... 21
2.4.4 IE Matrix Analysis .............................................................................. 26
2.4.5 SWOT Matrix Analysis ...................................................................... 26
2.4.6 QSPM Analysis ................................................................................... 27
2.5 Marketing Concepts ........................................................................................ 27
2.5.1 Definitions of Marketing ..................................................................... 27
2.5.2 Functions of Marketing ....................................................................... 29
2.5.3 Marketing Strategy .............................................................................. 29
A. Segmentation ................................................................................ 30
B. Targeting ...................................................................................... 30
C. Positioning .................................................................................... 30
2.5.4 Product Marketing Mix ....................................................................... 31
2.6 Furniture Concepts .......................................................................................... 34
2.6.1 Definitions of Furniture ...................................................................... 35
2.6.2 Kinds of Furniture ............................................................................... 35
III. METHODOLOGY
3.1 Research Method ............................................................................................ 37
3.1.1 Location and Time of Research .......................................................... 37
3.1.2 Types and Sources of Data.................................................................. 37
3.1.3 Data Collection Method ...................................................................... 38
3.2 Research Instruments ...................................................................................... 39
viii
3.2.1 Description Analysis ........................................................................... 39
3.2.2 Formulation Process of Alternative Strategy ...................................... 39
A. The Input Stage ............................................................................ 40
B. The Matching Stage ..................................................................... 45
C. The Decision Stage ....................................................................... 48
3.3 Operational Framework .................................................................................. 50
IV. ANALYSIS OF DATA AND INTERPRETATION OF RESULTS 4.1 Company Environmental Analysis ................................................................. 52
4.1.1 Internal Environmental Analysis ........................................................ 52
A. Management and Human Resources ............................................. 52
B. Marketing ...................................................................................... 53
C. Production and Operation .............................................................. 57
D. Financial ........................................................................................ 60
E. Research and Development .......................................................... 61
F. Information Management System ................................................. 61
4.2.2 External Environmental Analysis ....................................................... 62
A. Macro Environment ...................................................................... 62
B. Industry Environment .................................................................... 67
4.3 Strategy Formulation ...................................................................................... 71
4.3.1 Identification of Internal and External Factors ................................... 71
4.3.2 IFE Matrix and EFE Matrix Analysis ................................................. 77
4.3.3 IE Matrix Analysis .............................................................................. 80
4.3.4 SWOT Matrix Analysis ...................................................................... 81
4.3.5 QSPM Analysis ................................................................................... 84
V. CONCLUSIONS AND RECOMMENDATIONS
5.1 Conclusion ...................................................................................................... 86
5.2 Recommendations ........................................................................................... 88
REFFERENCES ....................................................................................................... 89
APPENDIX ................................................................................................................ 93
ix
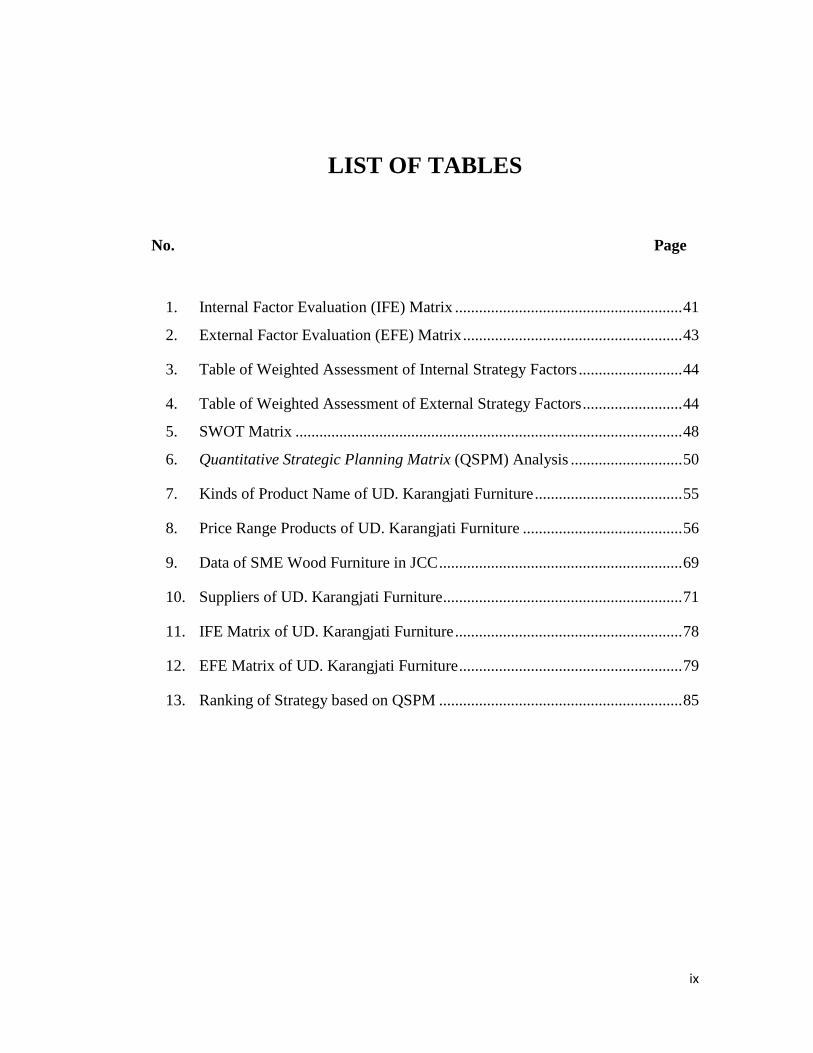
LIST OF TABLES
No. Page
1. Internal Factor Evaluation (IFE) Matrix ......................................................... 41
2. External Factor Evaluation (EFE) Matrix ....................................................... 43
3. Table of Weighted Assessment of Internal Strategy Factors .......................... 44
4. Table of Weighted Assessment of External Strategy Factors ......................... 44
5. SWOT Matrix ................................................................................................. 48
6. Quantitative Strategic Planning Matrix (QSPM) Analysis ............................ 50
7. Kinds of Product Name of UD. Karangjati Furniture ..................................... 55
8. Price Range Products of UD. Karangjati Furniture ........................................ 56
9. Data of SME Wood Furniture in JCC ............................................................. 69
10. Suppliers of UD. Karangjati Furniture ............................................................ 71
11. IFE Matrix of UD. Karangjati Furniture ......................................................... 78
12. EFE Matrix of UD. Karangjati Furniture ........................................................ 79
13. Ranking of Strategy based on QSPM ............................................................. 85
x
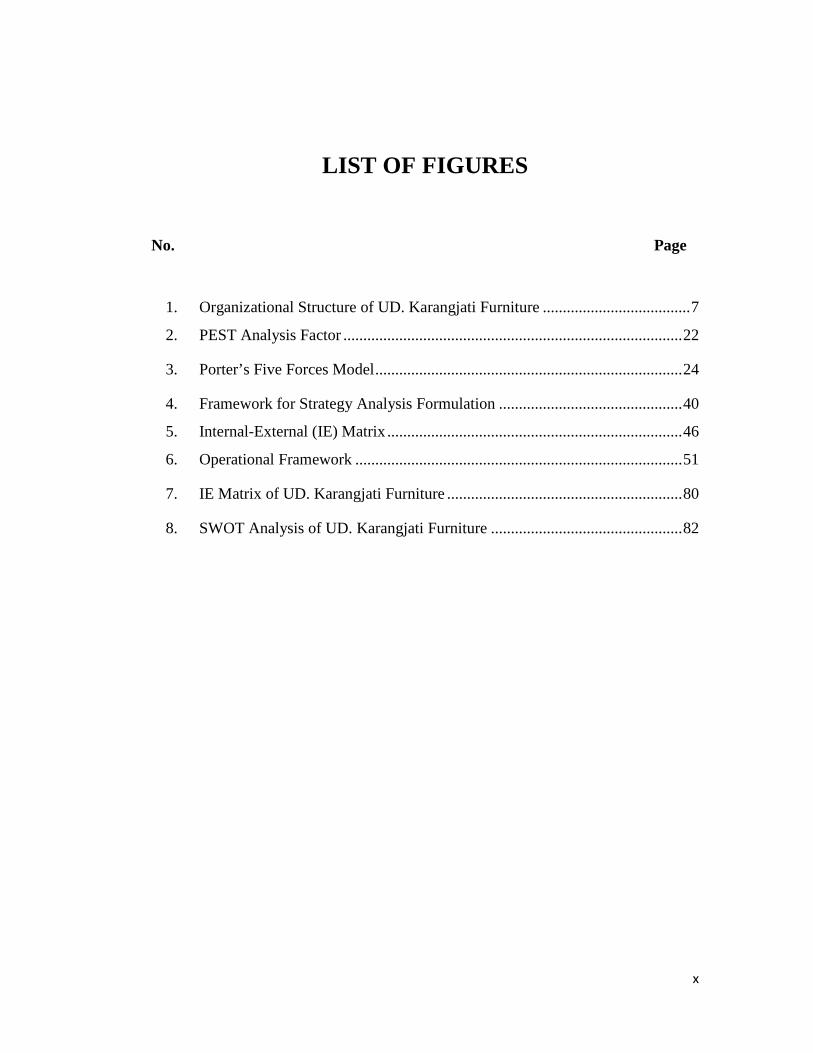
LIST OF FIGURES
No. Page
1. Organizational Structure of UD. Karangjati Furniture ..................................... 7
2. PEST Analysis Factor ..................................................................................... 22
3. Porter’s Five Forces Model ............................................................................. 24
4. Framework for Strategy Analysis Formulation .............................................. 40
5. Internal-External (IE) Matrix .......................................................................... 46
6. Operational Framework .................................................................................. 51
7. IE Matrix of UD. Karangjati Furniture ........................................................... 80
8. SWOT Analysis of UD. Karangjati Furniture ................................................ 82
xi
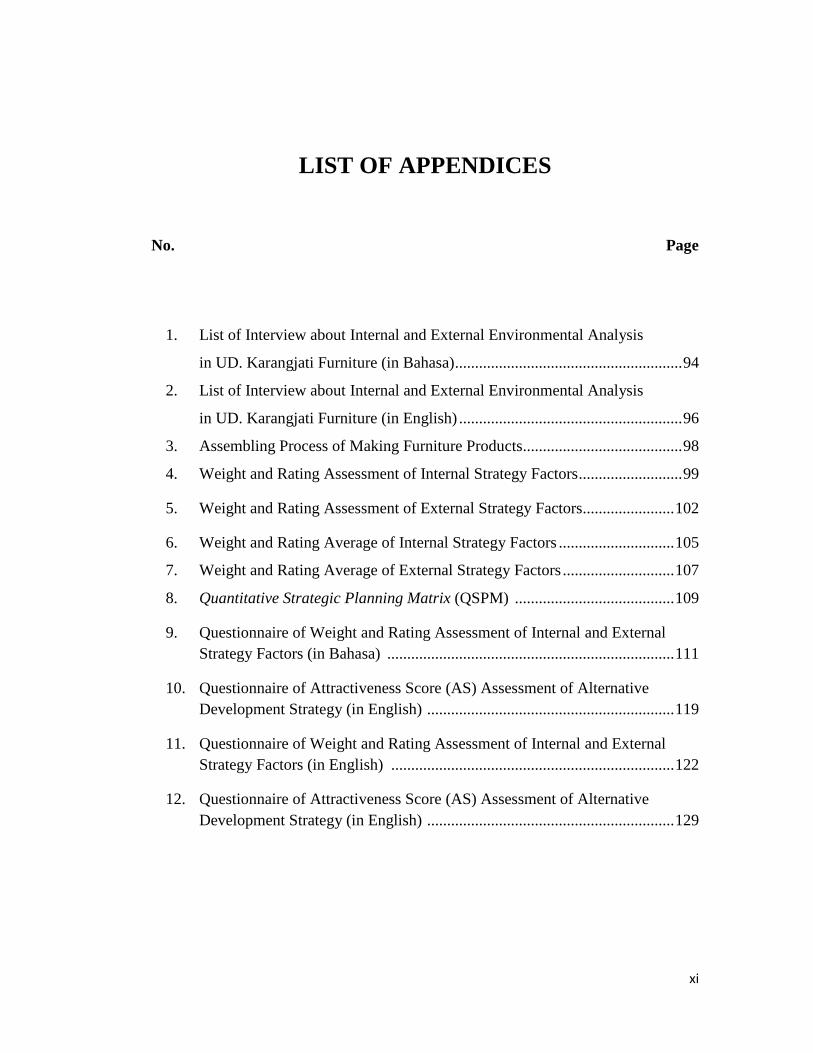
LIST OF APPENDICES
No. Page
1. List of Interview about Internal and External Environmental Analysis
in UD. Karangjati Furniture (in Bahasa) ......................................................... 94
2. List of Interview about Internal and External Environmental Analysis
in UD. Karangjati Furniture (in English) ........................................................ 96
3. Assembling Process of Making Furniture Products ........................................ 98
4. Weight and Rating Assessment of Internal Strategy Factors .......................... 99
5. Weight and Rating Assessment of External Strategy Factors....................... 102
6. Weight and Rating Average of Internal Strategy Factors ............................. 105
7. Weight and Rating Average of External Strategy Factors ............................ 107
8. Quantitative Strategic Planning Matrix (QSPM) ........................................ 109
9. Questionnaire of Weight and Rating Assessment of Internal and External Strategy Factors (in Bahasa) ........................................................................ 111
10. Questionnaire of Attractiveness Score (AS) Assessment of Alternative Development Strategy (in English) .............................................................. 119
11. Questionnaire of Weight and Rating Assessment of Internal and External Strategy Factors (in English) ....................................................................... 122
12. Questionnaire of Attractiveness Score (AS) Assessment of Alternative Development Strategy (in English) .............................................................. 129
1
CHAPTER I
INTRODUCTION
1.1 Background of the Study
The growth number of people in Indonesia who are growing each year
causing the competition in industry intensively. To face such competition, the role of
Small and Medium Enterprises (SMEs) or in Indonesia usually called as “UKM” will
be needed, especially for Indonesia's economic growth contributed to an increase in
foreign exchange for the country and absorb more labor which always increasing due
to the urbanization in unequal societies.
Many large enterprises are currently popular in the eyes of public have also
originated from SMEs. For that, the SMEs should be improved and continues to be
supported by the government and the community to continue to be active and
advanced to compete with other large companies.
Actually, to have the SMEs is also not so difficult as long as there is a will,
although not having the large capital enough. Many thought that to build a business
SME must have entrepreneurial spirit. But in fact, there are many SMEs do not have
a soul of entrepreneurship who has successfully developed their businesses. Some of
them were only intended to make a living for everyday needs (Livelihood Activities),
and also SMEs that come from craftsmen so that they can produce a work or craft
from their own results to the general public (Micro Enterprise).
Any company engaged in the field of products and services have a desire to
keep the business and deliver innovation in order to compete with other large and
medium-sized enterprises. Therefore, the company's management also needs to be
considered and re-improved in order the management system can run smoothly. In
general, the company's management includes marketing, production, human
2
resources, and finance. Marketing is the most important part of the management than
other because all company sales process begins with marketing that being offered to
consumers with an accurate and interesting ways. Marketing is also being the most
related part in making the business development strategy for one company in facing
the strict competition right now. There are so many business dvelopment strategies
that can be used by company at this time to achieve the favorable business position
so as to generate the maximum profit.
One form of SMEs that is prominent in business development is furniture
business. In each year, there are a lot of residence facilities were built as the number
of new families in almost every developing region and the potential to become a
comfortable and convenient area. Those facilities are like housing complex, office
buildings, apartments, hotels, shopping centers, and so forth. Of course, those builds
must also be supported by interior and exterior design which beautiful and
interesting, one of way is to provide an initiative to filling the room with various
models of furniture. Selection of furniture should also be adjusted with the concept of
buildings that have been built to impress the harmonious and unified, and the need of
furniture function. Today, there are many ranges of new furniture designs, such as
classic, minimalist, futuristic, and so on. Each person must have a different
perception of what they are interested of one furniture design. However, in terms of
quality of materials, wood furniture has a durable and artfully priority when
compared to other existing materials, such as iron, rattan, plastic, fabric, and so on.
Along with the increased competition in the field of furniture, it will have an
impact on the performance experienced by UD. Karangjati Furniture which has the
very simple managerial system. To that end, the company is very need to formulating
the most appropriate business strategy as an effort to develop the market and facing
the competition. The environmental industry of company that consists of internal and
external environment can be used as the identification of the company condition at
this time to determine the right business strategy for UD. Karangjati Furniture for the
future.
3
1.2 Company Profile
1.2.1 Company History and Development
UD. Karangjati Furniture was established by 1999 in Bekasi, West
Java. The company is a family business that started with a capital that is not
so big. The owner’s life experience who lives in a family with an income as a
carpenter is one of the cornerstones of success for the establishment of this
company. Before starting this furniture business, the owner has worked for 20
years as a private employee in one company in the field of forestry industry.
UD. Karangjati Furniture is currently engaged in the furniture manufacturing
with minimalist design by using teak wood or “Jati” as raw material. UD.
Karangjati manufactures a wide range of models for household furniture
ranging from bed, sofa, dining table, buffet, wardrobe, and so forth. Since the
establishment of company, the owner is committed to offering its furniture
products with minimalist design, because the changing tastes of today's
consumers are likely to choose minimalist furniture design which more
simple and modern to fill every space in their homes.
To give more satisfaction to consumers, the company also received
furniture orders based on buyer desires. All design products of UD.
Karangjati Furniture is the result of his own company which keeps abreast of
evolving trends and models in the public market. UD. Karangjati Furniture
can be regarded as the pioneer of minimalist furniture using teak wood, as
most the entrepreneurs of teak wood furniture using these materials to make
the carving furniture or commonly called as “Jepara” model.
Before focusing teak wood furniture in the manufacture of its
products, the company first had tried to make the material from mahogany
wood. There are several reasons that make the company change the raw
material to date. Among them are due to the fraudulent actions committed by
one competitor that imitate nearly all its products through the worker of UD.
Karangjati Furniture itself. In addition, the mahogany material is also more
4
likely to be eaten by termites and did not have a longer durability. The
company has approximately 14 employees in the finishing department, 21
employees in the assembling department, and 9 employees in the office. The
company uses the system to its workers by piece–work system since a long
time. Today the company also has a workshop in the area of Solo, Central
Java, which is used as a production warehouse to assist in the production of
furniture increased. The product marketing of UD. Karangjati Furniture
developed enough to attend the several exhibitions in Jakarta and surrounding
areas.
1.2.2 Vision, Mission and Objective of Company
In accordance with the company's tagline 'Serve Better than You
Think', UD. Karangjati Furniture has a vision which is "To Become a Future
Leader of Minimalist Furniture Company in Indonesia". The mission of the
company is "UD. Karangjati Furniture is committed to offering high quality
products and the latest innovations, always give priority to customer
satisfaction, also create and expand the employment opportunities for the
people ". The objective of company is to continue to develop the business
further to the future and dare to compete with other first larger and successful
competitors.
1.2.3 Location of Company
Since the year of 2007, UD. Karangjati Furniture has two workshops
were used as a furniture-making place. For assembling parts, UD. Karangjati
Furniture has a workshop in Solo, Central Java, which consists of three piece
workers who are neighbors and friends from the owner himself. The
workshop is also located in the near of owner's residence. Therefore, the teak
wood is also obtained from Central Java which has better quality when
5
viewed from the fiber and color if it compared with teak wood from West
Java.
Whereas the workshop located in Bekasi, West Java had the function
to finishing the unfinished products that have been delivered from Solo, and
also as the head office of UD. Karangjati Furniture. But the owner also
provides the piece workers for finishing in Solo, as well as carpenters in
Bekasi to anticipate when there is a lot of bookings and uncontrolled. In
addition, the company also can provide the employment to its employees at
any time because the payment system used by company is the piece – work
system based on the number of products they finish. Besides that, not
infrequently, the buyers also visited a workshop in Bekasi when they want to
order or just look the products of UD. Karangjati Furniture.
UD. Karangjati Furniture also has two showrooms in Bekasi area
functionalized to display the finished product. But both of showrooms have
the less sales due to the market area of showroom is not too accordance with
the price and product level of UD. Karangjati Furniture which tends to
demand by the upper middle class. Therefore, to support the maximum sales,
the company anticipate to do marketing by following exhibitions in various
malls / shopping centers and Jakarta Convention Center, which held in every
4 until 6 times a year.
1.2.4 Organizational Structure of Company
Nowadays, UD. Karangjati Furniture still uses a simple organizational
structure in the distribution of tasks for its employees. The simple
organizational structure generally only has two levels, which are the owner
and workers. The companies that are represented by a simple structure
usually managed by their owners as well as handle other work associated with
its products. It also occurs in UD. Karangjati Furniture, whereby the owner
must continue to control and be responsible even though the employees were
6
given the job functions of each respectively. The lack of human resources is
one of the causes that owner has to be responsible in a variety of matters
relating to the company's operations and production systems.
But besides the simple organizational structure which implemented by
company, management has determined job description at each position of
employees. However, because the company only has a few employees for the
office and administration division, sometimes every employee can perform
another job description so that the process can go quickly and smoothly.
The employees of UD. Furniture Karangjati mostly have the
educational background in elementary, junior high, or high school course.
Only director and manager who has the educational background of Bachelor
degree (S1). But this does not become a burden to the company as long as its
employees always applying discipline and willingness to work hard. For the
production, some piece-workers of assembling in Bekasi came from
Sukabumi area, where most of the population worked as a carpenter.
Whereas, the piece-workers of assembling in Solo and piece-workers of
finishing are coming from Central Java.
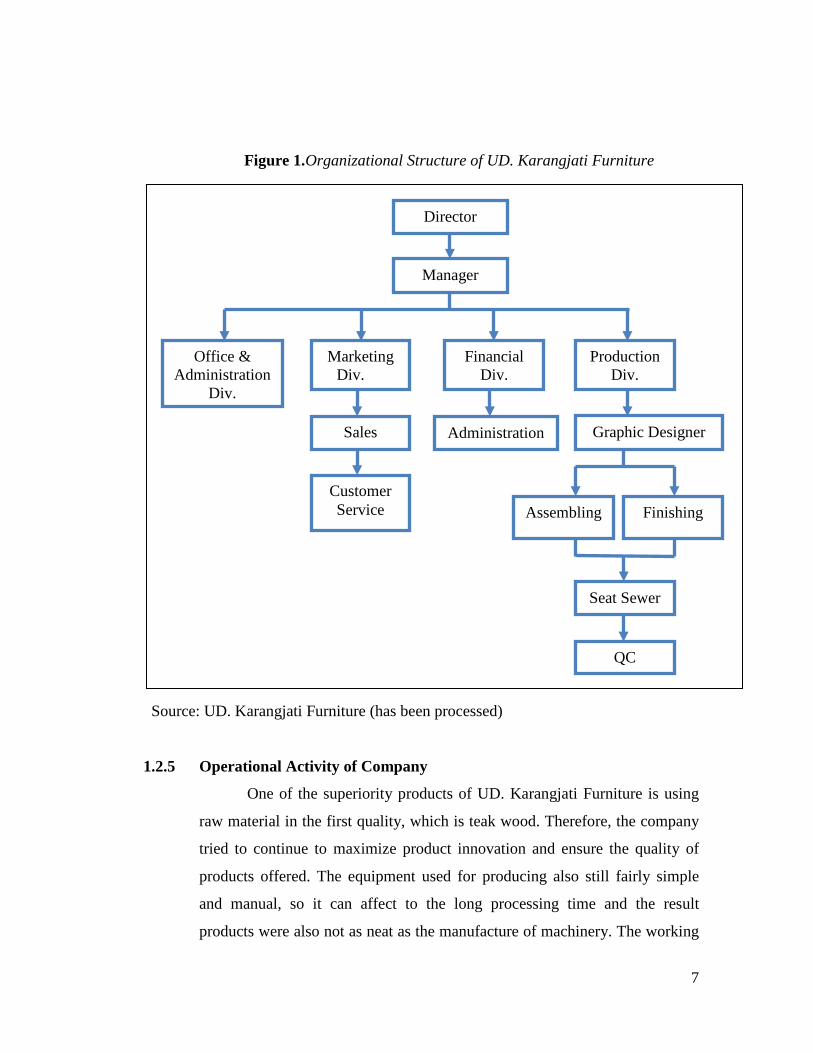
Here is the organizational structure of UD. Karangjati Furniture:
7
Figure 1.Organizational Structure of UD. Karangjati Furniture
Source: UD. Karangjati Furniture (has been processed)
1.2.5 Operational Activity of Company
One of the superiority products of UD. Karangjati Furniture is using
raw material in the first quality, which is teak wood. Therefore, the company
tried to continue to maximize product innovation and ensure the quality of
products offered. The equipment used for producing also still fairly simple
and manual, so it can affect to the long processing time and the result
products were also not as neat as the manufacture of machinery. The working
Director
Manager
Office & Administration
Div.
Marketing Div.
Financial Div.
ProductionDiv.
Customer Service
Graphic Designer Sales
Assembling Finishing
Seat Sewer
Administration
QC
8
system used since a long time ago is piece – work system, where the owner
did not interfere in the production system fully ranging from the purchase of
teak wood, and so forth, but leave it to all employees at a price negotiated by
both parties. By using this system, the company is only waiting for orders that
have been finished from the worker without having to think about the initial
product manufacturing. But the company will still control the work of worker
so that it will not happen a mistake and the product can fit with previous
order.
The business activity of Karangjati Furniture is currently using the
legal teak wood from Central Java. The workshop located in Solo, Central
Java is functioned as a place of assembling products which consist of three
piece workers. The order was done by using the "Job Order" sent via email to
each worker at a price that has been agreed by both parties. While the
workshops are located in Bekasi, West Java enabled as a head office,
finishing and manufacturing of products with plywood materials which
typically used to make the wardrobe and kitchen set.
The marketing activities of UD. Karangjati Furniture still includes
Jakarta and surrounding areas. To get the maximum sales in outside of
showroom, the company took the initiative to participate in the exhibition in
Mall which has good sales opportunities like in Cibubur Junction and
Metropolitan Mall for indefinite period. In addition, the company's sales also
maximized with the exhibition at Jakarta Convention Center. By following
the exhibition at JCC, it is not uncommon that company get customers from
out of town and get an order to fill the hotels, restaurants, apartments, and so
forth. To that end, following the exhibition at JCC, the company hopes to be
able to continue to reach out a wider market without having to open the
branch showroom in some areas outside of city.
9
1.2.6 The Current Business Development Strategy of UD. Karangjati
Furniture
The business development strategy of UD. Karangjati Furniture
currently can be said not maximized yet, due to the lack of employee needed
in marketing and office. So far the company only promotes its product by
attending various exhibitions organized by Jakarta Convention Center,
Cibubur Junction, and Metropolitan Mall. Those three places was chosen
because it can provide a sales company that is promising for the company as
well as to expand the marketing of products and well known by many people.
Previously, UD. Karangjati Furniture has participated in various exhibitions
at other Mall, but after see from the sales amount and customer purchasing
power, only those three places are considered the most effective.
The largest projects that ever undertaken by UD. Karangjati Furniture
is filling the Hotel, Restaurant, Salon and Spa. These projects were obtained
through the exhibition which organized by JCC. During the several
exhibitions, the marketing strategy of company actually very simple, which
does not rely on brochures or leaflet which distributed to every visitor who
come to the company’s booth, but only by sharing the company business card
with complete address and email, as well as several catalogs and photo
albums containing the various products of UD. Karangjati Furniture. The
strategy of distributing the brochures is considered less effective and efficient
way to attract the buyers, because often those brochures were thrown away by
the buyer and company also has to pay the high printing cost.
UD. Furniture Karangjati also ever have a personal website in year
2010, but this website is not run smoothly and never updated every month
because it is not supported by any employee who is an expert in the field of
Information Technology to design an attractive website to visit by people
from all over the region. The company currently only relies on and maintains
the trust of its customers who have enough to provide information about
10
quality product of UD. Karangjati Furniture from one customer to another
customer.
1.3 Problem’s Identified
UD. Karangjati Furniture is one of the industries engaged in the manufacture
of minimalist furniture. UD. Karangjati Furniture can be regarded as pioneer of
minimalist furniture made from teak or ‘Jati’ wood which is the top quality wood as
recognized in the strength and robustness of a held-to-all time. With a typical product
which has by company, of course, the company hopes to be able to continue to grow
their business with the innovative products that can be known by all over levels
whether local and international.
In conducting its business, UD. Karangjati Furniture has a problem in
handling the level of production to meet the market demands that company faces and
overcome the delays in delivery to every customer. In addition, the company also has
a problem in promoting their products beyond the exhibition involving several
companies. One example of media tools to promote a product is to use a website that
contains all sorts of company’s information. The increasing demand and a lack of
information on promotional product caused by the company has not been offset of its
productivity, limited skills of employees, limited capital, and competition. Therefore,
UD. Furniture Karangjati leads to have a proper business strategy in order to run the
business which can continue to grow, has a sustainable advantage, and able to
generate the maximum profit.
In order to formulate an appropriate business strategy, a company must be
able to identify the environmental factors that company can be utilized in formulating
the company's business development strategy. Environmental analysis that includes
internal and external environment aims to determine whether the company can
harness the power possessed, owned minimize weaknesses, take advantage of
opportunities of the company, and anticipate emerging threats from the external
environment faced by the company.
11
1.4 Statement of the Problem
Based on the above identification problems, the problems faced by UD.Karangjati
Furniture and which will be analyzed in this study can be formulated as follows:
1. What are the internal factors that become the strengths and weaknesses of the
company, as well as any external factors which belong to the opportunities
and threats affecting product marketing at UD.Karangjati Furni
2. What are business strategies that have been carried by UD. Karangjati
Furniture?
3. What are the appropriate alternative strategies which can be done by UD.
Karangjati Furniture to expand its business?
4. What business strategies are appropriate to be used as a top priority by
UD.Karangjati Furniture?
1.5 Research Objective
The objectives of this study are as follows:
1. Identify and analyze the internal and external factors that exist in UD. Karangjati
Furniture.
2. Assessing the business strategy made by UD. Karangjati Furniture up till now.
3. Developing alternative business strategies that are appropriate for UD. Karangjati
Furniture based on the results of analysis.
4. Determine the most appropriate business strategy to develop the business UD.
Karangjati Furniture.
1.6 Significance of the Study
The usability of this research is expected to reach more of this following:
1. Can provide the input to be considered for UD. Karangjati Furniture in
determining the priorities business strategies in order to maintain and develop
their business further.
12
2. Researcher can learn and understand the formulation of business strategy at UD.
Furniture Karangjati thus helping the company develop the family business.
3. Can be used as a useful reference for future research.
1.7 Scope and Limitations of the Study
The scope and limitation of this study is to analyze the business strategy made
by a furniture manufacturing company in Bekasi, West Java which is UD. Karangjati
Furniture in an effort to beat the competition. The analysis is done by identifying
internal and external factors into strengths, weaknesses, opportunities and threats
affecting the marketing of the company's furniture products.
1.8 Research Outlines
This final project will be presented in five chapters, which can be summarized as
follows:
CHAPTER I. Introduction
The introductory chapter is to explain the background of study, the brief company
profile of UD. Karangjati Furniture, problems identified, statement of problems, the
objective of research, significance of the study, scope and limitations of the study,
the outline structure of final project, and some definitions of terms which are related
to the topic of this final project.
CHAPTER II. Literature Review
The second chapter explains the literature review and theoretical correlation with
the study. Those could be including the definitions of strategy, strategic management,
marketing strategy, and the concepts of furniture and also the tools design of IFE,
EFE, SWOT, and QSPM Matrix.
CHAPTER III. Research Methodology
The third chapter explains the observation type of the research and also the
methodology of the problem solving by using the theory from literature study. It also
contains the figure of operational framework about the step of doing this research.
13
CHAPTER IV. Analysis of Data and Interpretation of Results
The fourth chapter shows how the proposed tool is being developed and designed
based on the analyzed data. It is also includes the interpretation data analysis and
design which could give the best strategy for company in future according to the
current environment condition.
CHAPTER V. Conclusion and Suggestion
The last chapter contains of the summary of what activities that have been done
during the research and what the results that could be obtained after did any
observation and analyzed the data of the observation. In this chapter also given any
suggestion for company from the previous strategy analysis.
1.9 Definitions of Terms
Here are some definitions of terms which are related to the writing of this final
project, those are:
1. Strategy
The process of determining the top leaders plan to focus on the organization's
long-term goals, along with the preparation of a way or effort how to make that
goal achievable. There are many kinds of strategy which almost did by any
companies, such as acquisition, diversification, product development, market
penetration, joint venture, etc.
2. Strategic Management
The management process through the formulation, organization, execution and
evaluation of the organizational resources to meet the desired goals in the future.
Strategic management integrates the activities of the various functional sectors of
a business, such as management, marketing, finance and accounting, production
and operation, etc.
14
3. IFE Matrix (Internal Factor Evaluation)
The formulation process to find the alternative strategies by classifies the internal
factors that being the strength and weaknesses of the company by using
questionnaire method.
4. EFE Matrix (External Factor Evaluation)
The formulation process to find the alternative strategies by classifies the external
factors into opportunities and threats of the company. EFE Matrix also uses the
questionnaire which distributed to the relevant parties.
5. IE Matrix (Internal – External)
IE matrix is obtained based on the combination of the weighted score of IFE and
EFE Matrix. IE Matrix is one of the parameters used to describe the position of
the company that shown in nine cells and divided into three major parts that have
different strategy implications; those are Grow and build, Hold and Maintain,
and Harvest or Divest.
6. SWOT Matrix (Strengths – Weaknesses – Opportunities – Threats)
A methodology of examining potential strategies derived from the synthesis of
organizational strengths, weaknesses, opportunities and threats (SWOT). It can
be used to measure an organization’s competencies and identify opportunities to
taken by company in the future.
7. QSPM (Quantitative Strategic Planning Matrix)
It is approach attempts to objectively select the best strategy using input from
other management techniques and some easy computations. In other words, the
QSPM method uses inputs from stage 1 analyses, matches them with results from
stage 2 analyses, and then decides objectively among alternative strategies.
8. Marketing
It is the social process by which individuals and groups obtain what they need
and want through creating and exchanging products and value with others and
also the competitive positioning of products and services in the minds of
customers.
15
9. Marketing Strategy
It is a strategy of company which combines all of its marketing goals into one
comprehensive plan. A good marketing strategy should be drawn from market
research and focus on the right product mix in order to achieve the maximum
profit potential and sustain the business. In designing a marketing strategy, the
company should implicate the concept of STP (Segmentation, Targeting, and
Positioning)
10. Product’s Marketing Mix
Product marketing mix is a set of four decisions which need to be taken before
launching any new product. There are four variables to help the company in
making strategic decisions necessary for the smooth running of any product/
organization. These variables are; Product, Price, Place and Promotions.
11. Furniture
The things that exist at home and used by residents to sit, lie down, or store the
small and important objects. The raw material for making furniture is very
diverse, some made of wood, metal, leather, bamboo, plastic, fabric and so forth.
16
CHAPTER II
LITERATURE REVIEW
2.1 Strategy Concepts
Every company should have the strategy to maintain their business and also
be able to compete with many competitors. Moreover in the modern era right now,
there are many companies which operate in different business areas because of needs
and wants of customers that always changed and increased over time. There are many
strategies which can be chosen by company, like geographic expansion, acquisition,
diversification, product development, market penetration, joint venture, and so on.
The common meaning of strategy is the process of determining the top leaders plan
to focus on the organization's long-term goals, along with the preparation of a way or
effort how to make that goal achievable. While, in the specific meaning the strategy
is an action that is incremental (ever-increasing) and continuous and is based on the
point of view of what is expected by the customers in the future. Thus, the strategy
almost always begins with what can happen, and rather than starting from what
happened (Viklund, 2009).
According to Drummond & Ensor (2001, p. 3), strategy has a wide-ranging
impact and therefore affects all functional areas within the organization. Effective
strategy is able to co-ordinate the different functions/activities within the
organization in order to achieve common goals. By taking a ‘whole-organization’
view of the corporation, managers should be better able to target resources, eliminate
waste and generate synergy.
2.2 Strategic Management Concepts
Strategic management is the management process through the formulation,
organization, execution and evaluation of the organizational resources to meet the
17
desired goals in the future. This definition provides an assessment as to the
management process and functions of the different levels of managers on how the
formulation of the organizational goals, the designed structure and systems, the
strategic position to implement the quality assurance program and evaluate the
designed systems of improvement (HubPages Inc., 2012).
According to David (2010, p. 5), strategic management can be defined as an
art and science of formulating, implementing, and evaluating the cross – functional
decisions that will enable an organization to achieve its objectives. Strategic
management integrates the activities of the various functional sectors of a business,
such as management, marketing, finance and accounting, production and operation,
research and development, and computerized system to achieve the organizational
goals.
One of the major role of strategic management is to incorporate various
functional areas of the organization completely, as well as, to ensure these functional
areas harmonize and get together well. Another role of strategic management is to
keep a continuous eye on the goals and objectives of the organization
(ManagementStudyGuide, 2008). The purpose of strategic management is to exploit
and create new and different opportunities for tomorrow or long term planning, and
seek to optimize the trends today for tomorrow. Additionally, strategic management
can provide common tools and analytical techniques, enabling the assessment and
control of complex issues, situations and functional areas.
2.3 Strategic Management Process
The process of strategic management consists of three phases, which is Strategy
Formulation, Strategy Implementation, and Strategy Assessment (David, 2010):
a. Strategy Formulation Phase
The strategy formulation phase includes the development of vision, mission and long
term goal setting, identification of external opportunities and threats, internal
18
strengths and weaknesses, searching of the alternative strategies, and selection of
specific strategies to achieve the goals.
b. Strategy Implementation Phase
The strategy implementation phase requires companies to set annual goals, policies,
motivate employees and allocate resources so that the strategies that have been
formulated can be running. Implementation strategy include the supportive culture
development on strategy, creating an effective organizational structure, re-
deployment marketing efforts, preparing budgets, development and utilization of
information systems and linking employee compensation to the organizational
performance. The successful implementation of this strategy depends on the ability
of managers to motivate employees, which is more an art than a science. The strategy
has been formulated earlier, if not applied properly can completely being useless.
c. Strategy Assessment Phase
Strategy assessment or evaluation phase is the last stage in strategic management.
The manager must know when a particular strategy is not going well. There are three
basic strategies assessment activities; the review of internal and external factors
which are the basis for current strategies, measuring performance, and taking the
corrective actions. Companies that have been successful at this time do not be easy
for complacency, because of its current success does not always work later.
2.4 Strategy Formulation
To decide the best course of action for accomplishing organizational
objectives and hence achieving organizational purpose, there are any steps to
formulating the strategy to select the prioritize strategies for developing the
company. Started from determine vision, mission and decision of company,
identification of internal and external environment analysis, find some alternative
strategies by using Internal – External (IE) Matrix and SWOT Matrix analysis, and
the last step is determine the most suitable strategy by using Quantitative Strategic
Planning Matrix.
19
2.4.1 Vision, Mission and Objective of Company
A good and responsible company that wants to maintain the business
in the long term should have thought concern about the start – up company at
first time, which is by setting the vision, mission and goals of the company.
Vision
Vision is a series of sentences that express a goal or dream of company or
organization that want to achieve in the future. Or it can be said that
vision is the “want to be” statement of the organization or company.
Vision is also very crucial for enterprises to ensure long-term
sustainability and success, according to Wibisono in (Ardian, 2012).
Some of the requirements that should be attentions to define the vision
statement are: (1) future oriented; (2) not be made based on the current
condition; (3) expressing the creativity; and (4) based on the principle of
value containing the respect to society (Saujana, 2012).
Mission
Basically the mission is the fundamental reason for the existence of an
organization. The mission statement of the organization, especially at the
business unit level, is to determine the limits and purpose of our business
activities. So the formulation of the mission is the realization that will
make an organization is able to produce quality products and services that
meet the needs, wants and expectations of customers according to
Drucker in (Ardian, 2012).
Goals
The company's goal is a statement about wants to be used as guidelines
for the management of the company to achieve a particular result of the
activities carried out by a certain time dimension (Purwanto, 2008).
Characteristics of goal include the following: (1) appropriate, goals
aligned with the vision and mission, (2) the time dimension, the goal must
20
be concrete and can be anticipated when it occurred, (3) feasible, the goal
should be a determination that can be realized, (4) flexible, goal can
always be adapted to the changing of circumstances and conditions, (5)
easy to understand.
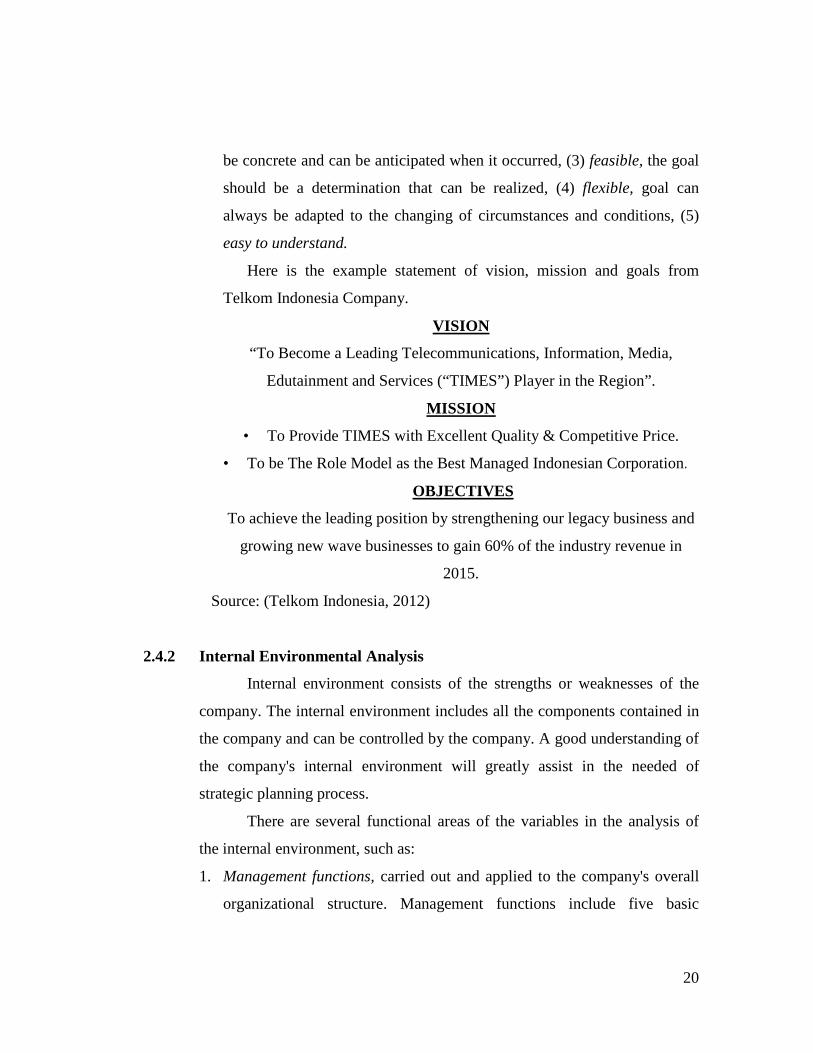
Here is the example statement of vision, mission and goals from
Telkom Indonesia Company.
VISION
“To Become a Leading Telecommunications, Information, Media,
Edutainment and Services (“TIMES”) Player in the Region”.
MISSION
• To Provide TIMES with Excellent Quality & Competitive Price.
• To be The Role Model as the Best Managed Indonesian Corporation.
OBJECTIVES
To achieve the leading position by strengthening our legacy business and
growing new wave businesses to gain 60% of the industry revenue in
2015.
Source: (Telkom Indonesia, 2012)
2.4.2 Internal Environmental Analysis
Internal environment consists of the strengths or weaknesses of the
company. The internal environment includes all the components contained in
the company and can be controlled by the company. A good understanding of
the company's internal environment will greatly assist in the needed of
strategic planning process.
There are several functional areas of the variables in the analysis of
the internal environment, such as:
1. Management functions, carried out and applied to the company's overall
organizational structure. Management functions include five basic
21
activities, including planning, organizing, motivating, staff managing and
controlling.
2. Marketing function, which is the process of identifying, anticipating,
creating and fulfilling customers' needs for goods and services, covering
seven basic function, which are the analysis of customers, sales of
products / services, planning the product / service, pricing, distribution,
marketing research and analysis the opportunities.
3. Finance function, is the best indicator of competitive position and
attractiveness of company. It can be seen from the company's financial
ratios including liquidity ratios, leverage, activity, profitability and
growth.
4. Production/ Operations function, composed of all the activities that
transform inputs into goods or services, includes five basic functions,
namely the process, capacity, inventory, workforce and quality.
5. Research and Development function, consists of activities undertaken to
improve the company's competitive capability, usually directed at the new
products.
6. Management Information Systems function, useful for improving the
performance of company by improving the quality of managerial
decisions. This function contains a database of vital records that are very
useful for the company.
2.4.3 External Environmental Analysis
An analysis of the external environmental is undertaken in order to
discover the opportunities and threats that are evolving and that need to be
addressed by the organization.
According to Drummond & Ensor (2001, p. 22) the external forces
can be divided by two, which are Macro-Environmental Analysis and
Industry Analysis.
22
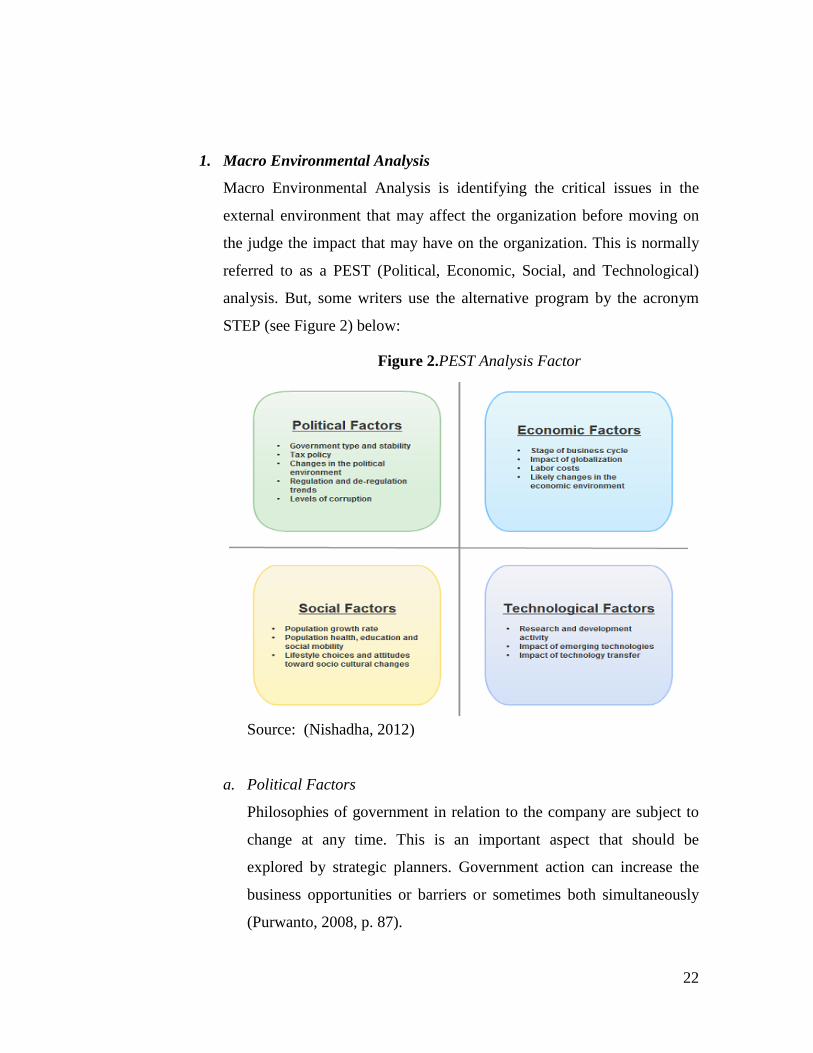
1. Macro Environmental Analysis
Macro Environmental Analysis is identifying the critical issues in the
external environment that may affect the organization before moving on
the judge the impact that may have on the organization. This is normally
referred to as a PEST (Political, Economic, Social, and Technological)
analysis. But, some writers use the alternative program by the acronym
STEP (see Figure 2) below:
Source: (Nishadha, 2012)
a. Political Factors
Philosophies of government in relation to the company are subject to
change at any time. This is an important aspect that should be
explored by strategic planners. Government action can increase the
business opportunities or barriers or sometimes both simultaneously
(Purwanto, 2008, p. 87).
Figure 2.PEST Analysis Factor
23
b. Economic Factors
(Umar, 2008) explains the economic conditions of a region or a country
can affect a company's business climate. The worse of economy, the
worse of business climate as well. Some key factors to consider in
analyzing the economy of a region or country are: the business cycle,
energy, inflation, interest rates, investment, prices of products and
services, productivity, and labor.
c. Social Factors
Changes in social cultural, demographic and the environment have a
major impact on almost products, services, markets, and consumers.
Almost all companies were stuck by the opportunities and threats
from these factors along with the new trends that shape the way
people live, work, produce, and consume. The new trends on
customers will create the different types, and consequently, creating
demand for goods, services and even the different strategies.
d. Technological Factors
There is a great danger in using a particular technology to define an
industry. In a situation where technological developments are fast-
moving it is critical to understand the fundamental consumer needs
which the organization’s technology is currently serving. Identifying
new technologies that can service those consumer needs more
completely or economically is the critical part of this area of the
analysis (Drummond & Ensor, 2001, p. 23).
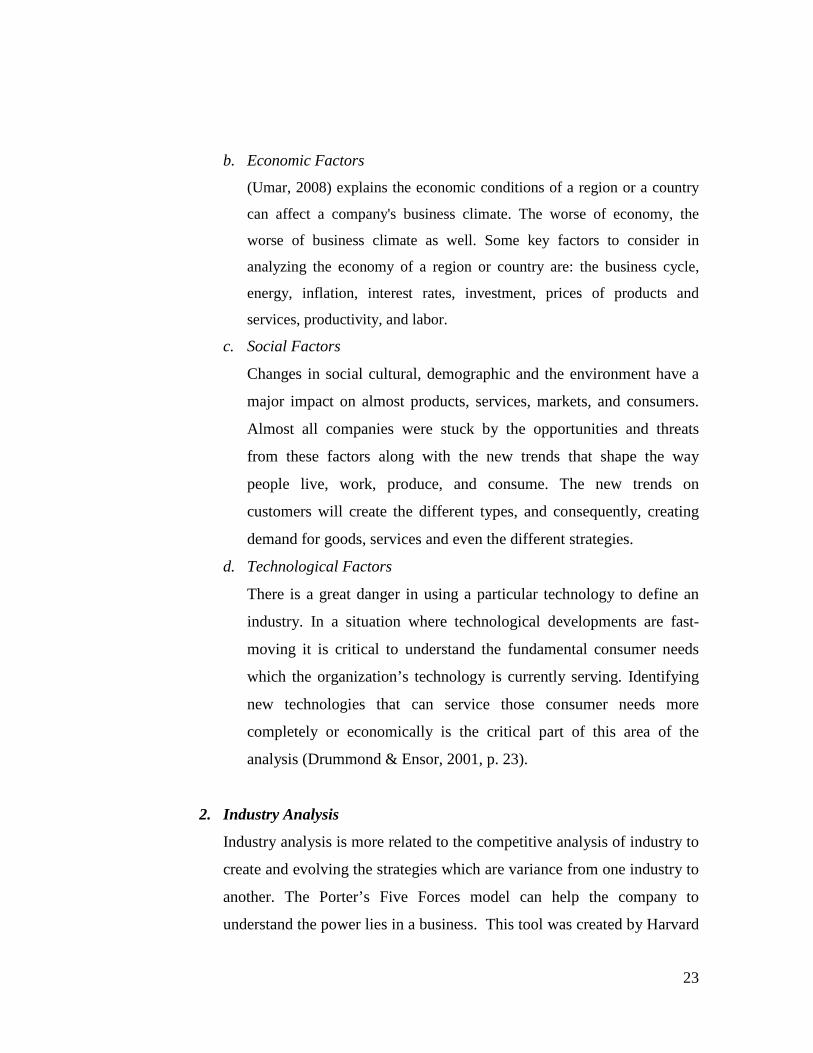
2. Industry Analysis
Industry analysis is more related to the competitive analysis of industry to
create and evolving the strategies which are variance from one industry to
another. The Porter’s Five Forces model can help the company to
understand the power lies in a business. This tool was created by Harvard
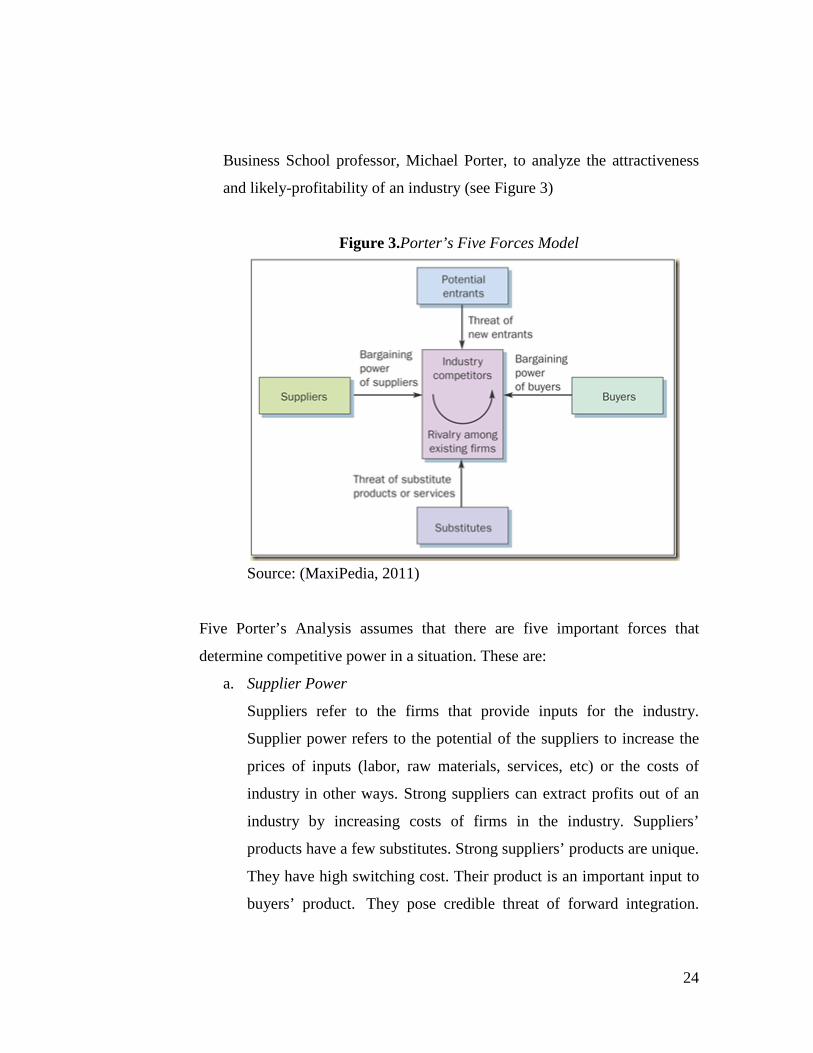
24
Business School professor, Michael Porter, to analyze the attractiveness
and likely-profitability of an industry (see Figure 3)
Figure 3.Porter’s Five Forces Model
Source: (MaxiPedia, 2011)
Five Porter’s Analysis assumes that there are five important forces that
determine competitive power in a situation. These are:
a. Supplier Power
Suppliers refer to the firms that provide inputs for the industry.
Supplier power refers to the potential of the suppliers to increase the
prices of inputs (labor, raw materials, services, etc) or the costs of
industry in other ways. Strong suppliers can extract profits out of an
industry by increasing costs of firms in the industry. Suppliers’
products have a few substitutes. Strong suppliers’ products are unique.
They have high switching cost. Their product is an important input to
buyers’ product. They pose credible threat of forward integration.
25
Buyers are not significant to strong suppliers. In this way, they are
regarded as a threat (Management Study Guide, 2008).
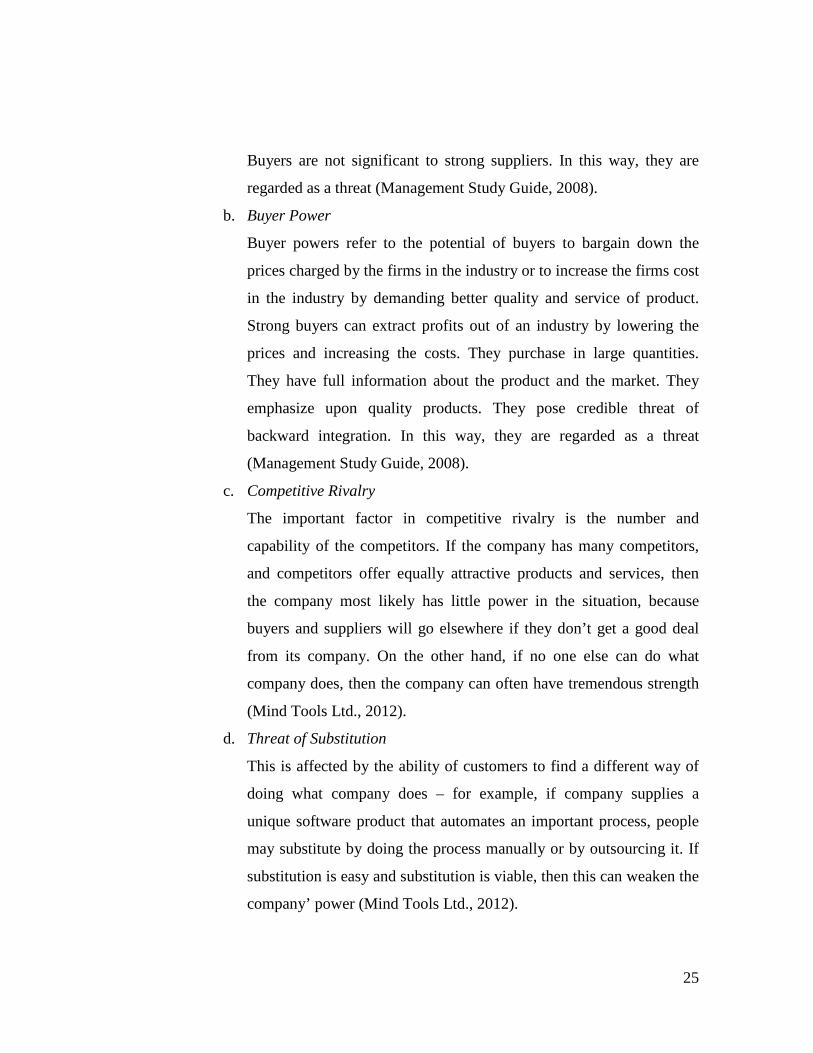
b. Buyer Power
Buyer powers refer to the potential of buyers to bargain down the
prices charged by the firms in the industry or to increase the firms cost
in the industry by demanding better quality and service of product.
Strong buyers can extract profits out of an industry by lowering the
prices and increasing the costs. They purchase in large quantities.
They have full information about the product and the market. They
emphasize upon quality products. They pose credible threat of
backward integration. In this way, they are regarded as a threat
(Management Study Guide, 2008).
c. Competitive Rivalry
The important factor in competitive rivalry is the number and
capability of the competitors. If the company has many competitors,
and competitors offer equally attractive products and services, then
the company most likely has little power in the situation, because
buyers and suppliers will go elsewhere if they don’t get a good deal
from its company. On the other hand, if no one else can do what
company does, then the company can often have tremendous strength
(Mind Tools Ltd., 2012).
d. Threat of Substitution
This is affected by the ability of customers to find a different way of
doing what company does – for example, if company supplies a
unique software product that automates an important process, people
may substitute by doing the process manually or by outsourcing it. If
substitution is easy and substitution is viable, then this can weaken the
company’ power (Mind Tools Ltd., 2012).
26
e. Threat of New Entry
Power is also affected by the ability of people to enter company’s
market. If it costs little in time or money to enter the market and
compete effectively, if there are few economies of scale in place, or if
company have little protection for key technologies, then new
competitors can quickly enter the market and weaken company’
position. If company has strong and durable barriers to entry, then it
can preserve a favorable position and take fair advantage of it (Mind
Tools Ltd., 2012).
2.4.4 IE Matrix Analysis
IE matrix is obtained based on the combination of the weighted score
of IFE and EFE Matrix which already done before to identifying the internal
and external factors that exist in the company. IE Matrix is one of the
parameters used to describe the position of the company so that the
alternative strategies that will be proposed to the company are accordance
with the company's current condition. In addition, IE matrix can describe the
hopes that company will do in the future.
IE Matrix is positioning the various divisions of a company which
then will be analyzed in more detail. IE matrix shown in nine cells, which
divided into three major parts that have different strategy implications, those
are Grow and build, Hold and Maintain, and Harvest or Divest.
2.4.5 SWOT Matrix Analysis
SWOT (Strengths, Weaknesses, Opportunities, and Threats) analysis
can be used to measure the company’s competencies and identify the
opportunities to taken by business management in the future. SWOT analysis
can improve the current situation of company through identify the various
factors which can impact performance of company itself.
27
SWOT model analyzes the factors which are internal in company and
also the factors that affect the company from outside. Internal factors can be
seen from the Strengths and Weaknesses of company, such as employee skills
and products. External factors include Opportunities and Threats faced by
company, such as competitors or economic situation.
2.4.6 QSPM Analysis
QSPM (Quantitative Strategic Planning Matrix) is the only one
analytical technique that is designed to determine the relative attractiveness of
various alternative actions. This technique objectively indicates which
strategy is the best based on the full range of alternative strategies that have
been performed on the input stage and the matching stage of strategy
formulation before.
In some ways, QSPM has some advantages and disadvantages,
including: (1) strategies can be examined sequentially or simultaneously, (2)
there is no limit to the number of strategies that can be examined, (3) required
the research to integrate internal and external factors involved in the decision
process.
2.5 Marketing Concepts
2.5.1 Definitions of Marketing
The word of “Marketing” is familiar with the technique which most
companies used to attract the customers to buy the offering products or
services. In the modern era right now, there are many ways to do marketing in
effectively. If the company can know how to marketing the goods or services,
surely the company can gives the benefit and make satisfying the customer
through the transactional exchange. Marketing is the important factor in
management process because it regards to the entire activities from the
production process until the distribution to the customer.
28
Here are some definitions of marketing according to the different
experts:
1. Theodore C. Levitt, of Harvard Business School emeritus professor of
marketing on (Pixel Gremlins, 2011) stated that “Marketing differs
from selling. Selling concerns itself with the tricks and techniques of
getting people to exchange their cash for your product. It is not concerned
with the values that the exchange is all about. And it does not, as
marketing invariably does, view the entire business process as consisting
of a tightly integrated effort to discover, create, arouse, and satisfy
customer needs”.
2. According to Kotler (2005, p. 10), “Marketing is the social process by
which individuals and groups obtain what they need and want through
creating and exchanging products and value with others”.
3. Marketing is about the competitive positioning of products and services in
the minds of the customers. It is also about the communication of
messages and images (reflecting product and service positioning) and the
means which are used to convey these messages and images to the
customers (Proctor, 2000).
Based on definitions above, it can conclude that marketing
basically covers broader than selling, which is how the company can meet
the needs and provide maximum satisfaction to the individual or group
that starts with the planning stage like selling and promoting, up to the
final stage of distribution for the company to be able to compete with
other competitors and deliver innovation in the long term. Along with the
times which always demanding the change of customer tastes and the
innovation of one model or design product, marketing is always on-going
and never ends. It always changing, updating, and transforming. The
company should adapt with it and choose the marketing system which
likely reputed to give a higher profit.
29
2.5.2 Functions of Marketing
Marketing can be described as the process of defining, anticipating,
creating and fulfilling the needs and desires of consumers for products and
services. There are seven main functions of marketing according to (jstaniec,
2008):
1. Pricing; setting and communicating the value of products and services.
Setting the price at the right level.
2. Product/ Service Management; designing, developing, maintaining,
improving, and acquiring products and services that meet consumer
needs.
3. Distribution; determining the best ways for customers to locate, obtain,
and use the products and services of an organization. Involves moving the
product each step from the design idea to the consumer.
4. Financing; budgeting for marketing activities, obtaining the necessary
funds needed for operations, and providing financial assistance to
customers so they can purchase the business products and services.
5. Marketing – Information Management; obtaining, managing, and using
information about customers want to improve business decision making,
performance of marketing activities, and determining what will sell.
6. Selling; communicating directly with potential customers to determine
and satisfy their needs.
7. Promotion; communicating with customers about the product to achieve
the desired result – customer demand for and purchase of the product.
Include advertising, personal selling, publicity, and public relations.
2.5.3 Marketing Strategy
The marketing strategy is defined as a development of strategy
analysis and implementation of the strategy in determining the target market
for the product in each business unit, setting the marketing objectives, and the
30
development, implementation, and management of marketing program
strategies, define the market positioning which designed to fulfill the target
market consumers.
In designing a marketing strategy, the most important thing that needs
to be done by the marketing management is the application of the concept of
STP (Segmentation, Targeting, and Positioning), where this concept is
interrelated to each other.
A. Segmentation
The first step which takes place in STP is the segmentation part. This
is mainly because, before segmentation, the customer base is known as a
population or group of people which have no differentiation between them. It
is impossible if company doing market in every population that might wasting
the resources. Because of that, the company should first perform the market
segmentation on the products that will sell to helps define the population in
smaller groups or segments. Market segmentation is essentially divided into
market potential of certain parts; able unfounded demographic distribution,
based on economic class and education, and also by lifestyle (psychographic)
(Durham Associates, 2010).
B. Targeting
After company knows the segment market of their products, the next
step is start targeting those segments. Targeting can be said to be a sub
concept of segmentation. In this case, of course, the series of marketing
programs must fit with the characteristics of the target market which company
wants to go. Targeting also plays a critical role in the marketing mix mainly
in the product and pricing phase (Durham Associates, 2010).
C. Positioning
In addition to targeting, then the next step is conduct the product
positioning. This step means creating a unique product position in the minds
and perceptions of potential customers to be targeted. The right positioning is
31
very important, because company can gain more sympathies from the minds
of customers. And further, it can encourage the customer to make purchases
of products offered. Positioning mainly affects the promotion and placement
stage of marketing mix (Durham Associates, 2010).
2.5.4 Product’s Marketing Mix
Product marketing mix is a set of four decisions which need to be
taken before launching any new product. This marketing mix is mainly used
in case of Tangible Goods. These variables are also known as the 4 P’s of
marketing. These four variables help the company in making strategic
decisions necessary for the smooth running of any product/ organization.
These variables are; Product, Price, Place and Promotions. These variables
are never constant and may be changed over time. However, a change in one
of the variables may cause a change in all other variables as well (Bhasin,
2011). The variables are as follows:
1. Product
The products or services of an organization help to create the image of the
firm in the mind of customer. This image is reflected in the customers’
perceptions and feelings about its products or services. Products are more
than tangible objects and services are more than visible activity.
Organizations have to understand the nature of the needs and want in order to
appreciate the kind of benefits people expect to obtain. ‘Product decisions’
have to be made with respect to these various attributes. When a producer of
goods or services makes decisions about ‘the product’, he or she is making
decisions about the following: quality, features, options, style, brand name,
packaging, sizes, services, warranties, returns (McCarthy, 2005).
Philip Kotler in (Priyank, 2011) suggested that a product should be
viewed in three levels:
32
a Core Product
This level involves about the core benefit of product offered by company.
When designing products, marketers must first define the core, problem
solving benefits or services that consumer seek.
b Actual Product
The strategy at this level involves organizations branding, adding
features and benefits to ensure that their product offers a differential
advantage from their competitors.
c Augmented Product
This level involves about the additional non-tangible benefits which
company offer. Competition at this level is based around after sales
service, warranties, delivery, and so on.
2. Price
Price of a product depends on a lot of different variables and hence it is
constantly updated. Major consideration in pricing is the costing of the
product, the advertising and marketing expenses, any price fluctuations in the
market, distribution costs etc. Many of these factors can change separately.
Thus the pricing has to be such that it can bear the brunt of changes for a
certain period of time. However, if all these variables change, then the pricing
of a product has to be increased and decreased accordingly. Similarly, pricing
also affects the targeting and positioning of a product. Pricing is used for
sales promotions in the form of trade discounts (Bhasin, 2011).
There are several pricing strategies which are mostly implemented by
some companies according to:
a Geographical Pricing
Geographical pricing involves the company in deciding how to price its
products to customers in different locations and countries.
33
b Price Discounts and Allowances
The role of discount offering discounts can be a useful tactic in response
to aggressive competition by a competitor. However, discounting can be
dangerous unless carefully controlled and conceived as part of your
overall marketing strategy.
c Promotional Pricing
Promotional-pricing strategies are often a zero-sum game. If they work,
competitors copy them and they lose their effectiveness. If they do not
work, they waste money that could have been put into other marketing
tools, such as building up product quality and service or strengthening
product image through advertising.
d Discriminatory Pricing
Companies often adjust their basic price to accommodate differences in
customers, products, locations, and so on. Price discrimination occurs
when a company sells a product or service at two or more prices that do
not reflect a proportional difference in costs.
e Product – Mix Pricing
Price-setting logic must be modified when the product is part of a product
mix. In this case, the firm searches for a set of prices that maximizes
profits on the total mix. Pricing is difficult because the various products
have demand and cost interrelationships and are subject to different
degrees of competition.
3. Place
Place refers to how a company will distribute the offering product or service
to the end user. The company must distribute the product to the user at the
right place at the right time. Efficient and effective distribution is important if
the company is to meet its overall marketing objectives. If a company
underestimates demand and customers cannot purchase products because of
34
it, profitability will be affected. Two types of channel of distribution methods
are available. Indirect distribution involves distributing the product by the use
of an intermediary for example a manufacturer selling to a wholesaler and
then on to the retailer. Direct distribution involves distributing direct from a
manufacturer to the consumer (McCarthy, 2005).
4. Promotion
Promotion is the way for company to choose the target groups informed or
educated about the products offered. This includes the weapons in the
marketing armory, like advertising, selling, sales promotions, public relations,
etc. Promotion has become the most important marketing mix to focus on
(valuebasedmanagement, 2012). The proportion of a firm’s marketing
communications budget that is spent on each of these activities varies
somewhat across organizations and industries. There is a tendency, for
example, in the case of industrial and business goods for more effort to be put
into personal selling, whereas advertising features prominently in the case of
fast-moving consumer goods. Despite these broad generalizations,
considerable variation exists within product classes. In the case of advertising
there is also the complicating factor that there are a number of advertising
vehicles which can be used to communicate about the product: television,
radio, newspapers, magazines, mobiles, posters, etc.
2.6 Furniture Concepts
The concept of furniture incorporated into one of discussion on this research
because the company that observed by researcher included into the furniture
manufacturing industry. It is intended that the reader also gets a bit of knowledge
about a variety of matters relating to the terms of furniture, which consists of the
definition and types of furniture variations that often exist in public market.
35
2.6.1 Definitions of Furniture
The word of furniture comes from French "fourniture" in year 1520-
30 M. Fourniture has the origin word of fournir which has a meaning of
furnish or furniture or room (Emzetha, 2012). Many people mention the word
"furniture" in other words which is "mebel". Actually, those two words have
different meanings, but have the same meaning of assigned objects, ie tables,
chairs, and cabinets.
“Mebel" is derived from the word movable, which means it can move.
In ancient times, tables, chairs, and cabinets relatively easily moved from
large rocks, walls, and roof. In other words, furniture or mebel are the things
that exist at home and used by residents to sit, lie down, or store the small and
important objects. The raw material for making furniture is very diverse,
some made of wood, metal, leather, bamboo, plastic, and so forth.
2.6.2 Kinds of Furniture
There are several types of raw materials for making furniture that is
available in local and international market (Atfestoro, 2012). Among them are
the following:
a Furniture from solid wood
Solid wood is the strongest material and most durable than processes
wood. However, solid wood has limited supply so the price is very
expensive. There are various kinds of solid wood commonly used by
many furniture industries, including teak wood, sungkai wood, nyatoh
wood, and so forth. From the several types of solid wood, teak wood is
the most popular because of their quality, resistance to weather
conditions, termite resistant, and the fiber interest. This wood is also the
first class of wood that many processed into classy furniture.
36
b Furniture from wood processed plant
There are various types of wood processing plants available in the
Indonesian market. Among them are finir (thin sheets of wood from 0.24
mm to 0.6 mm), plywood (made of a certain size boards made of several
layers finir), blockboard (pieces of wood into small boxes with a
thickness of 12 mm, 15 mm, or 18 mm), MDF (fine wood dust bonded
with resin chemicals), and particle board (sawdust residual particles,
cuttings and wood chips bonded with resin chemicals).
c Furniture made from plastic
Furniture made from plastic is molded in the factory in large quantities.
Since before, plastic chair only used in food stalls or meeting places for
storage which can be stacked so as not eating places. But with advances in
technology and design now, the plastic furniture can be the right choice
for modern interiors. Its use is often combined with a stainless or
aluminum.
d Furniture made from rattan
Rattan and bamboo raw materials widely available in Indonesia. But the
process of rattan furniture that is more complicated make the price more
expensive. The form was unique and well-liked by the Europeans and
Americans. Rattan and bamboo furniture is strong and durable material
depending on its finishing.
37
CHAPTER III
METHODOLOGY
3.1 Research Method
3.1.1 Location and Time of Research
In arranging this research, the researcher conducted the case study in
UD. Karangjati Furniture which engaged in furniture manufactures and
design interior service. UD. Karangjati Furniture was located in Mustika Sari,
Bekasi, West Java. The research was conducted from October until December
2012. The reason why researcher choose this topic is on the basis that the
company is the family run business that has been initiated since 10 years ago,
where the company currently still in the developmental period that requires
the innovative strategies, so that it can continue to still exist in the furniture
industry and evolved into a company that can be known by many people from
any region outside of Jabodetabek until flapping the wings to do export in
other countries.
3.1.2 Types and Sources of Data
a. Types of Data
The type of data used by researcher in writing this thesis is Qualitative Data,
which obtained from the interview with relevant parties in the form of oral
data with an explanation of discussion. In addition, this research also
supporting by Quantitative Data which get the analysis result from
questionnaire and the data in form of number and formulation without any
using of statistical method. Researcher also using the MS. Excel program in
obtaining the data of formulation testing.
38
b. Sources of Data
To support the completeness of the discussion in writing this thesis,
researcher obtained the data sourced from:
1. Primary Data
It is the data which obtained directly from the company in the form of
field observations and the acquisition of company documents and
interviews with a leader and some of employees in the company.
2. Secondary Data
It is the data which obtained indirectly from the external documents. In this
case the documents derived from the research include reading books,
newspaper, website, journal, etc which relating to the title of the research and
the data collected.
3.1.3 Data Collection Method
To obtain the complete and accurate information in the discussion of
this study, the researcher requires any data or information about the company
itself. Here are some of the methods used by researcher to obtain the data:
1. Field Research
Is the research which done to the company concerned to obtain the required
data in the research process through these following methods:
a Observation
Is the form of research conducted by researcher with the observation of
both directly (face to face) or indirectly (by provide a list of questions to
be answered).
b Interview
Is the form of research by holding a question and answer directly to the
head of company or the number of employees to related to research in
39
provide the information about the internal and external environmental
factors of company in current.
c Documentation
Is the research which done by collecting the documents of company
related to the research, either hardcopy or softcopy.
2. Library Research
Is the research which done by reading a few literature books related, colleting
the documents, archives, and the important records of company, as well as the
data obtained through internet and journals related to the problem solving of
thesis writing and further processed again to the systematic and complete
structure.
3.2 Research Instruments
3.2.1 Description Analysis
Description analysis used to describe the real condition of the
company based on the data derived from observations and interviews to the
company. Some of the data that can be used in the description analysis
including vision, mission, and objective of the company, furniture products
that produced by company, company's sales and marketing activities,
production / operations, research and development, and management
information systems used by the company.
3.2.2 Formulation Process of Alternative Strategy
The strategy formulation techniques can be integrated into the critical
decision – making framework of three stages: the input stage, the matching
stage and the decision stage. The instrument applied in this framework can be
applied to all sizes and types of organizations and can help strategists
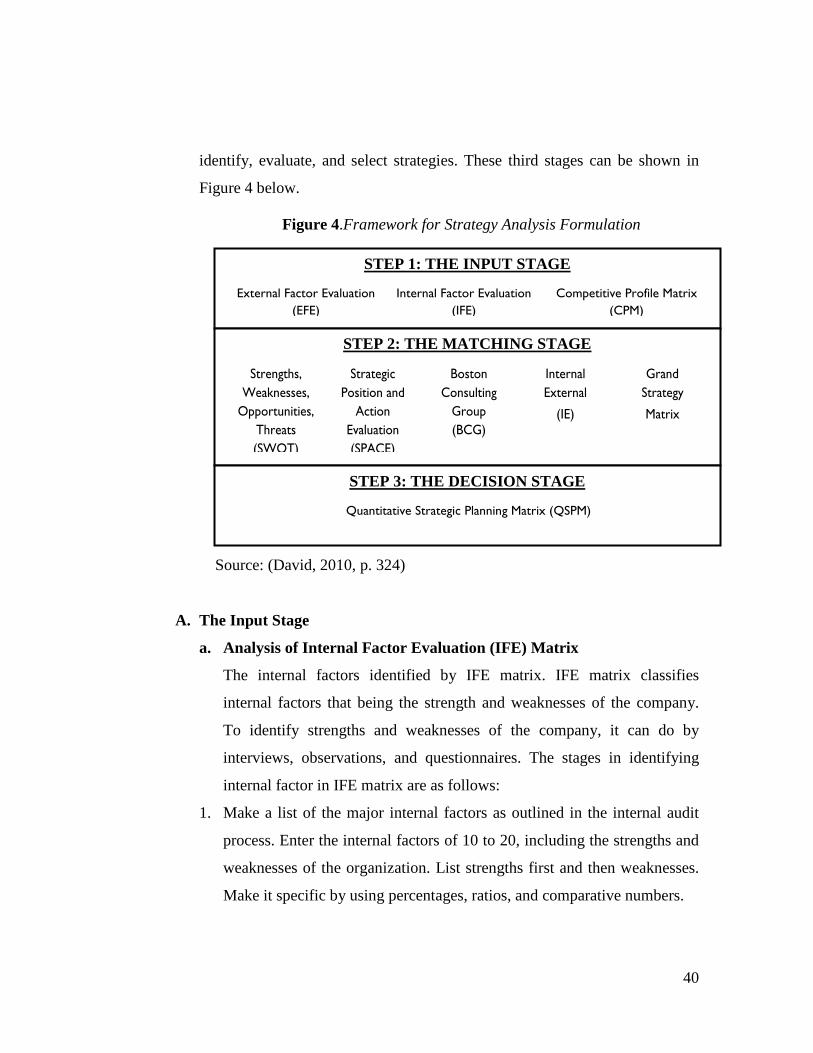
40
identify, evaluate, and select strategies. These third stages can be shown in
Figure 4 below.
Source: (David, 2010, p. 324)
A. The Input Stage
a. Analysis of Internal Factor Evaluation (IFE) Matrix
The internal factors identified by IFE matrix. IFE matrix classifies
internal factors that being the strength and weaknesses of the company.
To identify strengths and weaknesses of the company, it can do by
interviews, observations, and questionnaires. The stages in identifying
internal factor in IFE matrix are as follows:
1. Make a list of the major internal factors as outlined in the internal audit
process. Enter the internal factors of 10 to 20, including the strengths and
weaknesses of the organization. List strengths first and then weaknesses.
Make it specific by using percentages, ratios, and comparative numbers.
STEP 1: THE INPUT STAGE
External Factor Evaluation (EFE)
Internal Factor Evaluation (IFE)
Competitive Profile Matrix (CPM)
STEP 2: THE MATCHING STAGE
Strengths, Weaknesses,
Opportunities, Threats (SWOT)
Strategic Position and
Action Evaluation (SPACE)
Boston Consulting
Group (BCG)
Internal External
(IE)
Grand Strategy
Matrix
STEP 3: THE DECISION STAGE
Quantitative Strategic Planning Matrix (QSPM)
Figure 4.Framework for Strategy Analysis Formulation
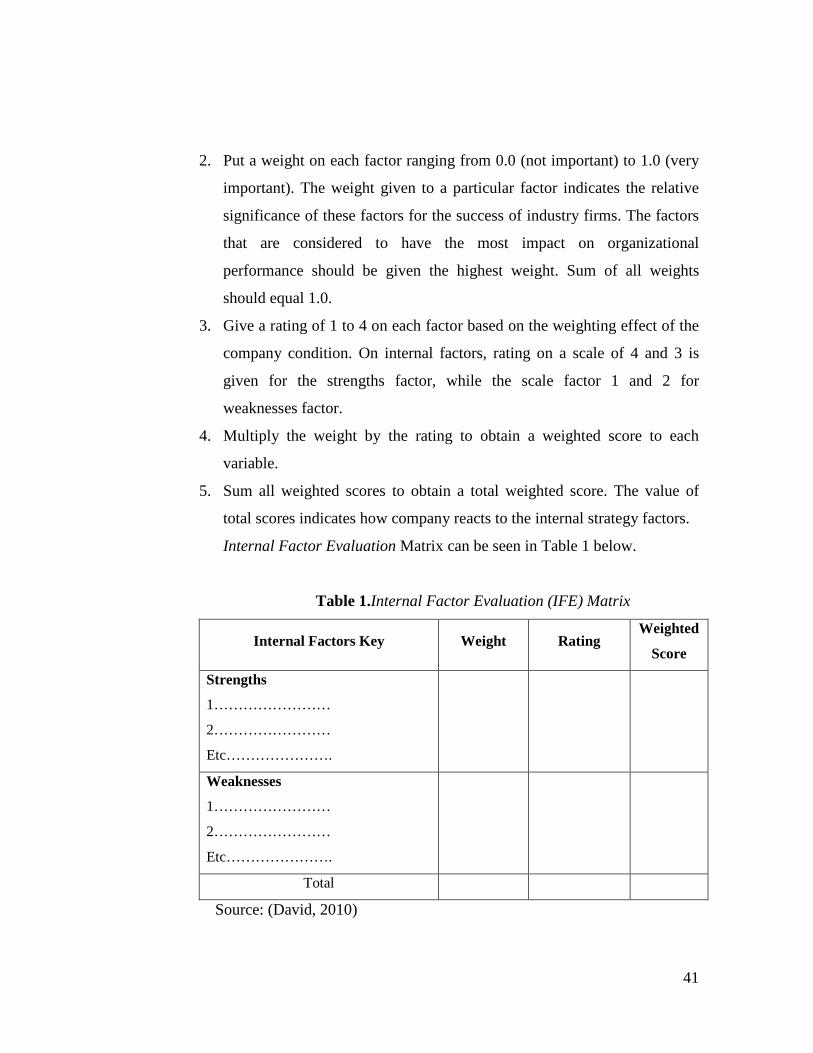
41
2. Put a weight on each factor ranging from 0.0 (not important) to 1.0 (very
important). The weight given to a particular factor indicates the relative
significance of these factors for the success of industry firms. The factors
that are considered to have the most impact on organizational
performance should be given the highest weight. Sum of all weights
should equal 1.0.
3. Give a rating of 1 to 4 on each factor based on the weighting effect of the
company condition. On internal factors, rating on a scale of 4 and 3 is
given for the strengths factor, while the scale factor 1 and 2 for
weaknesses factor.
4. Multiply the weight by the rating to obtain a weighted score to each
variable.
5. Sum all weighted scores to obtain a total weighted score. The value of
total scores indicates how company reacts to the internal strategy factors.
Internal Factor Evaluation Matrix can be seen in Table 1 below.
Table 1.Internal Factor Evaluation (IFE) Matrix
Internal Factors Key Weight Rating Weighted
Score
Strengths
1……………………
2……………………
Etc………………….
Weaknesses
1……………………
2……………………
Etc………………….
Total
Source: (David, 2010)
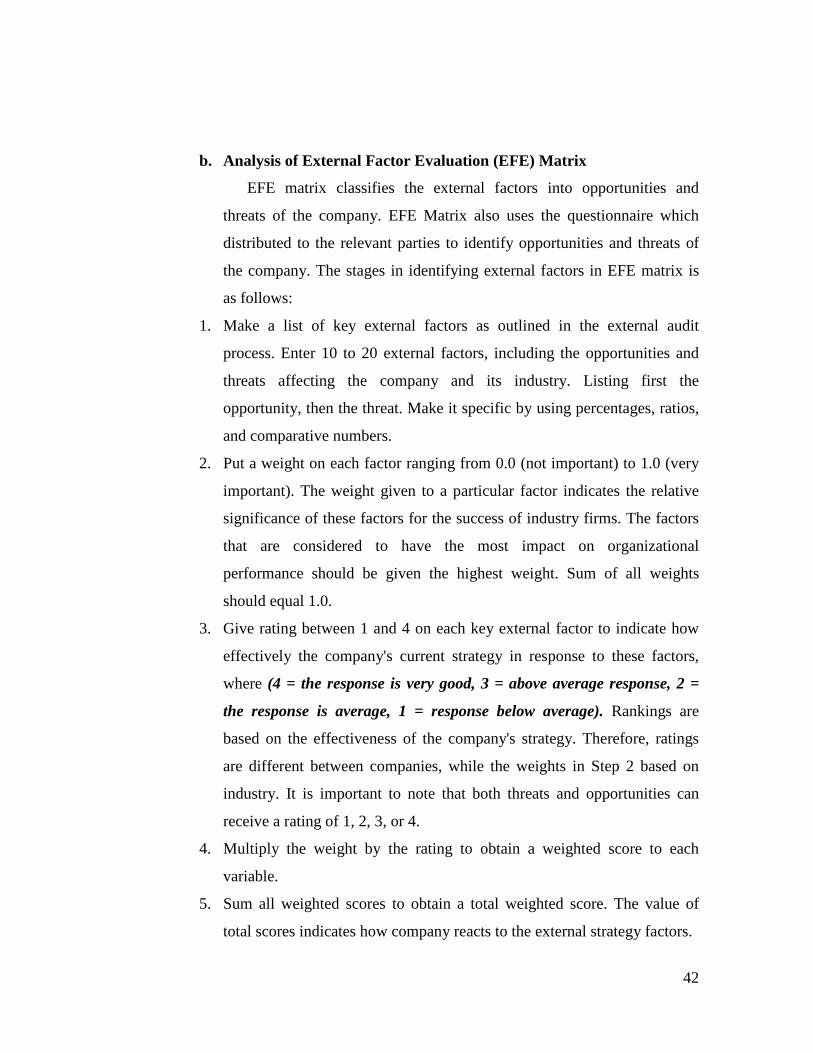
42
b. Analysis of External Factor Evaluation (EFE) Matrix
EFE matrix classifies the external factors into opportunities and
threats of the company. EFE Matrix also uses the questionnaire which
distributed to the relevant parties to identify opportunities and threats of
the company. The stages in identifying external factors in EFE matrix is
as follows:
1. Make a list of key external factors as outlined in the external audit
process. Enter 10 to 20 external factors, including the opportunities and
threats affecting the company and its industry. Listing first the
opportunity, then the threat. Make it specific by using percentages, ratios,
and comparative numbers.
2. Put a weight on each factor ranging from 0.0 (not important) to 1.0 (very
important). The weight given to a particular factor indicates the relative
significance of these factors for the success of industry firms. The factors
that are considered to have the most impact on organizational
performance should be given the highest weight. Sum of all weights
should equal 1.0.
3. Give rating between 1 and 4 on each key external factor to indicate how
effectively the company's current strategy in response to these factors,
where (4 = the response is very good, 3 = above average response, 2 =
the response is average, 1 = response below average). Rankings are
based on the effectiveness of the company's strategy. Therefore, ratings
are different between companies, while the weights in Step 2 based on
industry. It is important to note that both threats and opportunities can
receive a rating of 1, 2, 3, or 4.
4. Multiply the weight by the rating to obtain a weighted score to each
variable.
5. Sum all weighted scores to obtain a total weighted score. The value of
total scores indicates how company reacts to the external strategy factors.
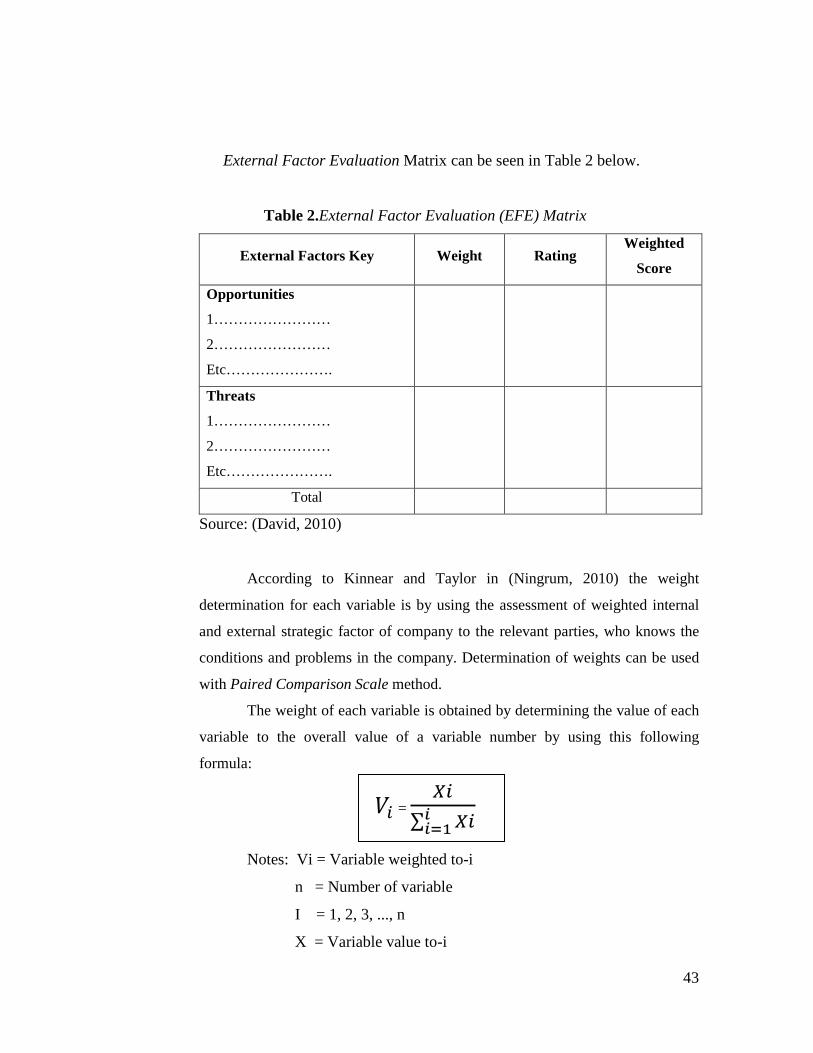
43
External Factor Evaluation Matrix can be seen in Table 2 below.
Table 2.External Factor Evaluation (EFE) Matrix
External Factors Key Weight Rating Weighted
Score
Opportunities
1……………………
2……………………
Etc………………….
Threats
1……………………
2……………………
Etc………………….
Total
Source: (David, 2010)
According to Kinnear and Taylor in (Ningrum, 2010) the weight
determination for each variable is by using the assessment of weighted internal
and external strategic factor of company to the relevant parties, who knows the
conditions and problems in the company. Determination of weights can be used
with Paired Comparison Scale method.
The weight of each variable is obtained by determining the value of each
variable to the overall value of a variable number by using this following
formula:
𝑉𝑖 = 𝑋𝑖
∑ 𝑋𝑖𝑖𝑖=1
Notes: Vi = Variable weighted to-i
n = Number of variable
I = 1, 2, 3, ..., n
X = Variable value to-i
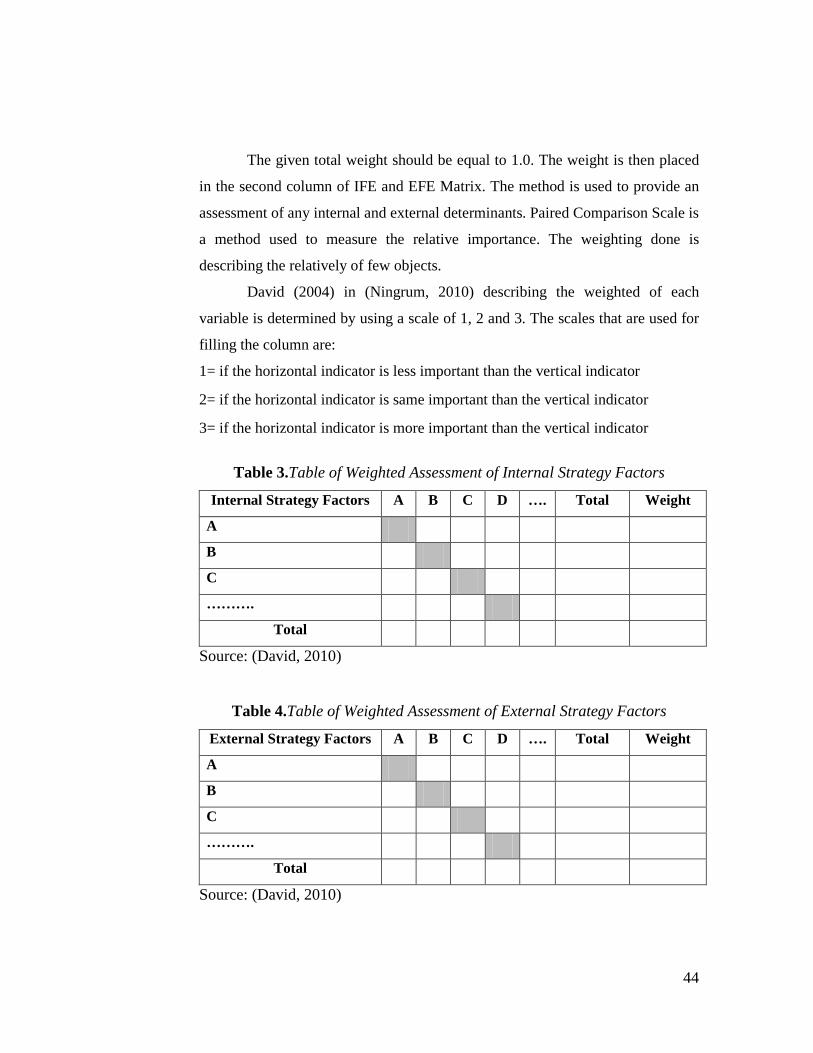
44
The given total weight should be equal to 1.0. The weight is then placed
in the second column of IFE and EFE Matrix. The method is used to provide an
assessment of any internal and external determinants. Paired Comparison Scale is
a method used to measure the relative importance. The weighting done is
describing the relatively of few objects.
David (2004) in (Ningrum, 2010) describing the weighted of each
variable is determined by using a scale of 1, 2 and 3. The scales that are used for
filling the column are:
1= if the horizontal indicator is less important than the vertical indicator
2= if the horizontal indicator is same important than the vertical indicator
3= if the horizontal indicator is more important than the vertical indicator
Table 3.Table of Weighted Assessment of Internal Strategy Factors
Internal Strategy Factors A B C D …. Total Weight
A
B
C
……….
Total
Source: (David, 2010)
Table 4.Table of Weighted Assessment of External Strategy Factors
External Strategy Factors A B C D …. Total Weight
A
B
C
……….
Total
Source: (David, 2010)
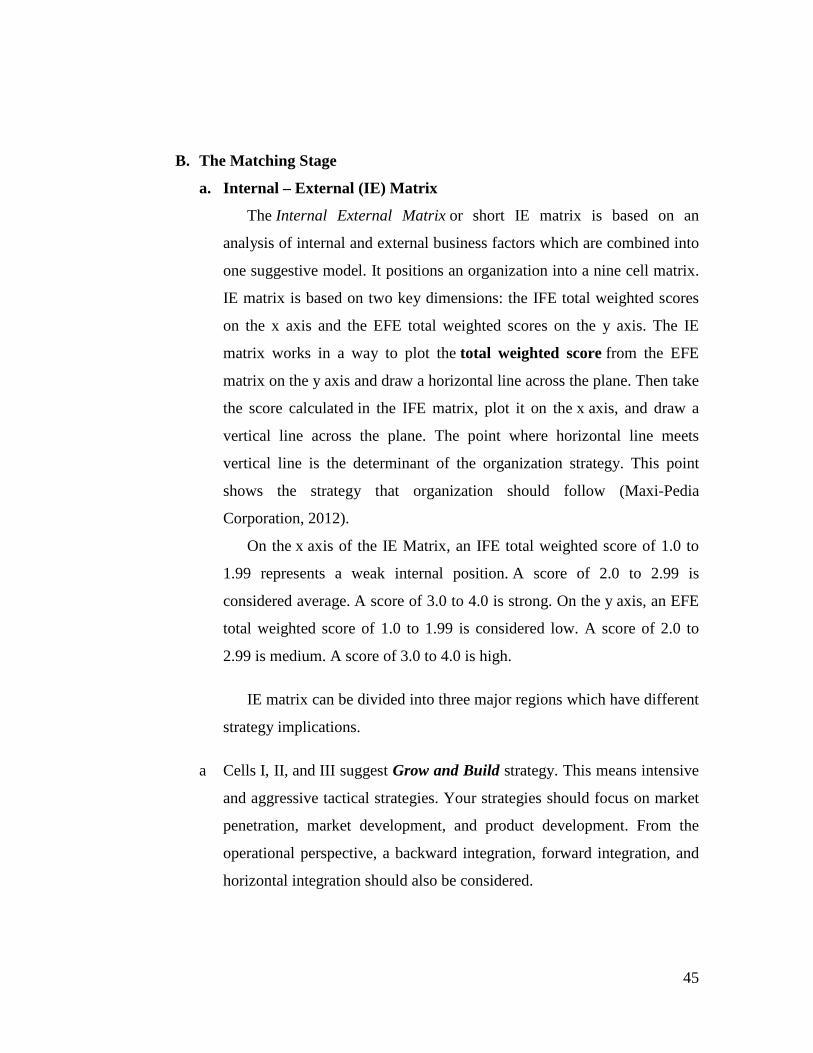
45
B. The Matching Stage
a. Internal – External (IE) Matrix
The Internal External Matrix or short IE matrix is based on an
analysis of internal and external business factors which are combined into
one suggestive model. It positions an organization into a nine cell matrix.
IE matrix is based on two key dimensions: the IFE total weighted scores
on the x axis and the EFE total weighted scores on the y axis. The IE
matrix works in a way to plot the total weighted score from the EFE
matrix on the y axis and draw a horizontal line across the plane. Then take
the score calculated in the IFE matrix, plot it on the x axis, and draw a
vertical line across the plane. The point where horizontal line meets
vertical line is the determinant of the organization strategy. This point
shows the strategy that organization should follow (Maxi-Pedia
Corporation, 2012).
On the x axis of the IE Matrix, an IFE total weighted score of 1.0 to
1.99 represents a weak internal position. A score of 2.0 to 2.99 is
considered average. A score of 3.0 to 4.0 is strong. On the y axis, an EFE
total weighted score of 1.0 to 1.99 is considered low. A score of 2.0 to
2.99 is medium. A score of 3.0 to 4.0 is high.
IE matrix can be divided into three major regions which have different
strategy implications.
a Cells I, II, and III suggest Grow and Build strategy. This means intensive
and aggressive tactical strategies. Your strategies should focus on market
penetration, market development, and product development. From the
operational perspective, a backward integration, forward integration, and
horizontal integration should also be considered.
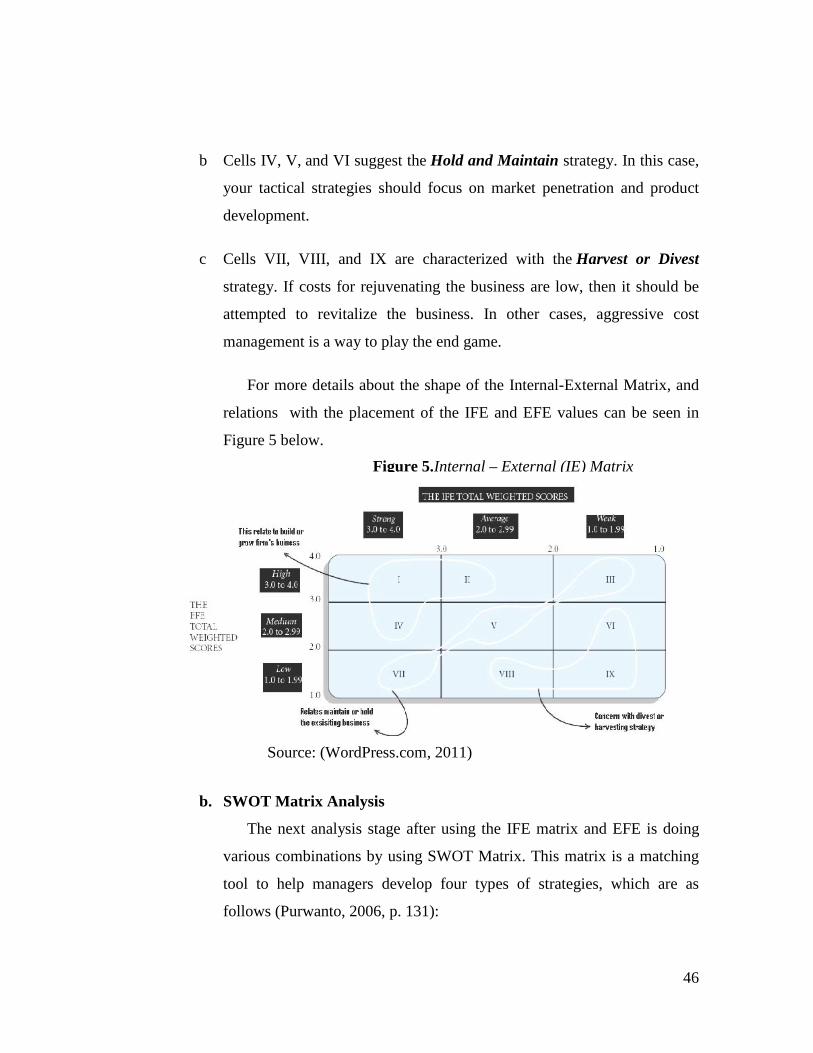
46
b Cells IV, V, and VI suggest the Hold and Maintain strategy. In this case,
your tactical strategies should focus on market penetration and product
development.
c Cells VII, VIII, and IX are characterized with the Harvest or Divest
strategy. If costs for rejuvenating the business are low, then it should be
attempted to revitalize the business. In other cases, aggressive cost
management is a way to play the end game.
For more details about the shape of the Internal-External Matrix, and
relations with the placement of the IFE and EFE values can be seen in
Figure 5 below.
b. SWOT Matrix Analysis
The next analysis stage after using the IFE matrix and EFE is doing
various combinations by using SWOT Matrix. This matrix is a matching
tool to help managers develop four types of strategies, which are as
follows (Purwanto, 2006, p. 131):
Figure 5.Internal – External (IE) Matrix
Source: (WordPress.com, 2011)
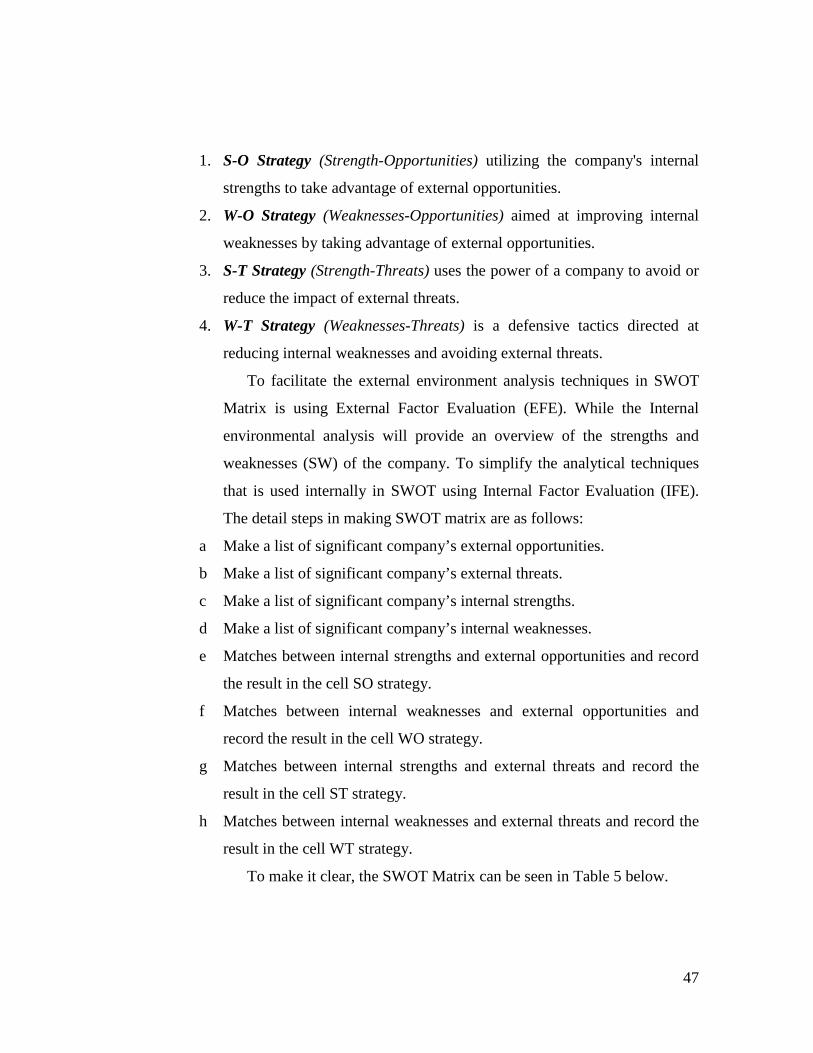
47
1. S-O Strategy (Strength-Opportunities) utilizing the company's internal
strengths to take advantage of external opportunities.
2. W-O Strategy (Weaknesses-Opportunities) aimed at improving internal
weaknesses by taking advantage of external opportunities.
3. S-T Strategy (Strength-Threats) uses the power of a company to avoid or
reduce the impact of external threats.
4. W-T Strategy (Weaknesses-Threats) is a defensive tactics directed at
reducing internal weaknesses and avoiding external threats.
To facilitate the external environment analysis techniques in SWOT
Matrix is using External Factor Evaluation (EFE). While the Internal
environmental analysis will provide an overview of the strengths and
weaknesses (SW) of the company. To simplify the analytical techniques
that is used internally in SWOT using Internal Factor Evaluation (IFE).
The detail steps in making SWOT matrix are as follows:
a Make a list of significant company’s external opportunities.
b Make a list of significant company’s external threats.
c Make a list of significant company’s internal strengths.
d Make a list of significant company’s internal weaknesses.
e Matches between internal strengths and external opportunities and record
the result in the cell SO strategy.
f Matches between internal weaknesses and external opportunities and
record the result in the cell WO strategy.
g Matches between internal strengths and external threats and record the
result in the cell ST strategy.
h Matches between internal weaknesses and external threats and record the
result in the cell WT strategy.
To make it clear, the SWOT Matrix can be seen in Table 5 below.
48
Table 5.SWOT Matrix
Strengths (S) Weaknesses (W)
Opportunities (O)
SO Strategy
Capitalize the existing strengths in the pursuit of opportunities
WO Strategy
Cover up or minimize weaknesses in order to seize opportunities
Threats (T)
ST Strategy
Capitalize the existing strengths in effort to deal with threats
WT Strategy
Cover up or minimize weaknesses in order to deal with threats
Source: (David, 2010)
C. The Decision Stage
The decision stage is done by using a QSPM (Quantitative Strategic
Planning Matrix). QSPM is a technique which objectively indicates the best
strategy for company. There are at least six steps that must be done to make
QSPM, those are:
a Provide a list of internal factors -- strengths and weaknesses. Then
generate a list of the firm's key external factors -- opportunities and
threats. These will be included in the left column of the QSPM. These
factors can take from the EFE matrix and the IFE matrix.
b Give a rating (weighted interest received) of each internal and external
factors listed above according to IFE and EFE matrix.
c Make a list of alternative strategies generated by SWOT matrix. Grouping
the strategy into the unity of the mutually exclusive if possible.
d Set the Attractiveness Score (AS), which is a number that indicates the
relative attractiveness for each chosen strategy. Attractiveness Score (AS)
determined by examining each of internal and external critical success
EXTERNAL FACTORS
INTERNAL FACTORS
49
factors. Attractiveness Value Score (AS) must exist on each strategy to
show the relative attractiveness of one strategy to another with thresholds:
1 = unattractive, 2 = somewhat attractive, 3 = logically attractive, and 4 =
very attractive.
e Calculate the Total Attractiveness Score (TAS) by multiplying the rating
value and Attractiveness Score (AS). Total Attractiveness Score (TAS)
shows the relative attractiveness each alternative strategy.
f Sum of all Total Attractiveness Scores (TAS) on each QSPM column.
The greatest value of QSPM indicates that the alternative was a major
strategic choice and the smallest value indicates that alternative strategies
be the last choice.
The basic form of the Quantitative Strategic Planning Matrix (QSPM)
can be illustrated in Table 6 below.
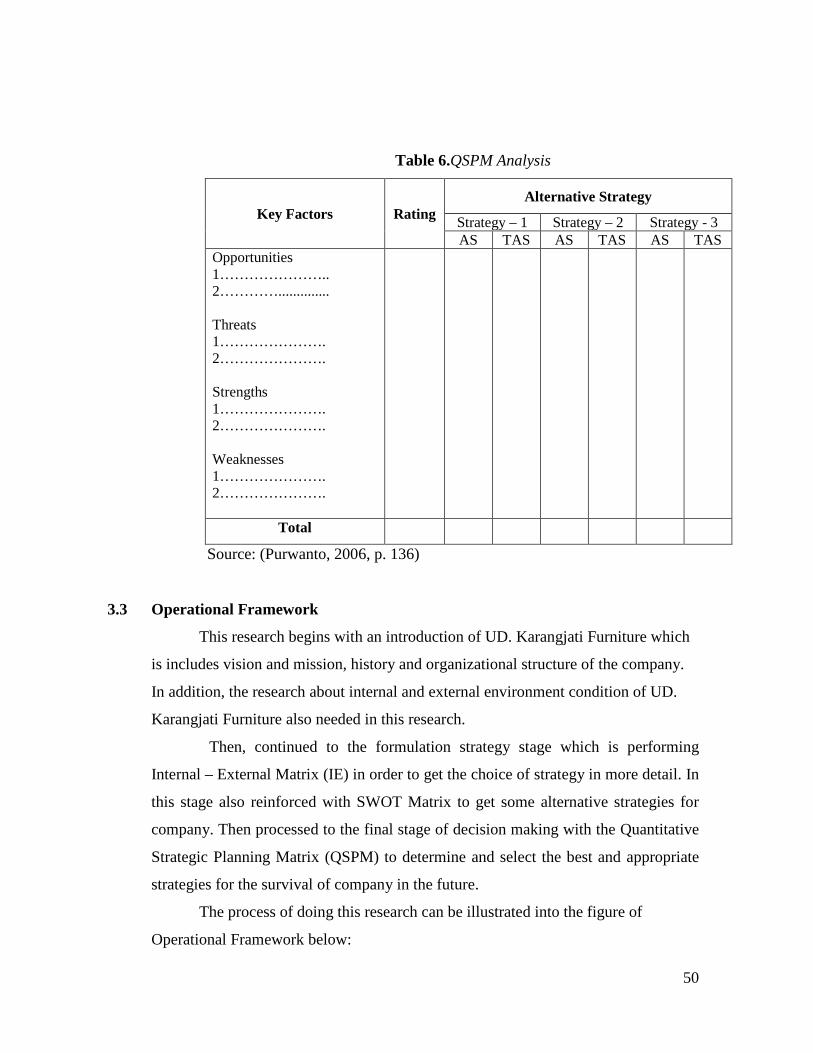
50
Table 6.QSPM Analysis
Key Factors Rating Alternative Strategy
Strategy – 1 Strategy – 2 Strategy - 3 AS TAS AS TAS AS TAS
Opportunities 1………………….. 2………….............. Threats 1…………………. 2…………………. Strengths 1…………………. 2…………………. Weaknesses 1…………………. 2………………….
Total
Source: (Purwanto, 2006, p. 136)
3.3 Operational Framework
This research begins with an introduction of UD. Karangjati Furniture which
is includes vision and mission, history and organizational structure of the company.
In addition, the research about internal and external environment condition of UD.
Karangjati Furniture also needed in this research.
Then, continued to the formulation strategy stage which is performing
Internal – External Matrix (IE) in order to get the choice of strategy in more detail. In
this stage also reinforced with SWOT Matrix to get some alternative strategies for
company. Then processed to the final stage of decision making with the Quantitative
Strategic Planning Matrix (QSPM) to determine and select the best and appropriate
strategies for the survival of company in the future.
The process of doing this research can be illustrated into the figure of
Operational Framework below:
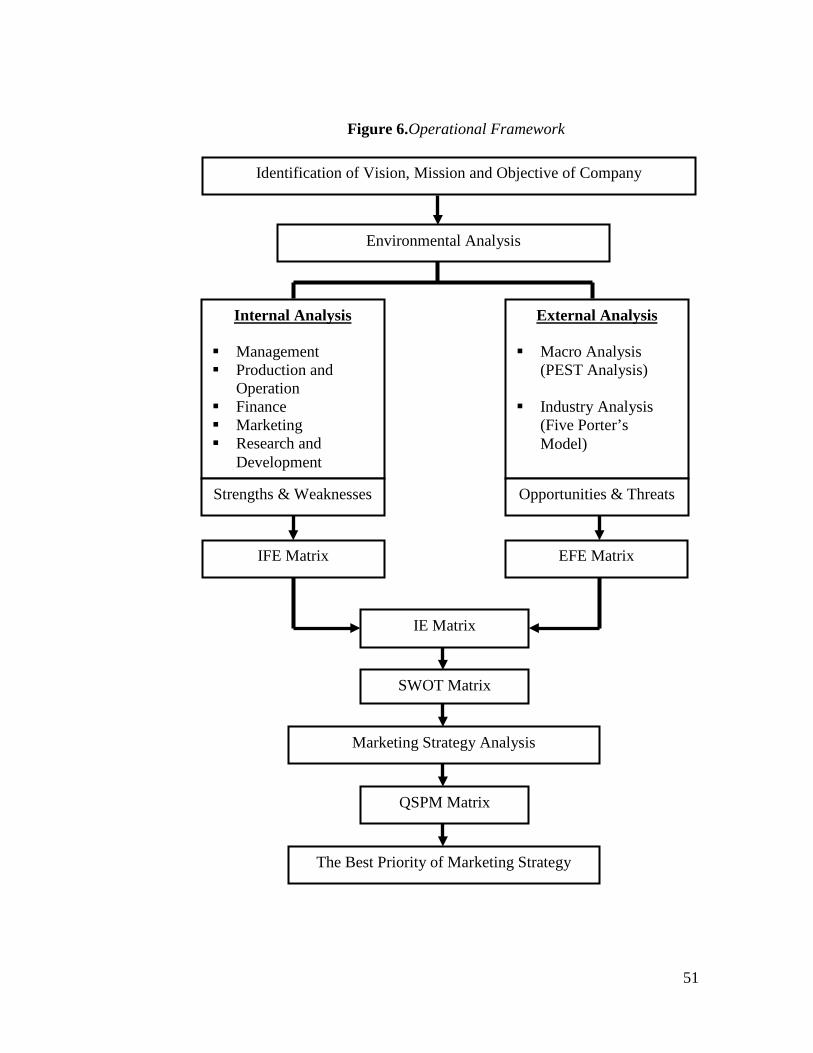
51
Identification of Vision, Mission and Objective of Company
Environmental Analysis
Internal Analysis Management Production and
Operation Finance Marketing Research and
Development
Strengths & Weaknesses
IFE Matrix EFE Matrix
IE Matrix
SWOT Matrix
Marketing Strategy Analysis
QSPM Matrix
The Best Priority of Marketing Strategy
External Analysis Macro Analysis
(PEST Analysis) Industry Analysis
(Five Porter’s Model)
Opportunities & Threats
Figure 6.Operational Framework
52
CHAPTER IV
ANALYSIS OF DATA AND INTERPRETATION OF
RESULTS
4.1 Company Environmental Analysis
Environmental analysis of company is the first stage in identifying the
internal and external environment of company in the strategy management process.
4.1.1 Internal Environmental Analysis
A. Management and Human Resources
UD. Karangjati Furniture has a structured management system but
still need monitoring the performance of employees by owner himself. The
company currently has nine employees in office and administration, 6
employees of assembling parts in Bekasi and 15 employees of assembling
parts in Solo, and 8 employees of finishing part in Bekasi and 6 employees of
finishing part in Solo. In addition, the company has 1 freelance employee in
sales marketing section only when the exhibition was held. Almost all
employees of UD. Karangjati Furniture does not have a high education level
of high school graduate or just below the level. The level of education is not
to be foremost in the recruitment of employees, but it takes only a willingness
to learn and the skills possessed.
While the piece-workers of assembling and finishing, the basic skills
in carpentry and finishing job is needed especially those who have had
previous experience. The wage system imposed on assembling and finishing
employee is the piece rate system, where the system of wage adjusted on the
furniture they manufacture or finishing per item. Then the production wage
was cut off by the use of raw materials that have been provided and
purchased by company from several suppliers. For the wages of the
53
employees in office and administration section consists of basic salary, meal
and transport allowances. The employee may also have willing to choose the
wage as per day or per month as needed.
In order to establish a family atmosphere and fluency in the
production and operation, the fluent communication and mutual - assistance
needed in company among all employees.
B. Marketing
a Segmentation, Targeting and Positioning
Segmentation
In order the marketing activities undertaken by UD. Karangjati Furniture
can be more focused and its resources can be used more effectively and
efficiently to provide satisfaction to the consumer, then the company just
segmenting the market into general public on the middle and upper
classes. Therefore, the company must adjust its product between price,
quality, and design which are offered to consumers. And through the
market distribution to the general public, the company had several times
received an order to fill some of consumer’s businesses, such as
restaurants, hotels, offices, salons and spas, and so forth.
Targeting
In determining the target market, UD. Furniture Karangjati just focus on
making products for household use with teak wood raw material and
plywood as the compliment material. In addition, the company also only
focuses on products with a minimalist design for all household furniture,
such as cabinets, bedroom sets, kitchen sets, sofas, dining tables, and
much more.
Positioning
The company has had many customers since the inception of the
company. The company will continue to building trust of consumers for
54
quality products. The perception or responses from consumers regarding
the position of UD. Karangjati Furniture is the only furniture company
with minimalist design with classic look that uses good quality materials,
which is Teak wood. Furthermore, when viewed from the side of design,
almost all of its products have a sturdy design with thick of legs and top
of wood is about 6-10cm. It is the strength and superiority over UD.
Karangjati Furniture products compared to its competitors.
b Product’s Marketing Mix
Product
The products offered by UD. Karangjati Furniture is a furniture with a
minimalist design that uses the main raw material of teakwood and
plywood material as support material other timber. Some types of
furniture which are marketed for household or office, such as bedroom
set, wardrobe, sofa, dining table, office desk, kitchen sets, and so forth.
Until the year 2012, the company has several innovative design models
of its furniture products nearly as much 70 kinds of. These table below
shows some of the types and names of products that have been
manufactured by UD. Karangjati Furniture for current:
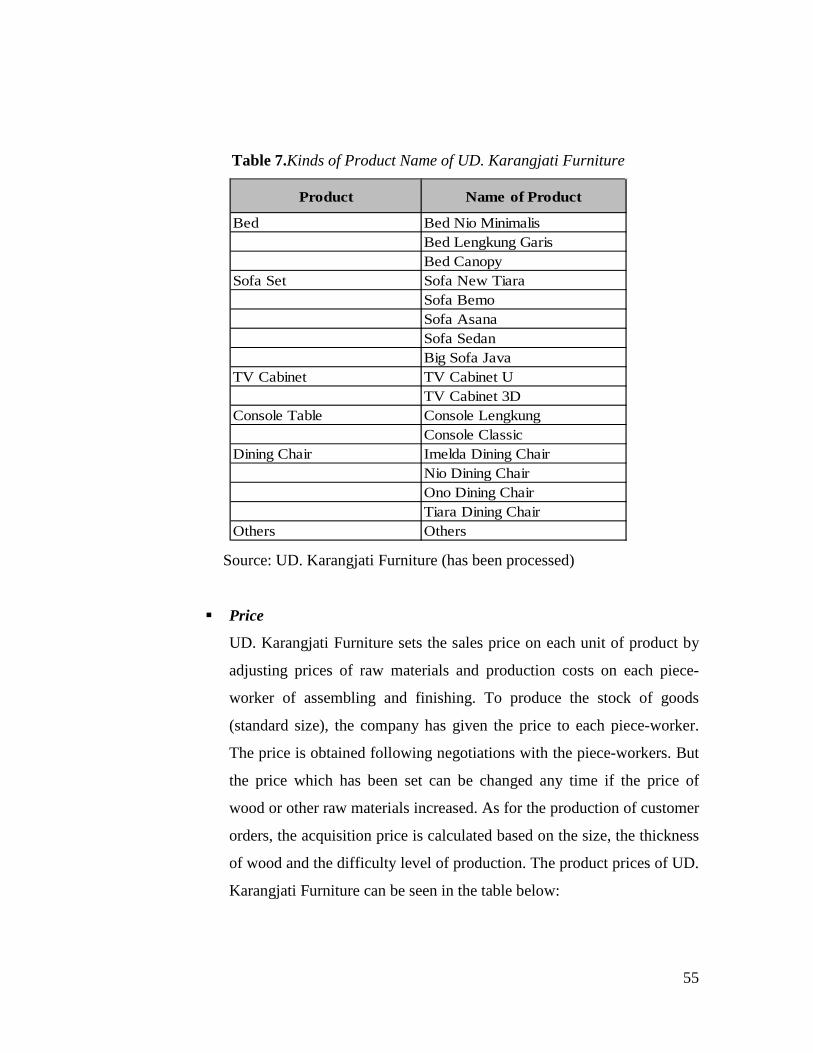
55
Table 7.Kinds of Product Name of UD. Karangjati Furniture
Source: UD. Karangjati Furniture (has been processed)
Price
UD. Karangjati Furniture sets the sales price on each unit of product by
adjusting prices of raw materials and production costs on each piece-
worker of assembling and finishing. To produce the stock of goods
(standard size), the company has given the price to each piece-worker.
The price is obtained following negotiations with the piece-workers. But
the price which has been set can be changed any time if the price of
wood or other raw materials increased. As for the production of customer
orders, the acquisition price is calculated based on the size, the thickness
of wood and the difficulty level of production. The product prices of UD.
Karangjati Furniture can be seen in the table below:
Product Name of Product
Bed Bed Nio MinimalisBed Lengkung GarisBed Canopy
Sofa Set Sofa New TiaraSofa BemoSofa AsanaSofa SedanBig Sofa Java
TV Cabinet TV Cabinet UTV Cabinet 3D
Console Table Console LengkungConsole Classic
Dining Chair Imelda Dining ChairNio Dining ChairOno Dining ChairTiara Dining Chair
Others Others
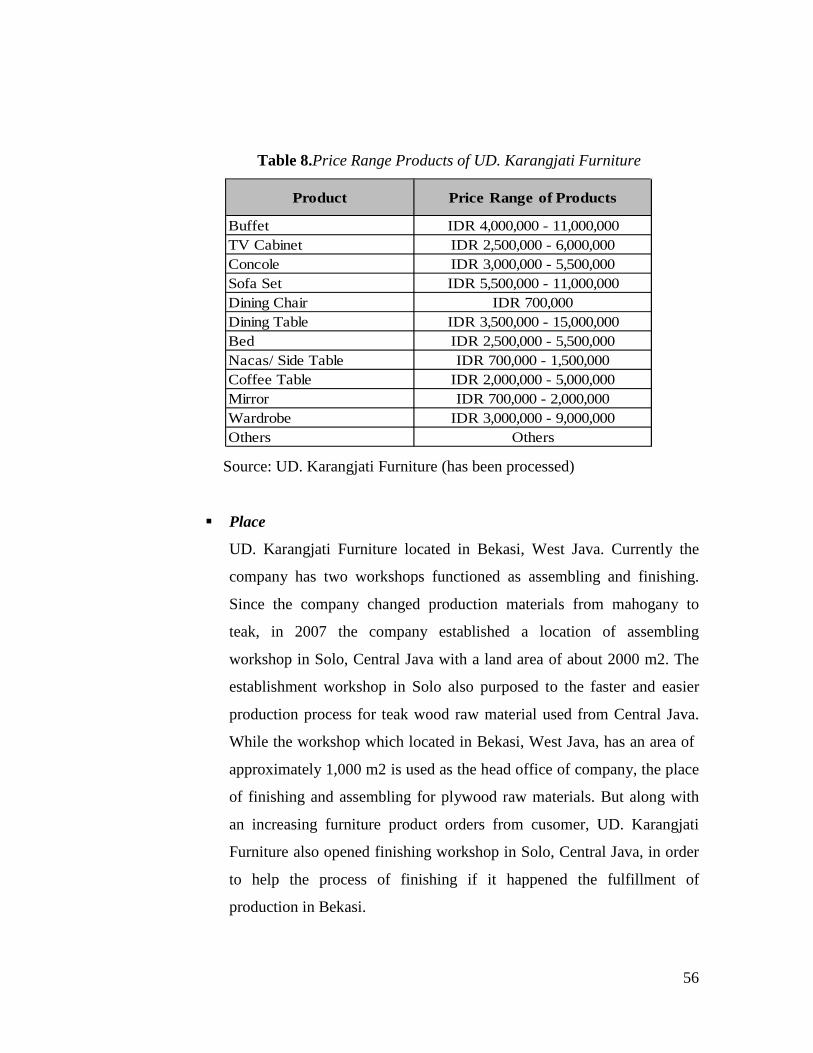
56
Table 8.Price Range Products of UD. Karangjati Furniture
Source: UD. Karangjati Furniture (has been processed)
Place
UD. Karangjati Furniture located in Bekasi, West Java. Currently the
company has two workshops functioned as assembling and finishing.
Since the company changed production materials from mahogany to
teak, in 2007 the company established a location of assembling
workshop in Solo, Central Java with a land area of about 2000 m2. The
establishment workshop in Solo also purposed to the faster and easier
production process for teak wood raw material used from Central Java.
While the workshop which located in Bekasi, West Java, has an area of
approximately 1,000 m2 is used as the head office of company, the place
of finishing and assembling for plywood raw materials. But along with
an increasing furniture product orders from cusomer, UD. Karangjati
Furniture also opened finishing workshop in Solo, Central Java, in order
to help the process of finishing if it happened the fulfillment of
production in Bekasi.
Product Price Range of Products
Buffet IDR 4,000,000 - 11,000,000TV Cabinet IDR 2,500,000 - 6,000,000Concole IDR 3,000,000 - 5,500,000Sofa Set IDR 5,500,000 - 11,000,000Dining Chair IDR 700,000Dining Table IDR 3,500,000 - 15,000,000Bed IDR 2,500,000 - 5,500,000Nacas/ Side Table IDR 700,000 - 1,500,000Coffee Table IDR 2,000,000 - 5,000,000Mirror IDR 700,000 - 2,000,000Wardrobe IDR 3,000,000 - 9,000,000Others Others
57
Promotion
The promotional activities undertaken by UD. Karangjati Furniture is by
following a few exhibitions in any Malls or exhibition center which has a
great opportunity to gain the high sales. Currently, the company has
decided to attend the exhibition at Jakarta Convention Center, Cibubur
Junction, and Metropolitan Mall just after earlier marketing surveys
elsewhere in the Jabodetabek area. So far, the company has a lack of
capable marketing staff, so that the product promotion activities have not
been as intense among the public as some of the large-scale furniture
company that has been well known. In addition, the use of alternative
media such as advertising campaigns in newspapers or magazines untried
companies to promote their products. In order to continue to provide
satisfaction to customers, UD. Karangjati Furniture strives to build
relationships with customers and continue to develop the service and
quality of products offered.
C. Production and Operation
Ordering and Receiving the Raw Materials
UD. Karangjati Furniture fulfilled the raw material needs through a
number of suppliers who have subscribed to the company since the first. The
main raw materials such as teak wood characterizes UD. Furniture Karangjati
who must have the best quality and standards. Teak wood raw material prices
gained this time around Rp 4.000.000/m3. There are also several auxiliary
materials are used, such as plywood, foam, handles, drawer rails, nails, wood
glue, melamine paint, thinner, and much more. The main raw material
ordering in Bekasi done according to the need and availability in warehouse.
The company has two trusted suppliers for the purchase of teak. While
ordering the auxiliary raw materials obtained through several stores suppliers
subscription of company which majority is in Klender, East Jakarta.
58
Auxiliary raw material purchases are made directly to the supplier’s
store. Previously, the company must listing the items to be purchased in order
to get the detail budget can be estimated in advance. And for the main raw
material of teak, the suppliers come to the workshop and then do the
recording and counting of wood by the company's own employees in order
the fraudulent purchases can be avoided.
Storage and Using of Raw Materials
The storage of goods and raw materials of UD. Karangjati Furniture
should be adjusted by the type, form, and function of each. For teak, the
storage was in outdoor and dried in the sun to keep up the quality of dry
wood. As for the auxiliary raw materials such as foam, melamine paints and
thinners are stored into different warehouses. For small auxiliary raw material
quantities are stored into racks and cabinets that have been provided in the
office on a regular basis.
Any use of raw materials required by assembling or finishing piece-
worker should be fully recorded into a form of material request made by the
employee in office. So also with the piece-worker who was in Solo, auxiliary
materials for the purposes of production processes also need to be recorded
and then sent by truck while there are concurrent delivery of goods to Bekasi.
Assembling Production Process of Furniture
The assembling process begins with the order of wood from supplier,
then the model and design of furniture established according to customer
order or by the default size for inventory of stock in the warehouse. The
overview of assembling production process of UD. Karangjati Furniture can
be seen in Appendix 1.
59
Finishing Production Process of Furniture
Once the assembling processes of furniture was completed, and then
do the painting process which consists of several stages as follows:
1. The process of sanding the wood so that the wood surface becomes
smooth.
2. Using wood filler or commonly known as the process of closing the pores
of the wood due to decay or defects in processing time.
3. Coloring process using the spray method in accordance with the color
chosen by customer or on demand. There are several color options
available, which is unfinished, natural, coffee brown, salak, etc. For
unfinished option, the product did not have the coloring process because
the resulting color is the original color of teak wood itself.
4. The process of final stage spraying or commonly referred to as melamine
top coat, which is the process of spraying by giving the brightness levels
after had been around from coloring process. There are 3 levels of
brightness, which is doff (not shiny), semi-gloss and gloss (shiny).
After finishing process above, then do the final phase or stage for
completing furniture with additional accessories. Providing additional
accessories should be appropriate with customer orders without any flaws.
For example, the wardrobe furniture must be equipped with a rail doors,
drawer rails, hangers, handles, and locks, or on demand. In addition, there are
several other additional accessories such as a mirror or glass for bookcase;
rack plates and spoon rack for kitchen set; seat and cushion for sofa set. Once
the goods have been complete, and then do the checking or Quality Control
(QC) a day before delivery scheduled to assured quality of goods that will
delivered is already perfect and in accordance with order so that consumers
do not complain and feel satisfied with the products ordered from UD.
Karangjati Furniture. During this time, the process of Quality Control has not
60
been performing well, so there are consumers who complain on the physical
state of defective items or not perfect in the eyes of consumers.
Then, the last stage is the process of packing by using the cardboard
bound with raffia on each side of the product to avoid the scretched at the
time of delivery to the consumer.
D. Financial
UD. Karangjati Furniture has a reasonably good financial condition.
The initial capital used to start a business is from the private equity of owner.
With these initial capital, the owner only able to buy some machine tools, 1
pickup truck, and hire fewer workers. In order to support the financial
conditions needed to develop the business, the company has loans on CIMB
Niaga Bank.
The running financial system for current is still very simple. The
bookkeeping which done by cashier completely still manually. The financial
statements used by company is only the report of petty cash about the
purchase or expenditures activity report made by company along with the
cash receipts and sales activities or income statements made in cash customer.
Petty Cash report will be checked every day by the owner to control the rest
of petty cash and give money deposit to the owner.
The level of income per month is not definitely due to the company's
exhibition activities that followed by company does not routinely do every
month. Beside the sales from exhibition, company sometimes receives orders
from workshop, but not as much as the sales on the exhibition. Level of
income from the exhibition also tend to fluctuative and unstable, this is
caused by an increase number of furniture manufactures at Jakarta
Convention Center with a diverse selection of material and the time of
exhibitions are sometimes not in accordance with the event where visitors are
not much come to the exhibition.
61
E. Research and Development
During run its business, UD. Furniture Karangjati yet so do some
research and product development in particular. For having the highly
competitive compared to its competitors, the company strives to always keep
up with the changing trends of furniture in Indonesian market. Some of the
standard product designs were the result of referrals from furniture
magazines, internet, and even the design of the customers who sometimes
have their own designs as they wish. Therefore, the design of products of UD.
Karangjati Furniture can continue to grow and have a variety options.
In addition, UD. Furniture Karangjati could do some surveys for
marketing location in several Malls which are lively of visitors and have the
strategic location. However, after investigating of several factors included the
amount of turnover and prices offered for stand, only the Jakarta Convention
Center, and the Metropolitan Cibubur Junction Mall are the suitable
marketing site for the company right now.
Currently the company is effort to reach a broader marketing area but
still within the Greater Jakarta area. In addition to promotion through the
exhibition, the company also wants to open a branch showroom. Surely the
company should consider more mature which locations will be selected based
on the level of the middle and upper class consumers. However, the
management has not made the observation and study of the business
environment in the locations that could potentially hire back some employees
as well as the problem of shortage of experienced human resources for the
company to support the development of UD. Karangjati Furniture.
F. Information Management System
Advances in technology today pose the most significant changes to
human life. With technology, all human needs can be met quickly and easily.
62
The technological changes are also really supporting the progress of some
industries, including furniture industry.
The company currently uses email as the communication tool and
exchanging the pictures quickly and easily to customers and also sends the
order details which attached on Job Order to all piece-workers of assembling
in Solo. In addition, the use of variety application systems software also
supports the effective and efficient working system of the company, such as
Ms. Excel program for recording and calculating data faster and AutoCAD
which is used to design furniture in the form of a blueprint that will be
produced for each piece-worker to be better understood in detail.
UD. Karangjati Furniture actually also has an own website that can be
accessed through the site of www.karangjatifurniture.com. However, the
website was never updated again after so long. But, the company considers
that a media campaign through website is not very efficient due to the design
products of UD. Karangjati Furniture at high risk can be replicated by other
competitors easily.
No promotional tools that companies use when making promotions in
the exhibition, such as brochures, flyers, and so forth. But the company only
gave the business cards and provides a catalog containing photos of the
product so that consumers can easily determine the choice of furniture to be
purchased.
4.1.2 External Environmental Analysis
A. Macro Environment
Macro environment is the external environment factor in outside of
company’s operations. Macro environment may be affected by political
factors and government policies, social, economic, and technology.
63
1. Political and Government Policies Factors
Political factors and government policies in a country will affect the
company's business activities. The stable and condusive political
condition is very necessary in a country because it will support the
business activities and will grow in a healthy and normal. The role of
government is also highly desirable to be able to provide facilities for the
furniture industry to compete with the import furniture industry which
spreads in the Indonesian market. There are some government roles
needed in the furniture industry today, such as the provision of credit and
training to small and medium enterprises and cooperatives that still need
development in order to improve the absorption of skilled labor and
increase competitiveness against imported furniture products.
But there are still many local furniture industry moving independently
without the aid and the role of government. For the decades in running its
business, UD. Furniture Karangjati never involve the government's role in
supporting and giving assistance to the business. It can be seen from the
way of acquisition the teak wood as the main production materials for
furniture manufacturing which originated from individuals belong to the
citizens who were around the area of Sragen, Central Java. Therefore, the
company does not need to ask permission from the local government to
obtain the source of wood. The acquisition price of teak wood is ranges
between 5-10 million per m3 depending on the quality of wood itself. The
company is very rarely to buying wood from Perhutani (Indonesian
Forestry) because the price offered is relatively more expensive.
2. Social, Cultural, Demography and Environmental Factors
a Social, Cultural and Demography Factors
Social cultural factors actually affect the furniture industry in
Indonesia, especially those made from teak wood. Teak wood is including
64
to the hardwood species are of high value and very popular in the world.
Java Teak known since several centuries ago because its quality, wood
strength, beautiful brown color, unique fiber, and resistance to all weather
is unmatched by any other types of wood. Besides not easily broken in a
collision with a metal object, teak wood also does not require much
maintenance.
Because of these characteristics, teak is widely used as raw material
for the manufacture of doors, window frames, interior and exterior
furniture, flooring, and carving. Even in some countries, the teak decking
is used for boats or yachts.
For demographic factors, the rate of population growth, especially in
Jakarta and surrounding areas will affect the growing need for housing
and encourage increased demand for furniture. Of course this will be an
opportunity for UD. Karangjati Furniture.
The property growth in 2013 would be predicted to increase 20% from
the year 2012 were dominated by the Greater Jakarta and Java Island.
Residential sector will still dominate both housing and apartment sector,
which increasingly flourished recently as lifestyle changes in the upper
middle class. Indonesia's property market growth as a whole is clearly
visible on the factors increasing construction activity in the property
sector simultaneously in different regions, the high number of transactions
in the market strata and rental property, and increasing rents and selling
prices in the short amount of time.
b Natural and Environmental Factors
Natural and environmental factors could affect the company mainly in
the production process and for obtaining the maximum revenue.
Availability of teak wood which will be decreased can be a threat of
company to continue its business. In addition, it takes a long time about a
65
minimum of 30 years for teak wood used for furniture production process.
The older of wood used must be better because the wood will be stronger
and prices may soar. The company obtained teak wood from Sragen,
Central Java. In this case, the governement of Sragen must also be
concerned about the environment to conserve forests in order not bare to
meet the needs of the furniture industry and wood raw material. There are
many ways that can be done, such as the development of citizen’s forests,
make use of waste wood as a raw material, conduciving wood from
outside area, waste processing of furniture with the help of machinery or
equipment, as well as forest and land rehabilitation.
For environmental factors such as weather or the environmental
condition can also affect the company's production systems. Bad weather
such as the continued rain can disrupt the process of wood drying and
finishing work takes longer than usual. In addition the environmental
conditions such as floods, earthquakes, riots, demonstrations, and so forth
can make a customer reluctant to come visit the exhibition which is being
followed by companies. This of course can affect the amount of sales that
can not hit the target or not even able to cover the cost of rent for
exhibition stand.
3. Economic Factors
Overall, economic factors can affect a country's business industry. If
the economic conditions of a country well then it will increase the
purchasing power of the country which will ultimately affect the
macroeconomic conditions of the country. The macroeconomic variables
based on domestic side in the economic system are the price level,
employment, total income, and interest rates.
Therefore, if a country's macroeconomic conditions are booming it
will increase the purchasing power in the country. If the price level
66
increases it will reduce the purchasing power of furniture items including
UD. Karangjati Furniture.
Based on the report of Indonesia's Economic Development Quarterly
December 2012 issue (Setkab RI, 2013), the World Bank Indonesia's
projected the economic growth at 6.1 percent for 2012, a slight increase in
2013 to 6.3 percent. This projection assumes domestic consumption and
investment growth remained strong, with the improvement in the growth
of Indonesia's major trading partners is also slight gradual recovery in
exports pushed the global economic crisis that is still ongoing in
developed countries, particularly in the Euro zone.
It also supported by the development of controlled inflation at a fairly
low at 4.3 percent which resulted in the desire to buy an item of furniture
which is included into durable goods, will increase as well.
4. Technology Factors
The rapidly evolving of technology factor has transformed almost
every aspect of human life. Discovery of tools that make it easier to
produce the raw materials into finished goods is played in the furniture
industry. For example, wood cutting tools owned by company can make
the job easier in terms of the speed of production process and work
productivity and better quality of furniture products.
Another influential technology factor is internet. With internet, UD.
Furniture Karangjati can market its products and communicate via email
with customers as well as all piece-workers of assembling in Solo.
To make the furniture designs can also be further facilitated by
technology advances. That is by using software or design programs such
as AutoCAD (Computer Aided Design), which can simplify designing the
blueprint of furniture that will be produced.
67
B. Industry Environment
Industry environment describes the company's position in the
competition in the same industry they operate. There are some aspects of
competition within the industry is as described in the Five-Power Model
Porter's five forces through a combination, namely: 1) threat of new entrants,
2) rivalry among firms in the industry, 3) threat of substitute products, 4)
bargaining power buyers, and 5) bargaining power of suppliers.
1. Threat of new entrants
New entrants in the furniture industry can easily enter and become an
obstacle for existing furniture companies, including UD. Karangjati
Furniture.
These following may be analyzed some threats from new entrants to
the industry of furniture:
a The new entrants of furniture industry generally still have a small
scale so that the goods produced per unit will be larger. This is caused
because there is insufficient certainty of experience in determine the
price based on the cost of production and adjust the marketing targets.
That way, the factors of economic scale for new entrants are not so
giving threat for existing companies and also for UD. Karangjati
Furniture.
b The capital for furniture business is quite large, especially for the cost
of purchasing teak wood imported directly from Central Java, and the
cost of buying a workshop area for making furniture.
c The buyer switching costs is low, because buyer is free to move and
buy other furniture products. In average, buyers tend to prefer the
furniture with a lower price, especially for buyers who have a new
family and more concerned to brand and design rather than the quality
of goods itself.
68
d The switching cost from one supplier to another supplier. Currently,
there are many suppliers of raw material for making furniture that
offers competitive prices. But this is not being as a threat for UD.
Karangjati Furniture which have entrusted to a few suppliers who
have subscribed in the past, so that expenditure on purchase of raw
materials can be identified and specified before go buying to each
supplier.
e A new entrant has easy to access the distribution. Now, there is lot of
furniture business whih has a very wide distribution channels.
Actually, there are many competitors of KJF, especially
2. Rivalry among existing firms
The competition level in industry may be affected by several factors,
including the number of competitors, product characteristics, the large
fixed costs, capacity, exit barriers, and so forth.
The number of furniture business that more and more, especially in
Jakarta area, resulting in a higher level of competition. The quality of teak
wood and minimalist design products offered by UD. Karangjati Furniture
can be an advantage that is quite difficult to be imitated by another
competitor and was rarely found in the furniture business at this time.
This condition can be a threat to UD. Furniture Karangjati as more
consumers consider price when buying furniture with substandard quality.
Competitors faced by UD. Karangjati Furniture in the medium-scale
enterprises is actually so many, moreover since the company followed the
exhibition in Jakarta Convention Center (JCC). But some of them, still
using other main raw materials outside of teak wood. And they offered the
selling price in the compatible price even more expensive than the teak
wood furniture itself.
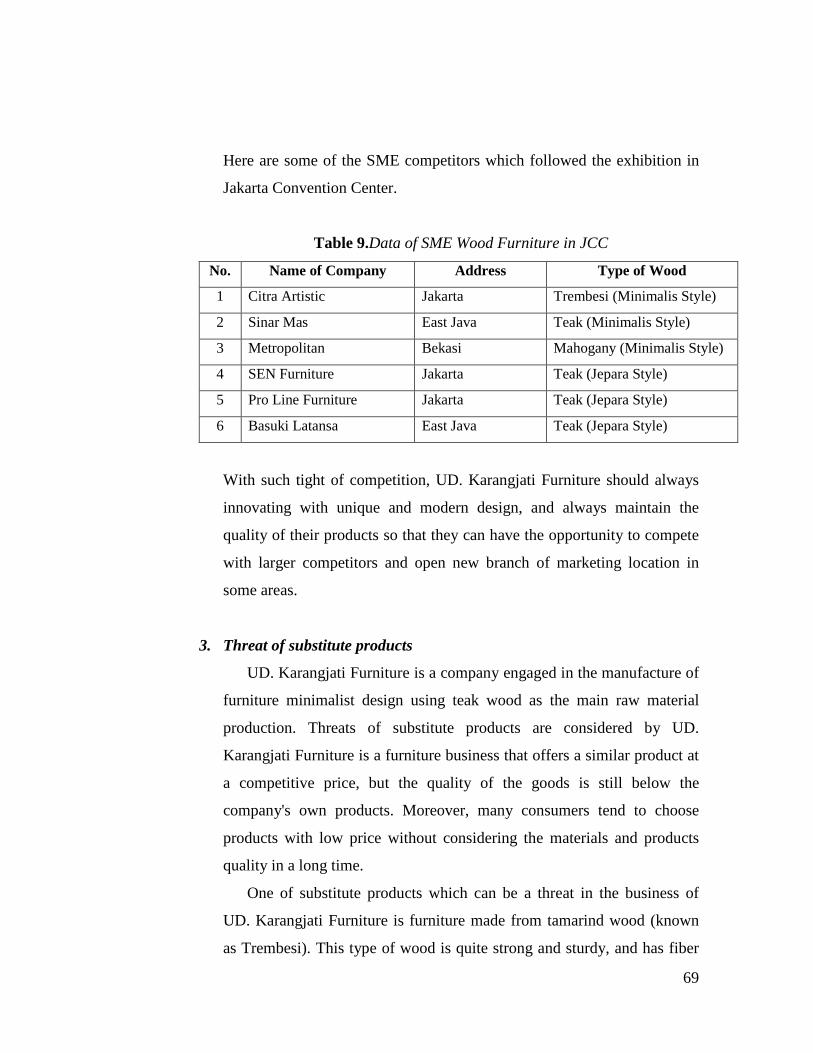
69
Here are some of the SME competitors which followed the exhibition in
Jakarta Convention Center.
Table 9.Data of SME Wood Furniture in JCC
No. Name of Company Address Type of Wood
1 Citra Artistic Jakarta Trembesi (Minimalis Style)
2 Sinar Mas East Java Teak (Minimalis Style)
3 Metropolitan Bekasi Mahogany (Minimalis Style)
4 SEN Furniture Jakarta Teak (Jepara Style)
5 Pro Line Furniture Jakarta Teak (Jepara Style)
6 Basuki Latansa East Java Teak (Jepara Style)
With such tight of competition, UD. Karangjati Furniture should always
innovating with unique and modern design, and always maintain the
quality of their products so that they can have the opportunity to compete
with larger competitors and open new branch of marketing location in
some areas.
3. Threat of substitute products
UD. Karangjati Furniture is a company engaged in the manufacture of
furniture minimalist design using teak wood as the main raw material
production. Threats of substitute products are considered by UD.
Karangjati Furniture is a furniture business that offers a similar product at
a competitive price, but the quality of the goods is still below the
company's own products. Moreover, many consumers tend to choose
products with low price without considering the materials and products
quality in a long time.
One of substitute products which can be a threat in the business of
UD. Karangjati Furniture is furniture made from tamarind wood (known
as Trembesi). This type of wood is quite strong and sturdy, and has fiber
70
which better than teak wood. But it is undeniable that the number one
quality wood is teak wood that has been known since before as it’s strong
and anti termite, so it can remain durable for several years.
4. Bargaining power of buyers
Bargaining power of buyers is not enough affect the furniture industry
due to the growing number of furniture industry by using a variety of raw
materials so that the buyer can freely make their choice easily. In
addition, buyers also have the ability to reduce the selling price with the
demand of high quality goods and better services. Therefore, UD.
Karangjati Furniture continues to transform and advance the company by
providing the best service for quality goods, to innovate products which
are suitable for market demands and establish to having good
relationships with their loyal customers.
5. Bargaining power of suppliers
In obtain the supplies of raw materials in manufacturing process, UD.
Karangjati Furniture has established a large number of suppliers who have
subscribed to the company since a long time ago. Suppliers can use the
bargaining power of the industry participants with a way to raise or lower
the quality of the products or services purchased. The strengths of each
supplier depend on a number of characteristics of its market situation and
the relative importance of sales or purchases in the industry compared to
the overall business.
Currently UD. Karangjati Furniture has several suppliers for each raw
material. In general, the suppliers are located in the surrounding area of
Klender, East Jakarta, and so UD. Furniture Karangjati not face high
switching costs when changing supplier in case one is not able to meet the
needs of suppliers of raw materials at UD. Karangjati Furniture or if the
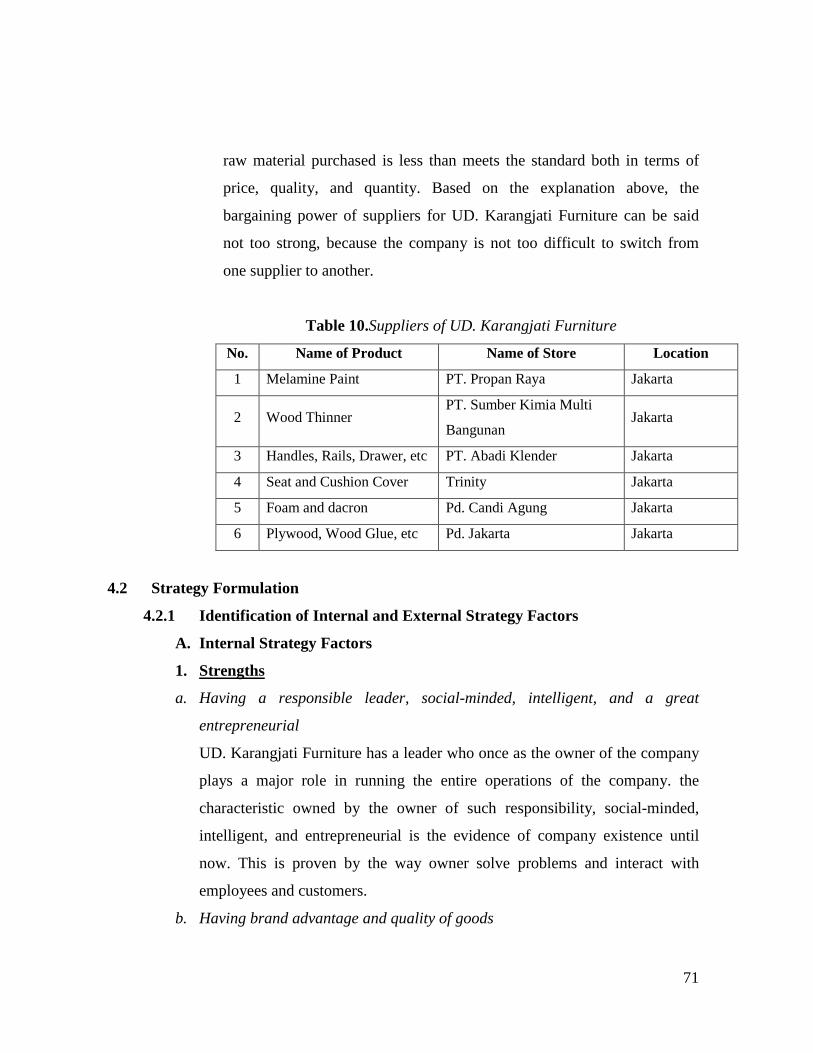
71
raw material purchased is less than meets the standard both in terms of
price, quality, and quantity. Based on the explanation above, the
bargaining power of suppliers for UD. Karangjati Furniture can be said
not too strong, because the company is not too difficult to switch from
one supplier to another.
Table 10.Suppliers of UD. Karangjati Furniture
No. Name of Product Name of Store Location
1 Melamine Paint PT. Propan Raya Jakarta
2 Wood Thinner PT. Sumber Kimia Multi
Bangunan Jakarta
3 Handles, Rails, Drawer, etc PT. Abadi Klender Jakarta
4 Seat and Cushion Cover Trinity Jakarta
5 Foam and dacron Pd. Candi Agung Jakarta
6 Plywood, Wood Glue, etc Pd. Jakarta Jakarta
4.2 Strategy Formulation
4.2.1 Identification of Internal and External Strategy Factors
A. Internal Strategy Factors
1. Strengths
a. Having a responsible leader, social-minded, intelligent, and a great
entrepreneurial
UD. Karangjati Furniture has a leader who once as the owner of the company
plays a major role in running the entire operations of the company. the
characteristic owned by the owner of such responsibility, social-minded,
intelligent, and entrepreneurial is the evidence of company existence until
now. This is proven by the way owner solve problems and interact with
employees and customers.
b. Having brand advantage and quality of goods
72
The brand excellence of UD. Karangjati Furniture is the only minimalist
furniture industry with teak wood as the main raw material production in
Jabodetabek area. Quality of goods offered is also being a superior to its
competitors because almost its products have the sturdy design but still in
minimalist with a thickness of top and legs intact about 6-10cm wood
assessed will have a very high economic value.
c. Implementation of Standard Operating Procedures (SOP), which has begun
to clear and focused
With the clear and focused SOP of company, it is expected to be a reference
for employees and piece-workers in the work so that it can be a company's
quality standards.
d. Have been using computer application system in the process of work
producing
Some employees are skilled in the use of computer applications for entering
the data, furniture design, and send emails to customers and contractors in
Solo so that the production process can work more effectively and efficiently.
e. The family – oriented and mutual assistance in working atmosphere
Each member of UD. Karangjati Furniture has been conditioned to mutual
assistance to one another. There is no distance between owner and their
employees. The work environment was family-oriented, so that the
employees are free to issue their opinions and recommendations and to find a
solution with the problem at hand. Good communications between members
of the company can be the key of business fluency within the company.
2. Weaknesses
a. Lack of human resource education level
The dominance of education that employees have is only primary school and
high school. Only the owner and manager who has bachelor degree (S1).
Basic formal education is not the main requirement for its employees, but the
73
most important is having the desire and passion to work, diligent, and
disciplined. Lack of this education level will results on little choked up of
labor productivity and some of them are not able to work in the office and
administration, but only works in the field to pick up and deliver the products
to customer. The company currently very needs the workers in administration
and marketing division. Because of that, the minimal education level that the
workers must have is Diploma degree (D3), where they are already quite
skilled in counting by using generally accepted accounting principles, to
communicate with customers in terms of bargaining, to operate the computer
and other electronic equipments, and provide advice to the owner in order to
continue to advance their business.
b. The financial system is still simple
The financial system used UD. Karangjati Furniture is simple, due to
accounting for income and expenses have been made using the daily cash
book and calculator tool. Until now the company has not been preparing the
financial statements as a whole per period by using a computer system.
c. Income levels tend to fluctuate and unstable
The higher level of competition affects the ability to acquire the sales. As a
result, income levels are sometimes not as expected and tend to be unstable.
In addition to the exhibition time also does not necessarily or routinely per
month.
d. Lack of consistency in the distribution of the Job Description of each
employees
The labor division accordance with an existing Job Description which is not
functioning enough can create the consistency worker become not going well
also. This sometimes resulted in over extend of the product process, because
the workers who responsible to handling are doing another jobs that are not
his responsibility. It is also related to the lack of employees that the company
needs so that the carried out work tends to overlap.
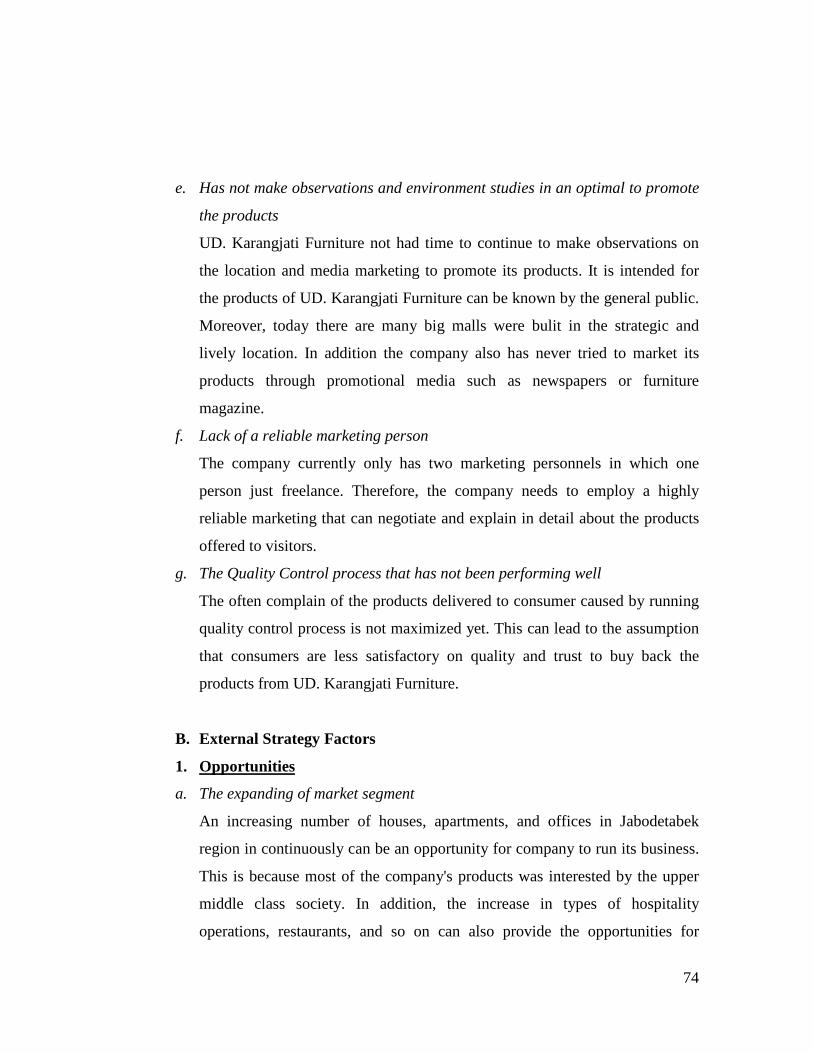
74
e. Has not make observations and environment studies in an optimal to promote
the products
UD. Karangjati Furniture not had time to continue to make observations on
the location and media marketing to promote its products. It is intended for
the products of UD. Karangjati Furniture can be known by the general public.
Moreover, today there are many big malls were bulit in the strategic and
lively location. In addition the company also has never tried to market its
products through promotional media such as newspapers or furniture
magazine.
f. Lack of a reliable marketing person
The company currently only has two marketing personnels in which one
person just freelance. Therefore, the company needs to employ a highly
reliable marketing that can negotiate and explain in detail about the products
offered to visitors.
g. The Quality Control process that has not been performing well
The often complain of the products delivered to consumer caused by running
quality control process is not maximized yet. This can lead to the assumption
that consumers are less satisfactory on quality and trust to buy back the
products from UD. Karangjati Furniture.
B. External Strategy Factors
1. Opportunities
a. The expanding of market segment
An increasing number of houses, apartments, and offices in Jabodetabek
region in continuously can be an opportunity for company to run its business.
This is because most of the company's products was interested by the upper
middle class society. In addition, the increase in types of hospitality
operations, restaurants, and so on can also provide the opportunities for
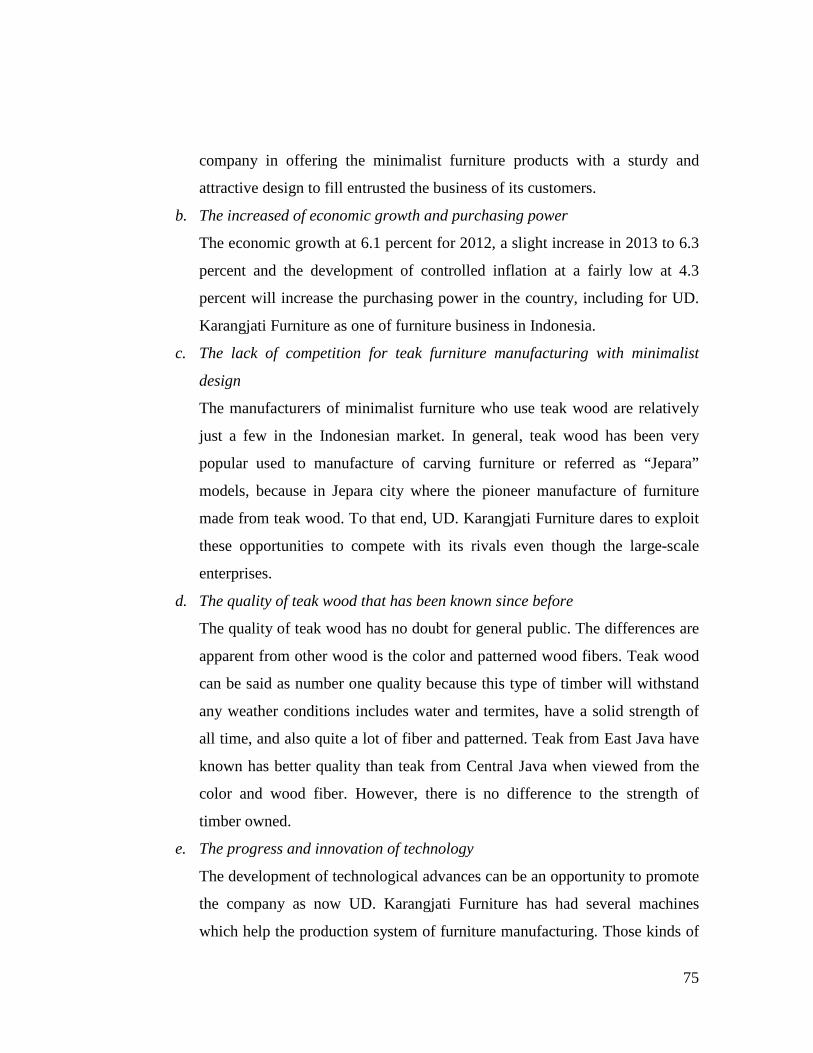
75
company in offering the minimalist furniture products with a sturdy and
attractive design to fill entrusted the business of its customers.
b. The increased of economic growth and purchasing power
The economic growth at 6.1 percent for 2012, a slight increase in 2013 to 6.3
percent and the development of controlled inflation at a fairly low at 4.3
percent will increase the purchasing power in the country, including for UD.
Karangjati Furniture as one of furniture business in Indonesia.
c. The lack of competition for teak furniture manufacturing with minimalist
design
The manufacturers of minimalist furniture who use teak wood are relatively
just a few in the Indonesian market. In general, teak wood has been very
popular used to manufacture of carving furniture or referred as “Jepara”
models, because in Jepara city where the pioneer manufacture of furniture
made from teak wood. To that end, UD. Karangjati Furniture dares to exploit
these opportunities to compete with its rivals even though the large-scale
enterprises.
d. The quality of teak wood that has been known since before
The quality of teak wood has no doubt for general public. The differences are
apparent from other wood is the color and patterned wood fibers. Teak wood
can be said as number one quality because this type of timber will withstand
any weather conditions includes water and termites, have a solid strength of
all time, and also quite a lot of fiber and patterned. Teak from East Java have
known has better quality than teak from Central Java when viewed from the
color and wood fiber. However, there is no difference to the strength of
timber owned.
e. The progress and innovation of technology
The development of technological advances can be an opportunity to promote
the company as now UD. Karangjati Furniture has had several machines
which help the production system of furniture manufacturing. Those kinds of
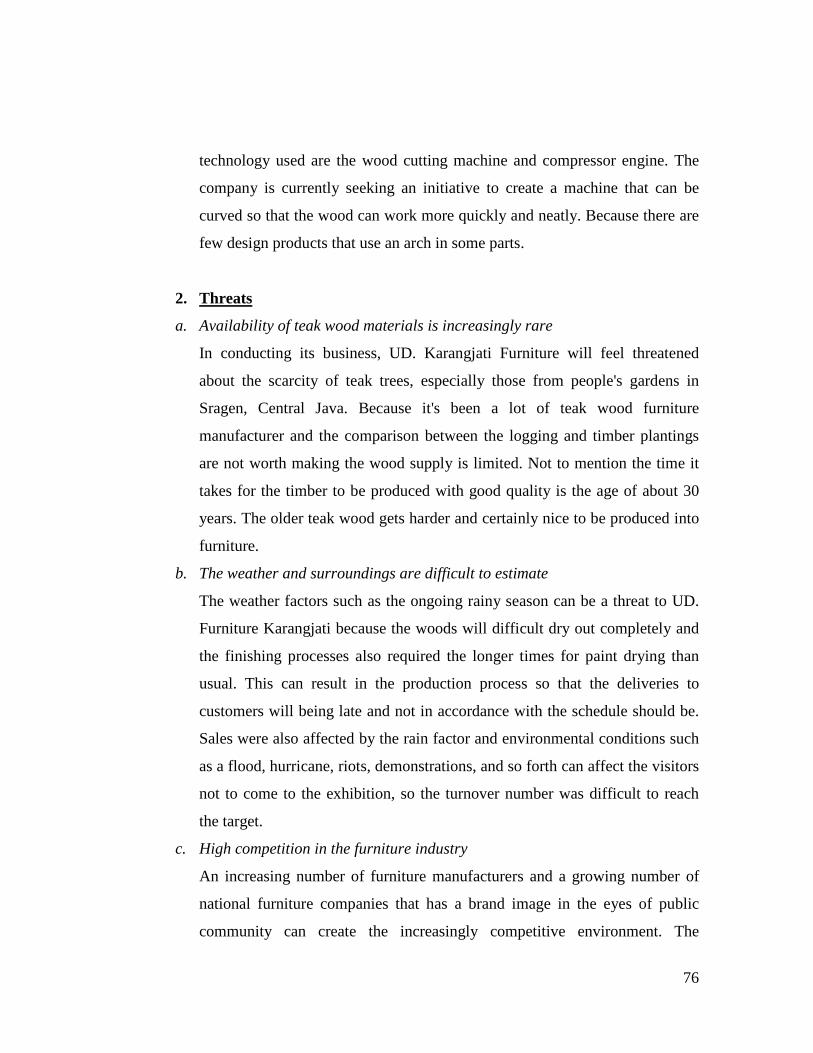
76
technology used are the wood cutting machine and compressor engine. The
company is currently seeking an initiative to create a machine that can be
curved so that the wood can work more quickly and neatly. Because there are
few design products that use an arch in some parts.
2. Threats
a. Availability of teak wood materials is increasingly rare
In conducting its business, UD. Karangjati Furniture will feel threatened
about the scarcity of teak trees, especially those from people's gardens in
Sragen, Central Java. Because it's been a lot of teak wood furniture
manufacturer and the comparison between the logging and timber plantings
are not worth making the wood supply is limited. Not to mention the time it
takes for the timber to be produced with good quality is the age of about 30
years. The older teak wood gets harder and certainly nice to be produced into
furniture.
b. The weather and surroundings are difficult to estimate
The weather factors such as the ongoing rainy season can be a threat to UD.
Furniture Karangjati because the woods will difficult dry out completely and
the finishing processes also required the longer times for paint drying than
usual. This can result in the production process so that the deliveries to
customers will being late and not in accordance with the schedule should be.
Sales were also affected by the rain factor and environmental conditions such
as a flood, hurricane, riots, demonstrations, and so forth can affect the visitors
not to come to the exhibition, so the turnover number was difficult to reach
the target.
c. High competition in the furniture industry
An increasing number of furniture manufacturers and a growing number of
national furniture companies that has a brand image in the eyes of public
community can create the increasingly competitive environment. The
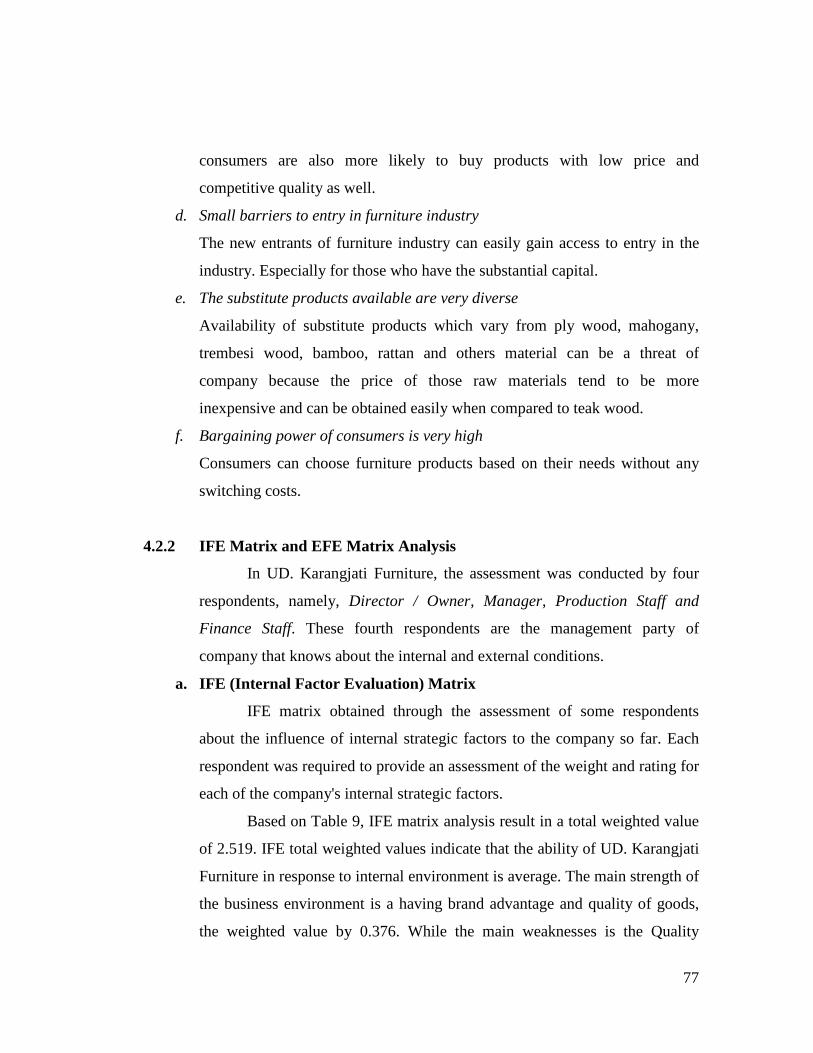
77
consumers are also more likely to buy products with low price and
competitive quality as well.
d. Small barriers to entry in furniture industry
The new entrants of furniture industry can easily gain access to entry in the
industry. Especially for those who have the substantial capital.
e. The substitute products available are very diverse
Availability of substitute products which vary from ply wood, mahogany,
trembesi wood, bamboo, rattan and others material can be a threat of
company because the price of those raw materials tend to be more
inexpensive and can be obtained easily when compared to teak wood.
f. Bargaining power of consumers is very high
Consumers can choose furniture products based on their needs without any
switching costs.
4.2.2 IFE Matrix and EFE Matrix Analysis
In UD. Karangjati Furniture, the assessment was conducted by four
respondents, namely, Director / Owner, Manager, Production Staff and
Finance Staff. These fourth respondents are the management party of
company that knows about the internal and external conditions.
a. IFE (Internal Factor Evaluation) Matrix
IFE matrix obtained through the assessment of some respondents
about the influence of internal strategic factors to the company so far. Each
respondent was required to provide an assessment of the weight and rating for
each of the company's internal strategic factors.
Based on Table 9, IFE matrix analysis result in a total weighted value
of 2.519. IFE total weighted values indicate that the ability of UD. Karangjati
Furniture in response to internal environment is average. The main strength of
the business environment is a having brand advantage and quality of goods,
the weighted value by 0.376. While the main weaknesses is the Quality
78
Control process that has not been performing well, with a weighted value of
0.149.
Table 11.IFE Matrix of UD. Karangjati Furniture
b. EFE (External Factor Evaluation) Matrix
EFE matrix obtained through the assessment of some respondents
about the influence of external strategic factors to the company so far. Each
respondent was required to provide an assessment of the weight and rating for
each of the company's external strategic factors.
79
Based on Table 10, EFE matrix analysis conducted a total weighted
value of 2.474. A major opportunity in the furniture business environment is
demonstrated by a weighted factor of the biggest opportunities, which is the
quality of teak wood that has been known since before with a weighted value
of 0.314. While the main threat bargaining power of consumers is very high
with a value of 0.220.
Table 12.EFE Matrix of UD. Karangjati Furniture
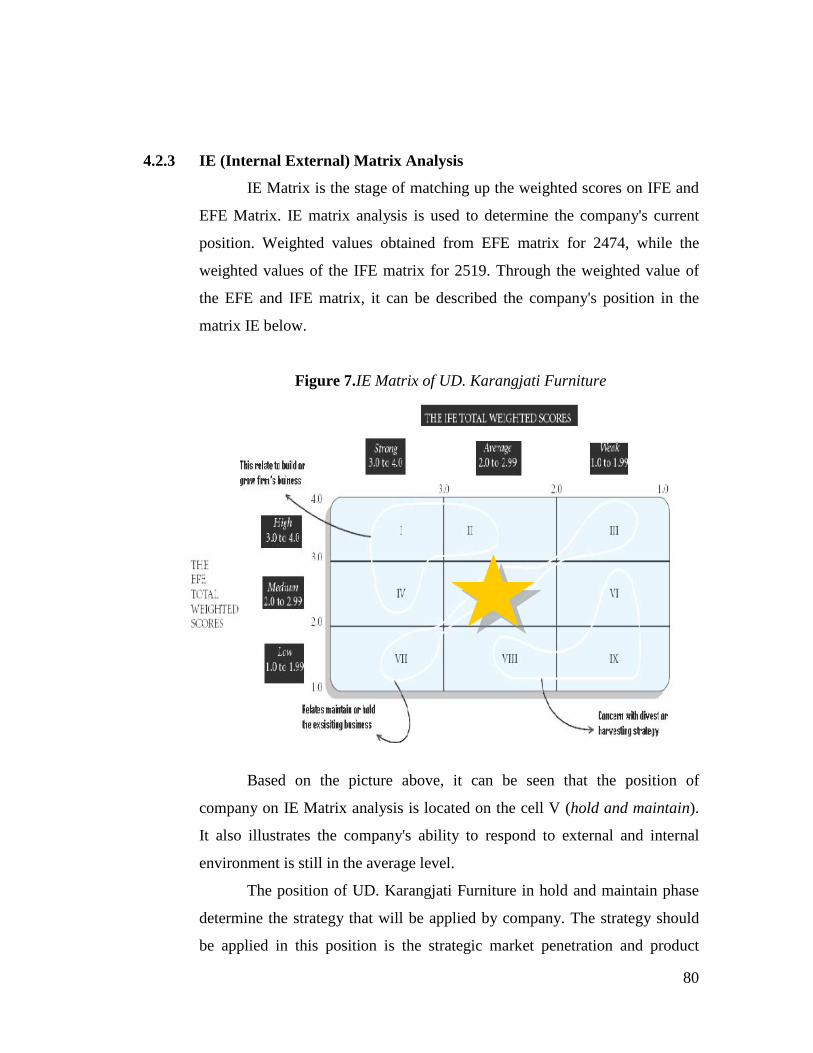
80
4.2.3 IE (Internal External) Matrix Analysis
IE Matrix is the stage of matching up the weighted scores on IFE and
EFE Matrix. IE matrix analysis is used to determine the company's current
position. Weighted values obtained from EFE matrix for 2474, while the
weighted values of the IFE matrix for 2519. Through the weighted value of
the EFE and IFE matrix, it can be described the company's position in the
matrix IE below.
Figure 7.IE Matrix of UD. Karangjati Furniture
Based on the picture above, it can be seen that the position of
company on IE Matrix analysis is located on the cell V (hold and maintain).
It also illustrates the company's ability to respond to external and internal
environment is still in the average level.
The position of UD. Karangjati Furniture in hold and maintain phase
determine the strategy that will be applied by company. The strategy should
be applied in this position is the strategic market penetration and product
81
development. Penetration strategy is an effort to increase market share and for
a product or service through broader marketing efforts. While product
development strategy is an effort to increase sales by improving or modifying
the current products or services.
The market penetration and product development strategy is belongs
to the intensive strategy, means that it will takes intensive and continuous
efforts to being superior in a competitive corporate environment. The strategy
that acquired through IE matrix is general. Therefore it still need SWOT
matrix analysis to obtain the more specific and real strategy.
4.2.4 SWOT Matrix Analysis
SWOT matrix analysis is based on the identification of internal and
external environmental factors from UD. Karangjati Furniture. SWOT matrix
analysis performed will resulted in eight kinds of strategies that are grouped
into four cells, namely S-O Strategies, W-O Strategies, S-T Strategies, and
W-T Strategies as seen in the picture below.

82
Figure 8.SWOT Analysis of UD. Karangjati Furniture
83
S-O Strategy
1. SO-1 Strategy, which is adding more appropriate and strategic marketing
location. In order the product of UD. Karangjati Furniture can be more widely
known by the public, the company is still trying to add more promotion
places other than at Jakarta Convention Center, Metropolitan Mall, and
Cibubur Junction or open the branch showroom in Jakarta city.
2. SO-2 Strategy, which is innovating and adding more sophisticated and
modern product design. The consumer demand that always higher and varied
about the product they want order, make company to add more new products
design combined with the use of additional accessories which are more
sophisticated and modern so that the look and quality of product will be look
special.
W-O Strategy
1. WO-1 Strategy, which is always give the direction and motivation to its
employees. The owner must have the patience to continue to motivate and
monitor the work progress done by employees. This is done so that
employees feel at ease and happy to work at UD. Karangjati Furniture, along
with the difficulty of finding new human resource today.
2. WO-2 Strategy, which is improving service and quality of the products to
customers. The service and quality of products can give a high appraisal of
company’s performance. To that end, UD. Karangjati Furniture must continue
to improve the Quality Control continuously to maintain customer loyalty.
S-T Strategy
1. Strategi ST-1, which is improving the promotion. Until now, the promotion of
company was limited to the exhibition only. Actually, the company already
has an own website, but had long since that website was never updated again.
The promotion through website actually is not so effective because of the
84
company's product design can be easily replicated by other competitors.
There are many types of promotions do companies, such as promotion
through famous magazines or newspapers, television, etc.
2. ST-2 Strategy, which is maintain the market price strategy to face the
competition. The target market of UD. Karangjati Furniture is the middle-
upper class consumer. Although the company used the highes quality of wood
material, the product price offered is not relatively expensive when compared
to the competitor which has quality in below of company. The discount
strategy offered in exhibition also can influence consumer to buy the
company’s product.
W-T Strategy
1. WT-1 Strategy, which is adding new marketing employees or sales
promotion. This strategy is necessary to anticipate if the company follows the
exhibition event in different places at one time as well and also to anticipate
the crowded visitor in exhibition, so that 1 or 2 sales promotion are not
enough to serve the consumer. The required marketing personnel for sure
must be proficient in communicating and negotiating with customers.
2. WT-2 Strategy, which is doing evaluation and study about the company’s
ability to facing the competition. This evaluation can be carried out by the
management which is expected to be able to continue for making the
improvements of weaknesses and shortcomings of company continuously.
This strategy also helps company to identify the condition of internal and
external environment, also the competitive conditions in surrounding areas.
4.2.5 QSPM Analysis
QSPM Analysis able to determine the list of priorities for strategy
implementation to determine the relative attractiveness (Attractiveness Score
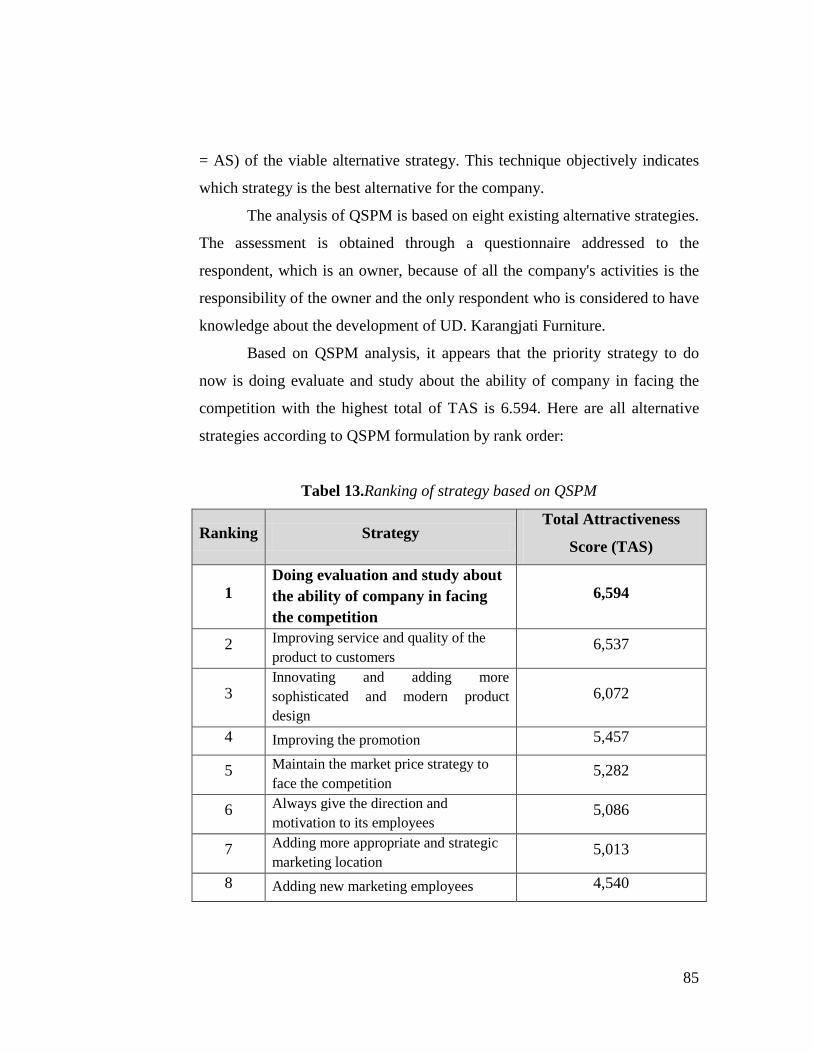
85
= AS) of the viable alternative strategy. This technique objectively indicates
which strategy is the best alternative for the company.
The analysis of QSPM is based on eight existing alternative strategies.
The assessment is obtained through a questionnaire addressed to the
respondent, which is an owner, because of all the company's activities is the
responsibility of the owner and the only respondent who is considered to have
knowledge about the development of UD. Karangjati Furniture.
Based on QSPM analysis, it appears that the priority strategy to do
now is doing evaluate and study about the ability of company in facing the
competition with the highest total of TAS is 6.594. Here are all alternative
strategies according to QSPM formulation by rank order:
Tabel 13.Ranking of strategy based on QSPM
Ranking Strategy Total Attractiveness
Score (TAS)
1 Doing evaluation and study about the ability of company in facing the competition
6,594
2 Improving service and quality of the product to customers
6,537
3 Innovating and adding more sophisticated and modern product design
6,072
4 Improving the promotion 5,457
5 Maintain the market price strategy to face the competition
5,282
6 Always give the direction and motivation to its employees
5,086
7 Adding more appropriate and strategic marketing location
5,013
8 Adding new marketing employees 4,540
86
CHAPTER V
CONCLUSIONS AND RECOMMENDATIONS
5.1 Conclusion
1. UD. Karangjati Furniture is a company that produces teak wood furniture in
minimalist design. The company is belonging to the medium scale enterprise that
still needs development strategy in order to compete with other large-scale
enterprises. To date the company has not dared to undertake a business
development effort through exports due to the production system is still simple
and the employee labor required is also not maximized. The company also still
feels overwhelmed because the ordering of local products is too much. The
strategy that has been done mostly in the form of promotional strategies through
the exhibition event at the Jakarta Convention Center (JCC), Cibubur Junction,
and Metropolitan Mall only.
2. The opportunities factors owned by UD. Karangjati Furniture, among others: (1)
The expanding of market segments, (2) The Increased of economic growth and
purchasing power, (3) The lack of competition for manufacturing teak furniture
with minimalist design, (4) The quality of teak wood that has been known since
before, and (5) The progress and innovation of technology. While facing the
threat factors include: (1) Availability of teak wood materials is increasingly rare,
(2) The weather and surroundings are difficult to estimate, (3) High competition
in the furniture industry, (4) Small barriers to entry in furniture industry, (5) The
substitute products available are very diverse, and (6) Bargaining power of
consumers is very high.
3. The strength factors of UD. Karangjati Furniture, among others: (1) Having a
responsible leader, social-minded, intelligent, and a great entrepreneurial, (2)
Having a brand advantage and quality of goods, (3) Implementation of Standard
87
Operating Procedures (SOP) has begun to clear and focused, (4) Have been using
the computer application system in the process of producing work, and (5) The
family - oriented and mutual help in working atmosphere. While the weakness
factors, among others: (1) Lack of human resource education level, (2) The
financial system is still simple, (3) Income levels growing niche to fluctuative
and unstable, (4) Lack of consistency in the distribution of the Job Description of
each employees, (5) Has not make observations and studies in an optimal
environment to promote the products, (6) Lack of a reliable marketing person,
and (7) The Quality Control process that has not been performing well.
4. The result of IE matrix analysis indicate that the position of UD. Karangjati
Furniture is currently on V cells, which is the hold and maintain stage, with the
alternative strategy of market penetration and product development. Results are
determined based on the total of weighted value of EFE matrix 2.474 and IFE
matrix of 2.519.
5. SWOT matrix analysis produced eight alternative strategies that can be used as a
business development efforts, namely: 1) Adding more appropriate and strategic
marketing location (SO-1), 2) Innovating and adding more sophisticated and
modern product design (SO-2), 3 ) Always give the direction and motivation to
its employees (WO-1), 4) Improving service and quality of the product to
customers (WO-2), 5) Improving the promotion (ST-1), 6) Maintain the market
price strategy to face the competition (ST-2), 7) Adding new marketing
employees (WT-1) and 8) Doing evaluation and study about the company's
ability in facing the competition (WT-2).
6. Based on the QSPM analysis, it can be shown that the best strategy to do by UD.
Karangjati Furniture is doing evaluation and study about the company’s ability in
facing the competition (WT-2) with a value of TAS (Total Attractiveness Scores)
of 6.594.
88
5.2 Recommendation
1. UD. Karangjati Furniture can implement the strategy to doing evaluation and
study about the company’s ability in facing the competition. This strategy is
actually covers a wide range of management area within the company.
Companies need to develop the ability and the strength and weaknesses and
reevaluate the management system that is still very simple in order to compete
with other furniture industry.
2. UD. Karangjati Furniture also need to consider the internal condition of the
utilization and management of human resources optimally. The company's
current constraint is the lack of human resources required in the production
process so that the division of labor is still not organized and implemented well.
Things to consider is the implementation of the Quality Control regularly and
thoroughly and instill discipline and communication to every member of the
company both in Bekasi and Solo so that the production process can be smooth
and can be immediately delivered to the customer in accordance with the
schedule without any complaints that may affect development of the company in
the long term.
3. Intensify the promotion and advertising, by advertising in a newspaper or
magazine and expand marketing locations in strategic places so that the products
of UD. Karangjati Furniture can be known and familiar by many people.
4. Using accounting principles in preparing accounting system so that all
transactions can be recorded neatly and systematically to facilitate the planning
and evaluation of efforts by recruit some competent employees.
89
REFFERENCES
Books:
David, F. R. (2010). Strategic Management: The Concepts. Jakarta: Salemba
Empat.
Drummond, G., & Ensor, J. (2001). Strategic Management: Planning and
Control. In London, England: Butterworth - Heinemann.
Hitt, Michael A. (2001). Manajemen Strategi: Daya Saing dan Globalisasi.
Jakarta: Salemba Empat.
Kotler, P. (2005). Marketing Management. Jakarta: PT. Prehalindo.
McCarthy, P. a. (2005). Basic Marketing. United States: McGraw - Hill.
Proctor, T. (2000). Strategic Marketing - an Introduction. London: Routledge.
Purwanto, I. (2006). Manajemen Strategi. Bandung: Yrama Widya.
Steiner, George A. and Miner, John B. (1997). Kebijakan dan Strategi
Manajemen. (Terjemahan) Edisi Kedua. Jakarta: Erlangga.
Tjiptono, F. (2008). Strategi Pemasaran. Yogyakarta: Andi.
Umar, H. (2008). Manajemen Strategi in Action. Jakarta: PT. Gramedia Pustaka
Utama.
Previous Thesis and Journal:
Ningrum, P. A. (2010). Analisis Strategi Usaha Jasa Pembuatan dan Perbaikan
Furniture UD. Suryani Furniture (Studi Kasus: Bogor,Jawa Barat). Institut
Pertanian Bogor: Skripsi pada Departemen Manajemen, Fakultas Ekonomi
dan Manajemen.
Purwono, J. (2009). Analisis Strategi Pengembangan Usaha Telur Puyuh (Studi
Kasus: Peternakan Puyuh Bintang Tiga, Cibungbulang,Bogor,Jawa Barat).
Institut Pertanian Bogor: Skripsi pada Departemen Manajemen, Fakultas
Ekonomi dan Manajemen.
90
Sri Rezeki, S. (2008). Analisis Strategi Pengembangan Usaha Esther Seafood.
Institut Pertanian Bogor: Skripsi pada Departemen Manajemen Agribisnis,
Fakultas Pertanian.
Yandi Asda, M. (2009). Analisis Strategi Pengembangan Bisnis Kentang (Studi
Kasus: PT. Dafa Teknoagro Mandiri, Kec. Ciampea, Kab. Bogor, Jawa
Barat). Institut Pertanian Bogor: Skripsi pada Departemen Manajemen
Agribisnis, Fakultas Ekonomi dan Manajemen.
Website:
Atfestoro. (2012, November 19). Retrieved from ATFESTORO DESIGN:
http://atfestoro.wordpress.com/2010/11/19/pengetahuan-bahan-furniture/
Ardian. (2012, April 16). Vision, Mission and Goals of Company. Retrieved
October 2012, from Ardian Blogspot:
http://ardiaans.blogspot.com/2012/04/visi-misi-dan-tujuan-perusahaan.html
Bhasin, H. (2011, October 6). Marketing Books. Retrieved October 2012, from
Marketing 91 Website: http://www.marketing91.com/marketing-mix-4-ps-
marketing
Durham Associates. (2010). Strategic Marketing. Retrieved October 2012, from
DA Group Website: http://www.da-group.co.uk
Emzetha. (2012, February). The Meaning of Furniture. Retrieved October 2012,
from http://emzetha-furniture.blogspot.com/2012
HubPages Inc. (2012). The Importance of Strategic Management. Retrieved
October 2012, from HubPages Wb Site:
http://savior.hubpages.com/hub/strategicmanagementimportance
jstaniec. (2008, November 20). 7 Functions of Marketing. Retrieved October
2012, from Quizlet Web site: http://quizlet.com/545303/7-functions-of-
marketing-flash-cards/
91
Management Study Guide. (2008). Porter's Five Forces Model of Competition.
Retrieved October 2012, from MSG Website:
http://www.managementstudyguide.com/porters-model-of-competetion.htm
ManagementStudyGuide. (2008). Strategic Management - A Complete Study
Guide. Retrieved October 2012, from Management Study Guide Web Site:
http://www.managementstudyguide.com/strategic-management.htm
Maxi-Pedia Corporation. (2012). Internal - External Matrix. Retrieved October
30, 2012, from http://www.maxi-pedia.com/internal+external+IE+matrix
MaxiPedia. (2011, July). Marketer's Magazine. Retrieved October 2012, from
MaxiPedia Web Site: http://mmauc.blogspot.com/2011/07/porters-5-
forces.html
Mind Tools Ltd. (2012). Retrieved October 2012, from Mind Tools Website:
http://www.mindtools.com/pages/article/newTMC_08.htm
Nishadha. (2012, February). SWOT vs PEST Analysis. Retrieved October 2012,
from Creately Web Site: http://creately.com/blog/diagrams/swot-analysis-vs-
pest-analysis/
Pixel Gremlins. (2011). Definition of Marketing. Retrieved October 17, 2012,
from Pixel Gremlins Web Site: http://www.pixelgremlins.com
Priyank. (2011, February). Product Marketing Kotler. Retrieved October 2012,
from Study Mode Website: http://www.studymode.com/essays/Product-
Marketing-Kotler-567672.html
Saujana. (2012). Definition od Vision and Mission. Retrieved October 2012, from
http://handpage.blogspot.com/p/pengertian-visi-dan-misi.html
Setkab RI. (2013, January 13). Retrieved from Sekretariat Kabinet RI Web Site:
http://www.setkab.go.id
Telkom Indonesia. (2012). Retrieved October 2012, from Telkom Web Site:
http://www.telkom.co.id
92
valuebasedmanagement. (2012, July). Marketing Mix 4p's model. Retrieved
October 2012, from Value based management Website:
http://www.valuebasedmanagement.net/methods_marketing_mix.html
Viklund, A. (2009). The Concepts of Strategy: Definition, Level, and Types.
Retrieved October 2012, from http://jurnal-
sdm.blogspot.com/2009/08/konsep-strategi-definisi-perumusan.html
WordPress.com. (2011, February 14). Nature of Strategy Analysis and Choice.
Retrieved October 30, 2012, from Pelangi Kata:
http://akusukamenulis.wordpress.com/2011/02/14/nature-of-strategy-
analysis-and-choice/
93
APPENDIX
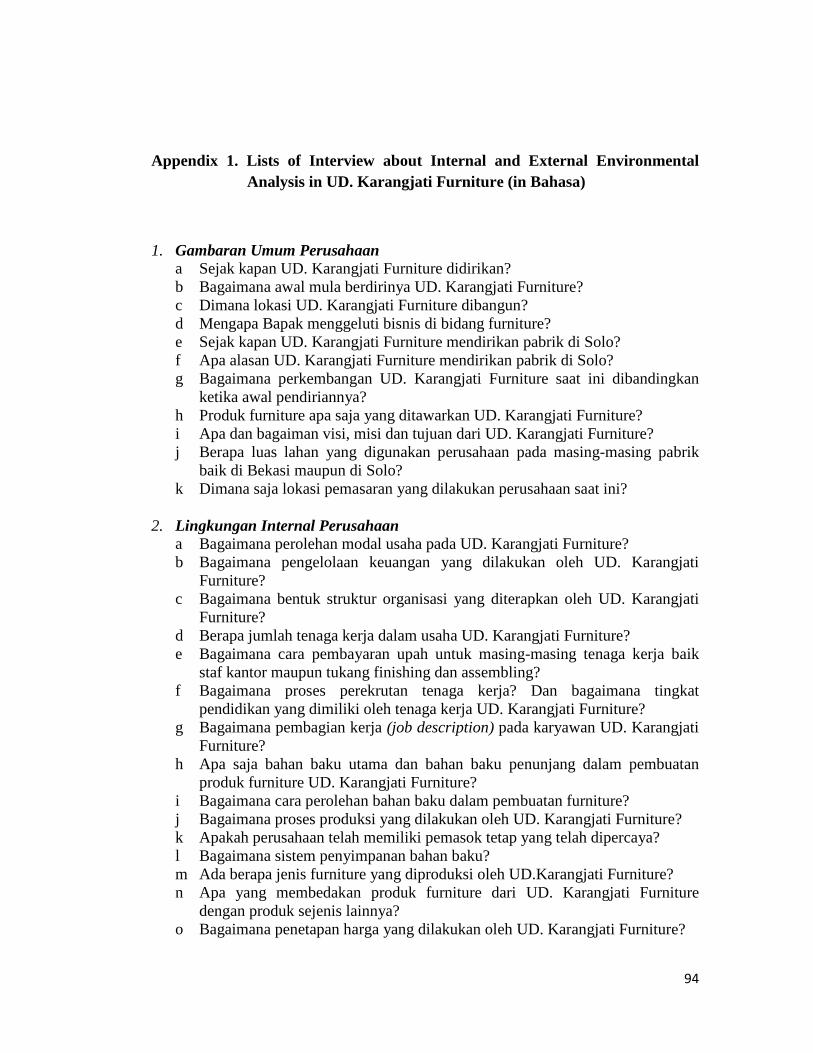
94
Appendix 1. Lists of Interview about Internal and External Environmental Analysis in UD. Karangjati Furniture (in Bahasa)
1. Gambaran Umum Perusahaan a Sejak kapan UD. Karangjati Furniture didirikan? b Bagaimana awal mula berdirinya UD. Karangjati Furniture? c Dimana lokasi UD. Karangjati Furniture dibangun? d Mengapa Bapak menggeluti bisnis di bidang furniture? e Sejak kapan UD. Karangjati Furniture mendirikan pabrik di Solo? f Apa alasan UD. Karangjati Furniture mendirikan pabrik di Solo? g Bagaimana perkembangan UD. Karangjati Furniture saat ini dibandingkan
ketika awal pendiriannya? h Produk furniture apa saja yang ditawarkan UD. Karangjati Furniture? i Apa dan bagaiman visi, misi dan tujuan dari UD. Karangjati Furniture? j Berapa luas lahan yang digunakan perusahaan pada masing-masing pabrik
baik di Bekasi maupun di Solo? k Dimana saja lokasi pemasaran yang dilakukan perusahaan saat ini?
2. Lingkungan Internal Perusahaan
a Bagaimana perolehan modal usaha pada UD. Karangjati Furniture? b Bagaimana pengelolaan keuangan yang dilakukan oleh UD. Karangjati
Furniture? c Bagaimana bentuk struktur organisasi yang diterapkan oleh UD. Karangjati
Furniture? d Berapa jumlah tenaga kerja dalam usaha UD. Karangjati Furniture? e Bagaimana cara pembayaran upah untuk masing-masing tenaga kerja baik
staf kantor maupun tukang finishing dan assembling? f Bagaimana proses perekrutan tenaga kerja? Dan bagaimana tingkat
pendidikan yang dimiliki oleh tenaga kerja UD. Karangjati Furniture? g Bagaimana pembagian kerja (job description) pada karyawan UD. Karangjati
Furniture? h Apa saja bahan baku utama dan bahan baku penunjang dalam pembuatan
produk furniture UD. Karangjati Furniture? i Bagaimana cara perolehan bahan baku dalam pembuatan furniture? j Bagaimana proses produksi yang dilakukan oleh UD. Karangjati Furniture? k Apakah perusahaan telah memiliki pemasok tetap yang telah dipercaya? l Bagaimana sistem penyimpanan bahan baku? m Ada berapa jenis furniture yang diproduksi oleh UD.Karangjati Furniture? n Apa yang membedakan produk furniture dari UD. Karangjati Furniture
dengan produk sejenis lainnya? o Bagaimana penetapan harga yang dilakukan oleh UD. Karangjati Furniture?
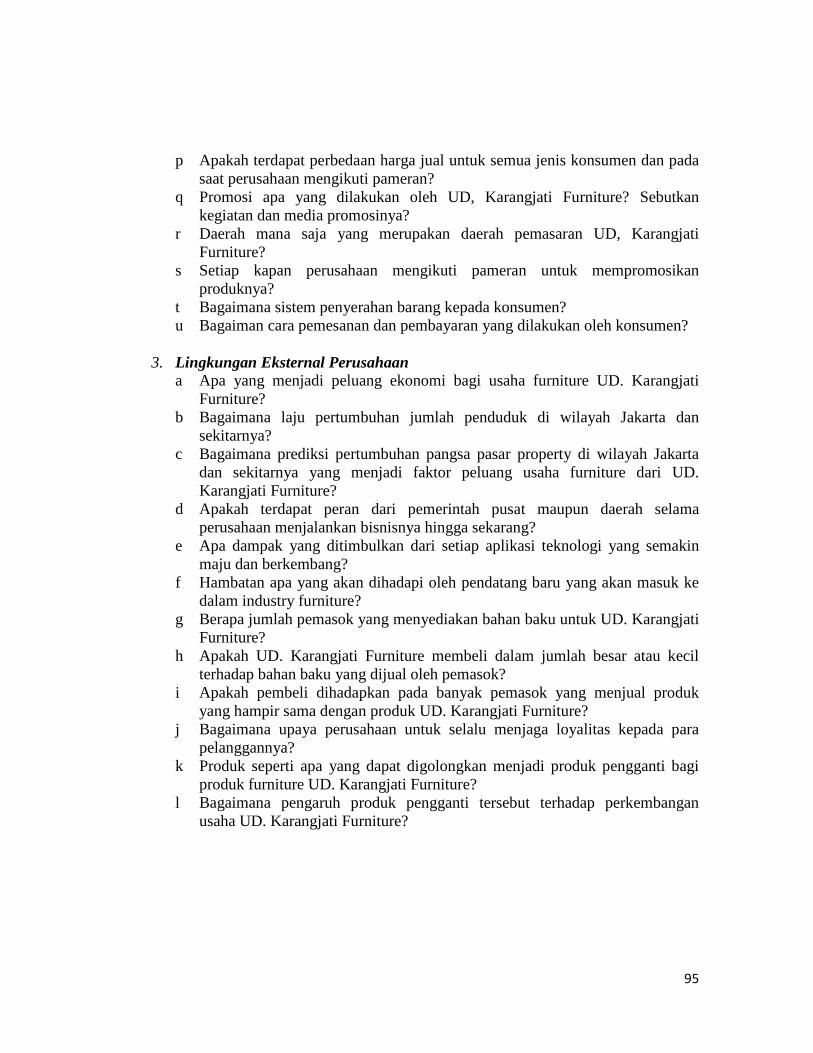
95
p Apakah terdapat perbedaan harga jual untuk semua jenis konsumen dan pada saat perusahaan mengikuti pameran?
q Promosi apa yang dilakukan oleh UD, Karangjati Furniture? Sebutkan kegiatan dan media promosinya?
r Daerah mana saja yang merupakan daerah pemasaran UD, Karangjati Furniture?
s Setiap kapan perusahaan mengikuti pameran untuk mempromosikan produknya?
t Bagaimana sistem penyerahan barang kepada konsumen? u Bagaiman cara pemesanan dan pembayaran yang dilakukan oleh konsumen?
3. Lingkungan Eksternal Perusahaan
a Apa yang menjadi peluang ekonomi bagi usaha furniture UD. Karangjati Furniture?
b Bagaimana laju pertumbuhan jumlah penduduk di wilayah Jakarta dan sekitarnya?
c Bagaimana prediksi pertumbuhan pangsa pasar property di wilayah Jakarta dan sekitarnya yang menjadi faktor peluang usaha furniture dari UD. Karangjati Furniture?
d Apakah terdapat peran dari pemerintah pusat maupun daerah selama perusahaan menjalankan bisnisnya hingga sekarang?
e Apa dampak yang ditimbulkan dari setiap aplikasi teknologi yang semakin maju dan berkembang?
f Hambatan apa yang akan dihadapi oleh pendatang baru yang akan masuk ke dalam industry furniture?
g Berapa jumlah pemasok yang menyediakan bahan baku untuk UD. Karangjati Furniture?
h Apakah UD. Karangjati Furniture membeli dalam jumlah besar atau kecil terhadap bahan baku yang dijual oleh pemasok?
i Apakah pembeli dihadapkan pada banyak pemasok yang menjual produk yang hampir sama dengan produk UD. Karangjati Furniture?
j Bagaimana upaya perusahaan untuk selalu menjaga loyalitas kepada para pelanggannya?
k Produk seperti apa yang dapat digolongkan menjadi produk pengganti bagi produk furniture UD. Karangjati Furniture?
l Bagaimana pengaruh produk pengganti tersebut terhadap perkembangan usaha UD. Karangjati Furniture?
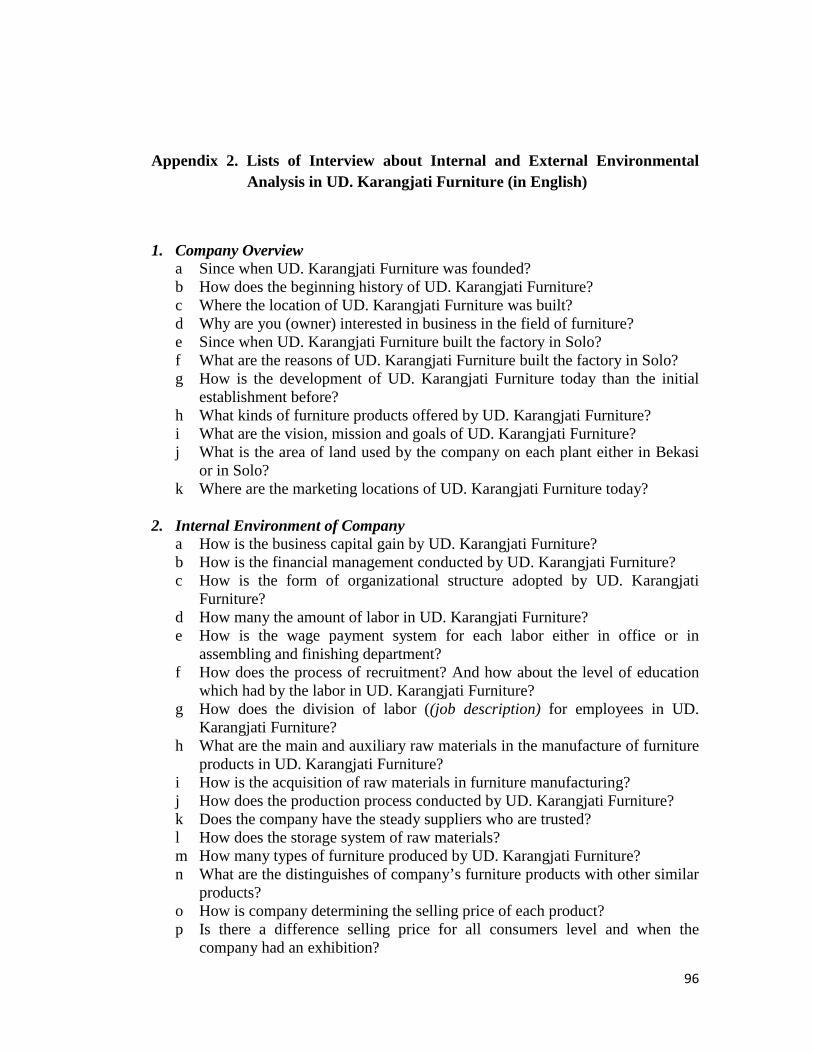
96
Appendix 2. Lists of Interview about Internal and External Environmental Analysis in UD. Karangjati Furniture (in English)
1. Company Overview a Since when UD. Karangjati Furniture was founded? b How does the beginning history of UD. Karangjati Furniture? c Where the location of UD. Karangjati Furniture was built? d Why are you (owner) interested in business in the field of furniture? e Since when UD. Karangjati Furniture built the factory in Solo? f What are the reasons of UD. Karangjati Furniture built the factory in Solo? g How is the development of UD. Karangjati Furniture today than the initial
establishment before? h What kinds of furniture products offered by UD. Karangjati Furniture? i What are the vision, mission and goals of UD. Karangjati Furniture? j What is the area of land used by the company on each plant either in Bekasi
or in Solo? k Where are the marketing locations of UD. Karangjati Furniture today?
2. Internal Environment of Company
a How is the business capital gain by UD. Karangjati Furniture? b How is the financial management conducted by UD. Karangjati Furniture? c How is the form of organizational structure adopted by UD. Karangjati
Furniture? d How many the amount of labor in UD. Karangjati Furniture? e How is the wage payment system for each labor either in office or in
assembling and finishing department? f How does the process of recruitment? And how about the level of education
which had by the labor in UD. Karangjati Furniture? g How does the division of labor ((job description) for employees in UD.
Karangjati Furniture? h What are the main and auxiliary raw materials in the manufacture of furniture
products in UD. Karangjati Furniture? i How is the acquisition of raw materials in furniture manufacturing? j How does the production process conducted by UD. Karangjati Furniture? k Does the company have the steady suppliers who are trusted? l How does the storage system of raw materials? m How many types of furniture produced by UD. Karangjati Furniture? n What are the distinguishes of company’s furniture products with other similar
products? o How is company determining the selling price of each product? p Is there a difference selling price for all consumers level and when the
company had an exhibition?
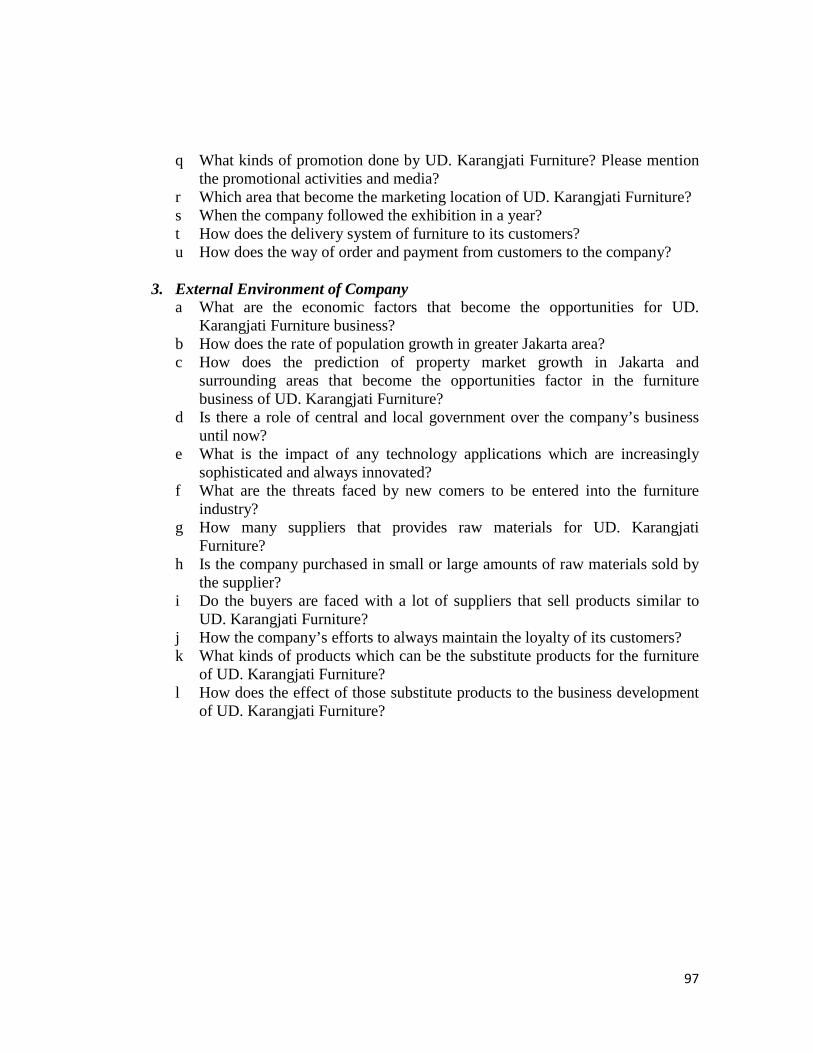
97
q What kinds of promotion done by UD. Karangjati Furniture? Please mention the promotional activities and media?
r Which area that become the marketing location of UD. Karangjati Furniture? s When the company followed the exhibition in a year? t How does the delivery system of furniture to its customers? u How does the way of order and payment from customers to the company?
3. External Environment of Company
a What are the economic factors that become the opportunities for UD. Karangjati Furniture business?
b How does the rate of population growth in greater Jakarta area? c How does the prediction of property market growth in Jakarta and
surrounding areas that become the opportunities factor in the furniture business of UD. Karangjati Furniture?
d Is there a role of central and local government over the company’s business until now?
e What is the impact of any technology applications which are increasingly sophisticated and always innovated?
f What are the threats faced by new comers to be entered into the furniture industry?
g How many suppliers that provides raw materials for UD. Karangjati Furniture?
h Is the company purchased in small or large amounts of raw materials sold by the supplier?
i Do the buyers are faced with a lot of suppliers that sell products similar to UD. Karangjati Furniture?
j How the company’s efforts to always maintain the loyalty of its customers? k What kinds of products which can be the substitute products for the furniture
of UD. Karangjati Furniture? l How does the effect of those substitute products to the business development
of UD. Karangjati Furniture?
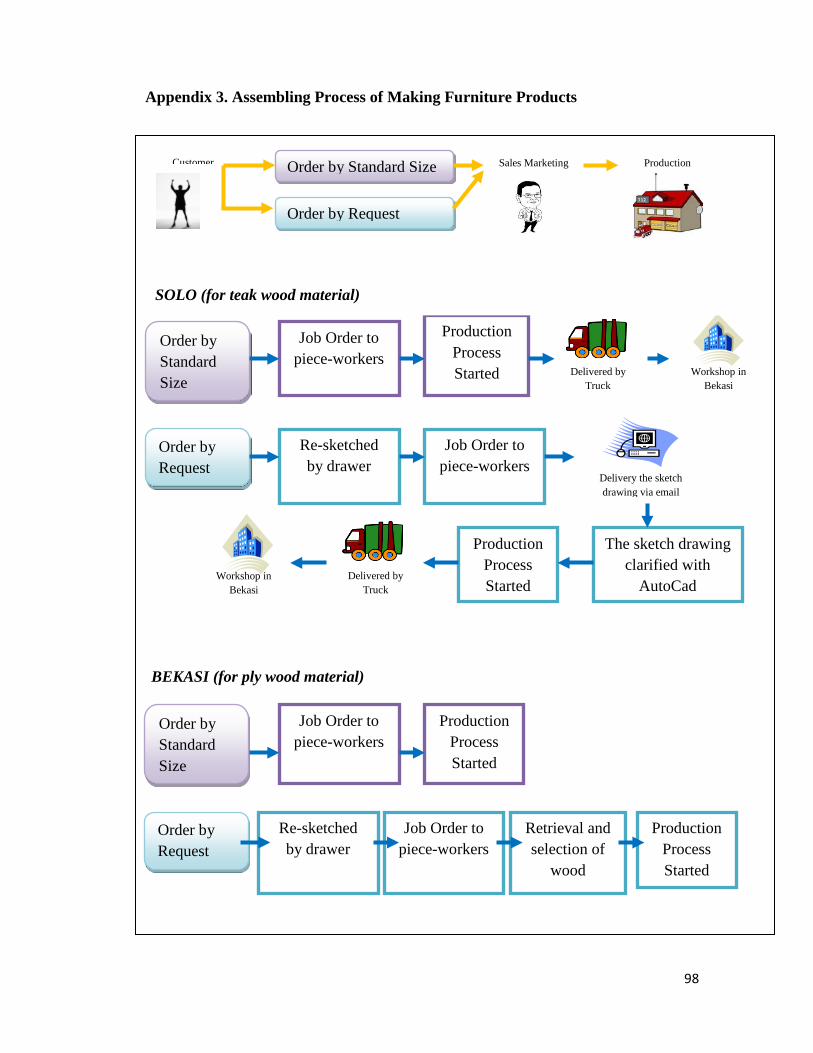
98
Customer Order by Standard Size
Order by Request
Sales Marketing Production
Order by Standard Size
Order by Request
Job Order to piece-workers
Production Process Started Delivered by
Truck Workshop in
Bekasi
Re-sketched by drawer
Job Order to piece-workers
Delivery the sketch drawing via email
Delivered by Truck
Production Process Started
The sketch drawing clarified with
AutoCad Workshop in
Bekasi
Order by Standard Size
Order by Request
Job Order to piece-workers
Production Process Started
Re-sketched by drawer
Job Order to piece-workers
Retrieval and selection of
wood
Production Process Started
BEKASI (for ply wood material)
Appendix 3. Assembling Process of Making Furniture Products
SOLO (for teak wood material)
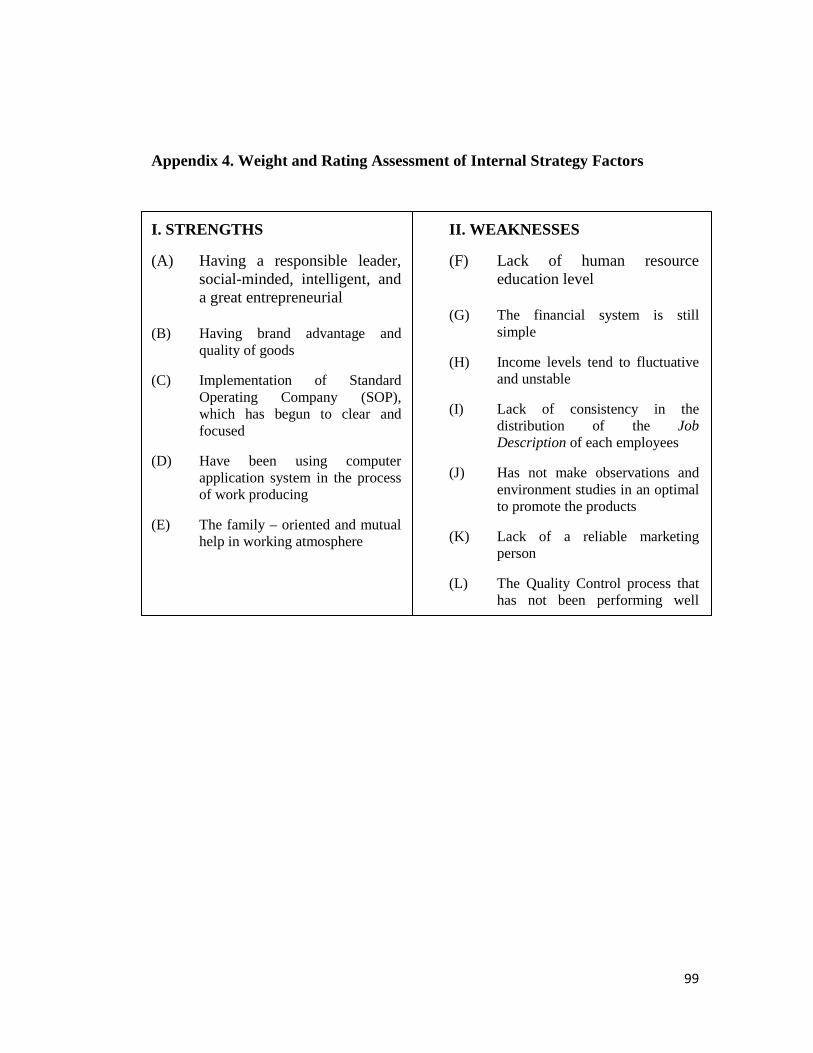
99
Appendix 4. Weight and Rating Assessment of Internal Strategy Factors
I. STRENGTHS
(A) Having a responsible leader, social-minded, intelligent, and a great entrepreneurial
(B) Having brand advantage and
quality of goods
(C) Implementation of Standard Operating Company (SOP), which has begun to clear and focused
(D) Have been using computer application system in the process of work producing
(E) The family – oriented and mutual help in working atmosphere
II. WEAKNESSES
(F) Lack of human resource education level
(G) The financial system is still
simple
(H) Income levels tend to fluctuative and unstable
(I) Lack of consistency in the distribution of the Job Description of each employees
(J) Has not make observations and environment studies in an optimal to promote the products
(K) Lack of a reliable marketing person
(L) The Quality Control process that has not been performing well
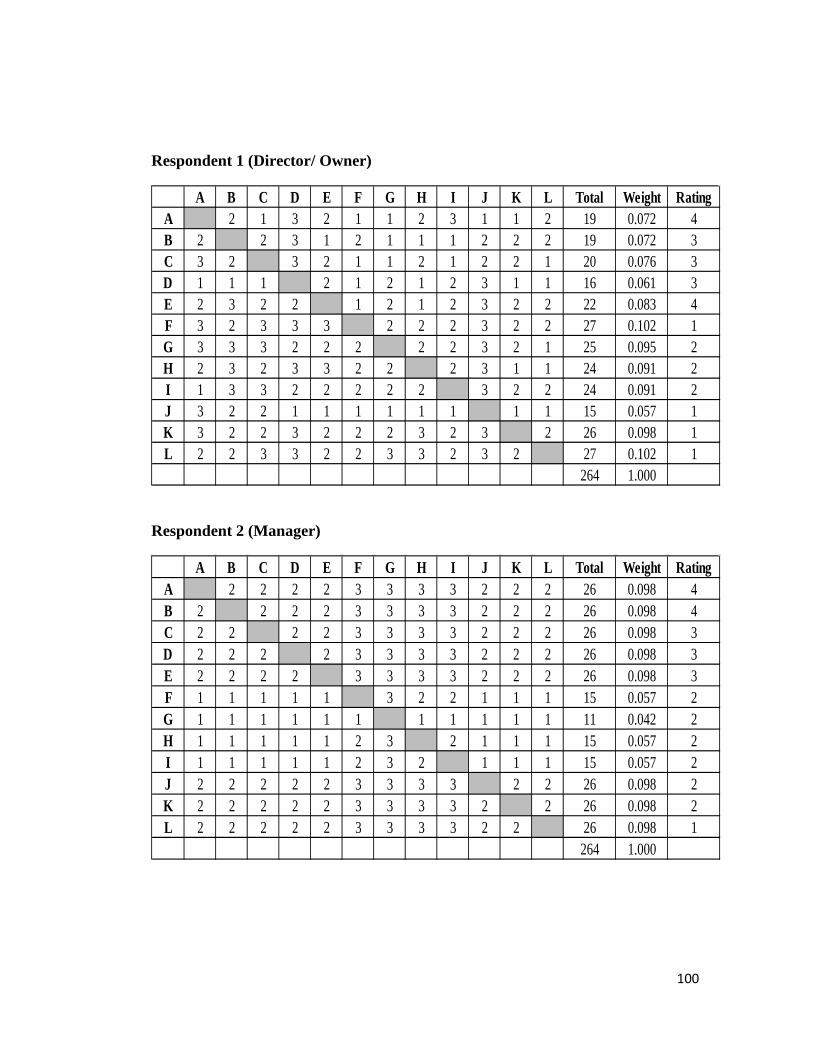
100
Respondent 1 (Director/ Owner)
Respondent 2 (Manager)
A B C D E F G H I J K L Total Weight RatingA 2 1 3 2 1 1 2 3 1 1 2 19 0.072 4B 2 2 3 1 2 1 1 1 2 2 2 19 0.072 3C 3 2 3 2 1 1 2 1 2 2 1 20 0.076 3D 1 1 1 2 1 2 1 2 3 1 1 16 0.061 3E 2 3 2 2 1 2 1 2 3 2 2 22 0.083 4F 3 2 3 3 3 2 2 2 3 2 2 27 0.102 1G 3 3 3 2 2 2 2 2 3 2 1 25 0.095 2H 2 3 2 3 3 2 2 2 3 1 1 24 0.091 2I 1 3 3 2 2 2 2 2 3 2 2 24 0.091 2J 3 2 2 1 1 1 1 1 1 1 1 15 0.057 1K 3 2 2 3 2 2 2 3 2 3 2 26 0.098 1L 2 2 3 3 2 2 3 3 2 3 2 27 0.102 1
264 1.000
A B C D E F G H I J K L Total Weight RatingA 2 2 2 2 3 3 3 3 2 2 2 26 0.098 4B 2 2 2 2 3 3 3 3 2 2 2 26 0.098 4C 2 2 2 2 3 3 3 3 2 2 2 26 0.098 3D 2 2 2 2 3 3 3 3 2 2 2 26 0.098 3E 2 2 2 2 3 3 3 3 2 2 2 26 0.098 3F 1 1 1 1 1 3 2 2 1 1 1 15 0.057 2G 1 1 1 1 1 1 1 1 1 1 1 11 0.042 2H 1 1 1 1 1 2 3 2 1 1 1 15 0.057 2I 1 1 1 1 1 2 3 2 1 1 1 15 0.057 2J 2 2 2 2 2 3 3 3 3 2 2 26 0.098 2K 2 2 2 2 2 3 3 3 3 2 2 26 0.098 2L 2 2 2 2 2 3 3 3 3 2 2 26 0.098 1
264 1.000
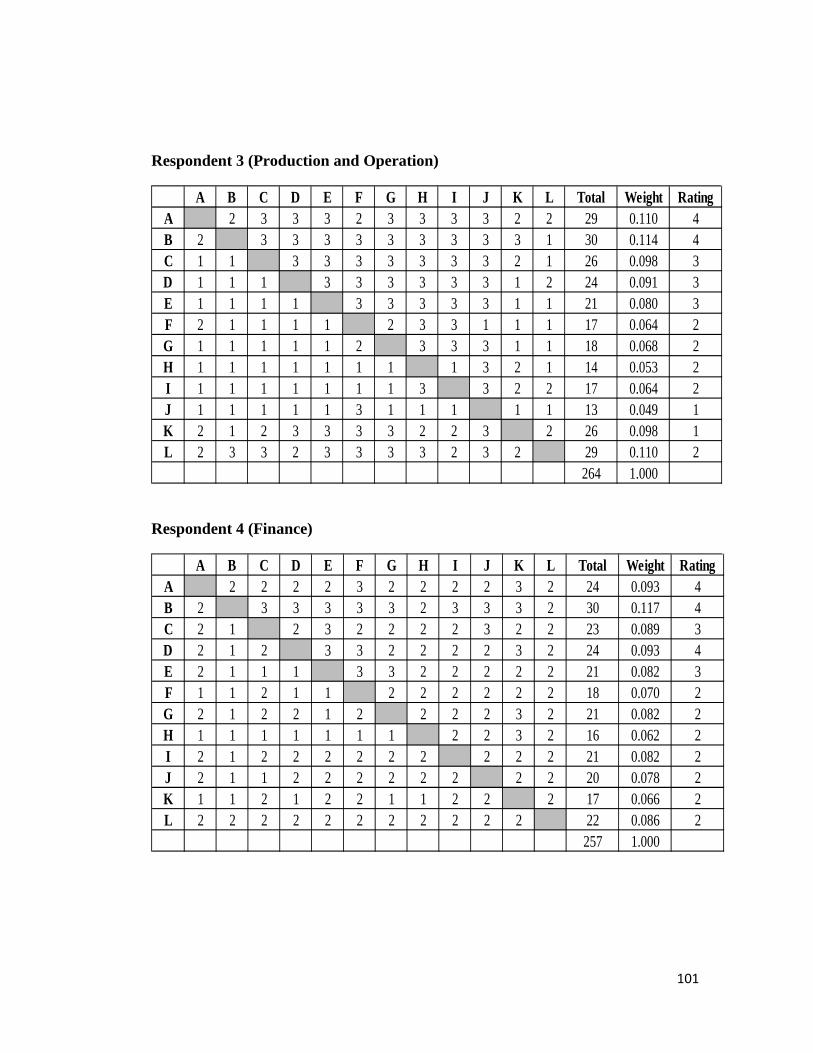
101
Respondent 3 (Production and Operation)
Respondent 4 (Finance)
A B C D E F G H I J K L Total Weight RatingA 2 3 3 3 2 3 3 3 3 2 2 29 0.110 4B 2 3 3 3 3 3 3 3 3 3 1 30 0.114 4C 1 1 3 3 3 3 3 3 3 2 1 26 0.098 3D 1 1 1 3 3 3 3 3 3 1 2 24 0.091 3E 1 1 1 1 3 3 3 3 3 1 1 21 0.080 3F 2 1 1 1 1 2 3 3 1 1 1 17 0.064 2G 1 1 1 1 1 2 3 3 3 1 1 18 0.068 2H 1 1 1 1 1 1 1 1 3 2 1 14 0.053 2I 1 1 1 1 1 1 1 3 3 2 2 17 0.064 2J 1 1 1 1 1 3 1 1 1 1 1 13 0.049 1K 2 1 2 3 3 3 3 2 2 3 2 26 0.098 1L 2 3 3 2 3 3 3 3 2 3 2 29 0.110 2
264 1.000
A B C D E F G H I J K L Total Weight RatingA 2 2 2 2 3 2 2 2 2 3 2 24 0.093 4B 2 3 3 3 3 3 2 3 3 3 2 30 0.117 4C 2 1 2 3 2 2 2 2 3 2 2 23 0.089 3D 2 1 2 3 3 2 2 2 2 3 2 24 0.093 4E 2 1 1 1 3 3 2 2 2 2 2 21 0.082 3F 1 1 2 1 1 2 2 2 2 2 2 18 0.070 2G 2 1 2 2 1 2 2 2 2 3 2 21 0.082 2H 1 1 1 1 1 1 1 2 2 3 2 16 0.062 2I 2 1 2 2 2 2 2 2 2 2 2 21 0.082 2J 2 1 1 2 2 2 2 2 2 2 2 20 0.078 2K 1 1 2 1 2 2 1 1 2 2 2 17 0.066 2L 2 2 2 2 2 2 2 2 2 2 2 22 0.086 2
257 1.000
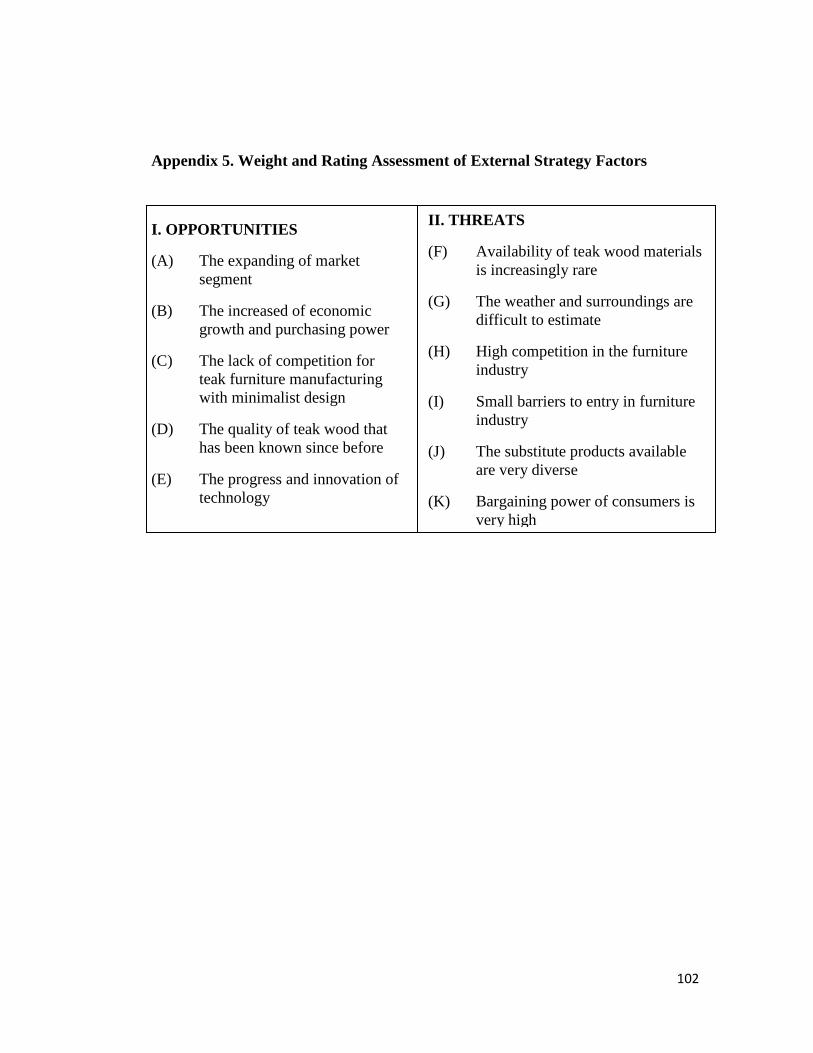
102
Appendix 5. Weight and Rating Assessment of External Strategy Factors
I. OPPORTUNITIES
(A) The expanding of market segment
(B) The increased of economic growth and purchasing power
(C) The lack of competition for teak furniture manufacturing with minimalist design
(D) The quality of teak wood that has been known since before
(E) The progress and innovation of technology
II. THREATS
(F) Availability of teak wood materials is increasingly rare
(G) The weather and surroundings are difficult to estimate
(H) High competition in the furniture industry
(I) Small barriers to entry in furniture industry
(J) The substitute products available are very diverse
(K) Bargaining power of consumers is very high
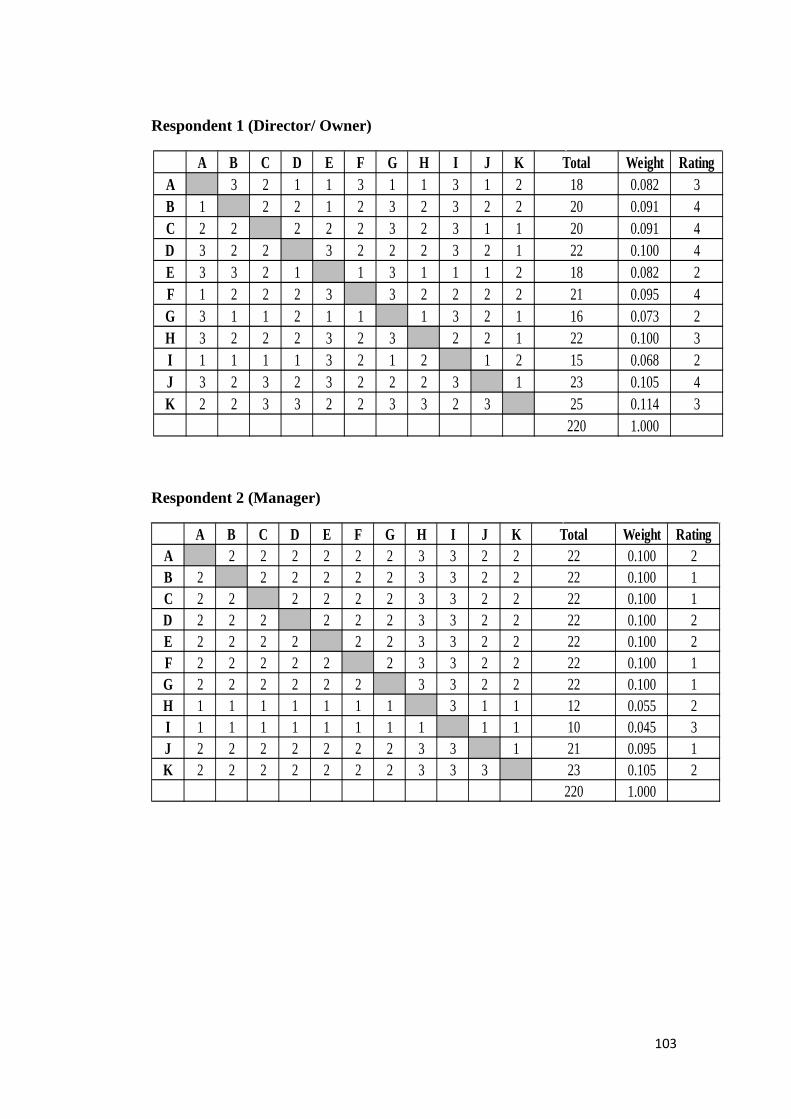
103
Respondent 1 (Director/ Owner)
Respondent 2 (Manager)
A B C D E F G H I J K Weight RatingA 3 2 1 1 3 1 1 3 1 2 0.082 3B 1 2 2 1 2 3 2 3 2 2 0.091 4C 2 2 2 2 2 3 2 3 1 1 0.091 4D 3 2 2 3 2 2 2 3 2 1 0.100 4E 3 3 2 1 1 3 1 1 1 2 0.082 2F 1 2 2 2 3 3 2 2 2 2 0.095 4G 3 1 1 2 1 1 1 3 2 1 0.073 2H 3 2 2 2 3 2 3 2 2 1 0.100 3I 1 1 1 1 3 2 1 2 1 2 0.068 2J 3 2 3 2 3 2 2 2 3 1 0.105 4K 2 2 3 3 2 2 3 3 2 3 0.114 3
1.000
152325220
Total1820202218211622
A B C D E F G H I J K Weight RatingA 2 2 2 2 2 2 3 3 2 2 0.100 2B 2 2 2 2 2 2 3 3 2 2 0.100 1C 2 2 2 2 2 2 3 3 2 2 0.100 1D 2 2 2 2 2 2 3 3 2 2 0.100 2E 2 2 2 2 2 2 3 3 2 2 0.100 2F 2 2 2 2 2 2 3 3 2 2 0.100 1G 2 2 2 2 2 2 3 3 2 2 0.100 1H 1 1 1 1 1 1 1 3 1 1 0.055 2I 1 1 1 1 1 1 1 1 1 1 0.045 3J 2 2 2 2 2 2 2 3 3 1 0.095 1K 2 2 2 2 2 2 2 3 3 3 0.105 2
1.000
2123220
2222221210
Total22222222
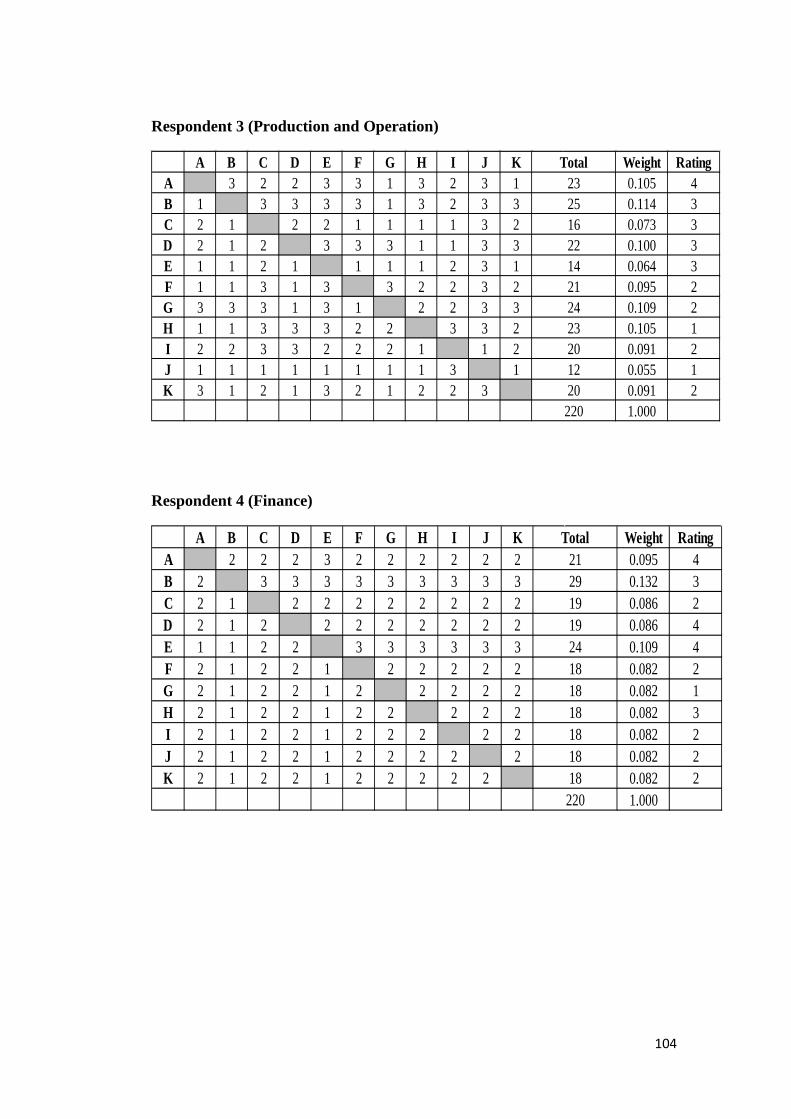
104
Respondent 3 (Production and Operation)
Respondent 4 (Finance)
A B C D E F G H I J K Weight RatingA 3 2 2 3 3 1 3 2 3 1 0.105 4B 1 3 3 3 3 1 3 2 3 3 0.114 3C 2 1 2 2 1 1 1 1 3 2 0.073 3D 2 1 2 3 3 3 1 1 3 3 0.100 3E 1 1 2 1 1 1 1 2 3 1 0.064 3F 1 1 3 1 3 3 2 2 3 2 0.095 2G 3 3 3 1 3 1 2 2 3 3 0.109 2H 1 1 3 3 3 2 2 3 3 2 0.105 1I 2 2 3 3 2 2 2 1 1 2 0.091 2J 1 1 1 1 1 1 1 1 3 1 0.055 1K 3 1 2 1 3 2 1 2 2 3 0.091 2
1.000220
2423201220
2516221421
Total23
A B C D E F G H I J K Weight RatingA 2 2 2 3 2 2 2 2 2 2 0.095 4B 2 3 3 3 3 3 3 3 3 3 0.132 3C 2 1 2 2 2 2 2 2 2 2 0.086 2D 2 1 2 2 2 2 2 2 2 2 0.086 4E 1 1 2 2 3 3 3 3 3 3 0.109 4F 2 1 2 2 1 2 2 2 2 2 0.082 2G 2 1 2 2 1 2 2 2 2 2 0.082 1H 2 1 2 2 1 2 2 2 2 2 0.082 3I 2 1 2 2 1 2 2 2 2 2 0.082 2J 2 1 2 2 1 2 2 2 2 2 0.082 2K 2 1 2 2 1 2 2 2 2 2 0.082 2
1.000
181818
220
1924181818
Total212919
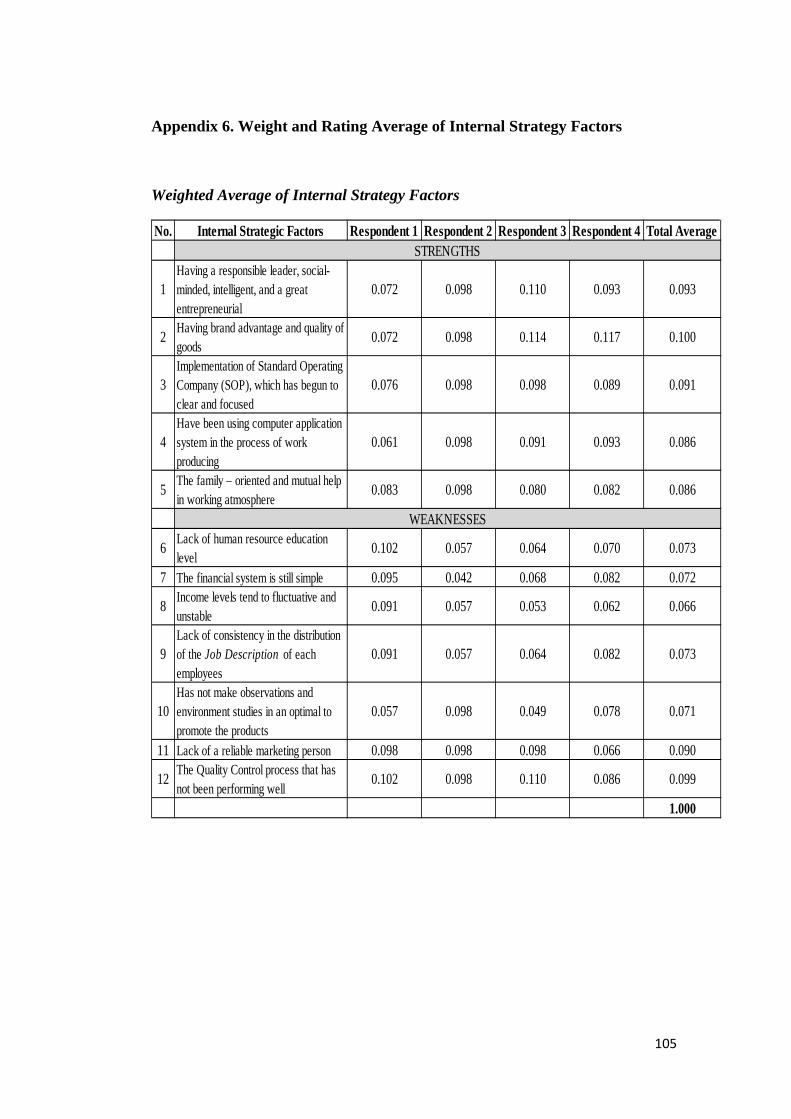
105
Appendix 6. Weight and Rating Average of Internal Strategy Factors
Weighted Average of Internal Strategy Factors
No. Internal Strategic Factors Respondent 1 Respondent 2 Respondent 3 Respondent 4 Total Average
1Having a responsible leader, social-minded, intelligent, and a great entrepreneurial
0.072 0.098 0.110 0.093 0.093
2 Having brand advantage and quality of goods
0.072 0.098 0.114 0.117 0.100
3Implementation of Standard Operating Company (SOP), which has begun to clear and focused
0.076 0.098 0.098 0.089 0.091
4Have been using computer application system in the process of work producing
0.061 0.098 0.091 0.093 0.086
5 The family – oriented and mutual help in working atmosphere
0.083 0.098 0.080 0.082 0.086
6 Lack of human resource education level
0.102 0.057 0.064 0.070 0.073
7 The financial system is still simple 0.095 0.042 0.068 0.082 0.072
8 Income levels tend to fluctuative and unstable
0.091 0.057 0.053 0.062 0.066
9Lack of consistency in the distribution of the Job Description of each employees
0.091 0.057 0.064 0.082 0.073
10Has not make observations and environment studies in an optimal to promote the products
0.057 0.098 0.049 0.078 0.071
11 Lack of a reliable marketing person 0.098 0.098 0.098 0.066 0.090
12 The Quality Control process that has not been performing well
0.102 0.098 0.110 0.086 0.099
1.000
WEAKNESSES
STRENGTHS
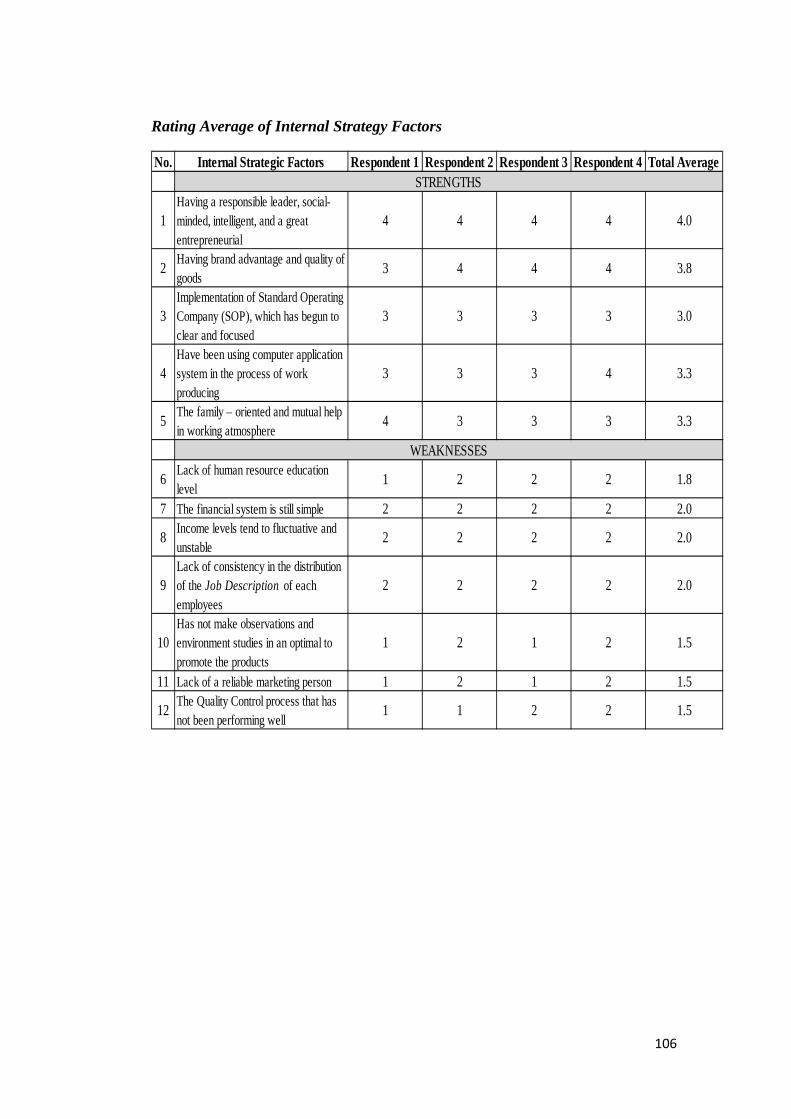
106
Rating Average of Internal Strategy Factors
No. Internal Strategic Factors Respondent 1 Respondent 2 Respondent 3 Respondent 4 Total Average
1Having a responsible leader, social-minded, intelligent, and a great entrepreneurial
4 4 4 4 4.0
2 Having brand advantage and quality of goods
3 4 4 4 3.8
3Implementation of Standard Operating Company (SOP), which has begun to clear and focused
3 3 3 3 3.0
4Have been using computer application system in the process of work producing
3 3 3 4 3.3
5 The family – oriented and mutual help in working atmosphere
4 3 3 3 3.3
6 Lack of human resource education level
1 2 2 2 1.8
7 The financial system is still simple 2 2 2 2 2.0
8 Income levels tend to fluctuative and unstable
2 2 2 2 2.0
9Lack of consistency in the distribution of the Job Description of each employees
2 2 2 2 2.0
10Has not make observations and environment studies in an optimal to promote the products
1 2 1 2 1.5
11 Lack of a reliable marketing person 1 2 1 2 1.5
12 The Quality Control process that has not been performing well
1 1 2 2 1.5
STRENGTHS
WEAKNESSES
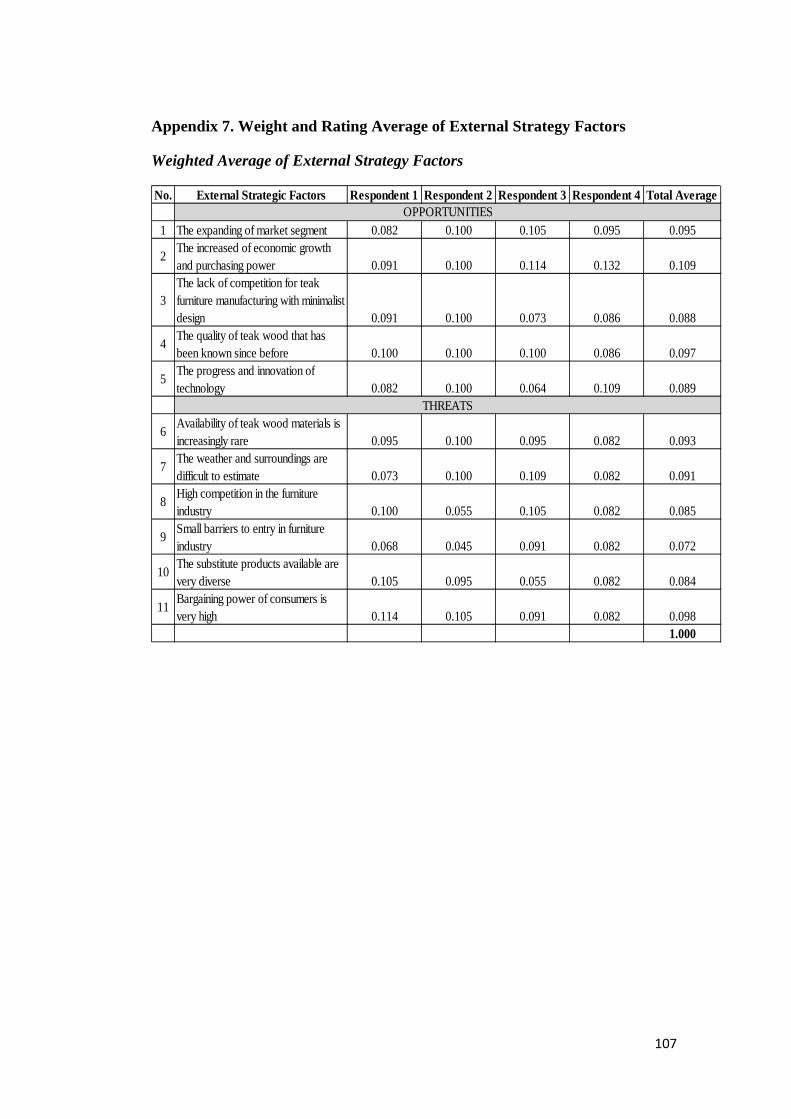
107
Appendix 7. Weight and Rating Average of External Strategy Factors
Weighted Average of External Strategy Factors
No. External Strategic Factors Respondent 1 Respondent 2 Respondent 3 Respondent 4 Total Average
1 The expanding of market segment 0.082 0.100 0.105 0.095 0.095
2 The increased of economic growth and purchasing power 0.091 0.100 0.114 0.132 0.109
3The lack of competition for teak furniture manufacturing with minimalist design 0.091 0.100 0.073 0.086 0.088
4 The quality of teak wood that has been known since before 0.100 0.100 0.100 0.086 0.097
5 The progress and innovation of technology 0.082 0.100 0.064 0.109 0.089
6 Availability of teak wood materials is increasingly rare 0.095 0.100 0.095 0.082 0.093
7 The weather and surroundings are difficult to estimate 0.073 0.100 0.109 0.082 0.091
8 High competition in the furniture industry 0.100 0.055 0.105 0.082 0.085
9 Small barriers to entry in furniture industry 0.068 0.045 0.091 0.082 0.072
10 The substitute products available are very diverse 0.105 0.095 0.055 0.082 0.084
11 Bargaining power of consumers is very high 0.114 0.105 0.091 0.082 0.098
1.000
OPPORTUNITIES
THREATS
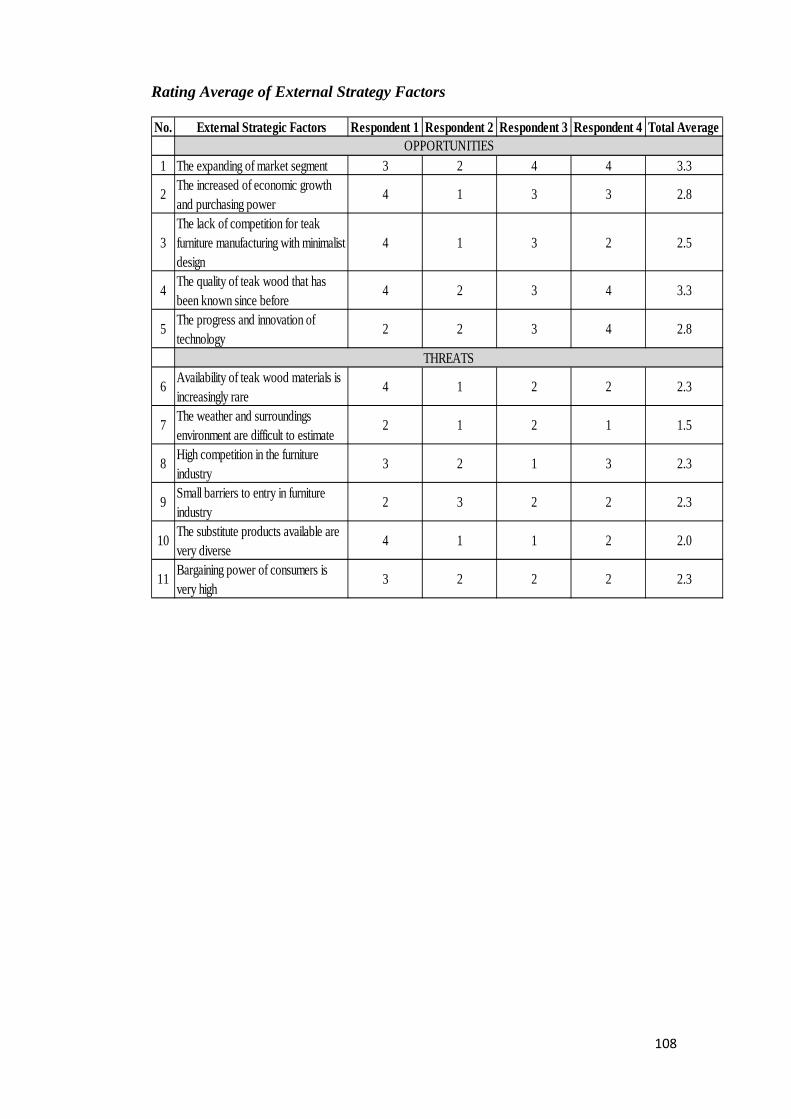
108
Rating Average of External Strategy Factors
No. External Strategic Factors Respondent 1 Respondent 2 Respondent 3 Respondent 4 Total Average
1 The expanding of market segment 3 2 4 4 3.3
2 The increased of economic growth and purchasing power
4 1 3 3 2.8
3The lack of competition for teak furniture manufacturing with minimalist design
4 1 3 2 2.5
4 The quality of teak wood that has been known since before
4 2 3 4 3.3
5 The progress and innovation of technology
2 2 3 4 2.8
6 Availability of teak wood materials is increasingly rare
4 1 2 2 2.3
7 The weather and surroundings environment are difficult to estimate
2 1 2 1 1.5
8 High competition in the furniture industry
3 2 1 3 2.3
9 Small barriers to entry in furniture industry
2 3 2 2 2.3
10 The substitute products available are very diverse
4 1 1 2 2.0
11 Bargaining power of consumers is very high
3 2 2 2 2.3
OPPORTUNITIES
THREATS
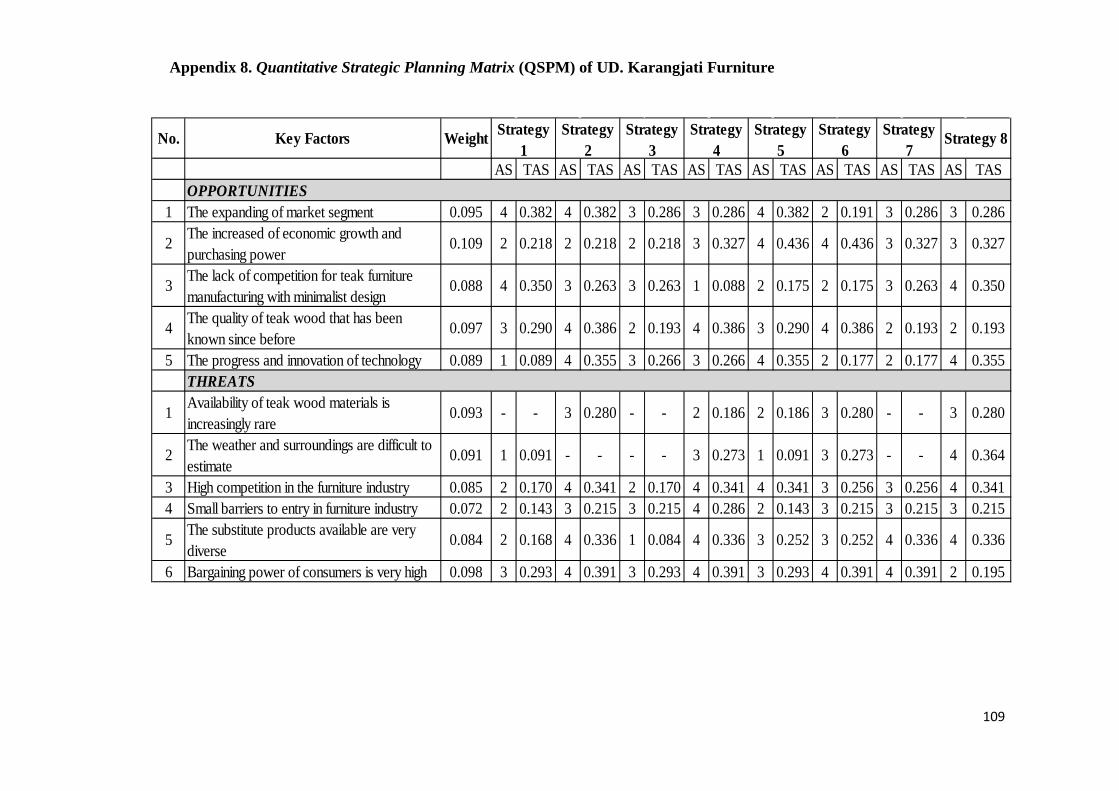
109
No. Key Factors Weight
AS TAS AS TAS AS TAS AS TAS AS TAS AS TAS AS TAS AS TAS
1 The expanding of market segment 0.095 4 0.382 4 0.382 3 0.286 3 0.286 4 0.382 2 0.191 3 0.286 3 0.286
2 The increased of economic growth and purchasing power
0.109 2 0.218 2 0.218 2 0.218 3 0.327 4 0.436 4 0.436 3 0.327 3 0.327
3 The lack of competition for teak furniture manufacturing with minimalist design
0.088 4 0.350 3 0.263 3 0.263 1 0.088 2 0.175 2 0.175 3 0.263 4 0.350
4 The quality of teak wood that has been known since before
0.097 3 0.290 4 0.386 2 0.193 4 0.386 3 0.290 4 0.386 2 0.193 2 0.193
5 The progress and innovation of technology 0.089 1 0.089 4 0.355 3 0.266 3 0.266 4 0.355 2 0.177 2 0.177 4 0.355
1 Availability of teak wood materials is increasingly rare
0.093 - - 3 0.280 - - 2 0.186 2 0.186 3 0.280 - - 3 0.280
2 The weather and surroundings are difficult to estimate
0.091 1 0.091 - - - - 3 0.273 1 0.091 3 0.273 - - 4 0.364
3 High competition in the furniture industry 0.085 2 0.170 4 0.341 2 0.170 4 0.341 4 0.341 3 0.256 3 0.256 4 0.3414 Small barriers to entry in furniture industry 0.072 2 0.143 3 0.215 3 0.215 4 0.286 2 0.143 3 0.215 3 0.215 3 0.215
5 The substitute products available are very diverse
0.084 2 0.168 4 0.336 1 0.084 4 0.336 3 0.252 3 0.252 4 0.336 4 0.336
6 Bargaining power of consumers is very high 0.098 3 0.293 4 0.391 3 0.293 4 0.391 3 0.293 4 0.391 4 0.391 2 0.195
OPPORTUNITIES
THREATS
Strategy 7
Strategy 8Strategy 1
Strategy 2
Strategy 3
Strategy 4
Strategy 5
Strategy 6
Appendix 8. Quantitative Strategic Planning Matrix (QSPM) of UD. Karangjati Furniture
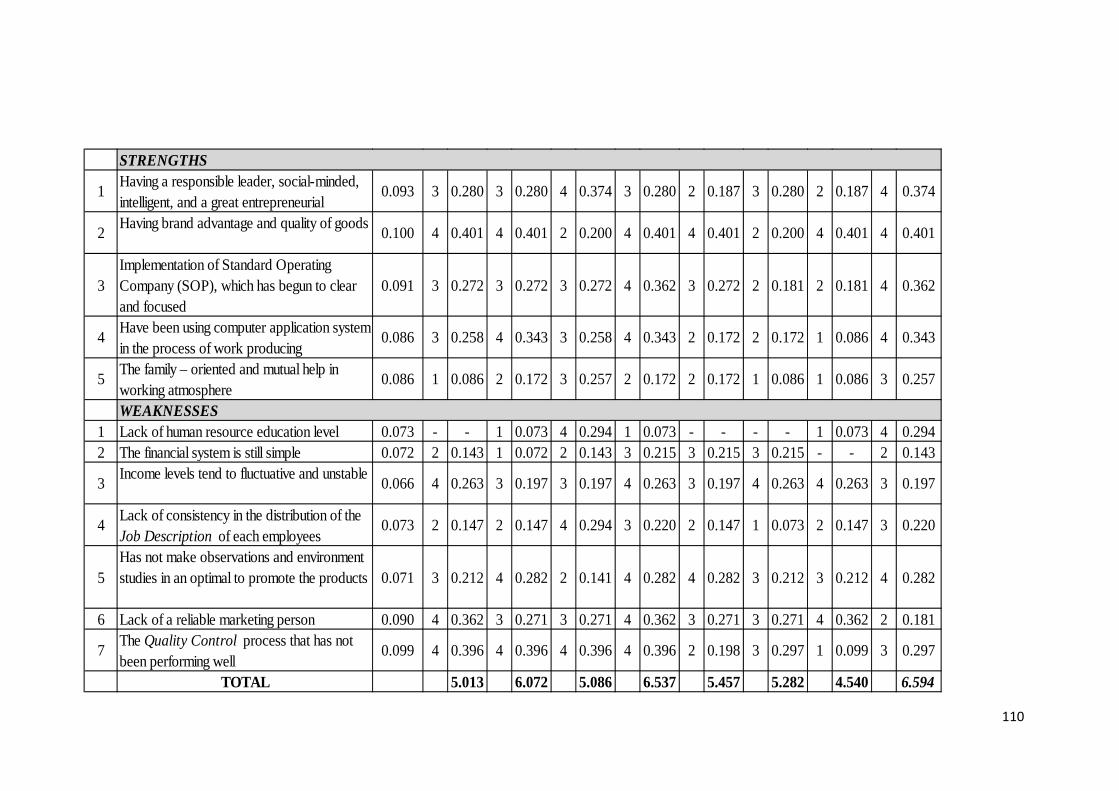
110
1 Having a responsible leader, social-minded, intelligent, and a great entrepreneurial
0.093 3 0.280 3 0.280 4 0.374 3 0.280 2 0.187 3 0.280 2 0.187 4 0.374
2 Having brand advantage and quality of goods 0.100 4 0.401 4 0.401 2 0.200 4 0.401 4 0.401 2 0.200 4 0.401 4 0.401
3Implementation of Standard Operating Company (SOP), which has begun to clear and focused
0.091 3 0.272 3 0.272 3 0.272 4 0.362 3 0.272 2 0.181 2 0.181 4 0.362
4 Have been using computer application system in the process of work producing
0.086 3 0.258 4 0.343 3 0.258 4 0.343 2 0.172 2 0.172 1 0.086 4 0.343
5 The family – oriented and mutual help in working atmosphere
0.086 1 0.086 2 0.172 3 0.257 2 0.172 2 0.172 1 0.086 1 0.086 3 0.257
1 Lack of human resource education level 0.073 - - 1 0.073 4 0.294 1 0.073 - - - - 1 0.073 4 0.2942 The financial system is still simple 0.072 2 0.143 1 0.072 2 0.143 3 0.215 3 0.215 3 0.215 - - 2 0.143
3 Income levels tend to fluctuative and unstable 0.066 4 0.263 3 0.197 3 0.197 4 0.263 3 0.197 4 0.263 4 0.263 3 0.197
4 Lack of consistency in the distribution of the Job Description of each employees
0.073 2 0.147 2 0.147 4 0.294 3 0.220 2 0.147 1 0.073 2 0.147 3 0.220
5Has not make observations and environment studies in an optimal to promote the products 0.071 3 0.212 4 0.282 2 0.141 4 0.282 4 0.282 3 0.212 3 0.212 4 0.282
6 Lack of a reliable marketing person 0.090 4 0.362 3 0.271 3 0.271 4 0.362 3 0.271 3 0.271 4 0.362 2 0.181
7 The Quality Control process that has not been performing well
0.099 4 0.396 4 0.396 4 0.396 4 0.396 2 0.198 3 0.297 1 0.099 3 0.297
TOTAL 5.013 6.072 5.086 6.537 5.457 5.282 4.540 6.594
STRENGTHS
WEAKNESSES
111
PRESIDENT UNIVERSITY
ANALISIS FORMULASI STRATEGI PENGEMBANGAN
USAHA PADA PERUSAHAAN PEMBUATAN FURNITURE
(Studi Kasus pada UD. Karangjati Furniture, Bekasi, Jawa Barat)
KUESIONER PENELITIAN
(Penentuan Bobot dan Rating Terhadap Faktor Strategis Internal dan Eksternal)
IDENTITAS RESPONDEN
Nama :
Pekerjaan / Jabatan :
Diharapkan bantuan Bapak/ Ibu agar dapat mengisi kuesioner ini secara lengkap, benar
dan objektif, karena kuesioner ini ditujukan sebagai bahan penelitian skripsi yang sangat
dibutuhkan data yang valid dan akurat sehingga dapat menjadi masukan untuk penulisan
tugas akhir (skripsi)
Peneliti:
Nirmala Tilami
Banking and Finance
014200900117
Appendix 9. Questionnaire of Weight and Rating Assessment of Internal and External Strategy Factors (in Bahasa)
112
1. PENILAIAN BOBOT FAKTOR STRATEGIS INTERNAL DAN EKSTERNAL
Tujuan:
Mendapatkan penilaian dari para responden mengenai faktor-faktor strategis internal dan
eksternal dengan cara pemberian bobot terhadap seberapa besar faktor strategis tersebut
dapat mempengaruhi atau membentuk keberhasilan perusahaan.
Petunjuk Umum:
1. Pengisian kuesioner dilakukan secara tertulis oleh responden
2. Jawaban merupakan pendapat pribadi dari masing-masing responden
3. Pengisian kuesioner dilakukan secara langsung oleh responden (tidak
menunda) untuk menghindari jawaban yang tidak konsisten
4. Responden berhak untuk menambahkan atau mengurangi hal-hal yang
tercantum dalam kuesioner ini, memiliki pandangan yang berbeda dengan
responden lainnya atau dengan peneliti. Hal ini dibenarkan jika dilengkapi
dengan alasan yang kuat.
Petunjuk Khusus:
1. Bobot mengindikasikan tingkat kepentingan relative dari setiap faktor
terhadap keberhasilan perusahaan. Penentuan bobot merupakan
pandangan masing-masing responden terhadap faktor strategis internal
dan eksternal perusahaan.
2. Untuk menentukan bobot setiap faktor digunakan keterangan skala
sebagai berikut:
Nilai 1: Jika indikator horizontal kurang penting daripada indikator
vertikal
Nilai 2: Jika indikator horizontal sama penting daripada indikator vertikal
Nilai 3: Jika indikator horizontal lebih penting daripada indikator vertikal
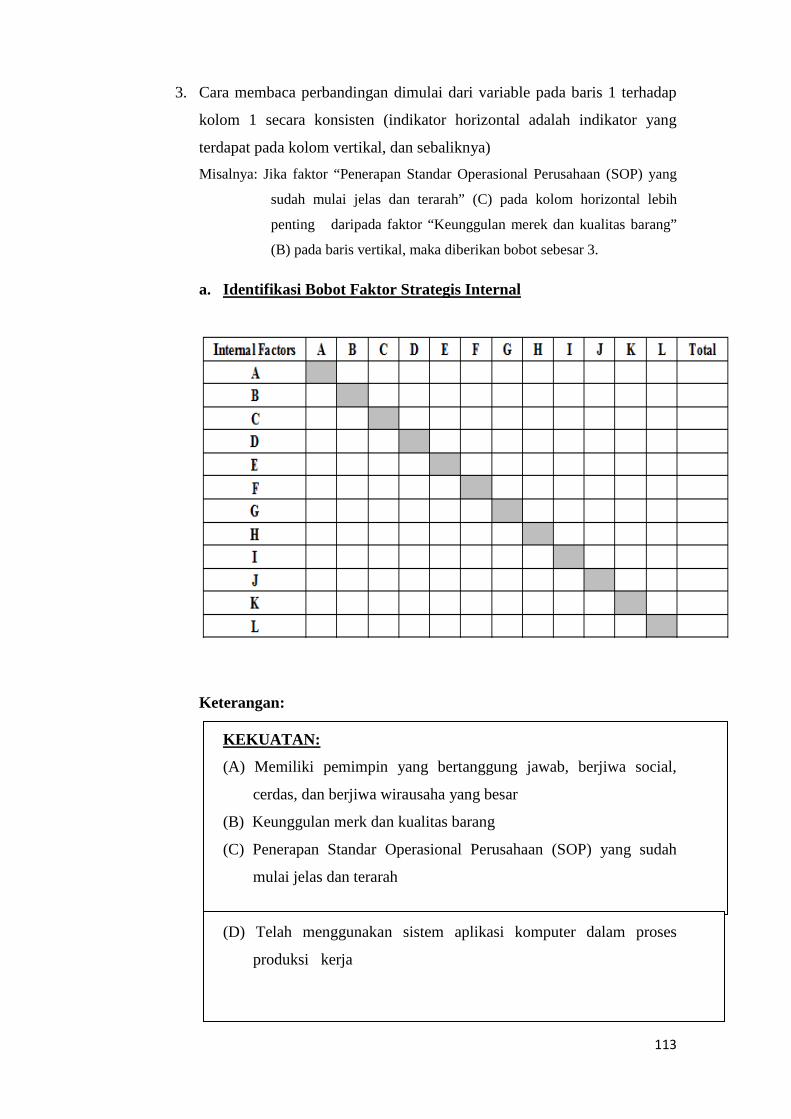
113
3. Cara membaca perbandingan dimulai dari variable pada baris 1 terhadap
kolom 1 secara konsisten (indikator horizontal adalah indikator yang
terdapat pada kolom vertikal, dan sebaliknya) Misalnya: Jika faktor “Penerapan Standar Operasional Perusahaan (SOP) yang
sudah mulai jelas dan terarah” (C) pada kolom horizontal lebih
penting daripada faktor “Keunggulan merek dan kualitas barang”
(B) pada baris vertikal, maka diberikan bobot sebesar 3.
a. Identifikasi Bobot Faktor Strategis Internal
Keterangan:
KEKUATAN:
(A) Memiliki pemimpin yang bertanggung jawab, berjiwa social,
cerdas, dan berjiwa wirausaha yang besar
(B) Keunggulan merk dan kualitas barang
(C) Penerapan Standar Operasional Perusahaan (SOP) yang sudah
mulai jelas dan terarah
(D) Telah menggunakan sistem aplikasi komputer dalam proses
produksi kerja
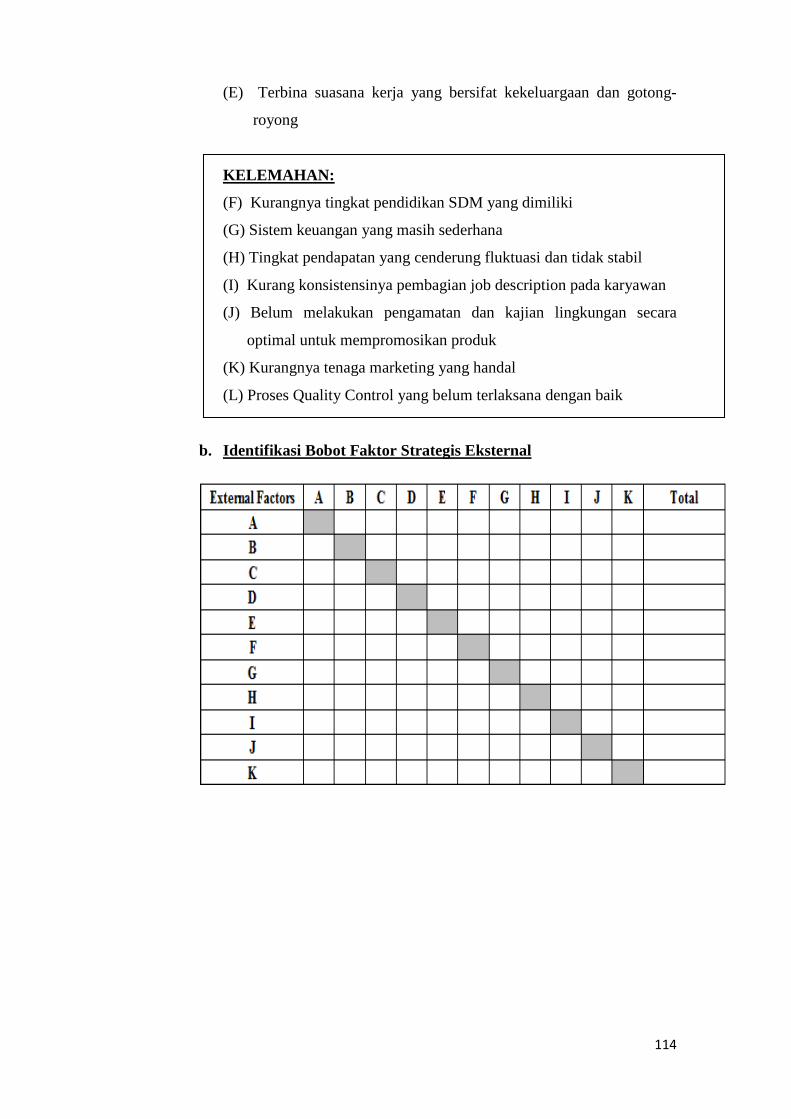
114
(E) Terbina suasana kerja yang bersifat kekeluargaan dan gotong-
royong
KELEMAHAN:
(F) Kurangnya tingkat pendidikan SDM yang dimiliki
(G) Sistem keuangan yang masih sederhana
(H) Tingkat pendapatan yang cenderung fluktuasi dan tidak stabil
(I) Kurang konsistensinya pembagian job description pada karyawan
(J) Belum melakukan pengamatan dan kajian lingkungan secara
optimal untuk mempromosikan produk
(K) Kurangnya tenaga marketing yang handal
(L) Proses Quality Control yang belum terlaksana dengan baik
b. Identifikasi Bobot Faktor Strategis Eksternal
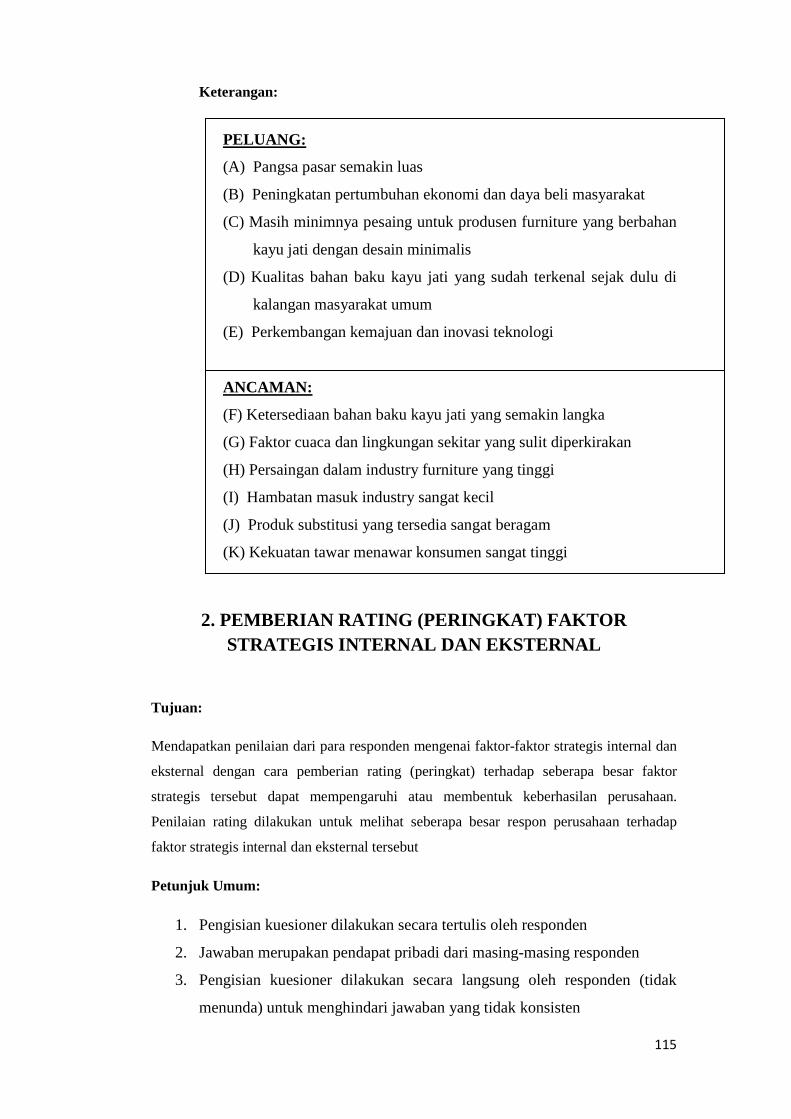
115
Keterangan:
PELUANG:
(A) Pangsa pasar semakin luas
(B) Peningkatan pertumbuhan ekonomi dan daya beli masyarakat
(C) Masih minimnya pesaing untuk produsen furniture yang berbahan
kayu jati dengan desain minimalis
(D) Kualitas bahan baku kayu jati yang sudah terkenal sejak dulu di
kalangan masyarakat umum
(E) Perkembangan kemajuan dan inovasi teknologi
ANCAMAN:
(F) Ketersediaan bahan baku kayu jati yang semakin langka
(G) Faktor cuaca dan lingkungan sekitar yang sulit diperkirakan
(H) Persaingan dalam industry furniture yang tinggi
(I) Hambatan masuk industry sangat kecil
(J) Produk substitusi yang tersedia sangat beragam
(K) Kekuatan tawar menawar konsumen sangat tinggi
2. PEMBERIAN RATING (PERINGKAT) FAKTOR STRATEGIS INTERNAL DAN EKSTERNAL
Tujuan:
Mendapatkan penilaian dari para responden mengenai faktor-faktor strategis internal dan
eksternal dengan cara pemberian rating (peringkat) terhadap seberapa besar faktor
strategis tersebut dapat mempengaruhi atau membentuk keberhasilan perusahaan.
Penilaian rating dilakukan untuk melihat seberapa besar respon perusahaan terhadap
faktor strategis internal dan eksternal tersebut
Petunjuk Umum:
1. Pengisian kuesioner dilakukan secara tertulis oleh responden
2. Jawaban merupakan pendapat pribadi dari masing-masing responden
3. Pengisian kuesioner dilakukan secara langsung oleh responden (tidak
menunda) untuk menghindari jawaban yang tidak konsisten
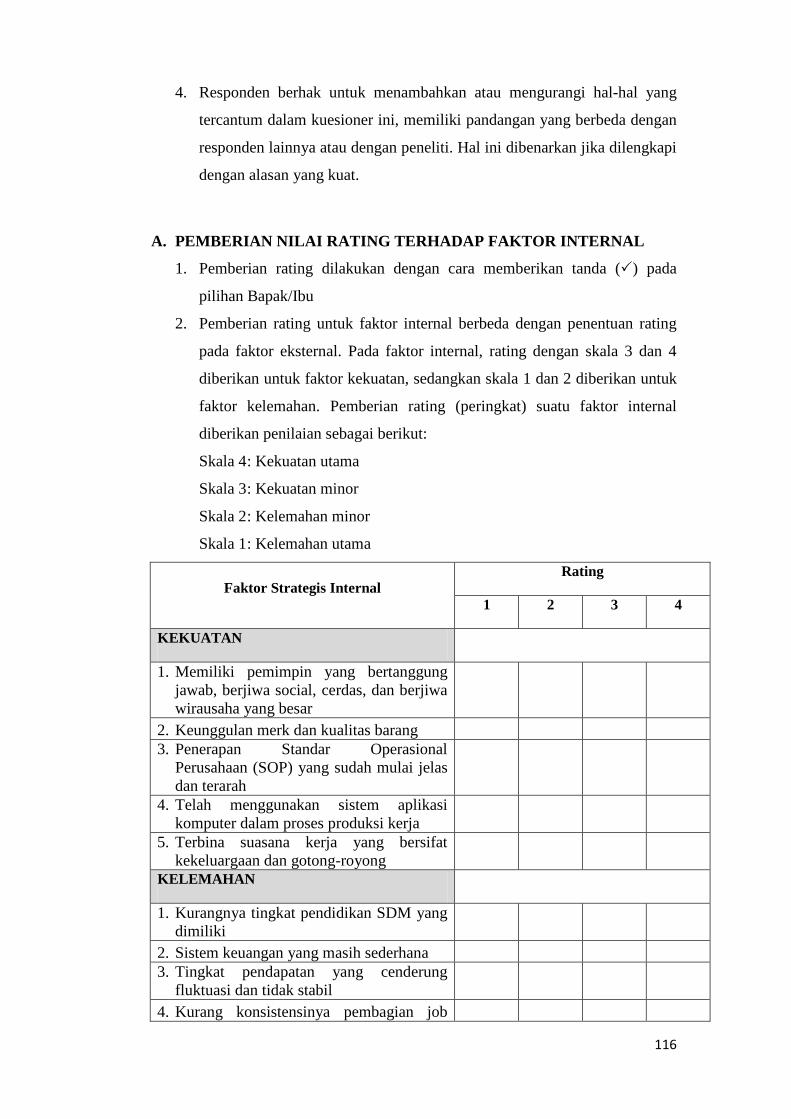
116
4. Responden berhak untuk menambahkan atau mengurangi hal-hal yang
tercantum dalam kuesioner ini, memiliki pandangan yang berbeda dengan
responden lainnya atau dengan peneliti. Hal ini dibenarkan jika dilengkapi
dengan alasan yang kuat.
A. PEMBERIAN NILAI RATING TERHADAP FAKTOR INTERNAL
1. Pemberian rating dilakukan dengan cara memberikan tanda () pada
pilihan Bapak/Ibu
2. Pemberian rating untuk faktor internal berbeda dengan penentuan rating
pada faktor eksternal. Pada faktor internal, rating dengan skala 3 dan 4
diberikan untuk faktor kekuatan, sedangkan skala 1 dan 2 diberikan untuk
faktor kelemahan. Pemberian rating (peringkat) suatu faktor internal
diberikan penilaian sebagai berikut:
Skala 4 : Kekuatan utama
Skala 3 : Kekuatan minor
Skala 2 : Kelemahan minor
Skala 1 : Kelemahan utama
Faktor Strategis Internal Rating
1 2 3 4
KEKUATAN
1. Memiliki pemimpin yang bertanggung jawab, berjiwa social, cerdas, dan berjiwa wirausaha yang besar
2. Keunggulan merk dan kualitas barang 3. Penerapan Standar Operasional
Perusahaan (SOP) yang sudah mulai jelas dan terarah
4. Telah menggunakan sistem aplikasi komputer dalam proses produksi kerja
5. Terbina suasana kerja yang bersifat kekeluargaan dan gotong-royong
KELEMAHAN
1. Kurangnya tingkat pendidikan SDM yang dimiliki
2. Sistem keuangan yang masih sederhana 3. Tingkat pendapatan yang cenderung
fluktuasi dan tidak stabil 4. Kurang konsistensinya pembagian job
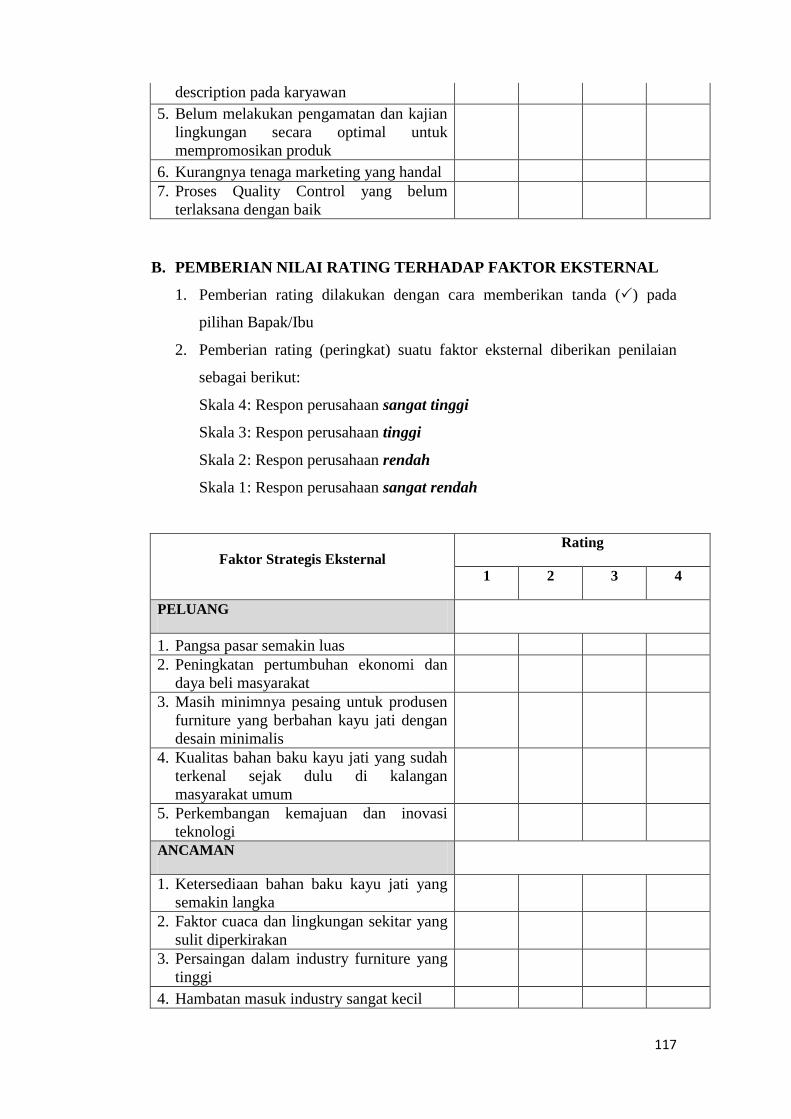
117
description pada karyawan 5. Belum melakukan pengamatan dan kajian
lingkungan secara optimal untuk mempromosikan produk
6. Kurangnya tenaga marketing yang handal 7. Proses Quality Control yang belum
terlaksana dengan baik
B. PEMBERIAN NILAI RATING TERHADAP FAKTOR EKSTERNAL
1. Pemberian rating dilakukan dengan cara memberikan tanda () pada
pilihan Bapak/Ibu
2. Pemberian rating (peringkat) suatu faktor eksternal diberikan penilaian
sebagai berikut:
Skala 4 : Respon perusahaan sangat tinggi
Skala 3 : Respon perusahaan tinggi
Skala 2 : Respon perusahaan rendah
Skala 1 : Respon perusahaan sangat rendah
Faktor Strategis Eksternal Rating
1 2 3 4
PELUANG
1. Pangsa pasar semakin luas 2. Peningkatan pertumbuhan ekonomi dan
daya beli masyarakat 3. Masih minimnya pesaing untuk produsen
furniture yang berbahan kayu jati dengan desain minimalis
4. Kualitas bahan baku kayu jati yang sudah terkenal sejak dulu di kalangan masyarakat umum
5. Perkembangan kemajuan dan inovasi teknologi
ANCAMAN
1. Ketersediaan bahan baku kayu jati yang semakin langka
2. Faktor cuaca dan lingkungan sekitar yang sulit diperkirakan
3. Persaingan dalam industry furniture yang tinggi
4. Hambatan masuk industry sangat kecil
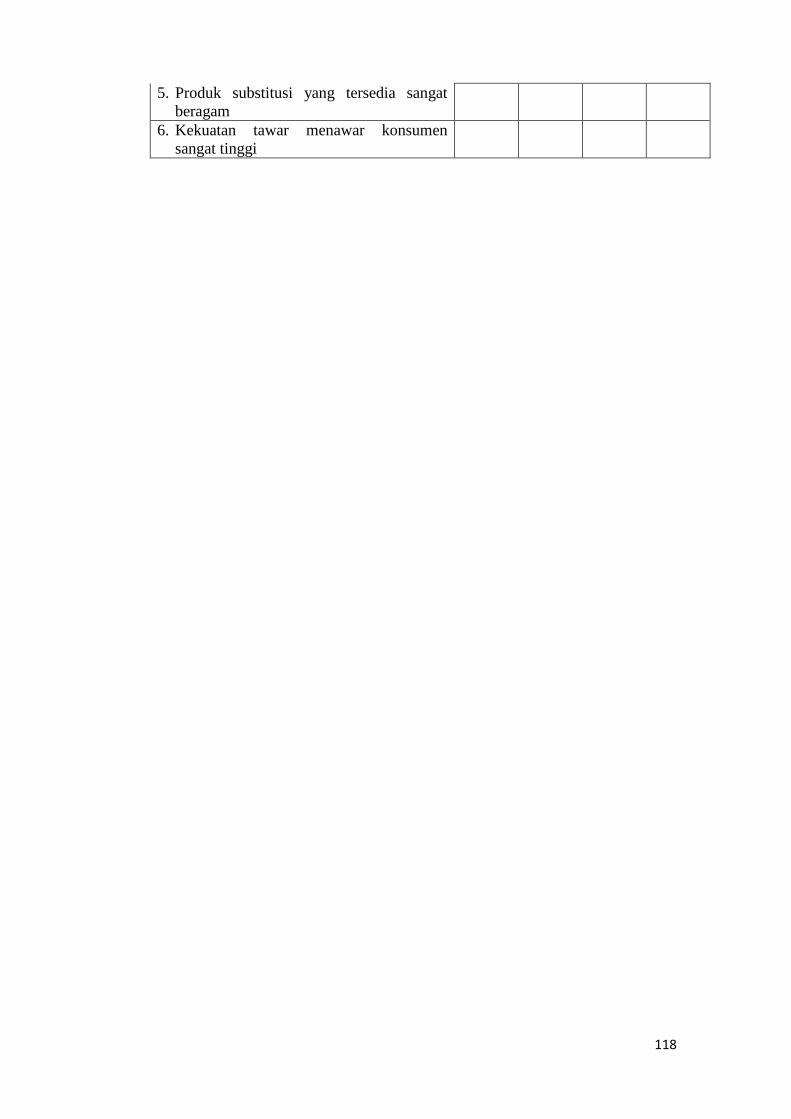
118
5. Produk substitusi yang tersedia sangat beragam
6. Kekuatan tawar menawar konsumen sangat tinggi
119
PRESIDENT UNIVERSITY
ANALISIS FORMULASI STRATEGI PENGEMBANGAN
USAHA PADA PERUSAHAAN PEMBUATAN FURNITURE
(Studi Kasus pada UD. Karangjati Furniture, Bekasi, Jawa Barat)
KUESIONER PENELITIAN
(Penentuan Attractiveness Score Terhadap Alternatif Strategi Pemasaran)
IDENTITAS RESPONDEN
Nama :
Pekerjaan / Jabatan :
Diharapkan bantuan Bapak/ Ibu agar dapat mengisi kuesioner ini secara lengkap, benar
dan objektif, karena kuesioner ini ditujukan sebagai bahan penelitian skripsi yang sangat
dibutuhkan data yang valid dan akurat sehingga dapat menjadi masukan untuk penulisan
tugas akhir (skripsi)
Peneliti:
Nirmala Tilami
Banking and Finance
014200900117
Appendix 10. Questionnaire of Attractiveness Score (AS) Assessment of Alternative Development Strategy (in Bahasa)
120
KUESIONER PENELITIAN PENENTUAN STRATEGI TERPILIH DENGAN QUANTITATIVE STRATEGIC
PLANNING MATRIX (QSPM)
Tujuan:
QSPM menentukan daya tarik relatif dari berbagai strategi berdasarkan seberapa jauh
faktor keberhasilan kunci internal dan eksternal dimanfaatkan atau diperbaiki. QSPM
secara objektif akan mengindikasikan alternative strategi mana yang terbaik untuk
dilakukan perusahaan.
Alternatif Strategi:
Strategi 1 : Menambah lokasi pemasaran yang sesuai dan strategis
Strategi 2 : Menambah inovasi dan desain produk yang lebih canggih dan modern
Strategi 3 : Selalu memberikan arahan dan motivasi kerja kepada para karyawannya
Strategi 4 : Meningkatkan layanan dan kualitas produk kepada pelanggan
Strategi 5 : Meningkatkan promosi
Strategi 6 : Mempertahankan strategi harga pasar untuk menghadapi persaingan
Strategi 7 : Menambah tenaga marketing baru
Strategi 8 : Melakukan evaluasi dan kajian kemampuan perusahaan dalam menghadapi
persaingan
Petunjuk Pengisian:
Tentukan Attractiveness Score (AS) yang mengindikasikan daya tarik relative dari setiap
alternative strategi yang telah ditentukan dengan cara mengamati setiap faktor eksternal
atau internal utama perusahaan. Dengan mengajukan pertanyaan “ Apakah faktor utama
ini mempengaruhi pilihan strategi yang dibuat?”. Jika jawabannya “ya” maka strategi
kemudian perlu diperbandingkan relative terhadap faktor utama tersebut dengan kriteria
sebagai berikut:
Nilai 1 : Alternative strategi tidak memiliki daya tarik terhadap faktor utama tertentu
Nilai 2 : Alternatif strategi memiliki daya tarik rendah terhadap faktor utama tertentu
Nilai 3 : Alternatif strategi memiliki daya tarik sedang terhadap faktor utama tertentu
Nilai 4 : Alternatif strategi memiliki daya tarik tinggi terhadap faktor utama tertentu
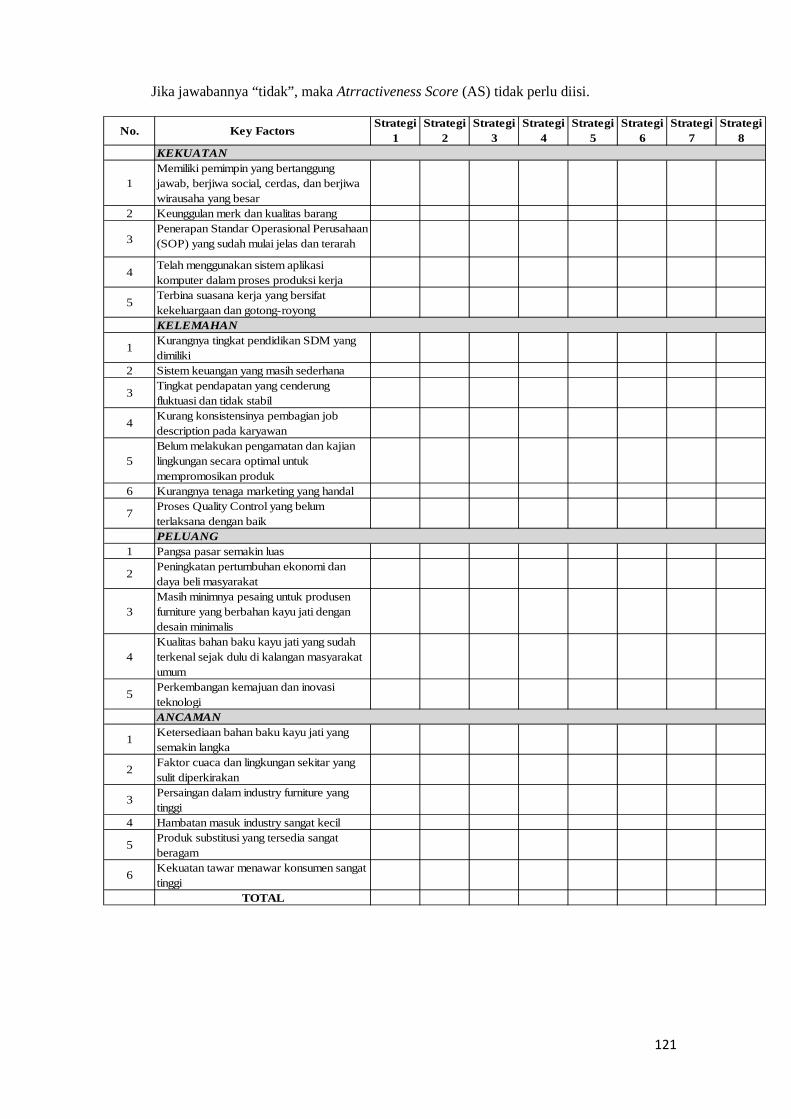
121
Jika jawabannya “tidak”, maka Atrractiveness Score (AS) tidak perlu diisi.
No. Key FactorsStrategi
1Strategi
2Strategi
3Strategi
4Strategi
5Strategi
6Strategi
7Strategi
8
1Memiliki pemimpin yang bertanggung jawab, berjiwa social, cerdas, dan berjiwa wirausaha yang besar
2 Keunggulan merk dan kualitas barang
3Penerapan Standar Operasional Perusahaan (SOP) yang sudah mulai jelas dan terarah
4 Telah menggunakan sistem aplikasi komputer dalam proses produksi kerja
5 Terbina suasana kerja yang bersifat kekeluargaan dan gotong-royong
1 Kurangnya tingkat pendidikan SDM yang dimiliki
2 Sistem keuangan yang masih sederhana
3 Tingkat pendapatan yang cenderung fluktuasi dan tidak stabil
4 Kurang konsistensinya pembagian job description pada karyawan
5Belum melakukan pengamatan dan kajian lingkungan secara optimal untuk mempromosikan produk
6 Kurangnya tenaga marketing yang handal
7 Proses Quality Control yang belum terlaksana dengan baik
1 Pangsa pasar semakin luas
2 Peningkatan pertumbuhan ekonomi dan daya beli masyarakat
3Masih minimnya pesaing untuk produsen furniture yang berbahan kayu jati dengan desain minimalis
4Kualitas bahan baku kayu jati yang sudah terkenal sejak dulu di kalangan masyarakat umum
5 Perkembangan kemajuan dan inovasi teknologi
1 Ketersediaan bahan baku kayu jati yang semakin langka
2 Faktor cuaca dan lingkungan sekitar yang sulit diperkirakan
3 Persaingan dalam industry furniture yang tinggi
4 Hambatan masuk industry sangat kecil
5 Produk substitusi yang tersedia sangat beragam
6 Kekuatan tawar menawar konsumen sangat tinggi
TOTAL
PELUANG
ANCAMAN
KEKUATAN
KELEMAHAN
122
PRESIDENT UNIVERSITY
Analysis of Business Development Strategy Formulation
in a Furniture Manufacturing Company
(A Case Study of UD. Karangjati Furniture, Bekasi, West Java)
RESEARCH QUESTIONNAIRE
(Determination of Weight and Rating Assessment to Internal and External Strategic Factors)
RESPONDENT IDENTITY
Name :
Job / Position :
Expected help from Mr. / Mrs. in order to fill this questionnaire in completely, true and
objective, because the questionnaire is intended as the material for research thesis which
much-needed valid and accurate data that can be input to the thesis writing
Researched by:
Nirmala Tilami
Banking and Finance
014200900117
Appendix 11. Questionnaire of Weight and Rating Assessment of Internal and External Strategy Factors (in English)
123
1. WEIGHTED ASSESSMENT OF INTERNAL AND EXTERNAL STRATEGIC FACTORS
Purpose:
Getting the respondents' assessment of the internal and external strategic factors to the
way how much weight given to these strategic factors may influence or shape the
company's success.
General Instructions:
1. Completion of the questionnaire is made in writing by the respondent.
2. The answer is the personal opinion of the individual respondent.
3. Completion of the questionnaire is done directly by the respondent (no
delay) to avoid inconsistent answers.
4. The respondent has the right to add or subtract the things listed in this
questionnaire, had a different view to another person or to researcher. This
is justified if it comes with good reason.
Specific Instructions:
1. The weight indicates the relative degree of importance from each factor to
the success of the company. The determination of the weight is from the
views of each respondent's to the internal and external strategic factors of
the company.
2. To determine the weight of each factor scale used this following
information:
Scale 1: If horizontal indicator is less important than vertical indicator
Scale 2: If horizontal indicator is equally important than vertical indicator
Scale 3: If horizontal indicator is more important than vertical indicator
3. How to read a variable in the comparison starts from row 1 to column 1
are consistent (horizontal indicators are indicators contained in a vertical
column, and conversely)
Example: If factor “Implementation of Standard Operating Company
(SOP), which has begun to clear and focused” (C) in vertical column is
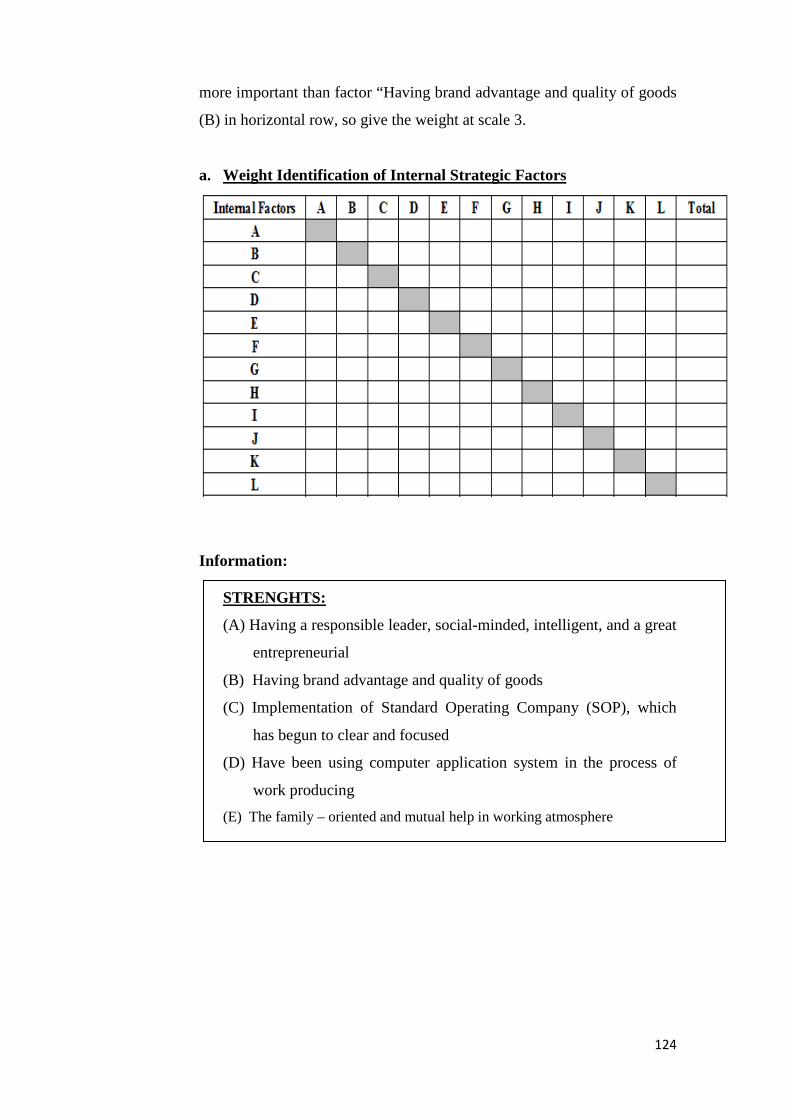
124
more important than factor “Having brand advantage and quality of goods
(B) in horizontal row, so give the weight at scale 3.
a. Weight Identification of Internal Strategic Factors
Information:
STRENGHTS:
(A) Having a responsible leader, social-minded, intelligent, and a great
entrepreneurial
(B) Having brand advantage and quality of goods
(C) Implementation of Standard Operating Company (SOP), which
has begun to clear and focused
(D) Have been using computer application system in the process of
work producing (E) The family – oriented and mutual help in working atmosphere
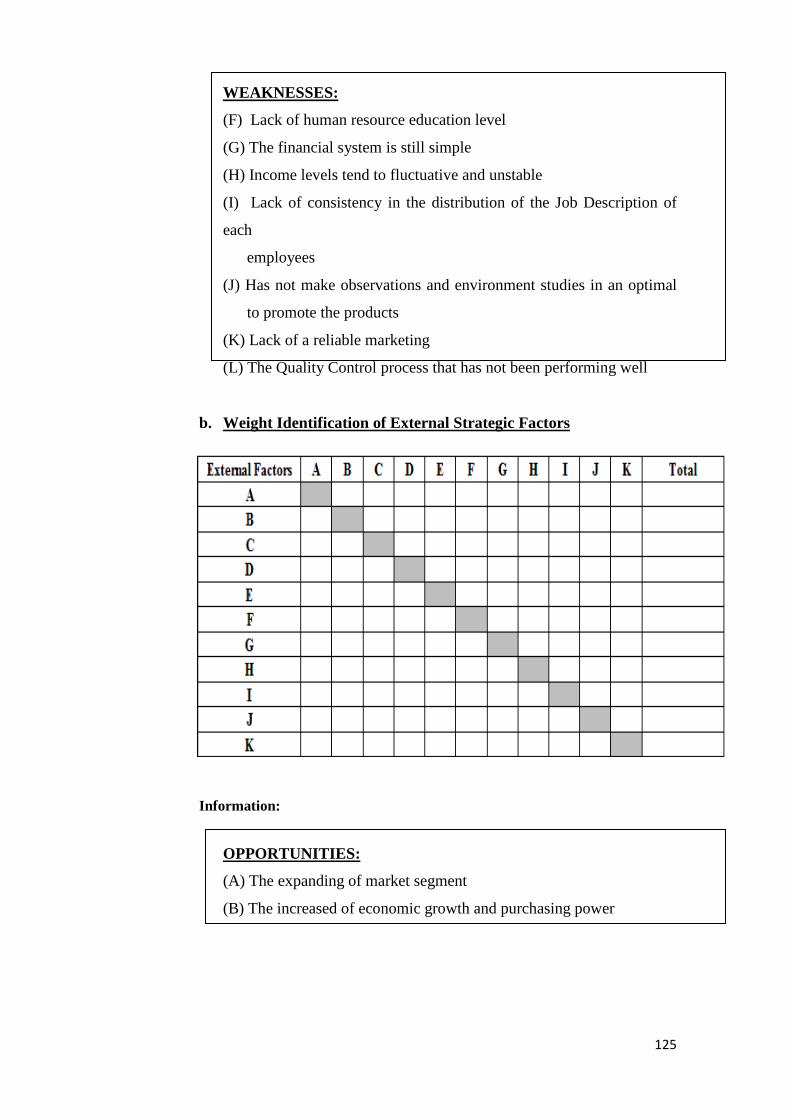
125
WEAKNESSES:
(F) Lack of human resource education level
(G) The financial system is still simple
(H) Income levels tend to fluctuative and unstable
(I) Lack of consistency in the distribution of the Job Description of
each
employees
(J) Has not make observations and environment studies in an optimal
to promote the products
(K) Lack of a reliable marketing
(L) The Quality Control process that has not been performing well
b. Weight Identification of External Strategic Factors
Information:
OPPORTUNITIES:
(A) The expanding of market segment
(B) The increased of economic growth and purchasing power
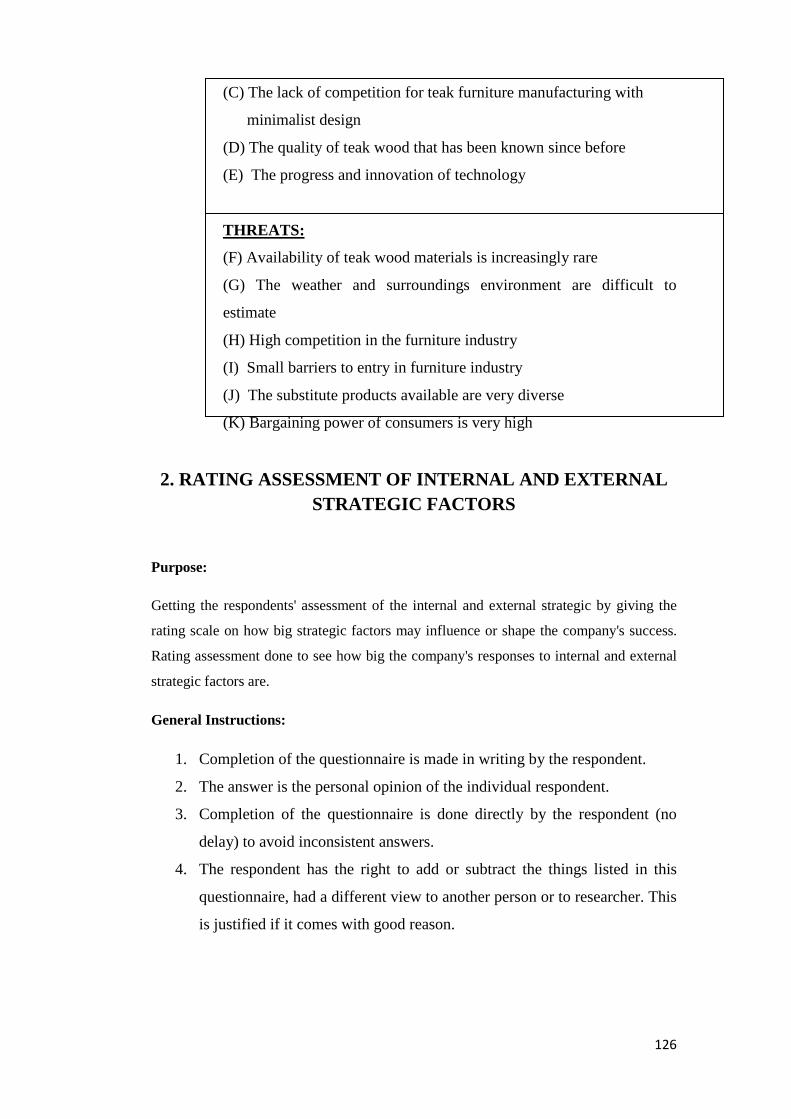
126
(C) The lack of competition for teak furniture manufacturing with
minimalist design
(D) The quality of teak wood that has been known since before
(E) The progress and innovation of technology
THREATS:
(F) Availability of teak wood materials is increasingly rare
(G) The weather and surroundings environment are difficult to
estimate
(H) High competition in the furniture industry
(I) Small barriers to entry in furniture industry
(J) The substitute products available are very diverse
(K) Bargaining power of consumers is very high
2. RATING ASSESSMENT OF INTERNAL AND EXTERNAL STRATEGIC FACTORS
Purpose:
Getting the respondents' assessment of the internal and external strategic by giving the
rating scale on how big strategic factors may influence or shape the company's success.
Rating assessment done to see how big the company's responses to internal and external
strategic factors are.
General Instructions:
1. Completion of the questionnaire is made in writing by the respondent.
2. The answer is the personal opinion of the individual respondent.
3. Completion of the questionnaire is done directly by the respondent (no
delay) to avoid inconsistent answers.
4. The respondent has the right to add or subtract the things listed in this
questionnaire, had a different view to another person or to researcher. This
is justified if it comes with good reason.
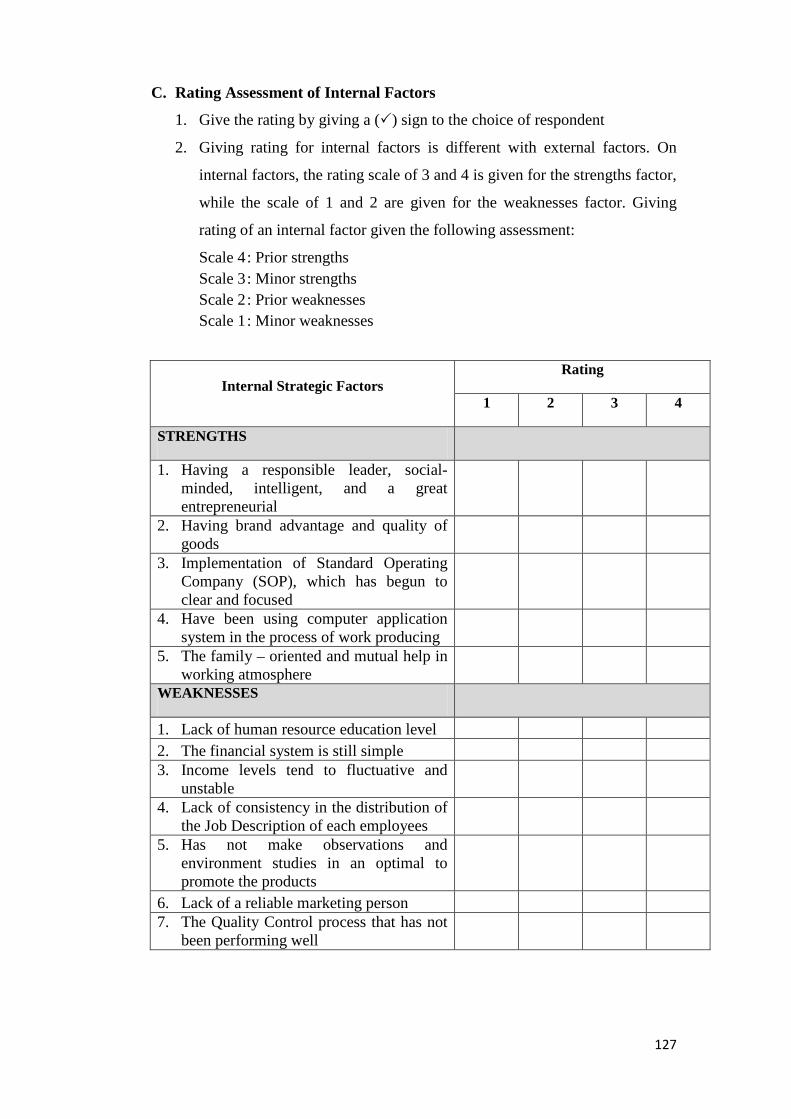
127
C. Rating Assessment of Internal Factors
1. Give the rating by giving a () sign to the choice of respondent
2. Giving rating for internal factors is different with external factors. On
internal factors, the rating scale of 3 and 4 is given for the strengths factor,
while the scale of 1 and 2 are given for the weaknesses factor. Giving
rating of an internal factor given the following assessment:
Scale 4 : Prior strengths Scale 3 : Minor strengths Scale 2 : Prior weaknesses Scale 1 : Minor weaknesses
Internal Strategic Factors Rating
1 2 3 4
STRENGTHS
1. Having a responsible leader, social-minded, intelligent, and a great entrepreneurial
2. Having brand advantage and quality of goods
3. Implementation of Standard Operating Company (SOP), which has begun to clear and focused
4. Have been using computer application system in the process of work producing
5. The family – oriented and mutual help in working atmosphere
WEAKNESSES
1. Lack of human resource education level 2. The financial system is still simple 3. Income levels tend to fluctuative and
unstable 4. Lack of consistency in the distribution of
the Job Description of each employees 5. Has not make observations and
environment studies in an optimal to promote the products
6. Lack of a reliable marketing person 7. The Quality Control process that has not
been performing well
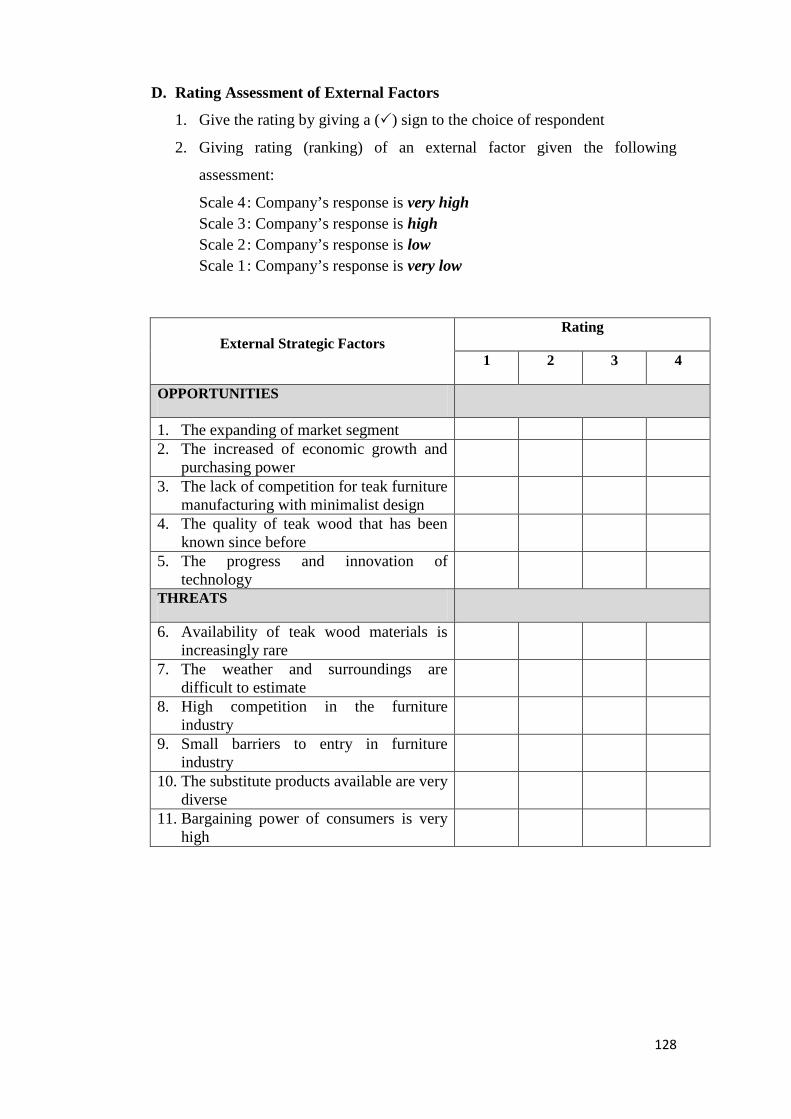
128
D. Rating Assessment of External Factors
1. Give the rating by giving a () sign to the choice of respondent
2. Giving rating (ranking) of an external factor given the following
assessment:
Scale 4 : Company’s response is very high Scale 3 : Company’s response is high Scale 2 : Company’s response is low Scale 1 : Company’s response is very low
External Strategic Factors Rating
1 2 3 4
OPPORTUNITIES
1. The expanding of market segment 2. The increased of economic growth and
purchasing power 3. The lack of competition for teak furniture
manufacturing with minimalist design 4. The quality of teak wood that has been
known since before 5. The progress and innovation of
technology THREATS
6. Availability of teak wood materials is increasingly rare
7. The weather and surroundings are difficult to estimate
8. High competition in the furniture industry
9. Small barriers to entry in furniture industry
10. The substitute products available are very diverse
11. Bargaining power of consumers is very high
129
PRESIDENT UNIVERSITY
Analysis of Business Development Strategy Formulation in a Furniture Manufacturing Company
(A Case Study of UD. Karangjati Furniture, Bekasi, West Java)
RESEARCH QUESTIONNAIRE
(Determination of Attractiveness Score to Internal and External Strategic Factors)
RESPONDENT IDENTITY
Name :
Job / Position :
Expected help from Mr. / Mrs. in order to fill this questionnaire in completely, true and
objective, because the questionnaire is intended as the material for research thesis which
much-needed valid and accurate data that can be input to the thesis writing
Researched by:
Nirmala Tilami
Banking and Finance
014200900117
Appendix 12. Questionnaire of Attractiveness Score (AS) Assessment of Alternative Development Strategy (in English)
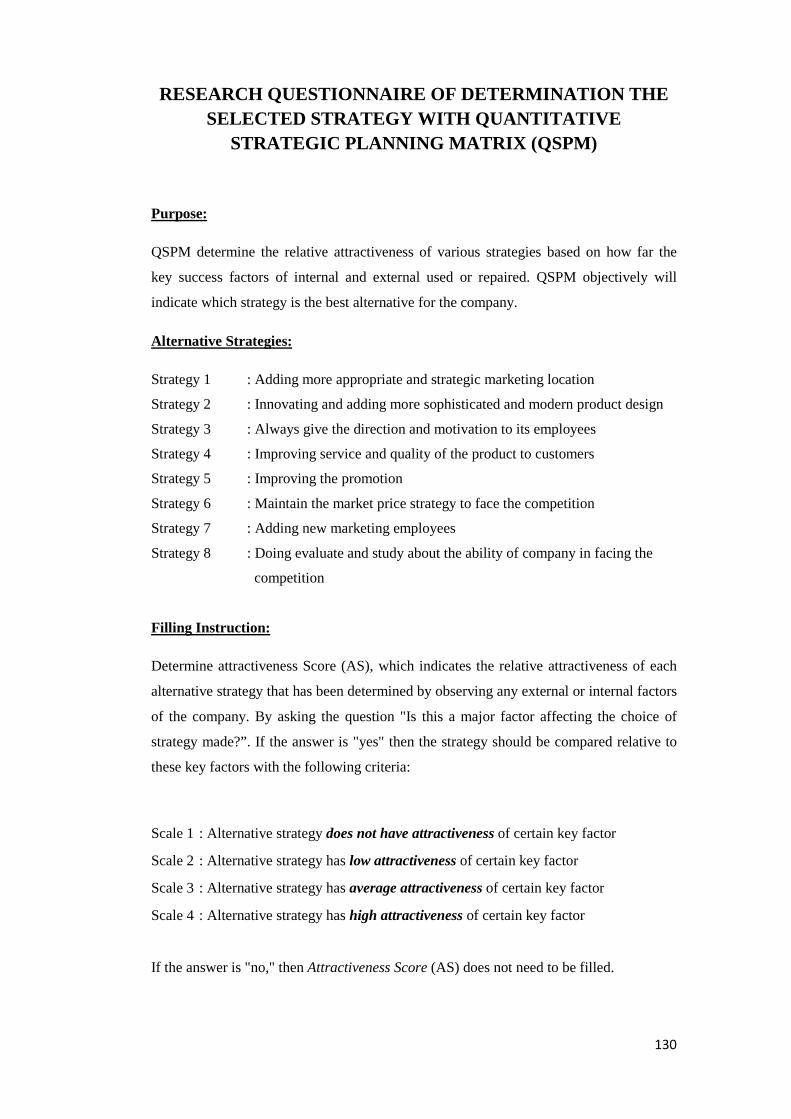
130
RESEARCH QUESTIONNAIRE OF DETERMINATION THE SELECTED STRATEGY WITH QUANTITATIVE
STRATEGIC PLANNING MATRIX (QSPM)
Purpose:
QSPM determine the relative attractiveness of various strategies based on how far the
key success factors of internal and external used or repaired. QSPM objectively will
indicate which strategy is the best alternative for the company.
Alternative Strategies:
Strategy 1 : Adding more appropriate and strategic marketing location
Strategy 2 : Innovating and adding more sophisticated and modern product design
Strategy 3 : Always give the direction and motivation to its employees
Strategy 4 : Improving service and quality of the product to customers
Strategy 5 : Improving the promotion
Strategy 6 : Maintain the market price strategy to face the competition
Strategy 7 : Adding new marketing employees
Strategy 8 : Doing evaluate and study about the ability of company in facing the
competition
Filling Instruction:
Determine attractiveness Score (AS), which indicates the relative attractiveness of each
alternative strategy that has been determined by observing any external or internal factors
of the company. By asking the question "Is this a major factor affecting the choice of
strategy made?”. If the answer is "yes" then the strategy should be compared relative to
these key factors with the following criteria:
Scale 1 : Alternative strategy does not have attractiveness of certain key factor
Scale 2 : Alternative strategy has low attractiveness of certain key factor
Scale 3 : Alternative strategy has average attractiveness of certain key factor
Scale 4 : Alternative strategy has high attractiveness of certain key factor
If the answer is "no," then Attractiveness Score (AS) does not need to be filled.
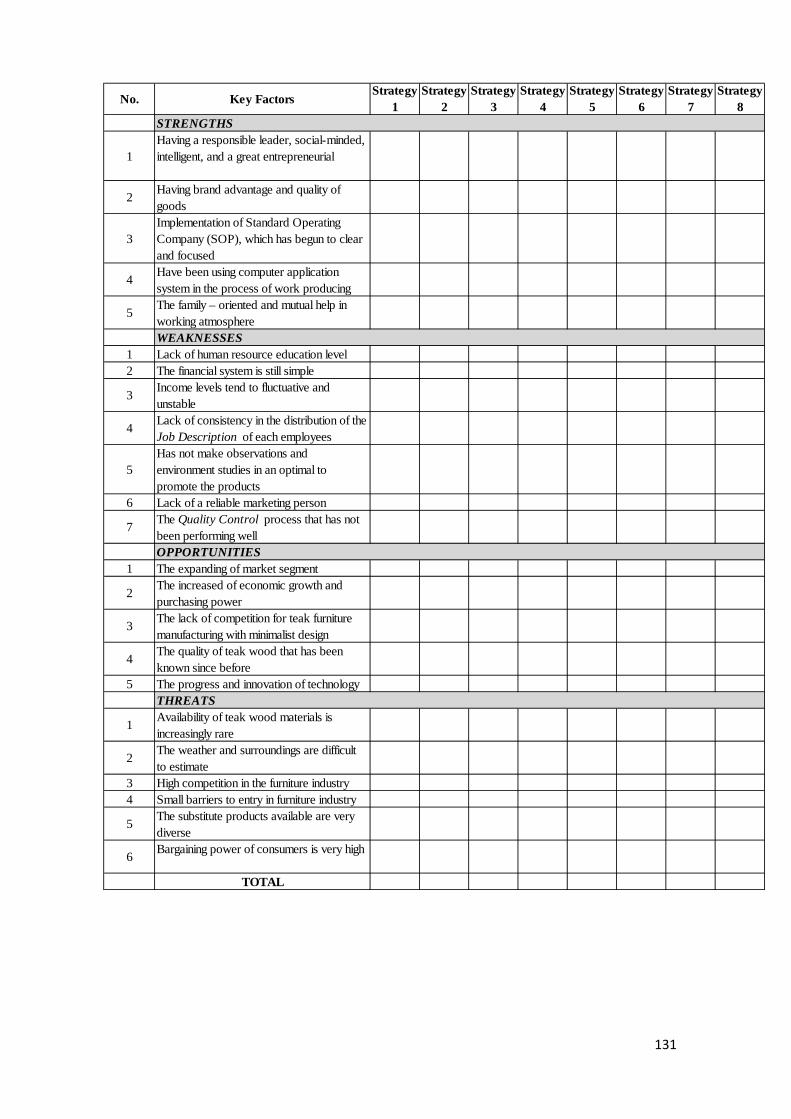
131
No. Key FactorsStrategy
1Strategy
2Strategy
3Strategy
4Strategy
5Strategy
6Strategy
7Strategy
8
1Having a responsible leader, social-minded, intelligent, and a great entrepreneurial
2 Having brand advantage and quality of goods
3Implementation of Standard Operating Company (SOP), which has begun to clear and focused
4 Have been using computer application system in the process of work producing
5 The family – oriented and mutual help in working atmosphere
1 Lack of human resource education level2 The financial system is still simple
3 Income levels tend to fluctuative and unstable
4 Lack of consistency in the distribution of the Job Description of each employees
5Has not make observations and environment studies in an optimal to promote the products
6 Lack of a reliable marketing person
7 The Quality Control process that has not been performing well
1 The expanding of market segment
2 The increased of economic growth and purchasing power
3 The lack of competition for teak furniture manufacturing with minimalist design
4 The quality of teak wood that has been known since before
5 The progress and innovation of technology
1 Availability of teak wood materials is increasingly rare
2 The weather and surroundings are difficult to estimate
3 High competition in the furniture industry4 Small barriers to entry in furniture industry
5 The substitute products available are very diverse
6 Bargaining power of consumers is very high
TOTAL
WEAKNESSES
OPPORTUNITIES
THREATS
STRENGTHS