Embed Size (px)
Citation preview
Analysis of Biceps Brachii Muscles in Dynamic
Contraction Using sEMG Signals and
Multifractal DMA Algorithm
K. Marri and R. Swaminathan Non-Invasive Imaging and Diagnostics Laboratory, Biomedical Engineering Group, Department of Applied Mechanics,
Indian Institute of Technology Madras, Chennai, India 600036
Email ID: [email protected], [email protected]
Abstract—In this work, an attempt has been made to
analyze surface electromyography (sEMG) signals in
dynamic contraction using multifractal detrending moving
average algorithm (MFDMA). The signals are recorded
from biceps brachii muscles of twenty two healthy
participants using a standard experimental protocol. The
recorded sEMG signals are pre-processed and normalized
by dividing the time axis into six equal segments. The first
segment and sixth segment are considered as nonfatigue and
fatigue conditions for analysis. The signals are subjected to
MFDMA and verified to test multifractal properties of
biceps brachii muscles using scaling exponent, generalized
Hurst exponent and multifractal spectrum in both
nonfatigue and fatigue conditions. Each multifractal
spectrum is characterized by calculating three features
namely peak exponent (PEV), degree of multifractality
(DOM) and mean multifractal spectral exponent (MSE).
The variation of multifractal spectral features in fatigue
conditions are analyzed using ANOVA and Tukey test. The
results of scaling exponent function and generalized Hurst
exponent function indicated multifractal characteristics for
sEMG signals in dynamic contractions. DOM increased
from 0.56 to 0.96 and MSE increased from 0.54 to 0.75 in
nonfatigue and fatigue conditions respectively. It appears
that this method is useful in analyzing fatigue and
nonfatigue conditions associated with muscle mechanics
using non-invasive sEMG recordings. This study can be
useful in field of clinical studies, rehabilitation, prosthetics
control and sports medicine.
Index Terms—surface EMG, biceps brachii, multifractal,
detrending moving average algorithm, muscle fatigue,
dynamic contractions
I. INTRODUCTION
Biceps brachii muscles are commonly known as biceps
and located in the upper arm of human body. The biceps
run along the anterior side of humerus bone from the
shoulder joint to elbow joint. This muscle is normally a
two headed muscle and has a spindle shape. The two
heads of the biceps muscle vary in length and help in
various functioning of upper limbs. The biceps muscles
are responsible for supination of proximal radius (forearm
action for using key), flexion of humerus joint (dumbbell
Manuscript received August 2, 2014; revised November 21, 2014.
curl exercise) and stabilizing the shoulder joint movement.
The muscles in human body are composed of muscle
fibers that are innervated by alpha motor neuron. The
alpha motor neuron together with muscle fibers is known
as motor unit. Muscle tissue is broadly grouped into
slow-twitch and fast-twitch muscle fibers. The slow-
twitch fibers have higher endurance, higher resistance to
fatigue and lower ability to generate rapid force. The fast-
twitch fibers have lower endurance, lower resistance to
fatigue but higher ability to generate rapid force. The
biceps muscle has about 46% of slow-twitch fibers and
54% of fast-twitch fibers [1]. In the case of heavy intense
repetitive action such as dumbbell curl exercise, muscle
fibers are involved in contraction process for sustaining
force generation. Prolonged repetitive action can lead to
muscle fatigue [2]. Surface electromyography (sEMG) is
a non-invasive method of recording electrical activity of
muscles [3]. The intense variation of sEMG signals
during dynamic contraction increases the complexity of
signal analysis due to varying recruitment levels of slow-
twitch and fast-twitch muscle fibers, nonlinear motor unit
recruitment and synchronization of motor units [4]. The
sEMG signals are analyzed using time [5], frequency [6],
[7] and time-frequency domain techniques [8]. The
statistical property of signals are assumed to be constant
in traditional methods and muscular system is considered
to be linear [9], [10]. In time and frequency domain
analysis, the physiological signals are also considered
linear. The time-frequency domain techniques address the
nonstationary aspect of the signal but still considers the
system to be linear [10]. The characteristics of nonlinear
systems can be estimated better with measures such as
entropies, correlation and fractal dimension [11].
The fractal system is represented by a scale invariant
non integer parameter known as fractal dimension [12].
There is a growing acceptance of physiological signals,
generated by complex self-similar system, may have
fractal structure [13], [14]. A fractal refers to a signal that
can be split into parts that is a reduced-copy of whole
[15]. There are two types of fractal behavior in most of
time series, namely monofractal and multifractal.
Monofractals are homogenous and characterized by
single scaling property for the entire signal. Multifractal
signals are characterized by numerous scaling properties
79doi: 10.12720/ijsps.4.1.79-85
International Journal of Signal Processing Systems Vol. 4, No. 1, February 2016
©2016 Int. J. Sig. Process. Syst.
for the entire signal. Multifractal signals are intrinsically
more complex and inhomogeneous as compared to
monofractal signals [15].
The detrended fluctuation analysis (DFA) was
proposed for analyzing DNA sequences that was suitable
for monofractal scaling properties [16]. Based on a
generalization of DFA, the multifractal detrended
fluctuation analysis (MFDFA) is introduced for the
multifractal characterization of non-stationary time series
[15]. Multifractal analysis using moving average was first
proposed to estimate Hurst exponent of self-affinity
signals [17]. The detrending moving average (DMA)
method was later developed considering second order
difference between original signal and moving average
function [18]. The DMA method was extended to
multifractal detrending moving average (MFDMA) to
analyze multifractal time series and surfaces [19]. Muscle
fatigue analysis in isometric contraction was reported for
biceps brachii muscle using fractal analysis, and it was
found that fractal area increased during fatigue condition
[20]. The detrended fluctuation analysis method was
proposed for tracking muscle fatigue using Hurst
exponent over time [21]. The analysis of sEMG signal for
muscle fatigue is not analyzed using MFDMA in
available literature for biceps brachii muscle.
The aim of the present study was to analyze dynamic
sEMG signals in nonfatigue and fatigue conditions.
sEMG signals are recorded from biceps brachii muscles
while performing standard experimental protocol and
subjected to nonlinear analysis using multifractal
detrending moving average techniques. Two standard
features were extracted from multifractal spectrum. A
new feature is proposed in this study and compared with
standard features. These three features are further
analyzed in nonfatigue and fatigue condition for
understanding the sEMG signal characteristics.
II. METHODOLOGY
A. Subjects
Gender=18 Males and 2 Females} without any history of
neuromuscular skeleton disorder participated in this study.
The subjects were asked to take complete rest for at least
12 hours before the experiment. A written consent form
approved by the institute review board is taken from each
participant before the start of exercise. The participants
were given training without load before conducting the
experiment. Each participant is requested to perform full
dumbbell curl exercise in upright position with forearm in
supine position and using their dominant hand with 6
kilograms dumbbell. The participants are asked to
maintain speed of curl at their comfortable pace. Signals
are acquired for the entire course of exercise till
exhaustion. No encouragement was provided during the
exercise to avoid any potential confounding effect on
exercise performance. The experiment was stopped when
the participant was unable to lift the dumbbell and
exhausted.
B. Skin Preparation and Instrumentation
Ag-AgCl disc-type disposable surface electrodes, 1 cm
diameter, were placed on the belly region of triceps
brachii muscle. The skin was cleaned with alcohol and
cotton prior to the experiment. A differential electrode
configuration is used, with an inter-electrode distance of
3cm [5]. The reference electrode is placed at the proximal
end of the elbow. The subjects stood on a wooden
platform to electrically isolate them from ground. The
electrodes were placed on the belly region of triceps
brachii as per SENIAM standards in bipolar configuration.
The reference electrode was placed on elbow region. The
sampling frequency was set as 10KHz and sampled using
Biopac MP36 system (Gain 1000; 24 bit ADC; CMRR
110db). The signals are filtered using band-pass filter (10
Hz to 400Hz) after removing 50Hz power signal noise.
To ease the computation, the signals are down sampled
offline at 1000 samples per second for further analysis.
C. Multifractal Detrending Moving Average Algorithm
Multifractal detrending moving average is designed for
analyzing multifractal time series [19].
Step 1: Let the sEMG time series be represented as
)(tx , where t = 1, 2, 3,…., N. Then the cumulative sums
for the sequence is represented as
t
i
tixty1
N 3... , 2 1, , )()( (1)
Step 2: Next, the moving average function is computed
in a moving window, and represented as
)]1)(1[(
])1[(
, )( 1
)(~
n
nk
ktyn
ty (2)
where n is window size, [ )1)(1( n ] is largest integer
not greater than x , and [ )1( n ] is smallest integer not
smaller than x , and is position parameter with value
varying in between 0 and 1. If = 0, 0.5 and 1 then it
corresponds to backward moving average (BMA),
centered moving average (CMA) and forward moving
average (FMA) respectively. The moving average
function is calculated over past values of 1n in the case
of BMA, and future values of 1n in the case of FMA.
Step 3: Detrend the signal series by removing )(~ iy
from )(iy to get residual sequence )(i using the below
equation
)(i = )(~ iy - )(iy (3)
where )1()1( nNinn
Step 4: The residual series is divided into M disjoint
segments with same size n where 1n
NM . Each
segment can be represented as v such that
)()( iltv for ni 1 and nvl )1( . The root-
mean square function )(nFv with segment of size n can
be calculated as
80
Twenty two normal healthy volunteers {Age=21.04
(±0.84); Weight=68.22 (±12.36); Height=170.99 (±6.42);
International Journal of Signal Processing Systems Vol. 4, No. 1, February 2016
©2016 Int. J. Sig. Process. Syst.
n
ivv i
nnF
1
22)(
1)( (4)
Step 5: The q th order overall fluctuation function is
determined as follows
qM
v
qvq nF
MnF
1
1
)(1
)(
(5)
For q is a real value and not equal to zero. When q = 0,
then the fluctuation function is given according to
L’Hospital rule.
Step 6: The power-law function can be determined by
varying the segment size n for fluctuation function as
)(~)(
qhq nnF (6)
The multifractal scaling exponent is given as
Dqqhq )()( (7)
where D is the fractal dimension of geometric support of
multifractal measure [15]. The singularity strength
function and multifractal spectrum are obtained using
Legendre transform [22], and represented as
dq
qdq
)()(
(8)
)()( qqqf (9)
D. Data Analysis and Flow Chart
The three features are measure from the multifractal
spectrum.
Peak Exponent (PEV) is the value of exponent
when spectrum is at peak or PEV = when
1)( qf
Degree of multifractality (DOM) is the distance
between maximum exponent and minimum
exponent in multifractal spectrum, DOM = max -
min
A new feature, mean multifractal spectral
exponent, is computed from the multifractal
spectrum based on power spectral analysis feature,
mean power frequency. This feature uses both
singularity function and exponent, and represented
as weighted average
MSE =
)(
)().(
qf
qqf
E. Statistical Analysis
The experimental analysis of four multifractal features
are expressed as mean (standard deviation), and
compared using one-way analysis of variance (ANOVA)
and Tukey’s post hoc test for nonfatigue and fatigue
conditions. All analyses were carried out using OriginPro
8.5 software package. The differences were considered
significant at p<0.05 and highly significant at p<0.005.
III. RESULTS AND DISCUSSION
A. Surface Electromyography Signals
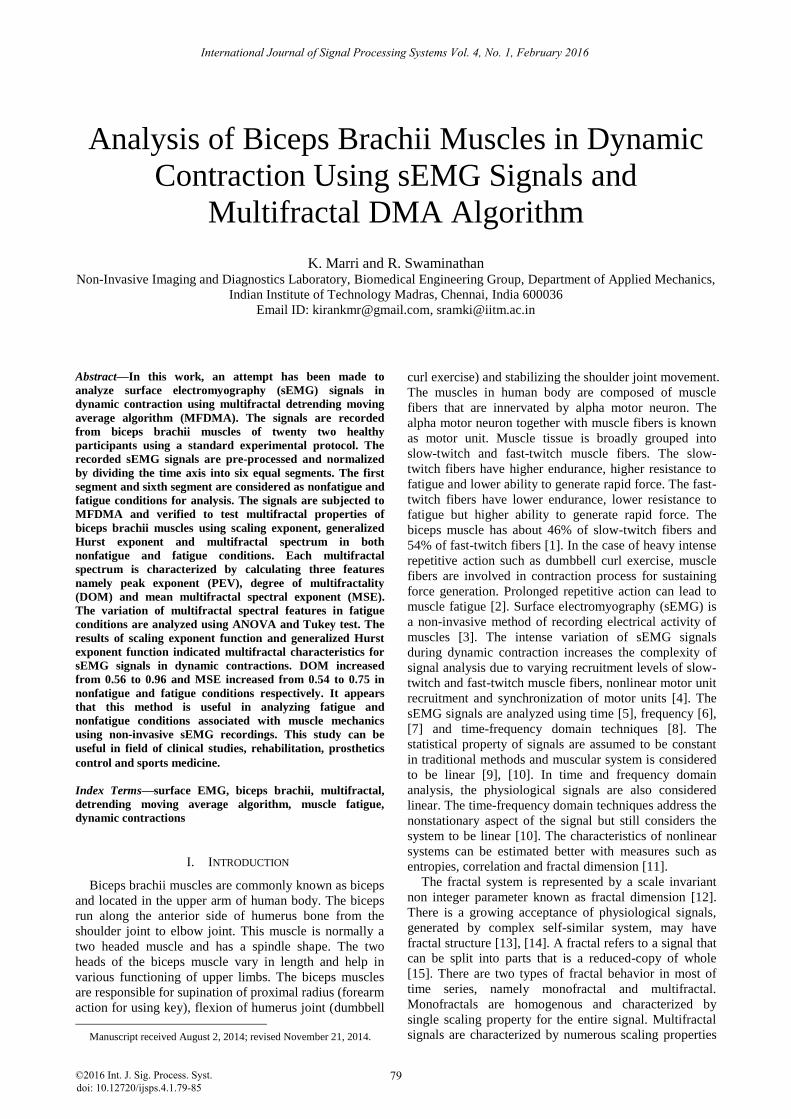
The representative sEMG signals recorded from biceps
brachii muscles during dynamic contractions for three
different participants are shown in Fig. 1. There is a
steady burst of sEMG signals with increase and decrease
of strength. These burst represents the flexion and
extension of each curl. The number of curls, duration of
curl and speed of curl action varied across the participants.
The amplitude of sEMG signals ranged from ±1.5 volts in
Subject A to ±5 volts in Subject B and C. This variation
is based on individual’s performance, anthropometry data
and muscle characteristics. The sEMG signals are
recorded until task to failure. The task to failure in this
dynamic contraction protocol varied from 19 seconds to
93 seconds.
Figure 1. sEMG signals of biceps brachii muscle from three subjects (A, B and C)
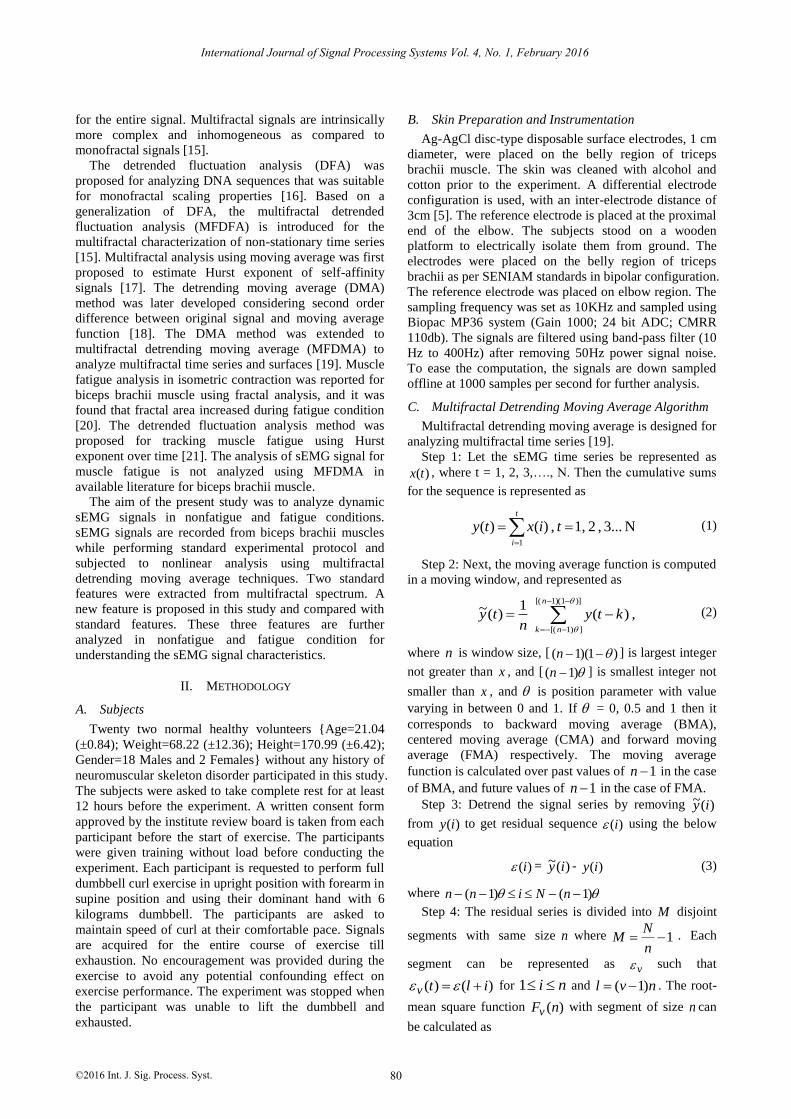
Figure 2. sEMG signal of subject B divided into six equal segments with zone 1 and zone 6
81
International Journal of Signal Processing Systems Vol. 4, No. 1, February 2016
©2016 Int. J. Sig. Process. Syst.
B. Non-Fatigue and Fatigue Conditions of sEMG
The task to failure in this study had a wide spread from
a low of 19.3 seconds to high of 93.8 seconds. The task to
failure is the instance where the subject is unable to
perform the experiment and stops the curl exercise. This
is due to onset of fatigue and the muscles in the region of
upper arm are unable to continue generation of forces. In
order to analyze the fatigue condition in a varied task to
failure set of data, the sEMG signals are divided into
different segments of equal length. The study in earlier
work was done with three segments [23] and six equal
segments [24]. Increasing the number of segments can
help in quantifying the sEMG characteristics in spatial
domain but it also increases the computational
complexity. Hence, in this study, the sEMG signal was
divided into six equal segments (Zone 1 to Zone 6). This
is represented in Fig. 2 for subject B. The first segment
(Zone1) is taken as nonfatigue condition and sixth
segment (Zone 6) is taken as fatigue condition. The
nonfatigue and fatigue signals for subject B is shown in
Fig. 2. The signals in fatigue condition are clearly
showing increased amplitude, but the pattern varied for
different subjects. It is also observed that there is also a
reduction in number of curls during fatigue zone, in some
cases, due to inability of the muscles to sustain force. The
segmented zones varied from 3.2 seconds to 15.64
seconds. The nonfatigue and fatigue segments are
subjected to multifractal detrending moving average
algorithm for further analysis.
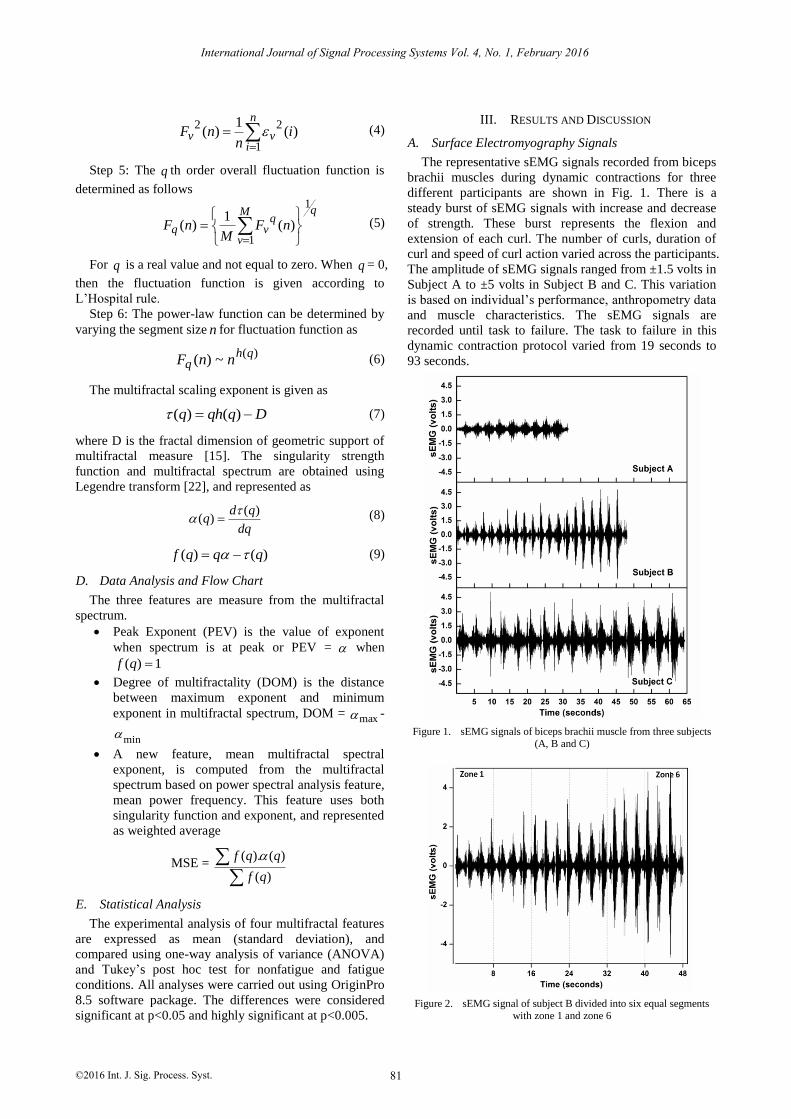
Figure 3. Scaling exponent function variations for nonfatigue and fatigue conditions of sEMG signal in Fig. 2
C. Multifractal Analysis
The scaling exponent τ (q) for sEMG signals during
dynamic contraction for nonfatigue and fatigue
conditions are represented in Fig. 3. In both the cases, the
scaling exponent function is appearing to be nonlinearly
varying for negative and positive values of order of
fluctuation (q). The linear variation of scaling exponent is
an indication of mono fractal nature of time series. Based
on this nonlinear variation of scaling exponent for both
nonfatigue and fatigue series, the sEMG signal may be
considered having multifractal behavior. For nonfatigue
conditions, the scaling exponent ranges from -8 to 1, as
compared to -13 to -2 for fatigue conditions. The larger
variation in scaling exponent range of nonfatigue may be
due larger components of higher amplitude and increase
in lower frequency components due to motor unit action
potential synchronization. This may result in increase of
higher amplitude fluctuations and lower amplitude
fluctuations during fatigue conditions. The negative order
of fluctuations is found to have distinctly different values
(-13 and -8) for fatigue and nonfatigue condition. This
may be due to increase of smaller amplitude fluctuations
in synchronization during fatigue than in nonfatigue
condition. This may contribute in shifting the scaling
exponent function to higher negative values during
negative order of fluctuations in fatigue conditions.
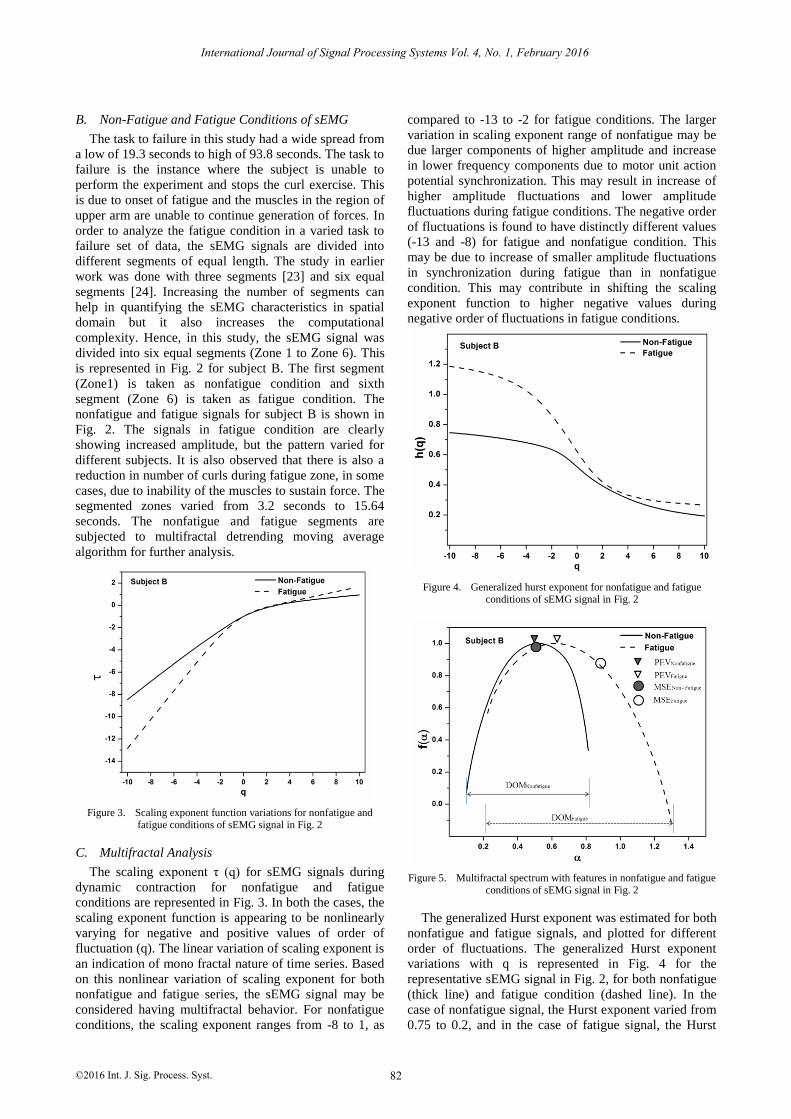
Figure 4. Generalized hurst exponent for nonfatigue and fatigue conditions of sEMG signal in Fig. 2
Figure 5. Multifractal spectrum with features in nonfatigue and fatigue conditions of sEMG signal in Fig. 2
The generalized Hurst exponent was estimated for both
nonfatigue and fatigue signals, and plotted for different
order of fluctuations. The generalized Hurst exponent
variations with q is represented in Fig. 4 for the
representative sEMG signal in Fig. 2, for both nonfatigue
(thick line) and fatigue condition (dashed line). In the
case of nonfatigue signal, the Hurst exponent varied from
0.75 to 0.2, and in the case of fatigue signal, the Hurst
82
International Journal of Signal Processing Systems Vol. 4, No. 1, February 2016
©2016 Int. J. Sig. Process. Syst.
exponent varied from 1.2 to 0.3. It is observed from Fig.
4 that the variation of fatigue signal is more prominent
than nonfatigue signal. This may be due to increase in
different type of fluctuations, comprising of high
amplitude and low amplitude in fatigue condition. The
behavior of high amplitude fluctuations may be different
from low amplitude fluctuations, and thus this is reflected
as a variation of generalized Hurst exponent in Fig. 4.
The positive order (q>0) is representation of high
amplitude fluctuations and negative order (q<0) is
representation of low amplitude fluctuations. It is also
reported than mono fractal time series has a constant
Hurst exponent [15]. If the sEMG signal has uniform
behavior for various amplitude fluctuations then Hurst
exponent would be a nearly constant value for different
order of fluctuations. Thus, it may be inferred that sEMG
signals are having multifractal characteristics using
generalized Hurst exponent analysis, in both nonfatigue
and fatigue condition. The degree of multifractal nature is
higher in fatigue condition as compared to nonfatigue
condition.
The multifractal spectrum is computed for nonfatigue
and fatigue conditions. This is represented in Fig. 5. The
fatigue signal has a broad concentration (α=0.2 to α=1.3)
and nonfatigue signal has a relatively narrow
concentration (α=0.1 to α=0.8). The changes in the
spectrum may be due to presence of different levels of
scale invariance. The peak exponent for nonfatigue
segment (PEVNonfatigue) and fatigue segment (PEVFatigue)
for the representative signal is found to be 0.43 and 0.63
respectively. The left and right extremes of the spectrum
represent rare exponent and smooth exponent values of
time series. The rare exponent is an indication for
positive order of fluctuation (q→∞) and smooth exponent
is an indication for negative order of fluctuation (q→-∞).
In this study, the order of fluctuation is analyzed for q
ranging from -10 to 10. The degree of multifractality is
also represented in Fig. 5 for both nonfatigue
(DOMNonfatigue) and fatigue segments (DOMFatigue). The
DOM value is found to be 0.7 and 1.1 for nonfatigue and
fatigue segment. The reduction in DOM for nonfatigue is
due to closer range concentration of spectrum as shown in
Fig. 5. The narrow concentration of spectrum is an
indication of lower scale invariance and broader
concentration is an indication of greater scale invariance.
The changes to scale invariance are based on presence of
high amplitude and low amplitude fluctuations in the time
series. In fatigue condition, it is reported that there may
be a reduction in conduction velocity and synchronization
of motor unit action potentials [25]. This may result in an
increase of higher and lower amplitude fluctuation signals.
This can be correlated to the reduction of mean frequency
and median frequency in sustained fatigue condition as
reported in previous work [2], [26].
The new feature mean multifractal spectral exponent
(MSE) is computed for nonfatigue and fatigue. This
feature is derived from power spectral analysis feature
mean power frequency. This feature uses the weighted
average of spectrum at various values of exponent and
provides a weighted average. The MSENonfatigue is found
to be lower than MSEFatigue as in the case of peak
exponent. The variation of MSE is found to higher than
PEV feature in this study. The MSE and PEV for sEMG
signal in fatigue and nonfatigue conditions are
represented in Fig. 5.
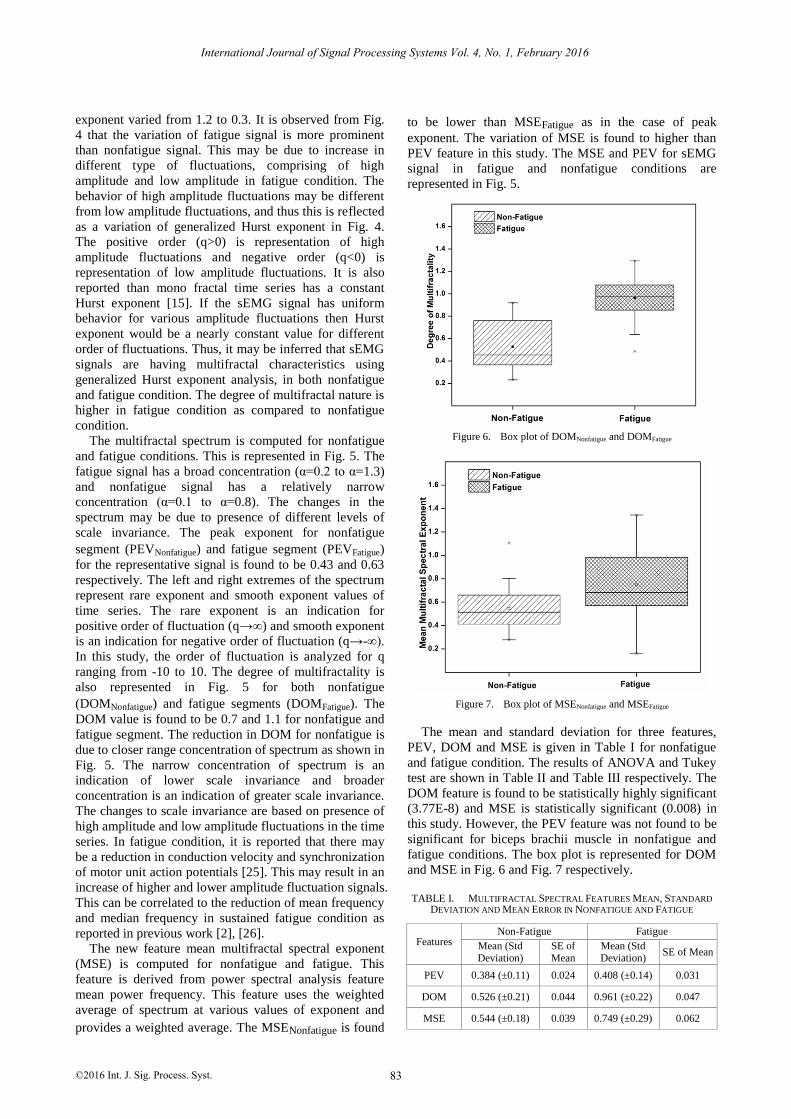
Figure 6. Box plot of DOMNonfatigue and DOMFatigue
Figure 7. Box plot of MSENonfatigue and MSEFatigue
The mean and standard deviation for three features,
PEV, DOM and MSE is given in Table I for nonfatigue
and fatigue condition. The results of ANOVA and Tukey
test are shown in Table II and Table III respectively. The
DOM feature is found to be statistically highly significant
(3.77E-8) and MSE is statistically significant (0.008) in
this study. However, the PEV feature was not found to be
significant for biceps brachii muscle in nonfatigue and
fatigue conditions. The box plot is represented for DOM
and MSE in Fig. 6 and Fig. 7 respectively.
TABLE I. MULTIFRACTAL SPECTRAL FEATURES MEAN, STANDARD
DEVIATION AND MEAN ERROR IN NONFATIGUE AND FATIGUE
Features
Non-Fatigue Fatigue
Mean (Std Deviation)
SE of Mean
Mean (Std Deviation)
SE of Mean
PEV 0.384 (±0.11) 0.024 0.408 (±0.14) 0.031
DOM 0.526 (±0.21) 0.044 0.961 (±0.22) 0.047
MSE 0.544 (±0.18) 0.039 0.749 (±0.29) 0.062
83
International Journal of Signal Processing Systems Vol. 4, No. 1, February 2016
©2016 Int. J. Sig. Process. Syst.
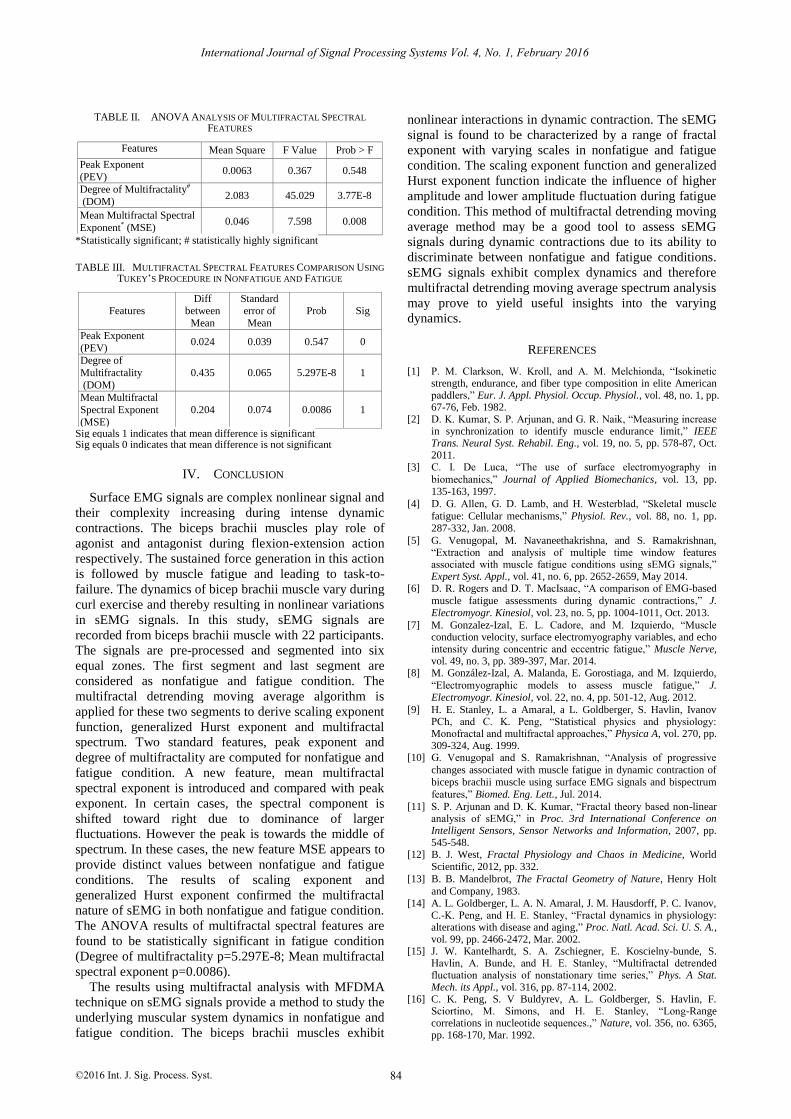
TABLE II. ANOVA ANALYSIS OF MULTIFRACTAL SPECTRAL
FEATURES
Features Mean Square F Value Prob > F
Peak Exponent
(PEV) 0.0063 0.367 0.548
Degree of Multifractality#
(DOM) 2.083 45.029 3.77E-8
Mean Multifractal Spectral
Exponent* (MSE) 0.046 7.598 0.008
*Statistically significant; # statistically highly significant
TABLE III. MULTIFRACTAL SPECTRAL FEATURES COMPARISON USING
TUKEY’S PROCEDURE IN NONFATIGUE AND FATIGUE
Features Diff
between
Mean
Standard error of
Mean
Prob Sig
Peak Exponent
(PEV) 0.024 0.039 0.547 0
Degree of
Multifractality
(DOM)
0.435 0.065 5.297E-8 1
Mean Multifractal
Spectral Exponent
(MSE)
0.204 0.074 0.0086 1
Sig equals 1 indicates that mean difference is significant Sig equals 0 indicates that mean difference is not significant
IV. CONCLUSION
Surface EMG signals are complex nonlinear signal and
their complexity increasing during intense dynamic
contractions. The biceps brachii muscles play role of
agonist and antagonist during flexion-extension action
respectively. The sustained force generation in this action
is followed by muscle fatigue and leading to task-to-
failure. The dynamics of bicep brachii muscle vary during
curl exercise and thereby resulting in nonlinear variations
in sEMG signals. In this study, sEMG signals are
recorded from biceps brachii muscle with 22 participants.
The signals are pre-processed and segmented into six
equal zones. The first segment and last segment are
considered as nonfatigue and fatigue condition. The
multifractal detrending moving average algorithm is
applied for these two segments to derive scaling exponent
function, generalized Hurst exponent and multifractal
spectrum. Two standard features, peak exponent and
degree of multifractality are computed for nonfatigue and
fatigue condition. A new feature, mean multifractal
spectral exponent is introduced and compared with peak
exponent. In certain cases, the spectral component is
shifted toward right due to dominance of larger
fluctuations. However the peak is towards the middle of
spectrum. In these cases, the new feature MSE appears to
provide distinct values between nonfatigue and fatigue
conditions. The results of scaling exponent and
generalized Hurst exponent confirmed the multifractal
nature of sEMG in both nonfatigue and fatigue condition.
The ANOVA results of multifractal spectral features are
found to be statistically significant in fatigue condition
(Degree of multifractality p=5.297E-8; Mean multifractal
spectral exponent p=0.0086).
The results using multifractal analysis with MFDMA
technique on sEMG signals provide a method to study the
underlying muscular system dynamics in nonfatigue and
fatigue condition. The biceps brachii muscles exhibit
nonlinear interactions in dynamic contraction. The sEMG
signal is found to be characterized by a range of fractal
exponent with varying scales in nonfatigue and fatigue
condition. The scaling exponent function and generalized
Hurst exponent function indicate the influence of higher
amplitude and lower amplitude fluctuation during fatigue
condition. This method of multifractal detrending moving
average method may be a good tool to assess sEMG
signals during dynamic contractions due to its ability to
discriminate between nonfatigue and fatigue conditions.
sEMG signals exhibit complex dynamics and therefore
multifractal detrending moving average spectrum analysis
may prove to yield useful insights into the varying
dynamics.
REFERENCES
[1] P. M. Clarkson, W. Kroll, and A. M. Melchionda, “Isokinetic strength, endurance, and fiber type composition in elite American paddlers,” Eur. J. Appl. Physiol. Occup. Physiol., vol. 48, no. 1, pp. 67-76, Feb. 1982.
[2] D. K. Kumar, S. P. Arjunan, and G. R. Naik, “Measuring increase in synchronization to identify muscle endurance limit,” IEEE Trans. Neural Syst. Rehabil. Eng., vol. 19, no. 5, pp. 578-87, Oct. 2011.
[3] C. I. De Luca, “The use of surface electromyography in
biomechanics,” Journal of Applied Biomechanics, vol. 13, pp. 135-163, 1997.
[4] D. G. Allen, G. D. Lamb, and H. Westerblad, “Skeletal muscle
fatigue: Cellular mechanisms,” Physiol. Rev., vol. 88, no. 1, pp. 287-332, Jan. 2008.
[5] G. Venugopal, M. Navaneethakrishna, and S. Ramakrishnan, “Extraction and analysis of multiple time window features associated with muscle fatigue conditions using sEMG signals,” Expert Syst. Appl., vol. 41, no. 6, pp. 2652-2659, May 2014.
[6] D. R. Rogers and D. T. MacIsaac, “A comparison of EMG-based
muscle fatigue assessments during dynamic contractions,” J. Electromyogr. Kinesiol, vol. 23, no. 5, pp. 1004-1011, Oct. 2013.
[7] M. Gonzalez-Izal, E. L. Cadore, and M. Izquierdo, “Muscle conduction velocity, surface electromyography variables, and echo intensity during concentric and eccentric fatigue,” Muscle Nerve, vol. 49, no. 3, pp. 389-397, Mar. 2014.
[8] M. González-Izal, A. Malanda, E. Gorostiaga, and M. Izquierdo,
“Electromyographic models to assess muscle fatigue,” J. Electromyogr. Kinesiol, vol. 22, no. 4, pp. 501-12, Aug. 2012.
[9] H. E. Stanley, L. a Amaral, a L. Goldberger, S. Havlin, Ivanov PCh, and C. K. Peng, “Statistical physics and physiology: Monofractal and multifractal approaches,” Physica A, vol. 270, pp. 309-324, Aug. 1999.
[10] G. Venugopal and S. Ramakrishnan, “Analysis of progressive
changes associated with muscle fatigue in dynamic contraction of biceps brachii muscle using surface EMG signals and bispectrum
features,” Biomed. Eng. Lett., Jul. 2014.
[11] S. P. Arjunan and D. K. Kumar, “Fractal theory based non-linear analysis of sEMG,” in Proc. 3rd International Conference on Intelligent Sensors, Sensor Networks and Information, 2007, pp. 545-548.
[12] B. J. West, Fractal Physiology and Chaos in Medicine, World Scientific, 2012, pp. 332.
[13] B. B. Mandelbrot, The Fractal Geometry of Nature, Henry Holt
and Company, 1983. [14] A. L. Goldberger, L. A. N. Amaral, J. M. Hausdorff, P. C. Ivanov,
C.-K. Peng, and H. E. Stanley, “Fractal dynamics in physiology: alterations with disease and aging,” Proc. Natl. Acad. Sci. U. S. A., vol. 99, pp. 2466-2472, Mar. 2002.
[15] J. W. Kantelhardt, S. A. Zschiegner, E. Koscielny-bunde, S. Havlin, A. Bunde, and H. E. Stanley, “Multifractal detrended fluctuation analysis of nonstationary time series,” Phys. A Stat. Mech. its Appl., vol. 316, pp. 87-114, 2002.
[16] C. K. Peng, S. V Buldyrev, A. L. Goldberger, S. Havlin, F. Sciortino, M. Simons, and H. E. Stanley, “Long-Range correlations in nucleotide sequences.,” Nature, vol. 356, no. 6365, pp. 168-170, Mar. 1992.
84
International Journal of Signal Processing Systems Vol. 4, No. 1, February 2016
©2016 Int. J. Sig. Process. Syst.

[17] N. Vandewalle and M. Ausloos, “Crossing of two mobile averages: A method for measuring the roughness exponent,” Phys. Rev. E,
vol. 58, no. 5, pp. 6832-6834, Nov. 1998.
[18] E. Alessio, A. Carbone, G. Castelli, and V. Frappietro, “Second-Order moving average and scaling of stochastic time,” Eur. Phys.
J. B 27, vol. 200, pp. 197-200, 2002.
[19] G.-F. Gu and W.-X. Zhou, “Detrending moving average algorithm for multifractals,” Phys. Rev. E, vol. 82, no. 1, pp. 11136, Jul.
2010.
[20] G. Wang, X. Ren, L. Li, and Z. Wang, “Multifractal analysis of surface EMG signals for assessing muscle fatigue during static
contractions,” J. Zhejiang Univ. Sci. A, vol. 8, no. 6, pp. 910-915,
May 2007. [21] M. Talebinejad, A. D. C. Chan, and A. Miri, “Fatigue estimation
using a novel multi-fractal detrended fluctuation analysis-based
approach,” J. Electromyogr. Kinesiol, vol. 20, no. 3, pp. 433-439, Jun. 2010.
[22] T. Halsey, M. Jensen, L. Kadanoff, I. Procaccia, and B. Shraiman,
“Fractal measures and their singularities: The characterization of
strange sets,” Phys. Rev. A, vol. 33, no. 2, pp. 1141-1151, Feb.
1986.
[23] M. R. Al-Mulla, F. Sepulveda, and M. Colley, “A review of non-
invasive techniques to detect and predict localised muscle fatigue,”
Sensors (Basel), vol. 11, no. 4, pp. 3545-3594, Jan. 2011. [24] K. Marri, N. K. M, J. Jose, P. A. Karthick, and S. Ramakrishnan,
“Analysis of fatigue conditions in triceps brachii muscle using
sEMG signals and spectral correlation density function,” in Proc. ICIEV, 2014, pp. 1-4.
[25]
R. Merletti and P. A. Parker, Electromyography: Physiology,
Engineering, and Non-Invasive Applications, Wiley, 2004. [26]
M. González-izal, A. Malanda, E. Gorostiaga, and M. Izquierdo,
“Electromyographic models to assess muscle fatigue,” J.
Electromyogr. Kinesiol, vol. 22, pp. 501-512, 2012.
85
International Journal of Signal Processing Systems Vol. 4, No. 1, February 2016
©2016 Int. J. Sig. Process. Syst.