Embed Size (px)
Citation preview
lable at ScienceDirect
Applied Ergonomics 41 (2010) 411–416
Contents lists avai
Applied Ergonomics
journal homepage: www.elsevier .com/locate/apergo
Analysis of applied forces and electromyography of back and shoulders muscleswhen performing a simulated hand scaling task
William Porter*, Sean Gallagher, Janet Torma-KrajewskiPittsburgh Research Laboratory, National Institute for Occupational Safety and Health, 626 Cochrans Mill Road, P.O. Box 18070, Pittsburgh, PA 15236, USA
a r t i c l e i n f o
Article history:Received 5 September 2007Accepted 9 September 2009
Keywords:ScalingElectromyographyMining
* Corresponding author. Tel.: þ1 (412)386 5222; faE-mail address: [email protected] (W. Porter).
0003-6870/$ – see front matter Published by Elsevierdoi:10.1016/j.apergo.2009.09.004
a b s t r a c t
Hand scaling is a physically demanding task responsible for numerous overexertion injuries in under-ground mining. Scaling requires the miner to use a long pry bar to remove loose rock, reducing thelikelihood of rock fall injuries. The experiments described in this article simulated ‘‘rib’’ scaling (scalinga mine wall) from an elevated bucket to examine force generation and electromyographic responsesusing two types of scaling bars (steel and fiberglass-reinforced aluminum) at five target heights rangingfrom floor level to 176 cm. Ten male and six female subjects were tested in separate experiments. Peakand average force applied at the scaling bar tip and normalized electromyography (EMG) of the left andright pairs of the deltoid and erectores spinae muscles were obtained. Work height significantly affectedpeak prying force during scaling activities with highest force capacity at the lower levels. Bar type did notaffect force generation. However, use of the lighter fiberglass bar required significantly more muscleactivity to achieve the same force. Results of these studies suggest that miners scale points on the rockface that are below their knees, and reposition the bucket as often as necessary to do so.
Published by Elsevier Ltd.
1. Introduction
The roof and ribs (i.e., walls) of underground mines are regularlyexamined and scaled with a long pry bar to remove loose surfacerock. The purpose of this activity is to reduce the likelihood of rockfall injuries and is a safety activity mandated by the U.S. Mine Safetyand Health Administration (MSHA). Hand scaling is a physicallydemanding task, and is associated with numerous overexertioninjuries. Two-thirds of scaling-related overexertion injuries involvethe back and shoulders with the major injury being a pulled backmuscle (MSHA, 2000–2004). The average number of lost days perscaling overexertion injury was 65 days compared to 28 days loston average for scaling-related injuries as a whole.
In many high-seam mines (such as underground limestone orsalt mines), scaling of the mine ribs (i.e., mine wall) requires minersto work from an elevated bucket, positioned a few feet from therock face. The distance between the bucket and the rib variesdepending on how close the bucket can safely be positioned to therib. Occasionally two miners may be scaling from the samethe bucket. The scaling process starts with a visual inspection of therock face to locate cracks or other signs that a rock must beremoved. The miner then uses a scaling bar to probe any observed
x: þ1 (412)386 6710.
Ltd.
cracks for loose rock by jabbing the tip of the scaling bar into thecrack to determine whether the tip can obtain enough purchase toremove a piece of loose rock. Removal is achieved by applyinga downward shear force often combined with a prying motion topull the loose rock away. Field observations of this task showed thatonce the bucket has been positioned, the miner(s) tend to startscaling at shoulder level and work downward, and that the bucketis usually not moved until the miners have scaled everything theycan reach from their current position.
Previous research on the physical demands of scaling bar use isscant. Marras and Lavender (1991) examined overhead roof scalingusing different weights and types of scaling bars. Their study basedrecommendations on predicted spine compression forces andstriking force at the tip of the scaling bar. The authors found pre-dicted spine forces lower for the lighter bar which gave slightlylower average striking force, but this difference was not statisticallysignificant. It was also found that a counterbalanced scaling bar(with more bar weight closer to the operator) significantly reducedlow back loading. However, this research looked only at overheadscaling bar use and not wall-scaling activities, for which physicaldemands would differ considerably. Therefore the goal of thepresent investigation was to evaluate the force generation capa-bilities and electromyographic responses to simulated rib scalingexertions in a laboratory setting. Specifically, the focus of thesestudies was the downward force application since the maximumeffort occurs during this subtask. Improved knowledge of the
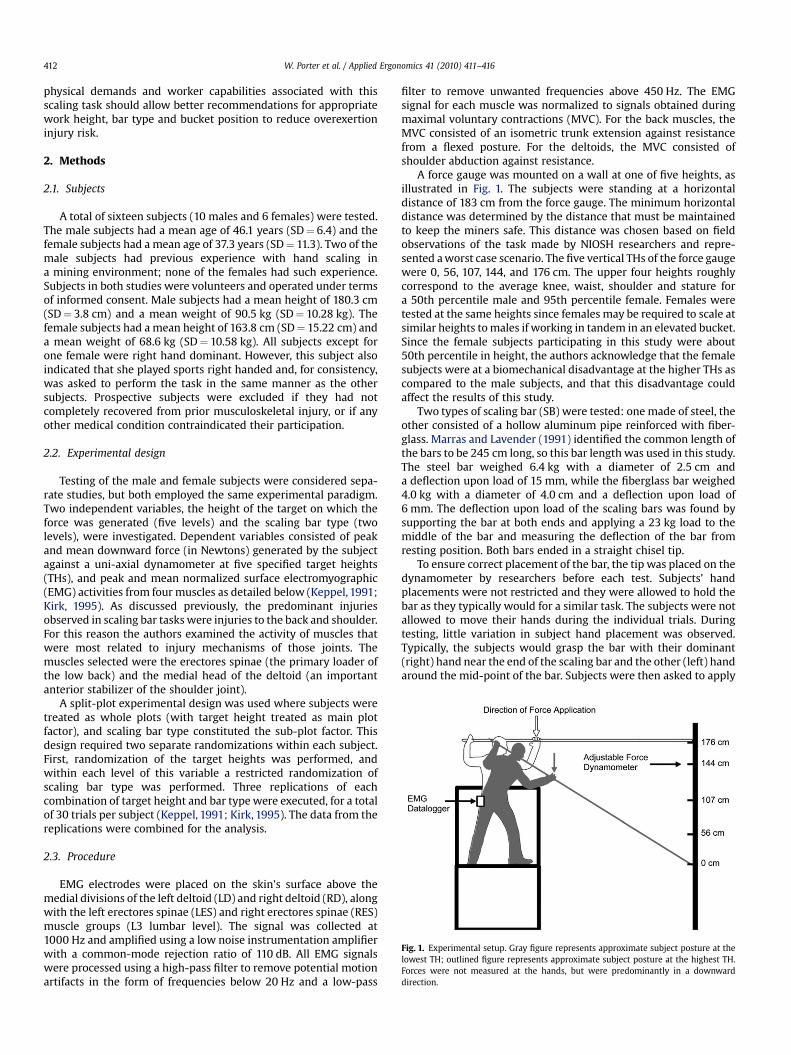
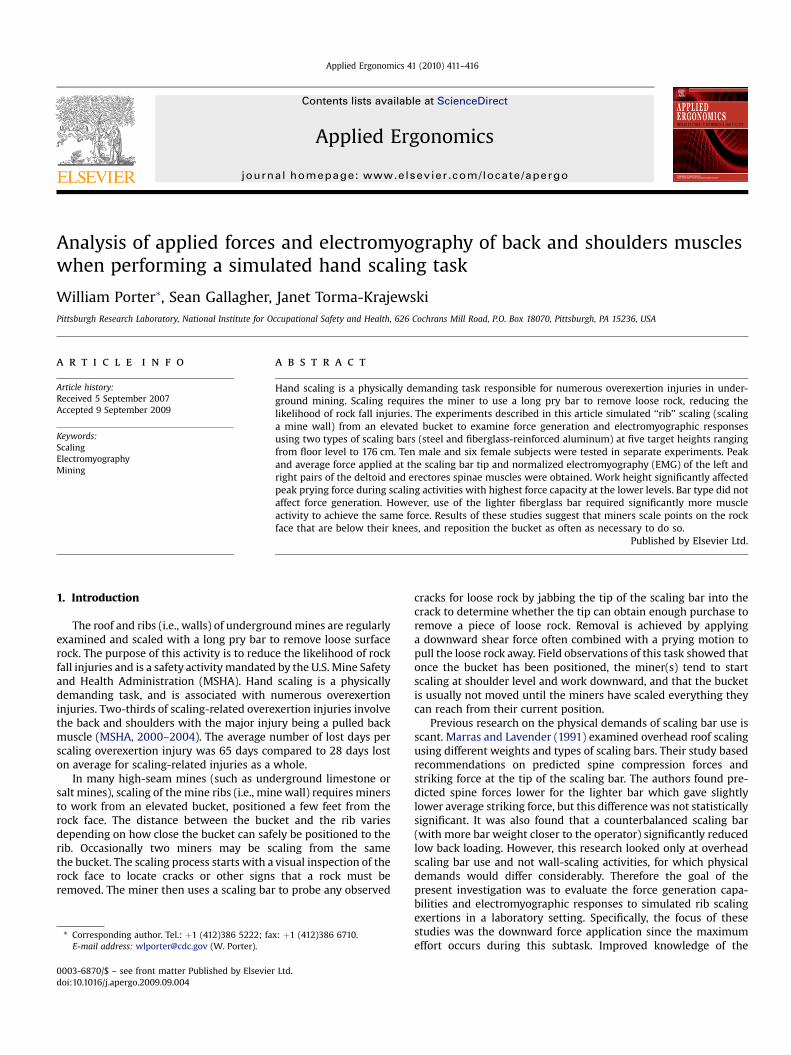
Fig. 1. Experimental setup. Gray figure represents approximate subject posture at thelowest TH; outlined figure represents approximate subject posture at the highest TH.Forces were not measured at the hands, but were predominantly in a downwarddirection.
W. Porter et al. / Applied Ergonomics 41 (2010) 411–416412
physical demands and worker capabilities associated with thisscaling task should allow better recommendations for appropriatework height, bar type and bucket position to reduce overexertioninjury risk.
2. Methods
2.1. Subjects
A total of sixteen subjects (10 males and 6 females) were tested.The male subjects had a mean age of 46.1 years (SD¼ 6.4) and thefemale subjects had a mean age of 37.3 years (SD¼ 11.3). Two of themale subjects had previous experience with hand scaling ina mining environment; none of the females had such experience.Subjects in both studies were volunteers and operated under termsof informed consent. Male subjects had a mean height of 180.3 cm(SD¼ 3.8 cm) and a mean weight of 90.5 kg (SD¼ 10.28 kg). Thefemale subjects had a mean height of 163.8 cm (SD¼ 15.22 cm) anda mean weight of 68.6 kg (SD¼ 10.58 kg). All subjects except forone female were right hand dominant. However, this subject alsoindicated that she played sports right handed and, for consistency,was asked to perform the task in the same manner as the othersubjects. Prospective subjects were excluded if they had notcompletely recovered from prior musculoskeletal injury, or if anyother medical condition contraindicated their participation.
2.2. Experimental design
Testing of the male and female subjects were considered sepa-rate studies, but both employed the same experimental paradigm.Two independent variables, the height of the target on which theforce was generated (five levels) and the scaling bar type (twolevels), were investigated. Dependent variables consisted of peakand mean downward force (in Newtons) generated by the subjectagainst a uni-axial dynamometer at five specified target heights(THs), and peak and mean normalized surface electromyographic(EMG) activities from four muscles as detailed below (Keppel, 1991;Kirk, 1995). As discussed previously, the predominant injuriesobserved in scaling bar tasks were injuries to the back and shoulder.For this reason the authors examined the activity of muscles thatwere most related to injury mechanisms of those joints. Themuscles selected were the erectores spinae (the primary loader ofthe low back) and the medial head of the deltoid (an importantanterior stabilizer of the shoulder joint).
A split-plot experimental design was used where subjects weretreated as whole plots (with target height treated as main plotfactor), and scaling bar type constituted the sub-plot factor. Thisdesign required two separate randomizations within each subject.First, randomization of the target heights was performed, andwithin each level of this variable a restricted randomization ofscaling bar type was performed. Three replications of eachcombination of target height and bar type were executed, for a totalof 30 trials per subject (Keppel, 1991; Kirk, 1995). The data from thereplications were combined for the analysis.
2.3. Procedure
EMG electrodes were placed on the skin’s surface above themedial divisions of the left deltoid (LD) and right deltoid (RD), alongwith the left erectores spinae (LES) and right erectores spinae (RES)muscle groups (L3 lumbar level). The signal was collected at1000 Hz and amplified using a low noise instrumentation amplifierwith a common-mode rejection ratio of 110 dB. All EMG signalswere processed using a high-pass filter to remove potential motionartifacts in the form of frequencies below 20 Hz and a low-pass
filter to remove unwanted frequencies above 450 Hz. The EMGsignal for each muscle was normalized to signals obtained duringmaximal voluntary contractions (MVC). For the back muscles, theMVC consisted of an isometric trunk extension against resistancefrom a flexed posture. For the deltoids, the MVC consisted ofshoulder abduction against resistance.
A force gauge was mounted on a wall at one of five heights, asillustrated in Fig. 1. The subjects were standing at a horizontaldistance of 183 cm from the force gauge. The minimum horizontaldistance was determined by the distance that must be maintainedto keep the miners safe. This distance was chosen based on fieldobservations of the task made by NIOSH researchers and repre-sented a worst case scenario. The five vertical THs of the force gaugewere 0, 56, 107, 144, and 176 cm. The upper four heights roughlycorrespond to the average knee, waist, shoulder and stature fora 50th percentile male and 95th percentile female. Females weretested at the same heights since females may be required to scale atsimilar heights to males if working in tandem in an elevated bucket.Since the female subjects participating in this study were about50th percentile in height, the authors acknowledge that the femalesubjects were at a biomechanical disadvantage at the higher THs ascompared to the male subjects, and that this disadvantage couldaffect the results of this study.
Two types of scaling bar (SB) were tested: one made of steel, theother consisted of a hollow aluminum pipe reinforced with fiber-glass. Marras and Lavender (1991) identified the common length ofthe bars to be 245 cm long, so this bar length was used in this study.The steel bar weighed 6.4 kg with a diameter of 2.5 cm anda deflection upon load of 15 mm, while the fiberglass bar weighed4.0 kg with a diameter of 4.0 cm and a deflection upon load of6 mm. The deflection upon load of the scaling bars was found bysupporting the bar at both ends and applying a 23 kg load to themiddle of the bar and measuring the deflection of the bar fromresting position. Both bars ended in a straight chisel tip.
To ensure correct placement of the bar, the tip was placed on thedynamometer by researchers before each test. Subjects’ handplacements were not restricted and they were allowed to hold thebar as they typically would for a similar task. The subjects were notallowed to move their hands during the individual trials. Duringtesting, little variation in subject hand placement was observed.Typically, the subjects would grasp the bar with their dominant(right) hand near the end of the scaling bar and the other (left) handaround the mid-point of the bar. Subjects were then asked to apply
W. Porter et al. / Applied Ergonomics 41 (2010) 411–416 413
a downward maximum voluntary isometric muscular force inaccordance with standard isometric strength testing procedures,with 2 min of recovery time given after each trial (Caldwell et al.,1974). The subjects were asked to apply a force for a total of fiveseconds. The force applied over the last three seconds of the trialwas averaged to find the mean force per trial. The peak force wasdetermined as the maximum force over the same three seconds.EMG data were collected and analyzed for the matching threesecond period of time. Despite the difference in target heights, thesubjects’ trunk postures were not observed to vary substantiallyduring the performance of the scaling tasks tested.
2.4. Data treatment
Due to the differences in shoulder strength among males andfemales, it was decided to analyze male subjects and femalesubjects separately (Chaffin et al., 1999). A split-plot analysis ofvariance (a¼ 0.05) was used to determine the effect of the inde-pendent variables on the peak and mean downward force gener-ated and peak and mean normalized EMG data. Orthogonalpolynomials were used for a posteriori tests for trends in force asdetailed in the results section. The Dunn-Sidak procedure was usedfor the a posteriori tests to maintain an experiment-wise error rateof a¼ 0.05 (Kirk 1995).
3. Results
3.1. Experiment 1: male subjects
3.1.1. Force generationInspection of both peak and mean force data for male subjects
(Fig. 2) provided strong evidence of U-shaped (quadratic) trends asa function of target height, with higher forces observed at targetheights of 0, 56 and 176 cm, and lower values at the intermediateheights (107 and 144 cm above floor level). Accordingly, a posterioritrend analysis procedures were used to test for the significance ofthe suspected trends. The Dunn-Sidak procedure was employed toexamine whether significant quadratic, cubic, or quartic trendsexisted as a function of TH (Kirk 1995). The critical tDS for 4orthogonal polynomial contrasts with a¼ 0.05 and 60 error df was2.653. The obtained tDS statistic for a quadratic trend for meanforce was 2.740 (p< 0.05), and for peak force the obtained statisticwas 3.271 (p< 0.01), both indicative of significant quadratic trends.Cubic and quartic components were not significant (p> 0.05). Onaverage (across all male subjects and target heights), peak and
70
75
80
85
90
95
100
105
110
0 56 107 144 176Target Height (cm)
Fo
rce (N
)
Peak
Mean
Fig. 2. Downward force generated as a function of work height for male subjects(n¼ 10) (bars represent standard error of the mean).
mean forces generated using the two bars were all within a range of1 N.
3.1.2. ElectromyographyThe type of bar used during the prying task was found to
significantly affect muscle activity in the male subjects, but theheight at which the task was done was not significant (p> 0.05).For this reason, muscle activation data were aggregated over theheights and analyzed with respect to bar type. Separate analyseswere performed on the mean and peak normalized EMG data.
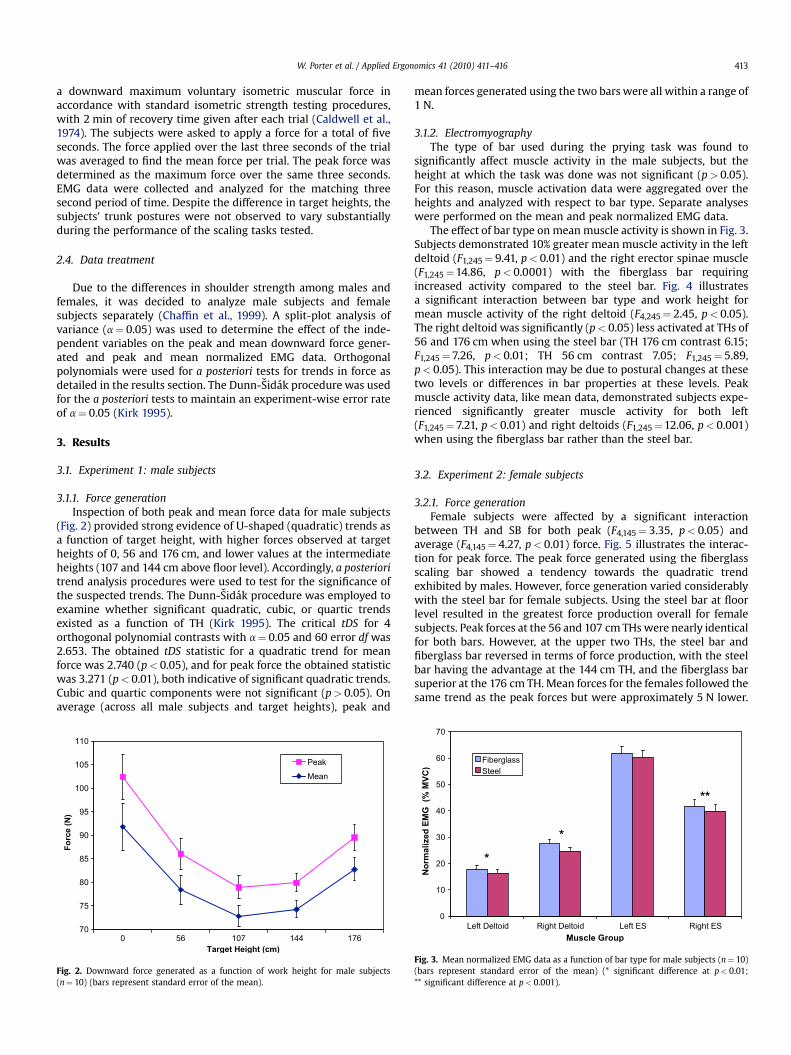
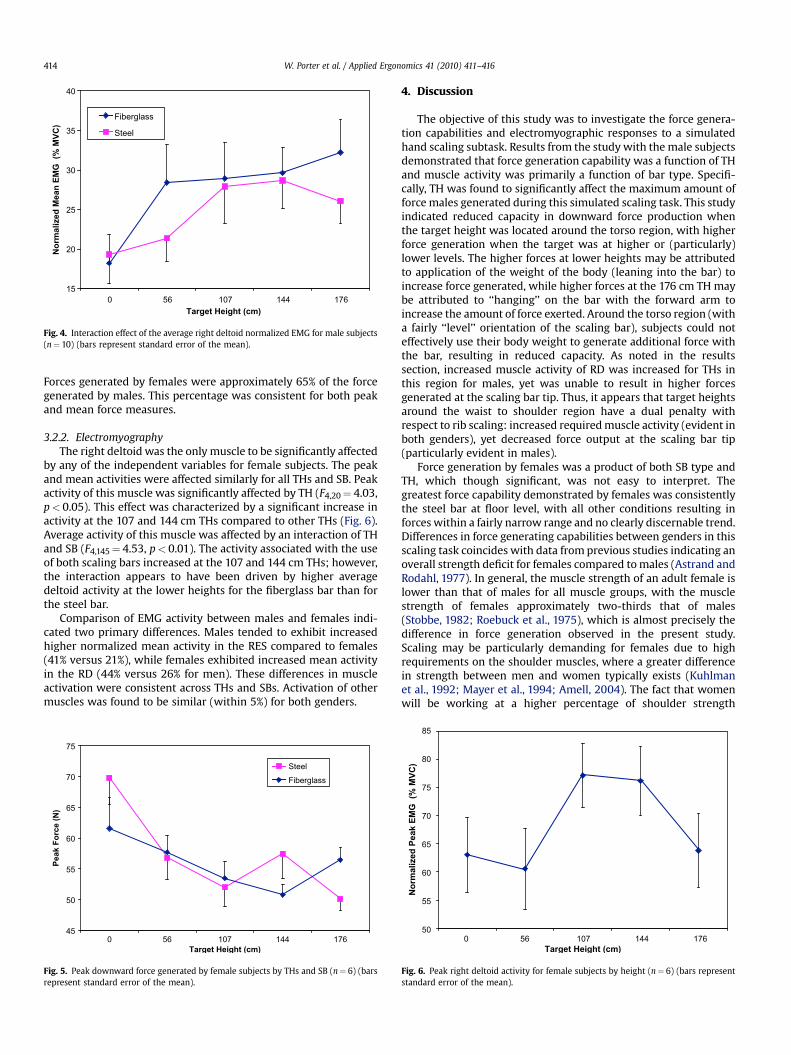
The effect of bar type on mean muscle activity is shown in Fig. 3.Subjects demonstrated 10% greater mean muscle activity in the leftdeltoid (F1,245¼ 9.41, p< 0.01) and the right erector spinae muscle(F1,245¼14.86, p< 0.0001) with the fiberglass bar requiringincreased activity compared to the steel bar. Fig. 4 illustratesa significant interaction between bar type and work height formean muscle activity of the right deltoid (F4,245¼ 2.45, p< 0.05).The right deltoid was significantly (p< 0.05) less activated at THs of56 and 176 cm when using the steel bar (TH 176 cm contrast 6.15;F1,245¼7.26, p< 0.01; TH 56 cm contrast 7.05; F1,245¼ 5.89,p< 0.05). This interaction may be due to postural changes at thesetwo levels or differences in bar properties at these levels. Peakmuscle activity data, like mean data, demonstrated subjects expe-rienced significantly greater muscle activity for both left(F1,245¼7.21, p< 0.01) and right deltoids (F1,245¼12.06, p< 0.001)when using the fiberglass bar rather than the steel bar.
3.2. Experiment 2: female subjects
3.2.1. Force generationFemale subjects were affected by a significant interaction
between TH and SB for both peak (F4,145¼ 3.35, p< 0.05) andaverage (F4,145¼ 4.27, p< 0.01) force. Fig. 5 illustrates the interac-tion for peak force. The peak force generated using the fiberglassscaling bar showed a tendency towards the quadratic trendexhibited by males. However, force generation varied considerablywith the steel bar for female subjects. Using the steel bar at floorlevel resulted in the greatest force production overall for femalesubjects. Peak forces at the 56 and 107 cm THs were nearly identicalfor both bars. However, at the upper two THs, the steel bar andfiberglass bar reversed in terms of force production, with the steelbar having the advantage at the 144 cm TH, and the fiberglass barsuperior at the 176 cm TH. Mean forces for the females followed thesame trend as the peak forces but were approximately 5 N lower.
0
10
20
30
40
50
60
70
Left Deltoid Right Deltoid Left ES Right ESMuscle Group
No
rm
alized
E
MG
(%
M
VC
)
FiberglassSteel
*
**
*
Fig. 3. Mean normalized EMG data as a function of bar type for male subjects (n¼ 10)(bars represent standard error of the mean) (* significant difference at p< 0.01;** significant difference at p< 0.001).
15
20
25
30
35
40
0 56 107 144 176Target Height (cm)
No
rm
alized
M
ean
E
MG
(%
M
VC
)
Fiberglass
Steel
Fig. 4. Interaction effect of the average right deltoid normalized EMG for male subjects(n¼ 10) (bars represent standard error of the mean).
W. Porter et al. / Applied Ergonomics 41 (2010) 411–416414
Forces generated by females were approximately 65% of the forcegenerated by males. This percentage was consistent for both peakand mean force measures.
3.2.2. ElectromyographyThe right deltoid was the only muscle to be significantly affected
by any of the independent variables for female subjects. The peakand mean activities were affected similarly for all THs and SB. Peakactivity of this muscle was significantly affected by TH (F4,20¼ 4.03,p< 0.05). This effect was characterized by a significant increase inactivity at the 107 and 144 cm THs compared to other THs (Fig. 6).Average activity of this muscle was affected by an interaction of THand SB (F4,145¼ 4.53, p< 0.01). The activity associated with the useof both scaling bars increased at the 107 and 144 cm THs; however,the interaction appears to have been driven by higher averagedeltoid activity at the lower heights for the fiberglass bar than forthe steel bar.
Comparison of EMG activity between males and females indi-cated two primary differences. Males tended to exhibit increasedhigher normalized mean activity in the RES compared to females(41% versus 21%), while females exhibited increased mean activityin the RD (44% versus 26% for men). These differences in muscleactivation were consistent across THs and SBs. Activation of othermuscles was found to be similar (within 5%) for both genders.
45
50
55
60
65
70
75
0 56 107 144 176Target Height (cm)
Peak F
orce (N
)
Steel
Fiberglass
Fig. 5. Peak downward force generated by female subjects by THs and SB (n¼ 6) (barsrepresent standard error of the mean).
4. Discussion
The objective of this study was to investigate the force genera-tion capabilities and electromyographic responses to a simulatedhand scaling subtask. Results from the study with the male subjectsdemonstrated that force generation capability was a function of THand muscle activity was primarily a function of bar type. Specifi-cally, TH was found to significantly affect the maximum amount offorce males generated during this simulated scaling task. This studyindicated reduced capacity in downward force production whenthe target height was located around the torso region, with higherforce generation when the target was at higher or (particularly)lower levels. The higher forces at lower heights may be attributedto application of the weight of the body (leaning into the bar) toincrease force generated, while higher forces at the 176 cm TH maybe attributed to ‘‘hanging’’ on the bar with the forward arm toincrease the amount of force exerted. Around the torso region (witha fairly ‘‘level’’ orientation of the scaling bar), subjects could noteffectively use their body weight to generate additional force withthe bar, resulting in reduced capacity. As noted in the resultssection, increased muscle activity of RD was increased for THs inthis region for males, yet was unable to result in higher forcesgenerated at the scaling bar tip. Thus, it appears that target heightsaround the waist to shoulder region have a dual penalty withrespect to rib scaling: increased required muscle activity (evident inboth genders), yet decreased force output at the scaling bar tip(particularly evident in males).
Force generation by females was a product of both SB type andTH, which though significant, was not easy to interpret. Thegreatest force capability demonstrated by females was consistentlythe steel bar at floor level, with all other conditions resulting inforces within a fairly narrow range and no clearly discernable trend.Differences in force generating capabilities between genders in thisscaling task coincides with data from previous studies indicating anoverall strength deficit for females compared to males (Astrand andRodahl, 1977). In general, the muscle strength of an adult female islower than that of males for all muscle groups, with the musclestrength of females approximately two-thirds that of males(Stobbe, 1982; Roebuck et al., 1975), which is almost precisely thedifference in force generation observed in the present study.Scaling may be particularly demanding for females due to highrequirements on the shoulder muscles, where a greater differencein strength between men and women typically exists (Kuhlmanet al., 1992; Mayer et al., 1994; Amell, 2004). The fact that womenwill be working at a higher percentage of shoulder strength
50
55
60
65
70
75
80
85
0 56 107 144 176Target Height (cm)
No
rm
alize
d P
ea
k E
MG
(%
M
VC
)
Fig. 6. Peak right deltoid activity for female subjects by height (n¼ 6) (bars representstandard error of the mean).
W. Porter et al. / Applied Ergonomics 41 (2010) 411–416 415
capacity may help explain higher muscle activity observed for theright deltoid, which was required to hold up the near end of the barand keep it stabilized while exerting force. The force data from thefemale subjects is difficult to interpret due to the presence ofa significant interaction. The main finding was that their forceresponses were influenced by both TH and SB and were a functionof the specific combination of these factors.
When one considers the typical procedure for scaling outlinedin the Introduction (where miners typically start scaling at shoulderheight and work their way down), it would appear that the currentprocedure puts the miner at a significant disadvantage at the startof the scaling operation until the miner can get to locations that areat or below knee height. Force generating capacity appeared relatedto the ability to use mechanical advantages such as body weight.This may be particularly important for females, who exhibit anoverall strength disadvantage. The highest average peak force ofapproximately 70 N for females was at the 0 cm TH. This value wasjust slightly higher than the force of gravity on the steel scaling barused in this study.
The results of these studies lead to the conclusion that minersshould scale points on the rock face that are at or below their kneesand reposition the bucket as necessary to accommodate that workheight region. While higher force capacity was observed at a TH of176 cm, the act of scaling at that level requires a miner to manipulatethe bar substantially more than at lower THs, which could introduceadditional joint forces and awkward postures. It must be recognizedthat two miners may be in the same bucket so coordination of thebucket movement is a critical aspect of this recommendation.
The type of bar used, for the male subjects, was not found toaffect the force generated at any heights tested. However, increasedmuscle activity was required to generate the same amount of forcewith the lighter fiberglass bar as opposed to the heavier steel bar forthe male subjects. A heavier bar may necessitate more muscleactivity to hold, lift, and control the bar if the entire task isconsidered. For the subtask studied, results from the male subjectssuggest that if a miner needs to utilize a tool to exert a force,a lighter tool may actually require increased muscle activity toreach the same force level generated by a heavier tool. Thus, in thecase of the subtask under study, the heavier tool may actuallyconfer a biomechanical benefit thereby reducing the stresses on thebody. In addition, the greater deflection of the steel bar may haveassisted in transferring a greater compressive force to the dyna-mometer. Proper evaluation of the trade-offs associated with toolweight will require additional research. Indeed, it may be necessaryto use both types of bars and even several different lengths of bar toreduce the stress placed on the body given the variety of circum-stances that may be encountered while hand scaling. More researchon scaling tasks and the effects of flexibility, length, size, diameter,and weight of various bar types must be completed to offercomprehensive recommendations.
Previous research on scaling bars, as discussed in the Intro-duction, found that predicted spine forces were lower for thelighter bar and gave slightly lower average striking force. Theresults of the current study indicated that it was more difficult toget the same downward force when using the lighter bar. Subjectshad to work harder as indicated by the increased muscle activity toaccomplish the same task when using the lighter bar. Thediscrepancies in the two findings are probably due to the differencein the subtasks examined.
4.1. Limitations
Certain limitations need to be considered when evaluating thesedata. While the experiment helps define the capabilities of miners togenerate forces using a scaling bar, certain other aspects of the task
(such as jabbing of the rock wall) were not able to be accuratelyreplicated with the current experimental setup. Potential damage tothe dynamometer from such activities was a concern to the investi-gators. Further, the subtask studied in this experiment is not repre-sentative of the overall demands of scaling since scaling requiresmultiple subtasks varying in posture, actions, and force. While theheavier bar seemed to confer some advantages in the currentexperiment in terms of reducing muscular demands for the experi-mental task, clearly this advantage may be outweighed in othersituations such as carrying or lifting the bar for overhead scaling.
The choice of bars used in this study may also be a limiting factorin the generalization of these results. The bars that were identifiedas most common had not only weight differences but also differ-ences in diameter and deflection upon load. Each of these variableswould have an effect on strength observed. For this reason, theresults can not be easily distinguished between bars characteris-tics; instead only the overall bar effect can be discussed. Forcegenerating capacity of a scaling bar may also be a function of the barlength and horizontal distance from the subject to the target. Thesevariables were not examined in this study for simplicity of theexperimental design.
Finally, it was decided to test females at the same THs as malesfor comparative purposes; however, these heights probablydisadvantaged females, particularly at the highest TH. At this TH thefemale subjects were working above their heads; this would meanthat the shoulder and mid back muscles would be more active.Since these muscles were not monitored in this study, the authorscould not make definitive conclusions on how females respondedto scaling at this level. The trends identified for the males were notseen for the females; this is possibly due to the varied regionalstrength differences of males and females (Chaffin et al., 1999).
Additional research will be necessary to develop comprehensivework practice recommendations that address (in a more holisticway) the goal of reducing the injury risk to miners when per-forming hand scaling activities.
5. Conclusion
Results of this study support the following conclusions:
1) The height at which the scaling bar tip is positioned hasa significant impact on peak and mean force generation capa-bility for male subjects and follows a U-shaped curve withhighest values for targets at or below 56 cm (knee) height andlowest values in the 107–144 cm (waist to shoulder) region.
2) Peak and mean force generation by females was affected bothby the height of the scaling target and the bar used. Greatestforces were generated using the steel bar at a target height of0 cm (floor level) for the females, for both peak and mean forcedata. The female subjects exhibited a similar, but not signifi-cant, quadratic trend demonstrated by males when using thefiberglass but not the steel scaling bar.
3) The type of scaling bar (steel or fiberglass) did not affect forcesapplied for the males; however, these subjects showedincreased EMG activity for the right erectores spinae and leftdeltoid when using the lighter fiberglass bar. For the femalesubjects, no specific scaling bar effect independent of targetheight was identified.
4) Female subjects were able to generate approximately 65% ofthe force of males at the scaling bar tip. Analysis of musclerecruitment indicated higher activity of the right erectoresspinae for males as compared to females and increased activityof the right deltoid muscle in females as compared to males.
5) Results of this study, for both males and females, suggest thatrepositioning the bucket to allow for scaling of rock at or below
W. Porter et al. / Applied Ergonomics 41 (2010) 411–416416
56 cm (knee level) would be advisable due to the decreasedforce generation capacity when scaling at higher target heights.If two miners are in the bucket, position the bucket accordingto the height of the shorter miner or have the taller miner scaleat higher locations particularly when scaling near the roof.
Acknowledgments
The authors would like to acknowledge the contributions of thefollowing individuals in the conduct of this study: Lisa Steiner,Carrie Reinholtz, Mary Ellen Nelson, Al Cook, George Fischer, BillRossi, David Beshero, and Leigh McClure.
Disclaimer
The findings and conclusions in this report are those of theauthors and do not necessarily represent the views of the NationalInstitute for Occupational Safety and Health.
References
Amell, T., 2004. Shoulder, elbow, and forearm strength. In: Kumar, S. (Ed.), MuscleStrength. CRC Press, Boca Raton, pp. 227–246.
Astrand, P.O., Rodahl, K., 1977. Textbook of Work Physiology. McGraw-Hill, NewYork, p. 681.
Caldwell, L.S., Chaffin, D.B., Dukes-Dobos, F.N., Kroemer, K.H., Laubach, L.L.,Snook, S.H., Wasserman, D.E., 1974. A proposed standard procedure for staticmuscle strength testing. American Industrial Hygiene Association Journal 35,201–206.
Chaffin, D.B., Andersson, G.B.J., Martin, B., 1999. Occupational Biomechanics, thirded. Wiley and Sons, New York.
Keppel, G., 1991. Design and Analysis: a Researcher’s Handbook, third ed. PrenticeHall, Upper Saddle River, NJ.
Kirk, R.E., 1995. Experimental Design: Procedures for the Behavioral Sciences, thirded. Brooks/Cole, Pacific Grove, CA.
Kuhlman, J.R., Iannotti, J.P., Kelly, M.J., Riegler, F.X., Gevaert, M.L., Ergin, T.M., 1992.Isokinetic and isometric measurement of strength of external rotation andabduction of the shoulder. Journal of Bone and Joint Surgery (American) 74 (9),1320–1333.
Marras, W.S., Lavender, S.A., 1991. The effects of method of use, tool design, and roofheight on trunk muscle activities during underground scaling bar use. Ergo-nomics 34 (2), 221–232.
Mayer, F., Horstmann, T., Rocker, K., Heitkamp, H.C., Dickhuth, H.H., 1994. Normalvalues of isokinetic maximum strength, the strength velocity curve, and theangle at peak torque of all degrees of freedom in the shoulder. InternationalJournal of Sports Medicine 15 (Suppl. 1), S19–S25.
Mine Safety and Health Administration, 2000–2004. MSHA Database of Accidents,Injuries, and Illnesses in the Mining Industry. Washington, DC.
Roebuck, J.A., Kroemer, K.H.E., Thomson, W.G., 1975. Engineering AnthropometryMethods. Wiley-Interscience, New York.
Stobbe, T.J., 1982. The Development of a Practical Strength Testing Program inIndustry. Ph.D. thesis, Ann Arbor, Industrial and Operation Engineering,Industrial Health Science, University of Michigan.