Embed Size (px)
Citation preview
1
Abstract This work is aimed at analyzing and comparing the suitability and precision of some interface failure criteria for predicting adhesive failure onset on structural adhesive joints. The comparison is based on the predictions of the criteria for the failure for the failure onset in tests that assure an adhesive failure. The tests are peeling and torsion/tension tests with butt joints with different geometries. For the prediction, stresses calculations are made in the finite elements software, COMSOL Multiphysics 3.3. The criterion which best fit the experimental data involves both the interface stresses and the energy released by the spontaneous presence of a crack. This original criterion seems to be suitable for predicting failure of interfaces in different geometries of structural joints subjected to any failure condition whereas an average stress criterion is not suitable for this task. Keywords: adhesive failure, energy released, failure criterion, peel stress, shear stress, finite elements. 1 Introduction Adhesives are extensively used in several applications. An adhesive joint may exhibit four types of failure: adhesive failure (failure of the interface), cohesive failure (failure of the adhesive material), adherend failure and a combination of the previous scenarios. In spite of the extensive use of adhesive joints, an accurate method for predicting their failure is not yet established. This is due to the complexity of stress calculation near free edges and the combination of failure scenario. The prediction of failure initiation should apply failure criteria for each failure scenario. A criterion of adhesive failure is rarely found in the literature owing to the difficulties to handle stress singularities [1]. Researchers usually assume that in an ideal adhesive joint the adhesive layer fails before the interfaces. Nevertheless, several experimental observations show that interfacial failure appears in real world
Paper 136 Analysis of Adhesive Failure Criteria in Structural Joints M.A. Madrid-Pérez, R. Castañeda-Balderas and A. Díaz-Díaz Centro de Investigación en Materiales Avanzados S.C. Chihuahua, Mexico
©Civil-Comp Press, 2011 Proceedings of the Thirteenth International Conference on Civil, Structural and Environmental Engineering Computing, B.H.V. Topping and Y. Tsompanakis, (Editors), Civil-Comp Press, Stirlingshire, Scotland
2
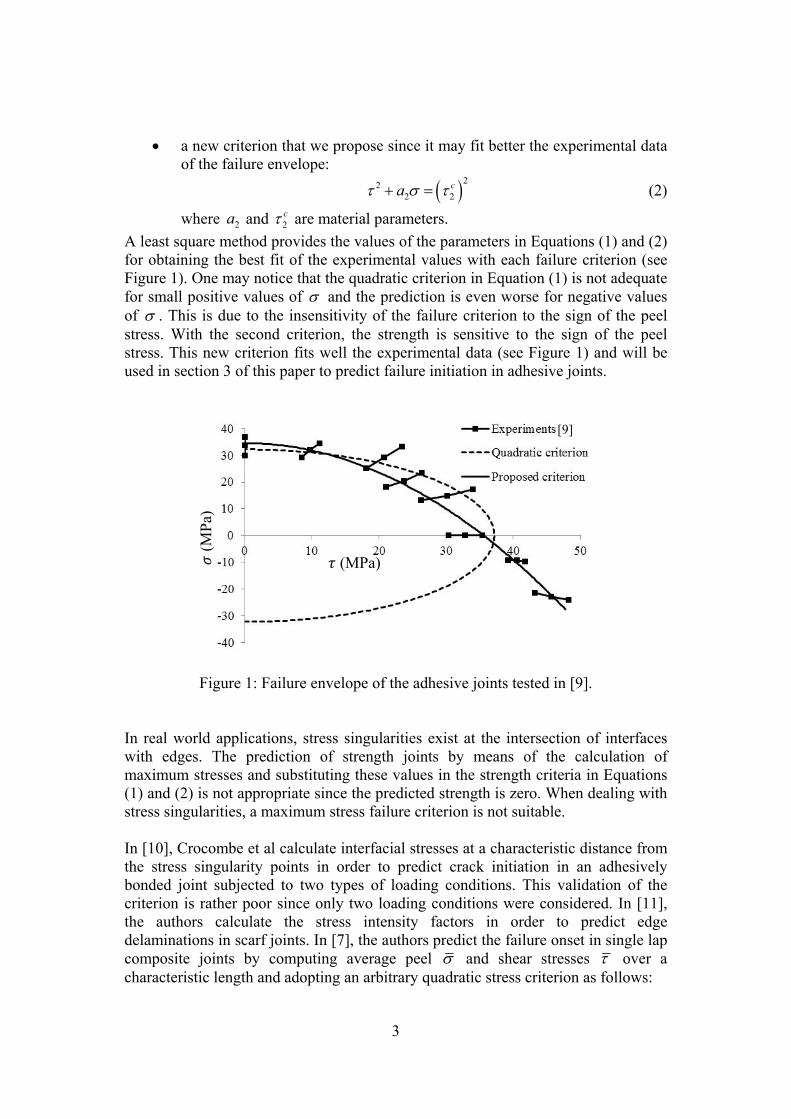
adhesive joints [2,3]. As of this date, the application of a criterion for the interface failure onset in structural adhesive joints giving correct predictions for different loads and geometries has not been published yet. In this paper, the accuracy and suitability of three adhesive failure criteria are analyzed by comparing the predictions of these criteria to the experimental results in [4,5]. The first criterion is an average stress criterion similar to that introduced by Brewer and Lagace in [6] for composite laminates. This criterion has already been used for adhesive joints [7]. The second criterion applies a mixed criterion introduced by Leguillon which involves simultaneously stress and energy conditions [8]. The stress condition is a quadratic expression of interfacial stresses and the energy one makes use of the calculation of an incremental strain energy release rate. The third criterion is also a mixed criterion but it includes an original condition of stresses that seems to be more suitable for predicting adhesive failure in any loading condition. Another originality of this paper resides on the application of the mixed criterion to predict adhesive failure in adhesive joints and on the analysis of accuracy and suitability of the failure criteria. The first section of this paper describes the three adhesive failure criteria analyzed. Then, the experimental data that help to carry out the analysis is shown. Next, the numerical method to calculate stresses and released energies is presented. Finally, the analysis of accuracy and suitability of the adhesive failure criteria is performed. 2 Criteria of initiation of interfacial failure In the literature, few researchers use a criterion of initiation of interfacial failure for predicting failure onset in adhesive joints. This is due to the difficulty to handle stress singularities and to identify the parameters in the failure criterion. Most of the tests which may help to identify these parameters exhibit edge effects and a large scattering of the results of maximum load appear owing to the high sensitivity of manufacturing defects. Recently, Cognard et al. [9] made a modification of the classical Arcan test in order to vanish the edge effects and to cause failure at the centre of adhesive joints. The authors tested several load directions and observed both adhesive and cohesive failures. In Figure 1, the failure envelope obtained for aluminium substrates and an epoxy adhesive (Vantico Redux 420) is shown. In this Figure, τ and σ are the interfacial shear and normal stresses, respectively. A moderate scattering of results is observed. We assume that the failure is initiated by an interfacial crack. Let us analyse the accuracy of the following failure criteria:
• a quadratic stress criterion 2 2
1 1caτ σ τ+ = (1)
where 1a and 1cτ are material parameters;
3
• a new criterion that we propose since it may fit better the experimental data of the failure envelope:
( )222 2
caτ σ τ+ = (2)
where 2a and 2cτ are material parameters.
A least square method provides the values of the parameters in Equations (1) and (2) for obtaining the best fit of the experimental values with each failure criterion (see Figure 1). One may notice that the quadratic criterion in Equation (1) is not adequate for small positive values of σ and the prediction is even worse for negative values of σ . This is due to the insensitivity of the failure criterion to the sign of the peel stress. With the second criterion, the strength is sensitive to the sign of the peel stress. This new criterion fits well the experimental data (see Figure 1) and will be used in section 3 of this paper to predict failure initiation in adhesive joints.
Figure 1: Failure envelope of the adhesive joints tested in [9]. In real world applications, stress singularities exist at the intersection of interfaces with edges. The prediction of strength joints by means of the calculation of maximum stresses and substituting these values in the strength criteria in Equations (1) and (2) is not appropriate since the predicted strength is zero. When dealing with stress singularities, a maximum stress failure criterion is not suitable. In [10], Crocombe et al calculate interfacial stresses at a characteristic distance from the stress singularity points in order to predict crack initiation in an adhesively bonded joint subjected to two types of loading conditions. This validation of the criterion is rather poor since only two loading conditions were considered. In [11], the authors calculate the stress intensity factors in order to predict edge delaminations in scarf joints. In [7], the authors predict the failure onset in single lap composite joints by computing average peel σ and shear stresses τ over a characteristic length and adopting an arbitrary quadratic stress criterion as follows:
(MPa)
(MPa
)
[9]
4
2 2
2 2 1X Yσ τ
+ =
G G
(3)
where X and Y are properties of the interface. This criterion is similar to that introduced by Brewer and Lagace [6] for free edge delaminations in composite laminates. In fact, much more delamination criteria have been proposed for composite laminates than for adhesive joints. For example, criteria involving the energy released by delamination have been already applied for delamination initiation for composite laminates [12] but not for adhesive joints. Recently, Leguillon [8] proposed an original approach to predict free edge delamination initiation in composite laminates. Leguillon exposes first how an energy criterion may help to predict failure onset. The calculation of strain energy release rate is not appropriate since it is zero at failure onset. Failure onset is caused by the appearance of a non-zero length crack. This crack appears in an unstable manner and Leguillon proposes to use the following energy criterion:
( ) ( )0p pinc cW A WG G
A−
= − = (4)
where A is the area of the crack, ( )pW A is the potential energy in the cracked
structure, ( )0pW is the potential energy in the uncracked structure, incG is the
incremental strain energy release rate and cG is the critical strain energy release rate (a property of the interface related to its toughness). Notice that incG is equivalent to the strain energy release rate when A tends to zero. Leguillon proves then that a sole criterion (an energy criterion or a maximum stress criterion) do not suffice to predict failure onset in any geometry or loading condition. The author proves that in order to create a crack of area A, both conditions must be verified: the incremental strain energy condition in Equation (4) and a maximum stress criterion (similar to those in Equations (1) and (2)) at every point where the crack appears. In [13], Martin et al show that the use of these two conditions predicts accurately thickness and stacking sequence effects on delamination initiation. In this paper, we analyse the accuracy and suitability of three types of interfacial failure onset criteria:
• Criterion 1 is the average stress criterion in Equation (3) • Criterion 2 is a mixed criterion involving simultaneously an energy
condition and a quadratic stress condition: ( ) 1
2 21 1
inc c
c
G A G and
a at each point of surface A just before failureonsetτ σ τ
⎧ =⎪⎨
+ ≥⎪⎩
• Criterion 3 is another mixed criterion but with a stress condition similar to that in Equation (2):
( )
( )2
222 2
.
inc c
c
G A G and
a at each point of surface A just before failureonsetτ σ τ
⎧ =⎪⎨
+ =⎪⎩
5
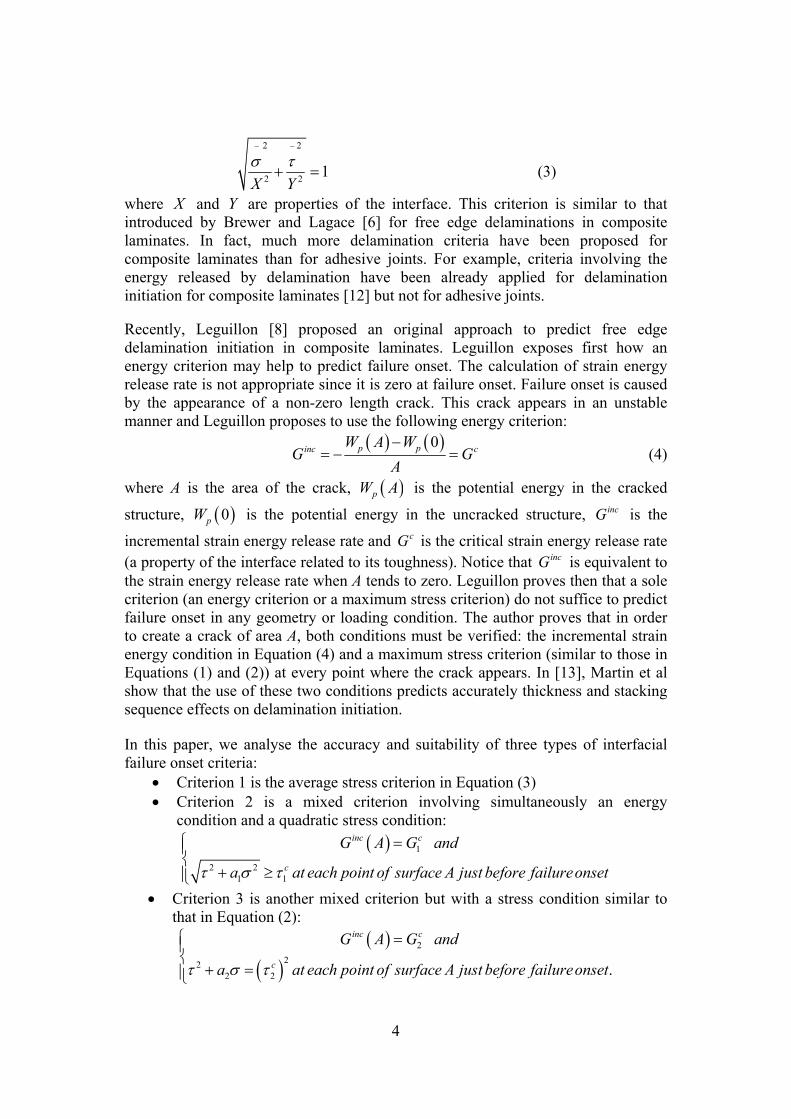
The parameters appearing in this criterion will be determined by means of a comparison with experimental results. 3 Experimental data The accuracy of the three failure criteria selected is evaluated by comparing the predictions obtained for the strength of butt joints tested by Mendoza [4] and Madrid [5]: tests A and B, respectively. In [4], cylindrical steel substrates were bonded with a polyester adhesive and the joint was subjected to a combination of tensile and torsional loads (tests A). In Figure 2, the geometry of the specimens tested and the material elastic properties are displayed. The diameter of the specimens is D =10.4mm. In Table 1, the critical loads measured at delamination onset are shown. Mendoza inspected with a microscope the specimens tested and proved that no cohesive failure occurred. The author reported that adhesive failure occurred spontaneously with an abrupt sound and caused the fracture of the specimens.
Figure 2: Geometry of butt joints in tests A [4]
Test Axial Force (KN) Torque (Nm) A1 1.130 – 1.083 0 A2 0.650 2.438 A3 0.773 3.127 A4 0.523 3.040 A5 0.434 4.251 A6 0.193 3.421 A7 0 4.824 – 4.745
Table 1: Measured loads at failure for tests A [4]
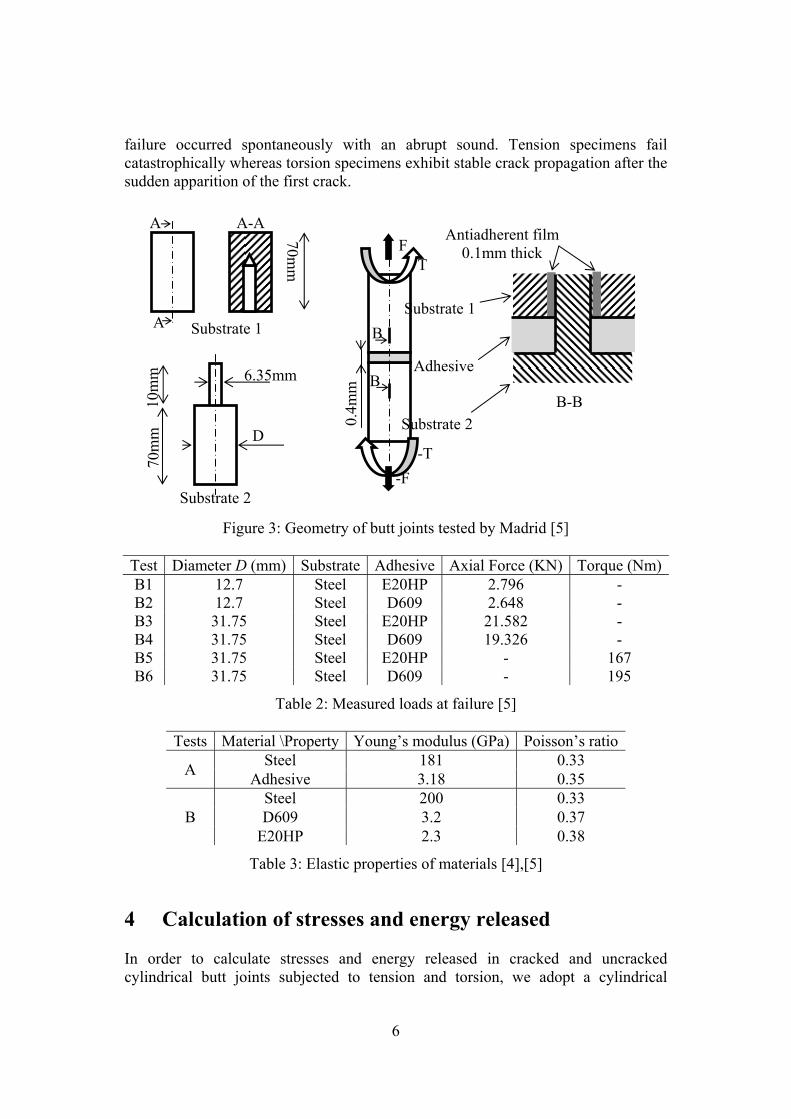
In [5], Madrid performed tests with different butt joints subjected to pure tensile and pure torsional loads. This author considered two types of epoxy adhesives (Hysol D609 and Loctite E20HP) and steel substrates. The geometries considered are displayed in Figure 3. Two values of diameter D were considered: 12.7mm and 31.75mm. A cylindrical guide fixed to one of the substrates assures a perfect coaxiality of the two substrates. Madrid covered the guide with an antiadherent film to avoid the introduction of adhesive in the guide cavity (see Figure 3). Owing to the guide and film, an inner free edge is to be considered in the calculations. In Table 2, the average failure loads among a set of 5 specimens for each test type are shown. The upper interface in Figure 3 fails in every test. Madrid reported that adhesive
11.4mm
6
failure occurred spontaneously with an abrupt sound. Tension specimens fail catastrophically whereas torsion specimens exhibit stable crack propagation after the sudden apparition of the first crack.
Figure 3: Geometry of butt joints tested by Madrid [5]
Test Diameter D (mm) Substrate Adhesive Axial Force (KN) Torque (Nm)B1 12.7 Steel E20HP 2.796 - B2 12.7 Steel D609 2.648 - B3 31.75 Steel E20HP 21.582 - B4 31.75 Steel D609 19.326 - B5 31.75 Steel E20HP - 167 B6 31.75 Steel D609 - 195
Table 2: Measured loads at failure [5]
Tests Material \Property Young’s modulus (GPa) Poisson’s ratio
A Steel 181 0.33 Adhesive 3.18 0.35
B Steel 200 0.33 D609 3.2 0.37
E20HP 2.3 0.38
Table 3: Elastic properties of materials [4],[5]
4 Calculation of stresses and energy released In order to calculate stresses and energy released in cracked and uncracked cylindrical butt joints subjected to tension and torsion, we adopt a cylindrical
A
A
A-A
Substrate 1
10m
m
70mm
Substrate 2
6.35mm
D
70m
m
0.4m
m
Substrate 2
Substrate 1
TF
-F -T
Adhesive
B
BB-B
Antiadherent film 0.1mm thick
7
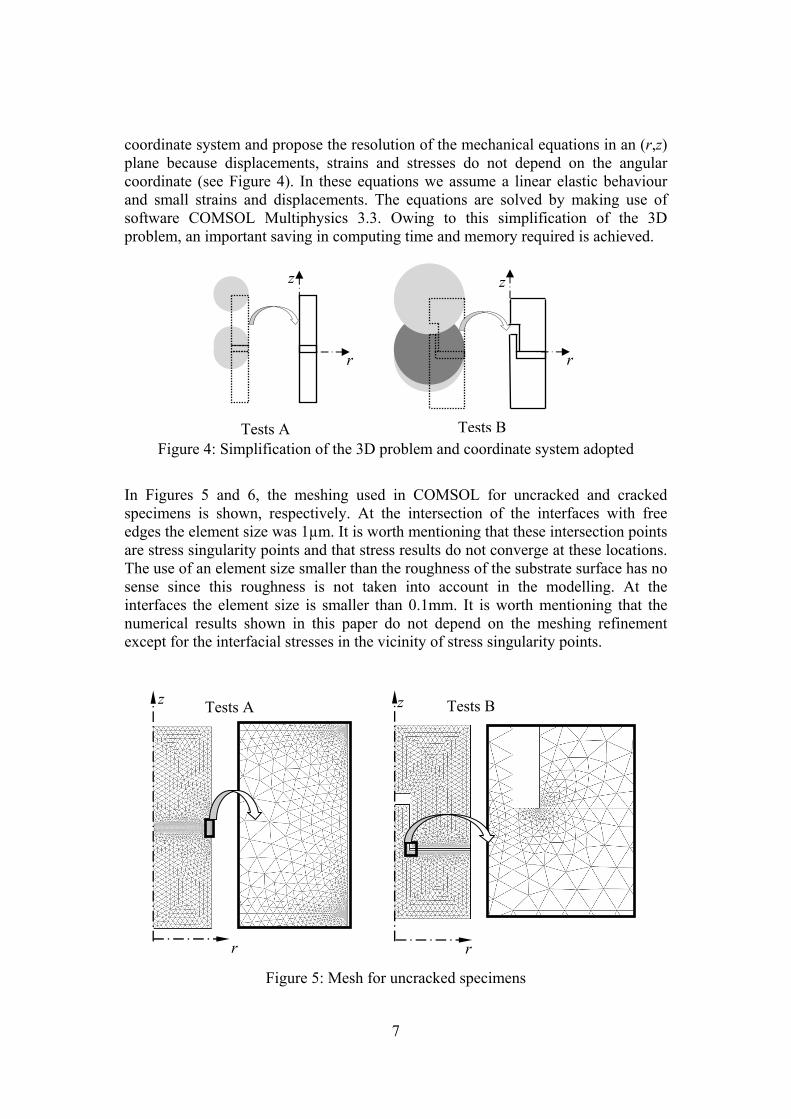
coordinate system and propose the resolution of the mechanical equations in an (r,z) plane because displacements, strains and stresses do not depend on the angular coordinate (see Figure 4). In these equations we assume a linear elastic behaviour and small strains and displacements. The equations are solved by making use of software COMSOL Multiphysics 3.3. Owing to this simplification of the 3D problem, an important saving in computing time and memory required is achieved.
Figure 4: Simplification of the 3D problem and coordinate system adopted
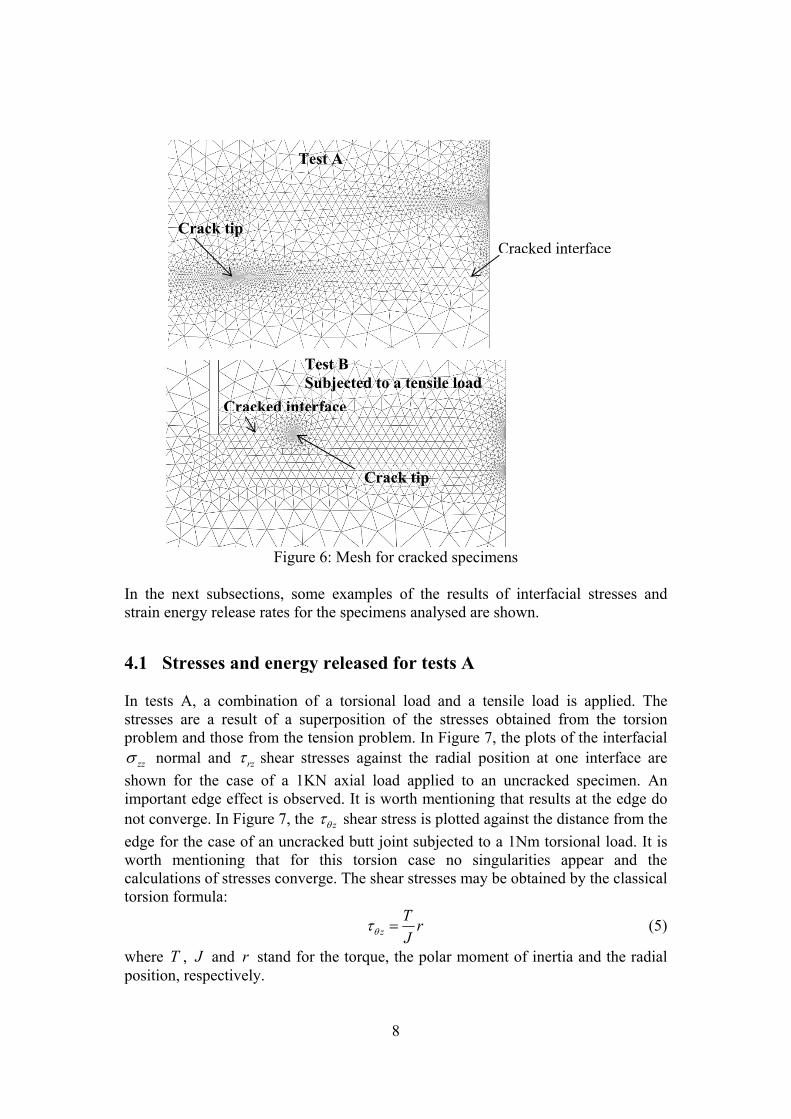
In Figures 5 and 6, the meshing used in COMSOL for uncracked and cracked specimens is shown, respectively. At the intersection of the interfaces with free edges the element size was 1µm. It is worth mentioning that these intersection points are stress singularity points and that stress results do not converge at these locations. The use of an element size smaller than the roughness of the substrate surface has no sense since this roughness is not taken into account in the modelling. At the interfaces the element size is smaller than 0.1mm. It is worth mentioning that the numerical results shown in this paper do not depend on the meshing refinement except for the interfacial stresses in the vicinity of stress singularity points.
Figure 5: Mesh for uncracked specimens
z z
r r
Tests A Tests B
r
z
Tests A
z
r
Tests B
8
Figure 6: Mesh for cracked specimens
In the next subsections, some examples of the results of interfacial stresses and strain energy release rates for the specimens analysed are shown.
4.1 Stresses and energy released for tests A In tests A, a combination of a torsional load and a tensile load is applied. The stresses are a result of a superposition of the stresses obtained from the torsion problem and those from the tension problem. In Figure 7, the plots of the interfacial
zzσ normal and rzτ shear stresses against the radial position at one interface are shown for the case of a 1KN axial load applied to an uncracked specimen. An important edge effect is observed. It is worth mentioning that results at the edge do not converge. In Figure 7, the zθτ shear stress is plotted against the distance from the edge for the case of an uncracked butt joint subjected to a 1Nm torsional load. It is worth mentioning that for this torsion case no singularities appear and the calculations of stresses converge. The shear stresses may be obtained by the classical torsion formula:
zT rJθτ = (5)
where T , J and r stand for the torque, the polar moment of inertia and the radial position, respectively.
Cracked interface Crack tip
Test A
Test B Subjected to a tensile load
Cracked interface
Crack tip
9
Figure 7: Interfacial normal and shear stresses (test A)
Whatever the loading condition applied, interfacial stresses are greater at the edge of the specimen. The calculations of incremental strain energy release rates are thus based on the consideration of a circumferential crack with a constant depth l in the radial direction. This depth is measured from the edge of the specimen to the crack front (see upper image in Figure 6). As proposed by Leguillon [8], we calculate the incremental strain energy release rate incG as follows:
( ) ( )
( )0
,p pinc W W lG
A l−
=
where ( )0pW is the potential energy in the uncracked specimen, ( )pW l is the
potential energy in the specimen with a crack of depth l, ( ) A l is the area of the
crack. In Figure 8, the incremental strain energy release rate incG is plotted against the depth l for the two loading conditions: tension and torsion. Constant displacement restrictions are considered in the calculations of the strain energy release rates. The displacement values correspond to the displacements obtained with uncracked specimens subjected to a 1KN tensional load or a 1Nm torsional load. In Figure 8, the curve of incG against the crack depth is not monotonic whereas that of the energy released is monotonic increasing. This is due to the fact that incG is the energy released divided by the area of the crack. 4.2 Stresses and strain energy release rates for tests B In tests B, there is not a combination of a torsion and tension. For simplicity sake, we consider only the example of the steel substrate and D609 adhesive. Similar results are obtained for the other substrate and adhesive combinations.
due to a 1KN tension load due to a 1KN tension load due to a 1Nm torsion load
(mm)
(MPa
) and
(MPa)
10
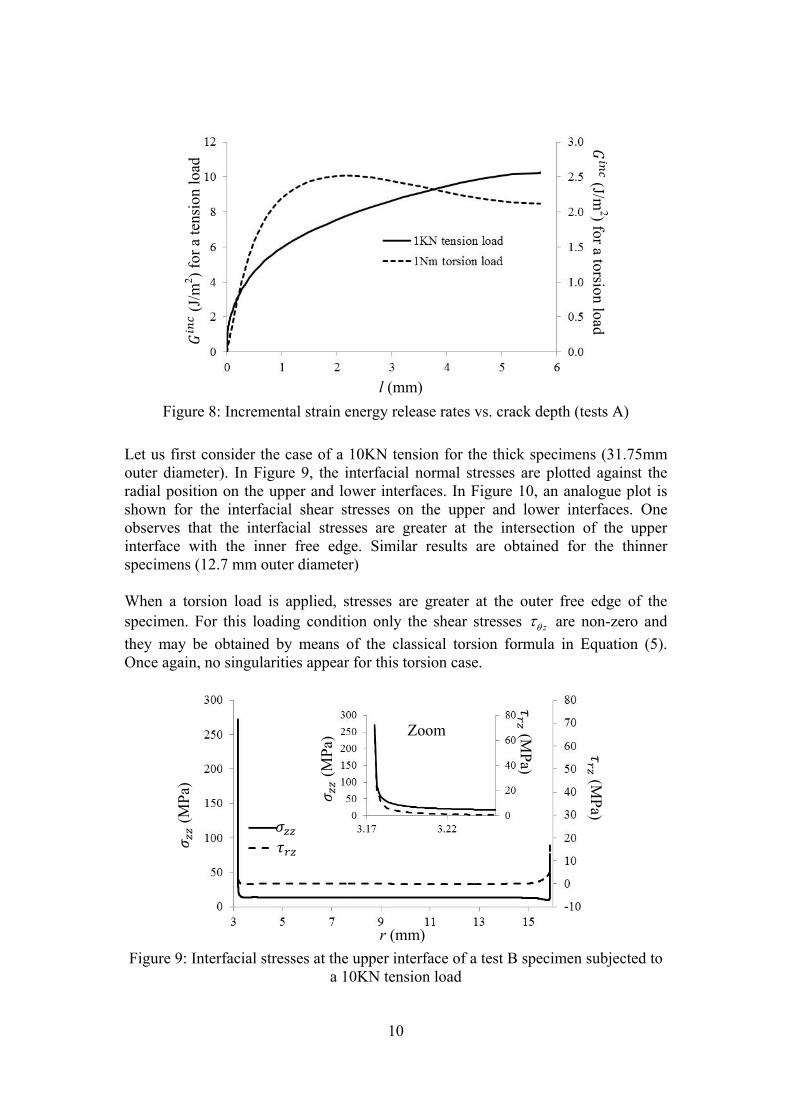
Figure 8: Incremental strain energy release rates vs. crack depth (tests A)
Let us first consider the case of a 10KN tension for the thick specimens (31.75mm outer diameter). In Figure 9, the interfacial normal stresses are plotted against the radial position on the upper and lower interfaces. In Figure 10, an analogue plot is shown for the interfacial shear stresses on the upper and lower interfaces. One observes that the interfacial stresses are greater at the intersection of the upper interface with the inner free edge. Similar results are obtained for the thinner specimens (12.7 mm outer diameter) When a torsion load is applied, stresses are greater at the outer free edge of the specimen. For this loading condition only the shear stresses zθτ are non-zero and they may be obtained by means of the classical torsion formula in Equation (5). Once again, no singularities appear for this torsion case.
Figure 9: Interfacial stresses at the upper interface of a test B specimen subjected to
a 10KN tension load
Zoom
(MPa
) (M
Pa)
(MPa
)
(MPa)
r (mm)
l (mm)
(J/m
2 ) for
a te
nsio
n lo
ad
(J/m2) for a torsion load
11
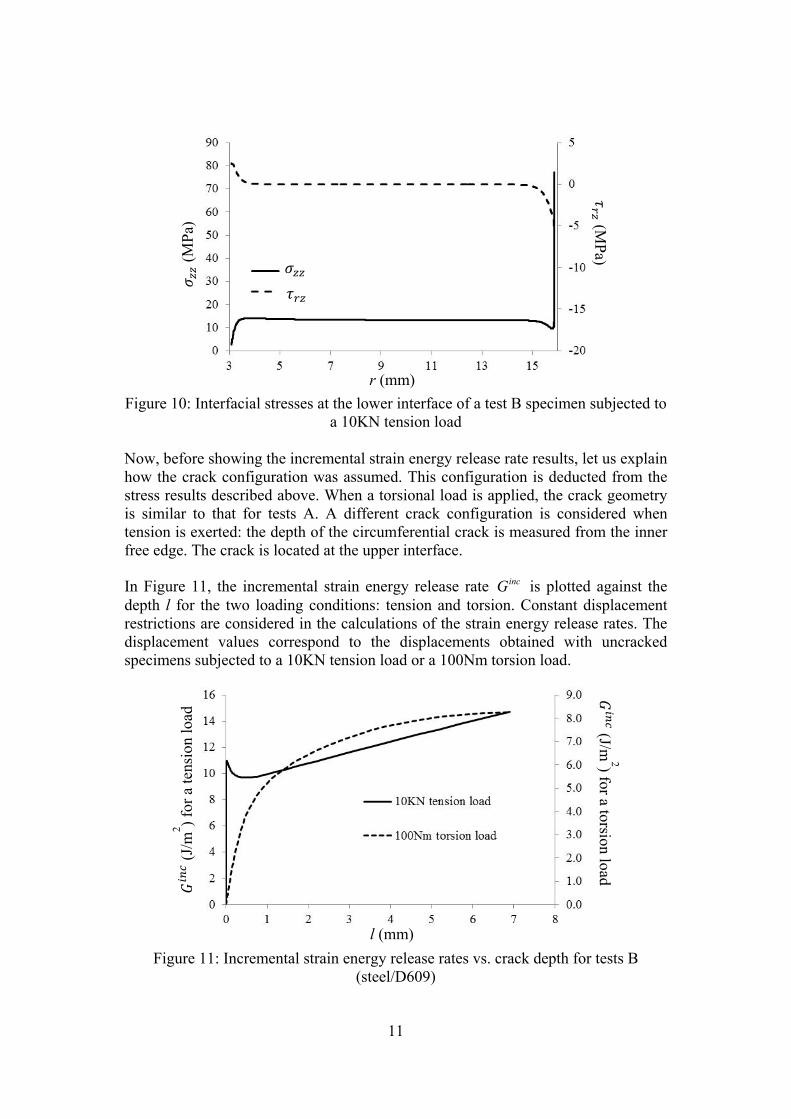
Figure 10: Interfacial stresses at the lower interface of a test B specimen subjected to
a 10KN tension load Now, before showing the incremental strain energy release rate results, let us explain how the crack configuration was assumed. This configuration is deducted from the stress results described above. When a torsional load is applied, the crack geometry is similar to that for tests A. A different crack configuration is considered when tension is exerted: the depth of the circumferential crack is measured from the inner free edge. The crack is located at the upper interface. In Figure 11, the incremental strain energy release rate incG is plotted against the depth l for the two loading conditions: tension and torsion. Constant displacement restrictions are considered in the calculations of the strain energy release rates. The displacement values correspond to the displacements obtained with uncracked specimens subjected to a 10KN tension load or a 100Nm torsion load.
Figure 11: Incremental strain energy release rates vs. crack depth for tests B
(steel/D609)
(J/m
2 ) for
a te
nsio
n lo
ad
(J/m2) for a torsion load
l (mm)
(MPa
) (MPa)
r (mm)
12
5 Analysis of the accuracy and suitability of the failure criteria
In this section, for a given point located at the radial position r we define its distance ρ to the singularity point with greatest stress intensity as follows:
2D rρ = − for tests B5 and B6, (tests B subjected to torsion, see Table 2) and tests
A, inr Dρ = − for the rest of tests B; where inD stands for the internal diameter
(6.35mm). 5.1 Failure prediction Let us first describe the methods applied to predict failure initiation with the failure criteria. We consider the example of a test A with a monotically increasing proportional loading. The torque T and the axial tension force F are proportional:
( )F Qcos Fω=G
and ( )T Qsin Tω=G
,
where ω is a constant, Q is the adimensional loading parameter, 1F KN=G
and
1T Nm=G
. In this example, ω is 4π . By means of the results of the finite element
software COMSOL it is possible to determine the interfacial stresses for each value
of the radial position r. For tests A, 2D rρ = − is the distance to the free edge.
5.1.1 Predictions with an average stress criterion (criterion 1)
In this approach, the average interfacial normal stress σG
and the average interfacial
shear stress τG
are respectively defined by
( )( ) ( )( )
2 2
2 22 2
2 2 r R r R
rz zzz
r R r R
r dr and r drR R R R
θ
δ δ
τ τσσ τδ δ
= =
= − = −
+= =
− − − −∫ ∫
G G
where δ =24μm is a characteristic distance from the singularity point (a property of the interface), R=5.7mm is the radius of the specimens. The parameters in criterion 1 (Equation (3)) are X=16.8MPa and Y=14.2MPa.
For 1Q = , COMSOL yields
2 2
2 2X Yσ τ
+
G G
=0.72. The critical load that would lead to
failure initiation is then cQ =1.39 (i.e. F =0.985KN , T =0.985Nm ).
13
5.1.2 Predictions with a mixed criterion For simplicity sake, we consider the example of the quadratic stress condition 2 2 caτ σ τ+ = where cτ =14.5MPa, and a =3.17. The critical strain energy release rate cG is 2.73J/m2. Let us define the critical load ( )Qσ ρ as the minimum positive load required to obtain
( )2 2 2( ) ( ) ( ) crz z zzaθτ ρ τ ρ σ ρ τ+ + = .
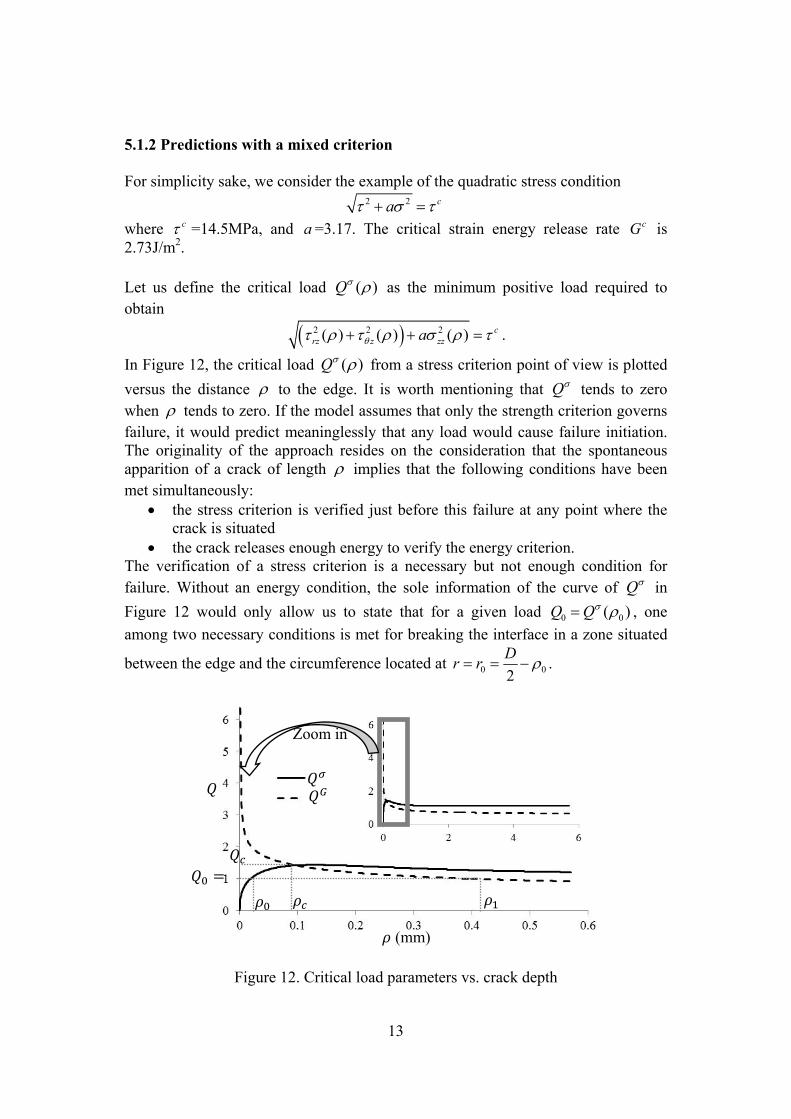
In Figure 12, the critical load ( )Qσ ρ from a stress criterion point of view is plotted versus the distance ρ to the edge. It is worth mentioning that Qσ tends to zero when ρ tends to zero. If the model assumes that only the strength criterion governs failure, it would predict meaninglessly that any load would cause failure initiation. The originality of the approach resides on the consideration that the spontaneous apparition of a crack of length ρ implies that the following conditions have been met simultaneously:
• the stress criterion is verified just before this failure at any point where the crack is situated
• the crack releases enough energy to verify the energy criterion. The verification of a stress criterion is a necessary but not enough condition for failure. Without an energy condition, the sole information of the curve of Qσ in Figure 12 would only allow us to state that for a given load 0 0( )Q Qσ ρ= , one among two necessary conditions is met for breaking the interface in a zone situated
between the edge and the circumference located at 0 02Dr r ρ= = − .
Figure 12. Critical load parameters vs. crack depth
(mm)
Zoom in
14
Now, let us show how the energy criterion is applied. Owing to COMSOL calculations, for a given loading parameter 1Q the incremental strain energy release rate 1 ( )incG ρ related to an interfacial crack connecting the free edge and a point
located at the radial position 2Dr ρ= − is calculated. The critical load ( )GQ ρ
required to obtain ( )inc cG Gρ = is then
( ) 11 ( )
cG
inc
GQ QG
ρρ
= .
This critical load ( )GQ ρ from an energy point of view is the minimum load required to create a spontaneous interfacial crack of depth ρ . In Figure 13, the critical load ( )GQ ρ is plotted versus the depth ρ . If only the energy criterion
inc cG G= governed failure initiation, the load that would cause failure would be
2G DQ ⎛ ⎞⎜ ⎟⎝ ⎠
and the crack would separate the specimen into two pieces. Nevertheless,
the stress condition for breaking the whole interface is not met since
2 2G D DQ Qσ⎛ ⎞ ⎛ ⎞<⎜ ⎟ ⎜ ⎟⎝ ⎠ ⎝ ⎠
.
Now, let us analyze failure initiation by making use of the stress and energy criteria simultaneously. In Figure 12, we observe that the curves of GQ and Qσ intersect at
cρ ρ= = 96.2μm and cQ Q= = 1.4149. For a loading level such that cQ Q< ,
0Q Q= may cause a small crack (depth 0 cρ ρ< ) from a stress point of view but this crack would not release enough energy to verify the energy criterion since
0 0( ) ( ) GQ Qσρ ρ> . Besides, for this same value of the load parameter 0Q Q= the load may be enough to create from an energy point of view a larger crack of depth
1ρ but not from a stress point of view since the stress criterion is not verified for
0ρ ρ> (see Figure ). Now, if the load parameter Q increases and attains cQ , the load is enough to create a cρ deep crack from stress and energy point of views. For this load value, a deeper crack may not appear since the stress criterion is not verified for cρ ρ> and a smaller crack cannot appear because the released energy would not be enough to verify the energy criterion. The value of the load parameter that would cause failure initiation is then cQ =1.4149 (i.e. F =1KN , T =1Nm).
It is worth mentioning that in the above example the curves of GQ and Qσ intersect. If in a particular prediction this does not happen (the curve of GQ is in this case above the curve of Qσ for any crack size), the minimum value of GQ would provide the critical load that would cause failure onset. In this case, the stress condition is met at any point of the interface before that the energy condition is fulfilled.
15
5.2 Accuracy and suitability of the failure criteria 5.2.1 Failure predictions for tests A The parameters appearing in the criteria were identified by comparing the predictions with the experimental measurements in Table 1 and by applying a least square method. The following parameter values were obtained: δ =24μm, X=16.8MPa and Y=14.2MPa for the average stress criterion (criterion 1),
1 cτ =14.5MPa, 1a =3.17 and 1cG = 2.73J/m2 for the mixed criterion involving a
quadratic stress condition (criterion 2), 2 cτ =18.1MPa, 2a =32.6MPa and 2
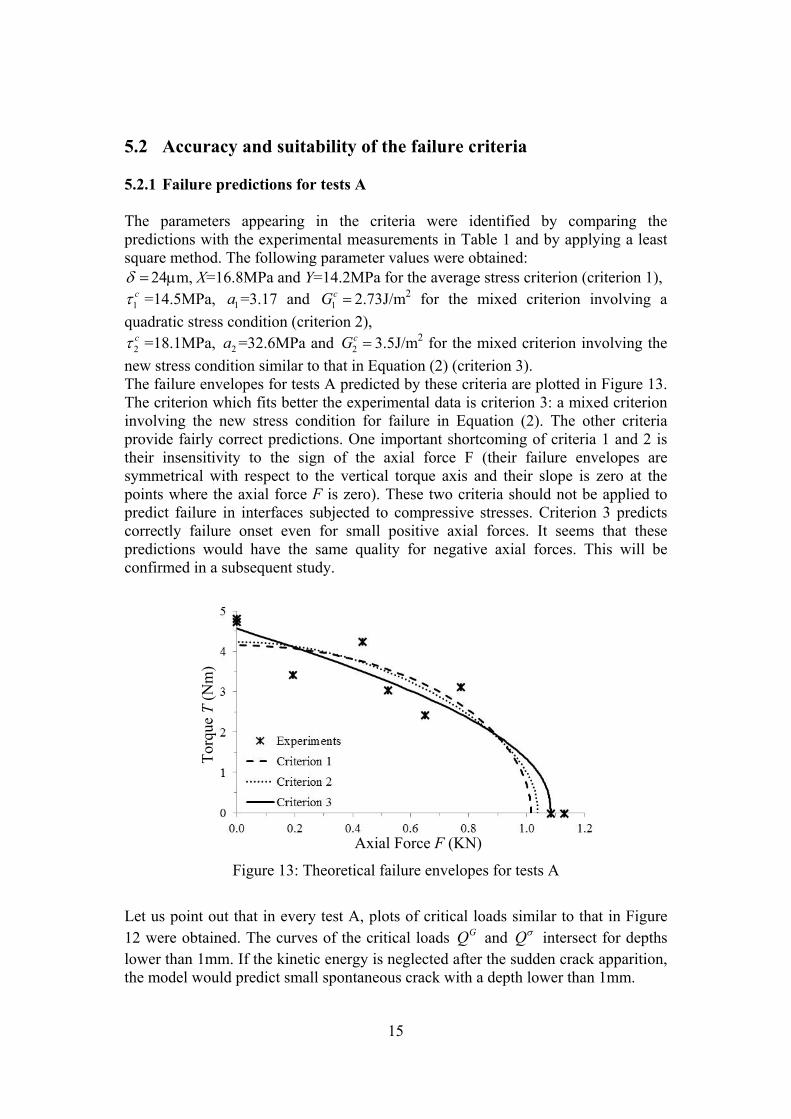
cG = 3.5J/m2 for the mixed criterion involving the new stress condition similar to that in Equation (2) (criterion 3). The failure envelopes for tests A predicted by these criteria are plotted in Figure 13. The criterion which fits better the experimental data is criterion 3: a mixed criterion involving the new stress condition for failure in Equation (2). The other criteria provide fairly correct predictions. One important shortcoming of criteria 1 and 2 is their insensitivity to the sign of the axial force F (their failure envelopes are symmetrical with respect to the vertical torque axis and their slope is zero at the points where the axial force F is zero). These two criteria should not be applied to predict failure in interfaces subjected to compressive stresses. Criterion 3 predicts correctly failure onset even for small positive axial forces. It seems that these predictions would have the same quality for negative axial forces. This will be confirmed in a subsequent study.
Figure 13: Theoretical failure envelopes for tests A
Let us point out that in every test A, plots of critical loads similar to that in Figure 12 were obtained. The curves of the critical loads GQ and Qσ intersect for depths lower than 1mm. If the kinetic energy is neglected after the sudden crack apparition, the model would predict small spontaneous crack with a depth lower than 1mm.
Axial Force F (KN)
Torq
ue T
(Nm
)
16
5.2.2 Failure predictions for tests B In [5], tests B exhibit more complex geometries than tests A since two specimen radii were considered and the position of the point with the greatest stress singularity changes if a torsion load is applied instead of a tension one. Three tests B were carried out for two types of interfaces: E20HP/steel and D609/steel (see Table 2). Each criterion analyzed in the previous subsection for tests A required the identification of three interface parameters so as to be applied in a failure onset prediction. An identification of these parameters for E20HP/steel and D609/steel interfaces would not be reliable enough to evaluate the accuracy of each criterion owing to the small amount of tests B. However this identification will help to analyze qualitatively the suitability of the criteria for predicting failure onset in different geometries.
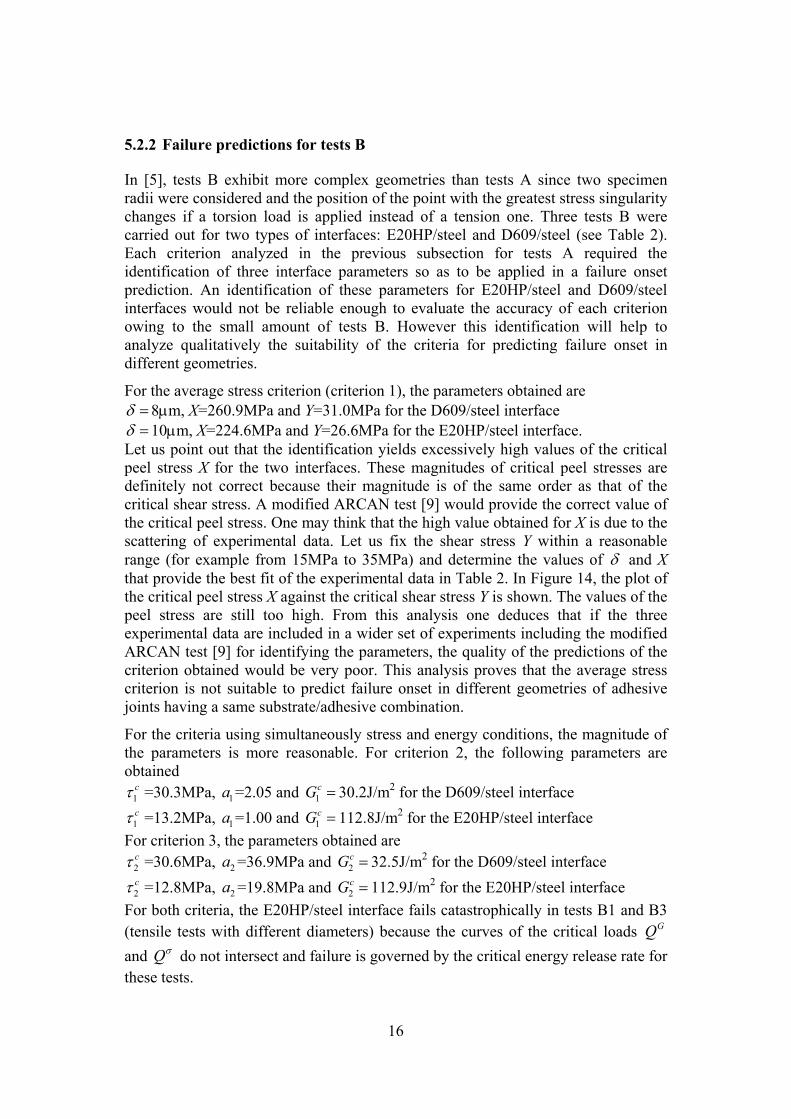
For the average stress criterion (criterion 1), the parameters obtained are δ =8μm, X=260.9MPa and Y=31.0MPa for the D609/steel interface δ =10μm, X=224.6MPa and Y=26.6MPa for the E20HP/steel interface. Let us point out that the identification yields excessively high values of the critical peel stress X for the two interfaces. These magnitudes of critical peel stresses are definitely not correct because their magnitude is of the same order as that of the critical shear stress. A modified ARCAN test [9] would provide the correct value of the critical peel stress. One may think that the high value obtained for X is due to the scattering of experimental data. Let us fix the shear stress Y within a reasonable range (for example from 15MPa to 35MPa) and determine the values of δ and X that provide the best fit of the experimental data in Table 2. In Figure 14, the plot of the critical peel stress X against the critical shear stress Y is shown. The values of the peel stress are still too high. From this analysis one deduces that if the three experimental data are included in a wider set of experiments including the modified ARCAN test [9] for identifying the parameters, the quality of the predictions of the criterion obtained would be very poor. This analysis proves that the average stress criterion is not suitable to predict failure onset in different geometries of adhesive joints having a same substrate/adhesive combination.
For the criteria using simultaneously stress and energy conditions, the magnitude of the parameters is more reasonable. For criterion 2, the following parameters are obtained
1 cτ =30.3MPa, 1a =2.05 and 1cG = 30.2J/m2 for the D609/steel interface
1 cτ =13.2MPa, 1a =1.00 and 1cG = 112.8J/m2 for the E20HP/steel interface
For criterion 3, the parameters obtained are 2 cτ =30.6MPa, 2a =36.9MPa and 2
cG = 32.5J/m2 for the D609/steel interface
2 cτ =12.8MPa, 2a =19.8MPa and 2cG = 112.9J/m2 for the E20HP/steel interface
For both criteria, the E20HP/steel interface fails catastrophically in tests B1 and B3 (tensile tests with different diameters) because the curves of the critical loads GQ and Qσ do not intersect and failure is governed by the critical energy release rate for these tests.
17
Figure 14: Theoretical tensile strength X vs. shear strength Y using criterion 1
After this analysis, it seems that the mixed criteria (criteria 2 and 3) are suitable for predicting failure initiation of an interface in different geometries.
6 Conclusion In conclusion, the accuracy and suitability of three criteria of initiation of adhesive failure (delamination) were analysed by comparing their predictions to experimental results published previously in [4,5]. The first criterion is an average stress criterion. The other criteria are based on Leguillon’s approach [8] to predict failure onset in notched specimens. In this approach, failure onset is governed by a mixed criterion involving simultaneously stress and energy conditions. This mixed criterion has not been yet applied to predict adhesive failure initiation in adhesive joints. The second criterion studied in this paper involves a classical quadratic expression of the interfacial stresses. The third criterion differs from the second one in the stress condition since it involves an original stress condition which fits correctly the experimental measurements carried out by Cognard et al in [9]. This condition has not been published before and models correctly the benign effect of negative normal stresses on interfacial strength. The identification of the parameters in each criterion and the failure prediction were accomplished by means of a finite element resolution. The analysis of the failure onset predictions for the butt joint tests carried out by Mendoza in [4] allowed determining that the third criterion studied fits better the experimental failure envelope. In these tests, a same geometry of butt joints was subjected to different loading conditions. The other criteria provided fairly correct predictions. The parameters in each criterion were also identified for the butt joint tests carried out by Madrid in [5]. In these tests the geometries and the loading conditions varied. The first criterion (an average stress criterion) is not suitable to predict failure initiation in these tests because of the different geometries considered.
D609/Steel E20HP/Steel
Y (MPa)
X (M
Pa)
18
The results in this paper may constitute an important advance on the development of new tools and the better selection of criteria to predict the initiation of adhesive failure in adhesively bonded joints. Acknowledgements The authors wish to acknowledge CONACYT (grant no. CB-2007-01 79467 002) and US AIR FORCE (award no. FA9550-09-1-0394) for their financial support. References [1] McCarthy JC, “Failure criteria for adhesive joints, an industry briefing”, AEA
Technology, May, 1999. [2] D. Castagnetti, E. Dragoni, A. Spaggiari, “Failure analysis of bonded T-peel
joints: Efficient modelling by standard finite elements with experimental validation”, International Journal of Adhesion and Adhesives, 30(5), 306-312, 2010.
[3] S. Xu, D.A. Dillard, J.G. Dillard, “Environmental aging effects on the durability of electrically conductive adhesive joints”, International Journal of Adhesion and Adhesives, 23(3), 235-250, 2003.
[4] L.E. Mendoza, “Falla de interfase de uniones adhesivas”, PhD Thesis, Centro de Investigación en Materiales Avanzados S.C., 2011.
[5] M.A. Madrid, “Determinación de criterios de falla de interfase de uniones adhesivas”, Master’s Degree Thesis, Universidad Autónoma de Chihuahua, 2011.
[6] J. Brewer, P. Lagace, “Quadratic stress criterion for initiation of delamination,” Journal of Composite Materials, 22(12), 1141–1155, 1988.
[7] K.S. Kim, Y.M. Yi, G.R. Cho, C.G. Kim, “Failure prediction and strength improvement of uni-directional composite single lap bonded joints”, Composite Structures, 82(4), 513-520, 2008.
[8] D. Leguillon, “Strength or toughness? A criterion for crack onset at a notch”, European Journal of Mechanics - A/Solids, 21(1), 61-72, 2002.
[9] J.Y. Cognard, P. Davies, B. Gineste, L. Sohier, “Development of an improved adhesive test method for composite assembly design”, Composites Science and Technology, 65(3-4), 359-368, 2005.
[10] A.D. Crocombe, G. Richardson, P.A. Smith, “A Unified Approach for Predicting the Strength of Cracked and Non-Cracked Adhesive Joints”, The Journal of Adhesion, 49(3-4), 211-244, 1994.
[11] Z. Qian, A. R. Akisanya, “An experimental investigation of failure initiation in bonded joints”, Acta Materialia, 46(14), 4895-4904, 1998.
[12] D. Leguillon, G. Marion, R. Harry, F. Lécuyer, “The onset of delamination at stress-free edges in angle-ply laminates - analysis of two criteria”, Composites Science and Technology, 61(3), 377-382, 2001.
[13] E. Martin, D. Leguillon, N. Carrère, “A twofold strength and toughness criterion for the onset of free-edge shear delamination in angle-ply laminates”, International Journal of Solids and Structures, 47(9), 1297-1305, 2010.


![Parallel Robots with Homokinetic Joints: The Zero-Torsion Case · Parallel Robots with Homokinetic Joints 3 (a) (b) Fig.2. Design implementation of a Ojoint [10]. (a) Home con guration;](https://img.pdfslide.us/doc/110x75/5fc63010b7e9a523ac6d1f43/parallel-robots-with-homokinetic-joints-the-zero-torsion-case-parallel-robots-with.jpg)