Embed Size (px)
Citation preview
This article was downloaded by: [University of Strathclyde]On: 03 October 2014, At: 18:00Publisher: Taylor & FrancisInforma Ltd Registered in England and Wales Registered Number: 1072954Registered office: Mortimer House, 37-41 Mortimer Street, London W1T 3JH, UK
Hydrological Sciences JournalPublication details, including instructions for authors andsubscription information:http://www.tandfonline.com/loi/thsj20
Analysis of a Sahelian annual rainfallindex from 1896 to 2000; thedrought continuesYANN L'HÔTE a , GIL MAHÉ b , BONAVENTURE SOMÉ c & JEANPIERRE TRIBOULET da IRD, Maison des Sciences de l'Eau , BP 64501, F-34394,Montpellier, cedex 5, France E-mail:b IRD Hydrologie , 01 BP 182, Ouagadougou, Burkina Faso E-mail:c Centre Régional Agrhymet , BP 11011, Niamey, Nigerd Direction de l'Hydraulique , BP 4931, Nouakchott,République Islamique de MauritaniePublished online: 29 Dec 2009.
To cite this article: YANN L'HÔTE , GIL MAHÉ , BONAVENTURE SOMÉ & JEAN PIERRE TRIBOULET(2002) Analysis of a Sahelian annual rainfall index from 1896 to 2000; the drought continues,Hydrological Sciences Journal, 47:4, 563-572, DOI: 10.1080/02626660209492960
To link to this article: http://dx.doi.org/10.1080/02626660209492960
PLEASE SCROLL DOWN FOR ARTICLE
Taylor & Francis makes every effort to ensure the accuracy of all the information (the“Content”) contained in the publications on our platform. However, Taylor & Francis,our agents, and our licensors make no representations or warranties whatsoeveras to the accuracy, completeness, or suitability for any purpose of the Content. Anyopinions and views expressed in this publication are the opinions and views of theauthors, and are not the views of or endorsed by Taylor & Francis. The accuracyof the Content should not be relied upon and should be independently verifiedwith primary sources of information. Taylor and Francis shall not be liable for anylosses, actions, claims, proceedings, demands, costs, expenses, damages, and otherliabilities whatsoever or howsoever caused arising directly or indirectly in connectionwith, in relation to or arising out of the use of the Content.
This article may be used for research, teaching, and private study purposes. Anysubstantial or systematic reproduction, redistribution, reselling, loan, sub-licensing,systematic supply, or distribution in any form to anyone is expressly forbidden.Terms & Conditions of access and use can be found at http://www.tandfonline.com/page/terms-and-conditions
Dow
nloa
ded
by [
Uni
vers
ity o
f St
rath
clyd
e] a
t 18:
00 0
3 O
ctob
er 2
014
Hydrological Sciences-Journat-des Sciences Hydrologiques, 47(4) August 2002 553
Analysis of a Sahelian annual rainfall index from 1896 to 2000; the drought continues
YANN L'HOTE IRD, Maison des Sciences de l'Eau, BP 64501, F-34394 Montpellier cedex 5. France vann.lhote@msem. univ-montp2.fr
GIL MAHÉ IRD Hydrologie, 01 BP 182, Ouagadougou, Burkina Faso [email protected]
BONAVENTURE SOME Centre Régional Agrhymet, BP 11011, Niamey, Niger
JEAN PIERRE TRIBOULET Direction de l'Hydraulique, BP 4931, Nouakchott, République Islamique de Mauritanie
Abstract Since 1970 the West African Sahel has experienced a significant drought which, according to some authors, corresponds to a discontinuity (abrupt change) in the rainfall series. An annual rainfall index was calculated over the period from 1896 to 2000, with a selection of 21 synoptic stations updated regularly by the Agrhymet Regional Centre in Niamey. Several statistical analyses of the index confirmed the previous descriptions, particularly the significance of the drought since 1970 and a nonstationarity, with abrupt change in the series between 1969 and 1970. Although the two recent wet years, 1994 and 1999, gave some hope of an end to the drought, the statistical results and the temporal distribution of the dry and wet years showed that the drought was not over at the end of 2000.
Key words Sahel; rainfall; drought index; nonstationarity; discontinuity
Analyse d'un indice des précipitations annuelles au Sahel sur la période 1896-2000; la sécheresse n'est pas terminée Résumé Depuis 1970 le Sahel ouest africain connaît une sécheresse importante correspondant, selon certains auteurs, à une discontinuité dans les séries pluviométriques. Un indice des précipitations annuelles a été calculé sur la période 1896-2000 à partir d'une sélection de 21 stations synoptiques suivies en permanence par le Centre Régional Agrhymet de Niamey. Les analyses statistiques des valeurs annuelles de l'indice ont confirmé les schémas déjà décrits, en particulier l'importance de la sécheresse depuis 1970 et la non-stationnarité de la série avec une rupture entre 1969 et 1970. Malgré les deux années humides récentes 1994 et 1999 qui ont apporté un espoir de rémission de la sécheresse, les différents tests statistiques et la répartition dans le temps des années sèches et humides ont permis de conclure que la sécheresse n'était pas encore terminée en fin 2000.
Mots clefs Sahel; précipitations; indice de sécheresse; rupture
INTRODUCTION
In the West African Sahel, knowledge about the long-term variability and trend of rainfall is important because of the extreme vulnerability of the environment where the climate can be roughly defined by annual rainfall within 300 to 700 mm (L'Hôte et al.,
Open for discussion until 1 February 2003
Dow
nloa
ded
by [
Uni
vers
ity o
f St
rath
clyd
e] a
t 18:
00 0
3 O
ctob
er 2
014
564 Yann L'Hôte et al
1996). The main results of rainfall studies in this region can help decision makers to manage, e.g. water resources, agriculture, environmental protection, water projects.
The Sahel has experienced a fairly continuous, severe drought since 1970, described and analysed by numerous authors (e.g. Sircoulon, 1976; Lamb, 1982, 1985; Olivry, 1983; Nicholson, 1985; NOAA, 1994; Le Barbé & Lebel, 1997; Nicholson et al, 2000), showing diagrams of annual rainfall index series commonly used by decision makers.
According to Hubert et al. (1989, 1998) numerous stations in the Sahel have shown discontinuities in annual rainfall series around 1970. As a consequence, the averages calculated with data before and after 1970 are not statistically similar. The latest 30-year WMO standard over the years 1971-2000 takes into account only the three driest decades of the 20th century. Therefore, with regard to the 1971-2000 average, many of the wet years observed after 1970 are actually dry years in terms of longer averages. On the basis of the latest WMO average, some experts thought that the drought in the Sahel might be over, or on the way to being so (personal communications). Numerous contacts with decision makers in Africa show that such a raised hope may result in decisions being made that are too optimistic.
In this paper, a new annual rainfall index series, updated from 1896 to 2000, is analysed, calculated on the basis of previous studies (Lamb, 1985; Nicholson, 1985; NOAA, 1994).
METHOD AND DATA
The values of an annual rainfall index from 1896 to 2000 are provided, as well as other related values thought to be particularly relevant, as follows: (a) 21 synoptic stations, updated regularly by the Agrhymet Regional Centre of
Niamey, were selected, enabling regular updating of the index. (b) A longest (being also a most recent) period, compared to those of the previous
studies, was selected. Historical data were found in old reports that are not readily available, all published values were checked and, finally, a critical analysis of these values was performed.
(c) A common 80-year reference period was selected (1921-2000), because of the low level of missing data (2.6%) and good representativeness for the climate in the Sahel. For each station, s, and year, y, the partial station index, Ssy is its standardized
rainfall departure:
Ssy^(Rxr-Rs)/as (1)
where Rsv, Rs and as are the annual rainfall of station s for year y, and the mean annual rainfall and standard deviation of station s in the reference period 1921-2000.
Finally, the regional annual index, RIV for each year, v, is the average of partial indexes of the n stations observed during this year:
i »
RI = -Ysn. " .! = !
Dow
nloa
ded
by [
Uni
vers
ity o
f St
rath
clyd
e] a
t 18:
00 0
3 O
ctob
er 2
014
Analysis of a Sahelian annual rainfall index from 1896 to 2000 565
In previous studies, with about one hundred stations available in the sub-region of interest, Nicholson et al. (1985, 2000) calculated an index based on the periods 1901— 1984 and 1901-1998, taking the observation times of each station as the periods of reference. Lamb (1985) published an index, known by his name, calculated on the period 1941-1983, taking into account 20 stations well spread west of the meridian 9°E, between 11° and 18°N. Finally, NOAA (1994) published an index based on the rainy season (May-September) of 1921-1994, calculated using all the available stations having at least 30 years of historical records, and located in Africa, between 8° and 18°N, and west of 20°E.
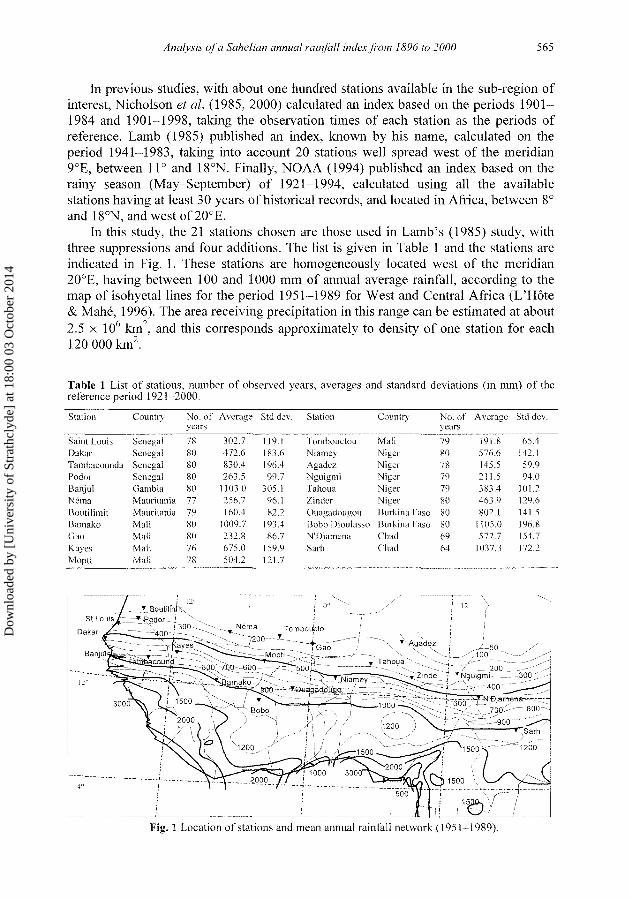
In this study, the 21 stations chosen are those used in Lamb's (1985) study, with three suppressions and four additions. The list is given in Table 1 and the stations are indicated in Fig. 1. These stations are homogeneously located west of the meridian 20°E, having between 100 and 1000 mm of annual average rainfall, according to the map of isohyetal lines for the period 1951-1989 for West and Central Africa (L'Hôte & Mahé, 1996). The area receiving precipitation in this range can be estimated at about 2.5 x 10⁶ km", and this corresponds approximately to density of one station for each 120 000 km2.
Table 1 List of stations, number of observed years, averages and standard deviations (in mm) of the reference period 1921-2000.
Station
Saint Louis Dakar Tambacounda Podor Banjul Néma Boutilimit Bamako Gao Kaves Mopti
Country
Senegal Senegal Senega] Senega] Gambia Mauritania Mauritania Mali Mali Mali Mali
No. of years
78 80 80 80 80 77 79 80 80 76 78
Average
302.7 472.6 830.4 263.5
1103.0 256.7 160.4
1009.7 232.8 675.0 504.2
Std dev.
119.1 183.6 196.4 99.7
305.1 96.1 82.2
193.4 86.7
159.9 121.7
Station
Tombouctou Niamey Agadez Nguigmi Tahoua Zinder Ouagadougou Bobo Dioulasso N'Djamena Sarh
Country
Mali Niger Niger Niaer Niger Niger Burkina Faso Burkina Faso Chad Chad
No. of years
79 80 78 79 79 80 80 80 69 64
Average
191.8 576.6 145.5 211.5 383.4 463.9 802.1
1105.0 577.7
1037.3
Std dev.
65.4 142.1 59.9 94.0
101.2 129.6 141.5 196.8 154.7 172.2
Fig. 1 Location of stations and mean annual rainfall network (1951-1989).
Dow
nloa
ded
by [
Uni
vers
ity o
f St
rath
clyd
e] a
t 18:
00 0
3 O
ctob
er 2
014
566 Yann L'Hôte et al.
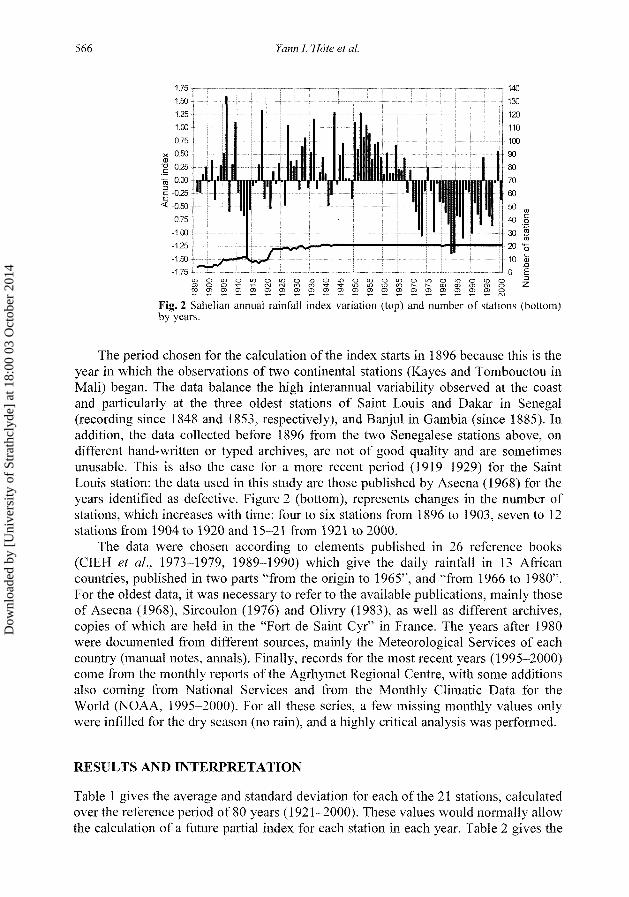
Fig. 2 Sahelian annual rainfall index variation (top) and number of stations (bottom) by years.
The period chosen for the calculation of the index starts in 1896 because this is the year in which the observations of two continental stations (Kayes and Tombouctou in Mali) began. The data balance the high interannual variability observed at the coast and particularly at the three oldest stations of Saint Louis and Dakar in Senegal (recording since 1848 and 1853, respectively), and Banjul in Gambia (since 1885). In addition, the data collected before 1896 from the two Senegalese stations above, on different hand-written or typed archives, are not of good quality and are sometimes unusable. This is also the case for a more recent period (1919-1929) for the Saint Louis station: the data used in this study are those published by Asecna (1968) for the years identified as defective. Figure 2 (bottom), represents changes in the number of stations, which increases with time: four to six stations from 1896 to 1903, seven to 12 stations from 1904 to 1920 and 15-21 from 1921 to 2000.
The data were chosen according to elements published in 26 reference books (CIEH et al., 1973-1979, 1989-1990) which give the daily rainfall in 13 African countries, published in two parts "from the origin to 1965", and "from 1966 to 1980". For the oldest data, it was necessary to refer to the available publications, mainly those of Asecna (1968), Sircoulon (1976) and Olivry (1983), as well as different archives, copies of which are held in the "Fort de Saint Cyr" in France. The years after 1980 were documented from different sources, mainly the Meteorological Services of each country (manual notes, annals). Finally, records for the most recent years (1995-2000) come from the monthly reports of the Agrhymet Regional Centre, with some additions also coming from National Services and from the Monthly Climatic Data for the World (NOAA, 1995-2000). For all these series, a few missing monthly values only were infilled for the dry season (no rain), and a highly critical analysis was performed.
RESULTS AND INTERPRETATION
Table 1 gives the average and standard deviation for each of the 21 stations, calculated over the reference period of 80 years (1921-2000). These values would normally allow the calculation of a future partial index for each station in each year. Table 2 gives the
Dow
nloa
ded
by [
Uni
vers
ity o
f St
rath
clyd
e] a
t 18:
00 0
3 O
ctob
er 2
014
Analysis of a Sahelian annual rainfall index from 1896 to 2000 567
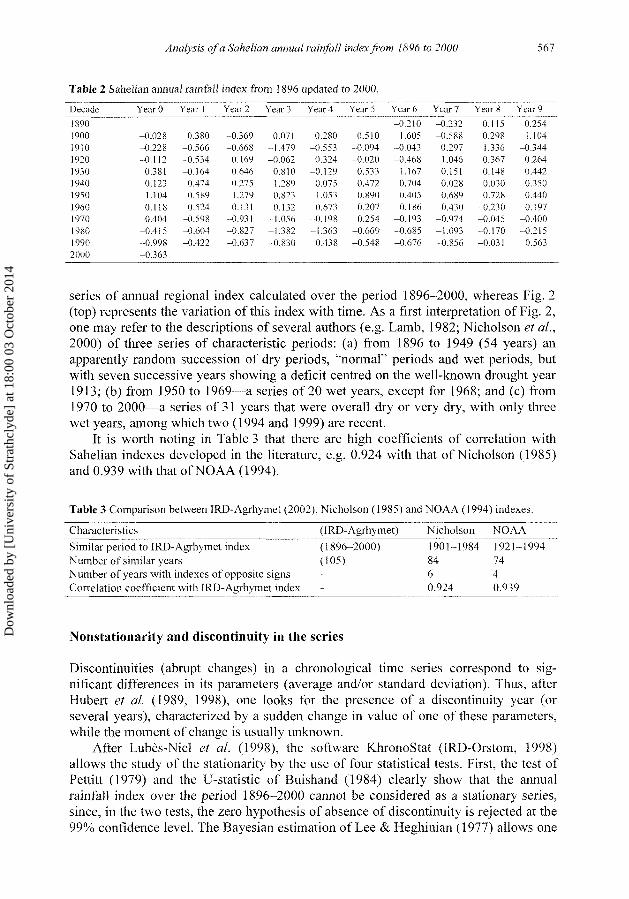
Table 2 Sahelian annual rainfall index from 1896 updated to 2000.
Decade
1890 1900 1910 1920 1930 1940 1950 1960 1970 1980 1990 2000
YearO
-0.028 -0.228 -0.112
0.381 0.123 1.104 0.118
-0.404 -0.415 -0.998 -0.363
Year 1
0.380 -0.566 -0.534 -0.164 -0.474
0.589 0.524
-0.598 -0.604 -0.422
Year 2
-0.369 -0.668
0.169 0.646
-0.275 1.279 0.131
-0.931 -0.827 -0.637
Year 3
0.071 -1.479 -0.062
0.810 1.289 0.823 0.132
-1.056 -1.382 -0.830
Year 4
0.280 -0.553
0.324 -0.129 -0.075
1.053 0.673
-0.198 -1.363
0.438
Year 5
0.510 -0.094 -0.020
0.533 0.472 0.890 0.207 0.254
-0.669 -0.548
Year 6
-0.210 1.605
-0.043 -0.468
1.167 0.704 0.405 0.186
-0.193 -0.685 -0.676
Year 7
-0.232 -0.588
0.297 1.046
-0.151 0.028 0.689 0.430
-0.974 -1.093 -0.856
Year 8
0.115 0.298 1.336 0.367 0.148 0.030 0.728
-0.230 -0.045 -0.170 -0.031
Year 9
0.254 1.104
-0.344 0.264 0.442
-0.350 0.440 0.197
-0.400 -0.215
0.563
series of annual regional index calculated over the period 1896-2000, whereas Fig. 2 (top) represents the variation of this index with time. As a first interpretation of Fig. 2, one may refer to the descriptions of several authors (e.g. Lamb, 1982; Nicholson et al., 2000) of three series of characteristic periods: (a) from 1896 to 1949 (54 years) an apparently random succession of dry periods, "normal" periods and wet periods, but with seven successive years showing a deficit centred on the well-known drought year 1913; (b) from 1950 to 1969—a series of 20 wet years, except for 1968; and (c) from 1970 to 2000—a series of 31 years that were overall dry or very dry, with only three wet years, among which two (1994 and 1999) are recent.
It is worth noting in Table 3 that there are high coefficients of correlation with Sahelian indexes developed in the literature, e.g. 0.924 with that of Nicholson (1985) and 0.939 with that of NOAA (1994).
Table 3 Comparison between IRD-Agrhymet (2002), Nicholson (1985) and NOAA (1994) indexes.
Characteristics (IRD-Agrhymet) Nicholson NOAA Similar period to IRD-Agrhymet index (1896-2000) 1901-1984 1921-1994 Number of similar years (105) 84 74 Number of years with indexes of opposite signs - 6 4 Correlation coefficient with IRD-Agrhymet index - 0.924 0.939
Nonstationarity and discontinuity in the series
Discontinuities (abrupt changes) in a chronological time series correspond to significant differences in its parameters (average and/or standard deviation). Thus, after Hubert et al. (1989, 1998), one looks for the presence of a discontinuity year (or several years), characterized by a sudden change in value of one of these parameters, while the moment of change is usually unknown.
After Lubès-Niel et al. (1998), the software KhronoStat (IRD-Orstom, 1998) allows the study of the stationarity by the use of four statistical tests. First, the test of Pettitt (1979) and the U-statistic of Buishand (1984) clearly show that the annual rainfall index over the period 1896-2000 cannot be considered as a stationary series, since, in the two tests, the zero hypothesis of absence of discontinuity is rejected at the 99% confidence level. The Bayesian estimation of Lee & Heghinian (1977) allows one
Dow
nloa
ded
by [
Uni
vers
ity o
f St
rath
clyd
e] a
t 18:
00 0
3 O
ctob
er 2
014
568 Yann L'Hôte et al.
to detect a clear discontinuity in the record between 1969 and 1970 with a very high posterior probability density of 0.383. Finally, the procedure of segmentation of Hubert et al. (1989) with a significance level of the test of Scheffé at 1%, points out only one abrupt change (between 1969 and 1970). The test of Hubert with this significance level can be considered as adequate. Applying this test to the series referenced over all the years before and after 1921 (instead of the common period 1921-2000), two other discontinuity points were detected, before and after the drought of 1913, but no discontinuity has been noted since 1970. Hence no sign of an end of the drought has been observed until 2000.
Furthermore, applying these four tests on each of the 21 stations one often finds the same dates of discontinuity. For instance, using Hubert's segmentation, 12 stations show one discontinuity between 1966 and 1970 (modal value in 1969) spread all over the area.
It is worth mentioning that Mahé & Olivry (1999, 2001) found a discontinuity point between 1969 and 1970 for the series of regional rainfall over the period 1951— 1989 for the whole of West and Central Africa (tropical and equatorial areas). In contrast, according to Aka et al. (1996), Servat et al. (1997) and Mahé & Olivry (1999), the series of discharges of the large regional rivers (e.g. Niger, Congo, Ogooué) show a later discontinuity point (between 1970 and 1971) for the majority of them. Paradoxically, this discontinuity appears earlier (1967-1968) in the northwest of the area (Senegal and Fouta-Djalon Mountains).
Geographical extent of drought
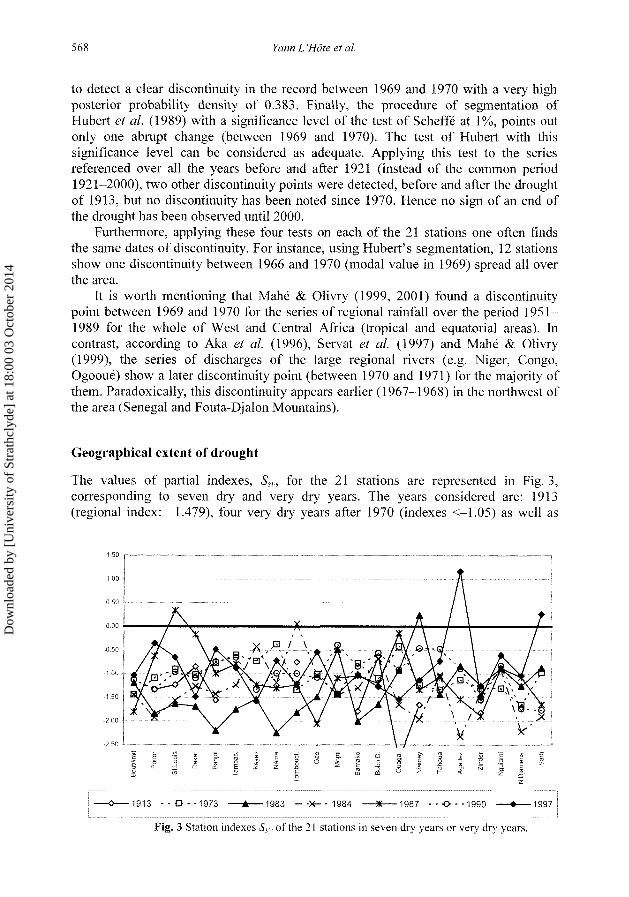
The values of partial indexes, Ssv, for the 21 stations are represented in Fig. 3, corresponding to seven dry and very dry years. The years considered are: 1913 (regional index: -1.479), four very dry years after 1970 (indexes <—1.05) as well as
1913 - - 0 - - 1 9 7 3 * 1983 — - X - - 1984 3K 1987 - - O - - 1 9 9 0 • 1997
Fig. 3 Station indexes Ssv of the 21 stations in seven dry years or very dry years.
Dow
nloa
ded
by [
Uni
vers
ity o
f St
rath
clyd
e] a
t 18:
00 0
3 O
ctob
er 2
014
Analysis of a Sahelian annual rainfall index from 1896 to 2000 569
1990 (-0.998) and 1997 (-0.856). One can see that the majority of the 137 values are under zero with only five positive indexes, among which two occurred in 1997 (at Agadez and Sarh). The majority of the indexes (130 out of 137) have values lower than -0.35. Out of 21 stations, 11 stations during the exceptional year 1983 and seven in 1984 experienced a serious drought with indexes below -1.50. These observations show that drought of concern was not only very strong but also largely spread over the area. According to Sircoulon (1976) this criterion of extent characterizes the periods of drought in the Sahel.
Among the four recent dry years (1995, 1996, 1997 and 2000), i.e. out of 84 station-years, there are 11 indexes close to the average (from -0.25 to 0) and 12 wet years (>0) among which five are greater than 0.5, and one year was very wet (>1). This shows that the criterion of wide extent, which characterizes the droughts in the Sahel, does not seem to be as marked since 1994.
Persistence of dry or wet spells over several years, autocorrelation
One can see (Fig. 2) three dry episodes, centred on 1913, 1973 and 1983-1984, and a long series of humid years in the 1950s and 1960s. By restricting the analysis in an arbitrary way to dry or wet periods of at least five years duration, the following persistences are clearly shown: a deficit from 1910 to 1916 (7 years), an excess from 1950 to 1967 (18 years), a deficit from 1970 to 1974 (5 years) and a deficit from 1976 to 1993 (18 years).
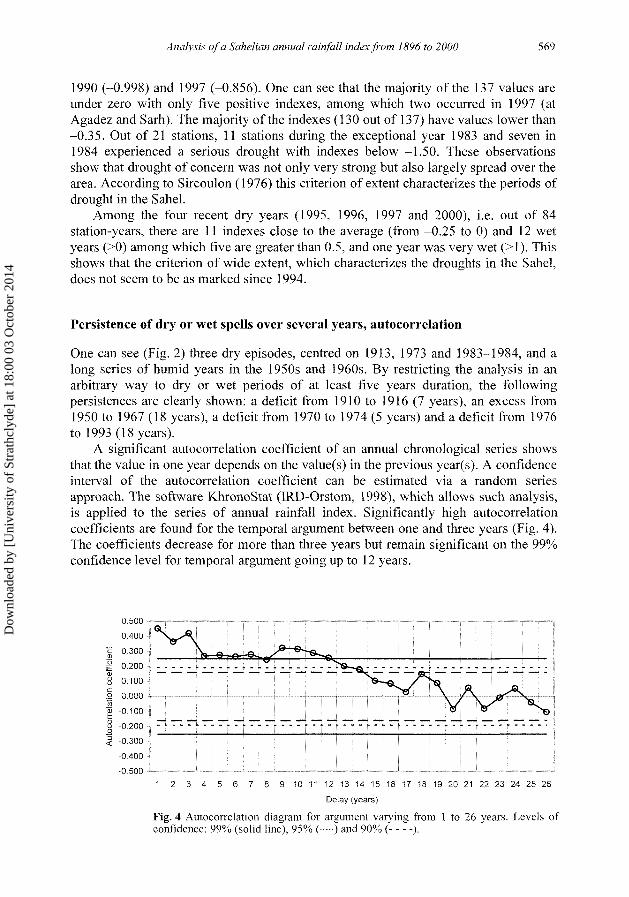
A significant autocorrelation coefficient of an annual chronological series shows that the value in one year depends on the value(s) in the previous year(s). A confidence interval of the autocorrelation coefficient can be estimated via a random series approach. The software KhronoStat (IRD-Orstom, 1998), which allows such analysis, is applied to the series of annual rainfall index. Significantly high autocorrelation coefficients are found for the temporal argument between one and three years (Fig. 4). The coefficients decrease for more than three years but remain significant on the 99% confidence level for temporal argument going up to 12 years.
0.500
0.400
0-300 V ^ a = = a = ^
| 0.200 -<D —
8 0.100
J o.ooo "m £ -0.100
§ -0.200 | ~-~-~-~-~-~-~-~-~-~-~-~-~-~-~-~-~-~-~-~-~-~-~-~-~-'• j
| -0.300 I j -0.400 |
-0.500 • • — — . _ _ _ _ _ !
1 2 3 4 5 6 7 8 9 10 11 12 13 14 15 16 17 18 19 20 21 22 23 24 25 26
Delay (years)
Fig. 4 Autocorrelation diagram for argument varying from 1 to 26 years. Levels of confidence: 99% (solid line), 95% ( ) and 90% ( ).
Dow
nloa
ded
by [
Uni
vers
ity o
f St
rath
clyd
e] a
t 18:
00 0
3 O
ctob
er 2
014
5 70 Yann L'Hôte et al.
Furthermore, applying this method to each of the 21 stations, one finds several significant coefficients of autocorrelation, especially for one and two years (13 and nine stations, respectively), and until five and even ten years (four and two stations). Nevertheless these stations do not show any spatial organization.
The drought was still going on at the end of 2000
Several symptoms have been noted which were interpreted by some experts as a possible indicator of the tendency of termination of drought. Indeed, three wet years (1975, 1994 and 1999) have occurred since 1970, but they were always separated from
1.00 - —-,
0.80 j
0.60 |
0.40
0.20
0 . 0 0 j i i ii ' i
-0.20
-0.40
-0.60
-0.80
-1.00 J i
1900- 1910- 1920- 1930- 1940- 1950- 1960- 1970- 1980- 1990-1909 1919 1929 1939 1949 1959 1969 1979 1989 1999
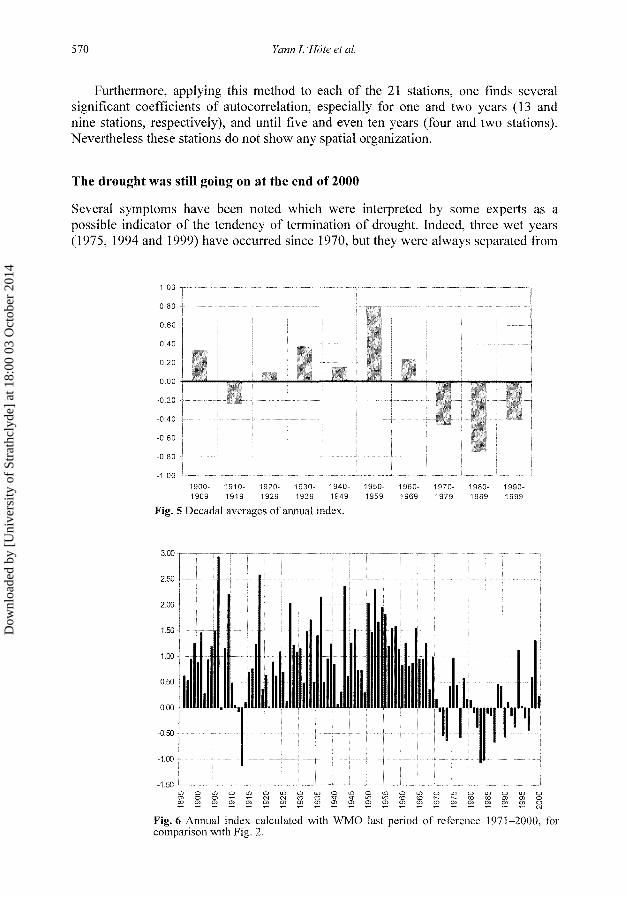
Fig. 5 Decadal averages of annual index.
-0.50 I ) I
-1.00
-1.50 L n o i n o i n o i o O L O O u ^ O L f i o t n o m o m o i o o O J O O ^ T - C N C N C O C O - ^ - ^ l - L D L n c û C O t ^ E ^ C O O D O T C n O
c o a > a > o > a > c 7 > c 7 > C T > C T > a > a s c n a > a 3 c n c B a i m a i c n O T O
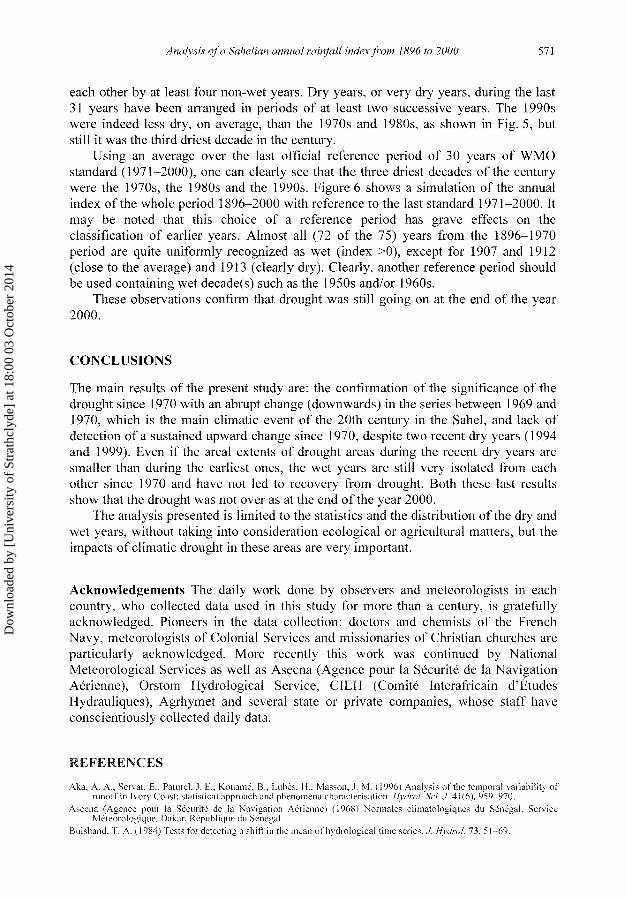
Fig. 6 Annual index calculated with WMO last period of reference 1971-2000, for comparison with Fig. 2.
Dow
nloa
ded
by [
Uni
vers
ity o
f St
rath
clyd
e] a
t 18:
00 0
3 O
ctob
er 2
014
Analysis of a Sahelian annual rainfall index from 1896 to 2000 571
each other by at least four non-wet years. Dry years, or very dry years, during the last 31 years have been arranged in periods of at least two successive years. The 1990s were indeed less dry, on average, than the 1970s and 1980s, as shown in Fig. 5, but still it was the third driest decade in the century.
Using an average over the last official reference period of 30 years of WMO standard (1971-2000), one can clearly see that the three driest decades of the century were the 1970s, the 1980s and the 1990s. Figure 6 shows a simulation of the annual index of the whole period 1896-2000 with reference to the last standard 1971-2000. It may be noted that this choice of a reference period has grave effects on the classification of earlier years. Almost all (72 of the 75) years from the 1896-1970 period are quite uniformly recognized as wet (index >0), except for 1907 and 1912 (close to the average) and 1913 (clearly dry). Clearly, another reference period should be used containing wet decade(s) such as the 1950s and/or 1960s.
These observations confirm that drought was still going on at the end of the year 2000.
CONCLUSIONS
The main results of the present study are: the confirmation of the significance of the drought since 1970 with an abrupt change (downwards) in the series between 1969 and 1970, which is the main climatic event of the 20th century in the Sahel, and lack of detection of a sustained upward change since 1970, despite two recent dry years (1994 and 1999). Even if the areal extents of drought areas during the recent dry years are smaller than during the earliest ones, the wet years are still very isolated from each other since 1970 and have not led to recovery from drought. Both these last results show that the drought was not over as at the end of the year 2000.
The analysis presented is limited to the statistics and the distribution of the dry and wet years, without taking into consideration ecological or agricultural matters, but the impacts of climatic drought in these areas are very important.
Acknowledgements The daily work done by observers and meteorologists in each country, who collected data used in this study for more than a century, is gratefully acknowledged. Pioneers in the data collection: doctors and chemists of the French Navy, meteorologists of Colonial Services and missionaries of Christian churches are particularly acknowledged. More recently this work was continued by National Meteorological Services as well as Asecna (Agence pour la Sécurité de la Navigation Aérienne), Orstom Hydrological Service, CIEH (Comité Interafricain d'Études Hydrauliques), Agrhymet and several state or private companies, whose staff have conscientiously collected daily data.
REFERENCES
Aka, A. A., Serval. E., Paturel, J. Il, Kouainé, B„ Lubes, H., Masson, J. M. (1996) Analysis of the temporal variability of runoff in Ivory Coast: statistical approach and phenomena characterisation. Hydrol Sci. J. 41(6), 959-970.
Asecna (Agence pour la Sécurité de la Navigation Aérienne) (1968) Normales climatologiques du Sénégal. Service Météorologique, Dakar, République du Sénégal.
Buishand, T. A. ( 1984) Tests for detecting a shift in the mean of hydrological time series. J. Hydro!. 73, 51 -69.
Dow
nloa
ded
by [
Uni
vers
ity o
f St
rath
clyd
e] a
t 18:
00 0
3 O
ctob
er 2
014
572 Yann L'Hôte et al.
Centre Régional Agrhymet (1995-2000) Bulletins mensuels Agrhymet, d'avril à septembre. Niamey. CIEH, Orstom Hydrologie (1973-1979) Précipitations journalières de l'origine des stations à 1965. Républiques du
Dahomey, Tchad, Côte d'Ivoire, Mali, Sénégal, Niger, Haute-Volta, Mauritanie, Togo, Gabon, Cameroun (début à 1972)—12 volumes. Orstom, Paris.
CIEH, Orstom Elydrologie, Asecna, Services Météorologiques Nationaux (1989-1990) Précipitations journalières de 1966 à 1980. Républiques du Dahomey, Tchad, Côte d'Ivoire, Mali, Sénégal, Niger, Haute-Volta, Mauritanie, Togo, Gabon, Cameroun—14 volumes. Orstom, Montpellier.
Hubert, P., Carbonnel, J. P. & Chaouche, A. (1989) Segmentation des séries hydrométéorologiques. Application à des séries de précipitations et de débits de l'Afrique de l'ouest. J. Hydro]. 1 10, 349-367.
Hubert, P., Servat, E., Paturel, J. E., Kouamé, B., Bendjoudi, J. P., Carbonnel, J. P., Eubès-Niel, H. (1998) La procédure de segmentation dix ans après. In: Water Resources Variability in Africa during the XXih Century (Proe. Abidjan Symp., November 1998), 267-273. IAHS Publ. no. 252.
IRD-Orslom (1998) KhronoSlat version 1.0. Logiciel, Orstom, Montpellier. Lamb, P. J. (1982) Persistence of Subsaharan drought. Nature 299, 46^17. Lamb, P. .1. (1985) Rainfall in Subsaharan West Africa during 1941-83. Z Gletscherk. Glazialgeoi. 21, 131-139. Le Barbé, L. & Lebel, T. (1997) Rainfall climatology of the Hapex-Sahel region during the years 1950-1990. J. Hydrol.
188-189, 43-73. Lee, A. F. S. & lleghinian, S. M. (1977) A shift of the mean level in a sequence of independent normal random variables:
a Bayesian approach. Teehnometrics 19(4), 503-506. L'Hôte, Y., Dubreuil, P. & Lerique, J. (1996) Carte des types de climats "en Afrique Noire à l'ouest du Congo". Rappels et
extension aux régimes hydrologiques. In: L 'hydrologie Tropicale: Géoscience et Outil Pour le Développement (Mélanges à la mémoire de Jean Rodier, Paris, mai 1995), 55-65. IAHS Publ. no. 238.
L'Hôte, Y. & Mahé, G. (1996) Afrique de l'ouest et centrale, précipitations moyennes annuelles (période 1951-1989). Carte à l'échelle 1/6 000 000. Orstom, Paris.
Lubès-Niel, H., Masson, J. M., Paturel, S. E. & Servat, E. (1998) Variabilité climatique et statistiques. Etude par simulation de la puissance et de la robustesse de quelques tests utilisés pour vérifier l'homogénéité de chroniques. Rev. Sei. Eau 11(3), 383-408.
Mahé, G. & Olivry, J. C. (1999) Assessment of freshwater yields to the ocean along the intertropical Atlantic coast of Africa. C. R. Acad. 5c/., Paris série II328, 621-626.
Mahé, G., L'Hôte, Y., Olivrv, J. C. & Wotliniî, G. (2001) Trends and discontinuities in regional rainfall of West and Central Africa: 1951-1989. Hydro!. Sei. J. 46(2), 211-226.
Nicholson, S. E. (1985) Sub-Saharan rainfall 1981-84.7. dim. Appl. Met. 24, 1388-1391. Nicholson, S. E., Some, B. & Kone, B. (2000) An analysis of recent rainfall conditions in West Africa, including the rainv
seasons of the 1997 El Nino and the 1998 La Nina years. J. Clim. 13(14), 2628 -2640. NOAA (1994) Special climate summary: wettest rainv season (May-September) since 1964 recorded across the western
half of the Sahel. Weekly Climate Bull. 94(42), 7-8. NOAA (1995-2000) Monthly Climatic Data for the World. National Climatic Data Center, Asheville, North Carolina,
USA. Olivry, J. C. (1983) Le point en 1982 sur l'évolution de la sécheresse en Sénégambic et aux Iles du Cap Vert. Examen de
quelques séries de longue durée (débits et précipitations). Call Orstom, sér Hydrol. XX( 1 ), 47-69. Paturel, J. E., Servat, H., Deiattre, M. O. & Lubes-Niel, H. (1998) Analyse de séries pluviométriques de longue durée en
Afrique de l'Ouest et Centrale non sahélienne dans un contexte de variabilité climatique. Hydrol. Sei. J. 43(6), 937-946.
Peltitt, A. N. (1979) A non-parametric approach to the change-point problem. Appl. Statist. 28(2), 126-135. Servat, E„ Paturel, J. E., Lubès-Niel, IL, Kouamé, B., Travaglio, M. & Marieu, B. (1997) De la diminution des
écoulements en Afrique de l'Ouest et centrale. C. R. Acad. Sei.. Paris série II325, 679-682. Sircoulon, J. (1976) Les données hvdropluviomélriques de la sécheresse récente en Afrique intertropicale. Comparaison
avec les sécheresses 1913 et 1940. Cah Orstom. sér Hydrol. XIU(2), 75-174. Received 18 June 2001; accepted S March 2002
Dow
nloa
ded
by [
Uni
vers
ity o
f St
rath
clyd
e] a
t 18:
00 0
3 O
ctob
er 2
014