Embed Size (px)
Citation preview
González-Candelas et al. BMC Biology 2013, 11:76http://www.biomedcentral.com/1741-7007/11/76
RESEARCH ARTICLE Open Access
Molecular evolution in court: analysis of a largehepatitis C virus outbreak from an evolvingsourceFernando González-Candelas1,2*, María Alma Bracho1,2, Borys Wróbel1,3,4 and Andrés Moya1,2
Abstract
Background: Molecular phylogenetic analyses are used increasingly in the epidemiological investigation ofoutbreaks and transmission cases involving rapidly evolving RNA viruses. Here, we present the results of such ananalysis that contributed to the conviction of an anesthetist as being responsible for the infection of 275 of hispatients with hepatitis C virus.
Results: We obtained sequences of the NS5B and E1-E2 regions in the viral genome for 322 patients suspected tohave been infected by the doctor, and for 44 local, unrelated controls. The analysis of 4,184 cloned sequences ofthe E1-E2 region allowed us to exclude 47 patients from the outbreak. A subset of patients had known dates ofinfection. We used these data to calibrate a relaxed molecular clock and to determine a rough estimate of the timeof infection for each patient. A similar analysis led to an estimate for the time of infection of the source. The dateturned out to be 10 years before the detection of the outbreak. The number of patients infected was small at first,but it increased substantially in the months before the detection of the outbreak.
Conclusions: We have developed a procedure to integrate molecular phylogenetic reconstructions of rapidlyevolving viral populations into a forensic setting adequate for molecular epidemiological analysis of outbreaks andtransmission events. We applied this procedure to a large outbreak of hepatitis C virus caused by a single sourceand the results obtained played a key role in the trial that led to the conviction of the suspected source.
Keywords: HCV, Outbreak, Forensics, Molecular epidemiology, Nosocomial transmission, Compartmentalization,Maximum likelihood, Dating transmission events, Viral evolution
BackgroundOver the last few decades, molecular phylogenetic analysesof RNA viruses have been used frequently in the study ofoutbreaks and transmission chains [1-5]. Occasionally,these analyses have been used in courts to provide evidencein cases in which the ascertainment of the source of an out-break would lead to economic compensation being paid tothe infected victims [1,6]. On one occasion this type ofevidence was accepted in a criminal case, and contributedto the conviction of a physician for the attempted homicide
* Correspondence: [email protected] Research Unit ‘Genómica y Salud’ CSISP (FISABIO), Instituto Cavanilles/Universidad de Valencia, c/ Catedrático José Beltrán, 2 46980-Paterna,Valencia, Spain2Centro de Investigación Biomédica en Red en Epidemiología y SaludPública (CIBERESP), Valencia, SpainFull list of author information is available at the end of the article
© 2013 González-Candelas et al.; licensee BioMCreative Commons Attribution License (http:/distribution, and reproduction in any medium
of his former lover by deliberate injection of blood infectedwith hepatitis C virus (HCV) and human immunodefi-ciency virus (HIV) [4]. These and other cases [7] usuallyinvolve only one or just a few transmission events producedin a short period of time.HCV, a member of family Flaviviridae, is a positive
sense single-stranded RNA virus. The size of its genome isabout 9.6 kb. The genome encodes a polyprotein of about3,000 amino acids in length, which is processed by host andviral proteases to release 3 structural (core, E1, E2) and 7non-structural (p7, NS2-NS5B) proteins (reviewed in [8]).About 160 million people worldwide are infected withHCV [9] and around 80% of those infected progress tochronic infection. Up to 20% of infected individuals developHCV-related complications, for example hepatocellularcarcinoma, cirrhosis, or liver failure [10]. The naturalhistory of the infection is quite variable, ranging from
ed Central Ltd. This is an Open Access article distributed under the terms of the/creativecommons.org/licenses/by/2.0), which permits unrestricted use,, provided the original work is properly cited.
González-Candelas et al. BMC Biology 2013, 11:76 Page 2 of 13http://www.biomedcentral.com/1741-7007/11/76
rapidly resolved acute infections to frequent cases oflong periods of asymptomatic infection during whichthe virus can be transmitted to other hosts. The virusspreads primarily by blood-to-blood contact. The mainroutes of transmission are intravenous drug use, un-screened blood transfusions (in the developing world)and other incorrect medical procedures, especially thosethat involve reuse of needles and syringes [11].In February 1998, a series of HCV infection cases were
detected among patients who had undergone minor sur-gery at a private hospital in the city of Valencia, Spain.Public health officials launched an epidemiological investi-gation that revealed a likely common source for these newinfections to be an anesthetist who regularly worked at thehospital in question and another public hospital nearby[12]. In the ensuing weeks, the active search for other po-tentially infected patients led to the detection of a large out-break possibly involving hundreds of patients, all of themrelated to the activity of this medical professional. Almostall the patients had been previously treated in the twohospitals where the anesthetist practiced regularly. The epi-demiological evidence gathered during the first 3 months ofinvestigation confirmed the initial suspicions of the exist-ence of an outbreak linked to the professional activity ofthis particular anesthetist. The epidemiologists examinedthe association of over 66,000 people who had undergonesurgery in the 2 hospitals with the usual risk factors forinfection in surgical procedures: surgeon, surgery room,type of surgery, anesthesiologist, type of anesthesia, and soon. The only significant factor (adjusted OR 28.5, 95% CI9.83 to 82.59) was this anesthetist (H. Vanaclocha, DGSP-Conselleria de Sanidad, Generalitat Valenciana, and F.Martinez, Centro Nacional Epidemiología, SPAIN). Fur-thermore, of the initial 197 cases considered to be includedin the outbreak, 184 had been anesthetized by him. Noadditional links were found among these patients, nor theones who were included later on. Other hypotheses for thepossible sources of infection were discarded on the basis ofthe epidemiological evidence.Public health authorities and the judge in charge of the
corresponding epidemiological and judicial investigationsrequested our expertise in evolutionary biology in order to(i) check whether the suspected source was actually respon-sible for the outbreak, (ii) ascertain which patients had beeninfected from a common source and could be consideredas included in the outbreak and who had been infectedfrom alternative sources, (iii) discard alternative sources orthe existence of different but simultaneous outbreaks, (iv)determine the duration of the outbreak, (v) date the time ofinfection for each patient involved in the outbreak, and (vi)determine the date of infection of the source.Here, we present a molecular and evolutionary epi-
demiological analysis of this outbreak based on HCVsequences obtained from the presumed source and the
patients. The analysis was used to discriminate whoout of the potential victims had actually been infectedby the common source, to provide an individual assessmentof the likelihood of this assignment, and to obtain an esti-mate of the date of infection for each patient. These resultshelped the court to convict the anesthetist of professionalmalpractice leading to the infection of 275 of his patients.
ResultsWe received serum samples of 322 HCV-1a and 290HCV-1b positive patients who had been in contact withthe presumed source (PS) or had been attended at any ofthe hospitals where he worked regularly. Once we deter-mined that the PS carried only HCV-1a (see below), HCV-1b samples were not processed further. We also determinedthe sequences in 44 samples from persons infected withHCV-1a in the city of Valencia who were not related to theoutbreak, based on the epidemiological evidence, andwhose sera had been stored at −80°C in local hospitals.These samples were used as local controls. The nucleotidesequence of two HCV genome regions was determinedafter reverse transcription (RT) of viral RNA into DNAfollowed by hemi-nested polymerase chain reaction (PCR).A 229-nucleotide (nt) fragment of the NS5B gene, whichencodes the RNA-dependent RNA polymerase of the virus,was analyzed by direct Sanger sequencing of PCR products.This region corresponds to a relatively conserved portionof the viral genome [13] and the method used provides onlya consensus sequence of the whole spectrum of geneticvariability present in each sample. The second regionwe analyzed was a 406-nt fragment encompassing theC-terminal end of the envelope-1 and the N-terminal ofthe envelope-2 glycoprotein (E1-E2 region). This muchmore variable region of the HCV genome was analyzed bysequencing at least ten viral inserts cloned in recombinantplasmids derived from RT-PCR products per patient.We obtained 320 sequences of the NS5B region from
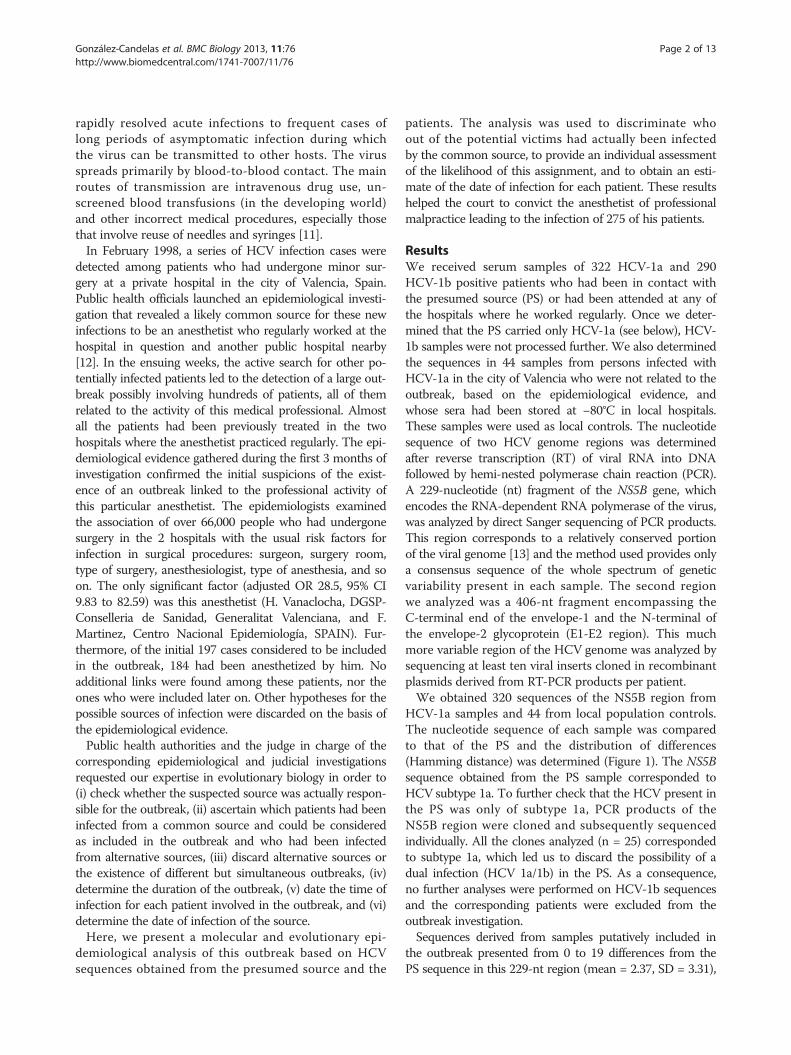
HCV-1a samples and 44 from local population controls.The nucleotide sequence of each sample was comparedto that of the PS and the distribution of differences(Hamming distance) was determined (Figure 1). The NS5Bsequence obtained from the PS sample corresponded toHCV subtype 1a. To further check that the HCV present inthe PS was only of subtype 1a, PCR products of theNS5B region were cloned and subsequently sequencedindividually. All the clones analyzed (n = 25) correspondedto subtype 1a, which led us to discard the possibility of adual infection (HCV 1a/1b) in the PS. As a consequence,no further analyses were performed on HCV-1b sequencesand the corresponding patients were excluded from theoutbreak investigation.Sequences derived from samples putatively included in
the outbreak presented from 0 to 19 differences from thePS sequence in this 229-nt region (mean = 2.37, SD = 3.31),
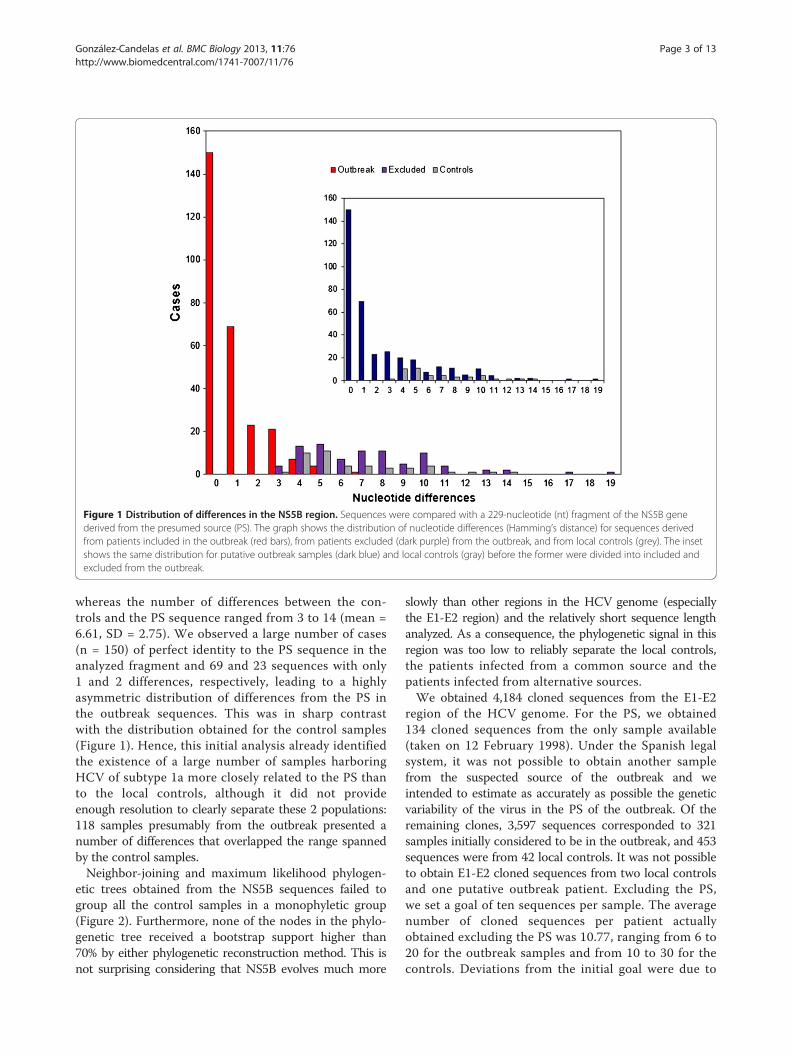
Figure 1 Distribution of differences in the NS5B region. Sequences were compared with a 229-nucleotide (nt) fragment of the NS5B genederived from the presumed source (PS). The graph shows the distribution of nucleotide differences (Hamming’s distance) for sequences derivedfrom patients included in the outbreak (red bars), from patients excluded (dark purple) from the outbreak, and from local controls (grey). The insetshows the same distribution for putative outbreak samples (dark blue) and local controls (gray) before the former were divided into included andexcluded from the outbreak.
González-Candelas et al. BMC Biology 2013, 11:76 Page 3 of 13http://www.biomedcentral.com/1741-7007/11/76
whereas the number of differences between the con-trols and the PS sequence ranged from 3 to 14 (mean =6.61, SD = 2.75). We observed a large number of cases(n = 150) of perfect identity to the PS sequence in theanalyzed fragment and 69 and 23 sequences with only1 and 2 differences, respectively, leading to a highlyasymmetric distribution of differences from the PS inthe outbreak sequences. This was in sharp contrastwith the distribution obtained for the control samples(Figure 1). Hence, this initial analysis already identifiedthe existence of a large number of samples harboringHCV of subtype 1a more closely related to the PS thanto the local controls, although it did not provideenough resolution to clearly separate these 2 populations:118 samples presumably from the outbreak presented anumber of differences that overlapped the range spannedby the control samples.Neighbor-joining and maximum likelihood phylogen-
etic trees obtained from the NS5B sequences failed togroup all the control samples in a monophyletic group(Figure 2). Furthermore, none of the nodes in the phylo-genetic tree received a bootstrap support higher than70% by either phylogenetic reconstruction method. This isnot surprising considering that NS5B evolves much more
slowly than other regions in the HCV genome (especiallythe E1-E2 region) and the relatively short sequence lengthanalyzed. As a consequence, the phylogenetic signal in thisregion was too low to reliably separate the local controls,the patients infected from a common source and thepatients infected from alternative sources.We obtained 4,184 cloned sequences from the E1-E2
region of the HCV genome. For the PS, we obtained134 cloned sequences from the only sample available(taken on 12 February 1998). Under the Spanish legalsystem, it was not possible to obtain another samplefrom the suspected source of the outbreak and weintended to estimate as accurately as possible the geneticvariability of the virus in the PS of the outbreak. Of theremaining clones, 3,597 sequences corresponded to 321samples initially considered to be in the outbreak, and 453sequences were from 42 local controls. It was not possibleto obtain E1-E2 cloned sequences from two local controlsand one putative outbreak patient. Excluding the PS,we set a goal of ten sequences per sample. The averagenumber of cloned sequences per patient actuallyobtained excluding the PS was 10.77, ranging from 6 to20 for the outbreak samples and from 10 to 30 for thecontrols. Deviations from the initial goal were due to
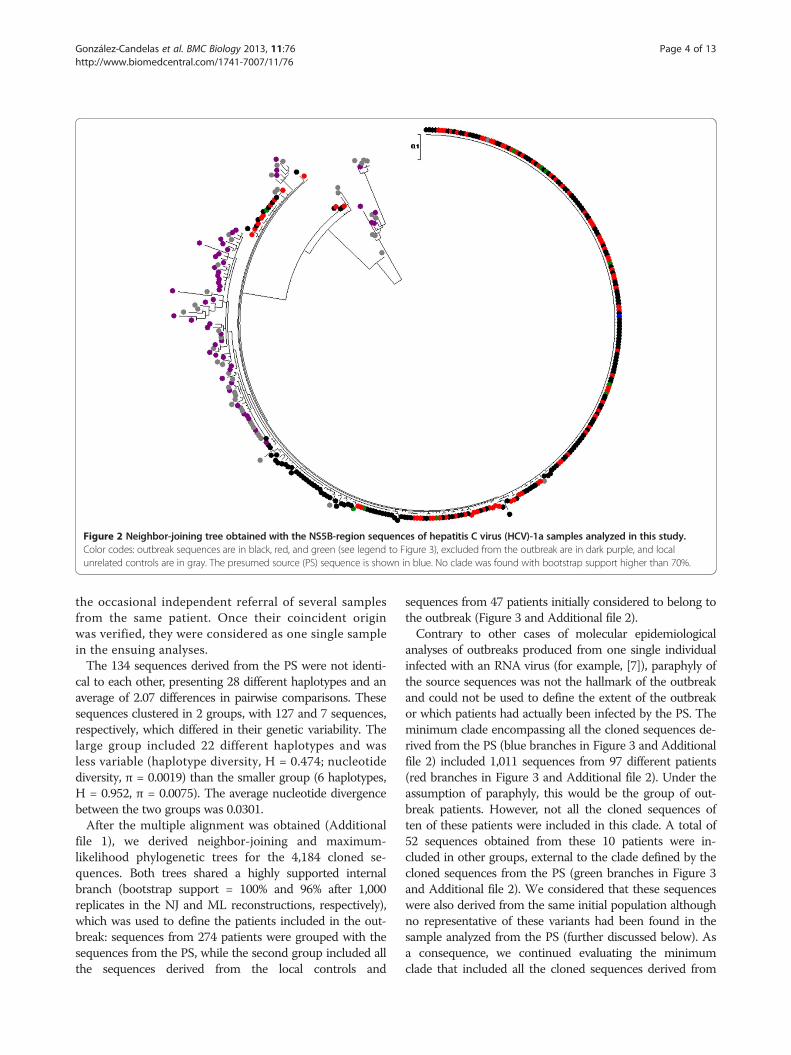
Figure 2 Neighbor-joining tree obtained with the NS5B-region sequences of hepatitis C virus (HCV)-1a samples analyzed in this study.Color codes: outbreak sequences are in black, red, and green (see legend to Figure 3), excluded from the outbreak are in dark purple, and localunrelated controls are in gray. The presumed source (PS) sequence is shown in blue. No clade was found with bootstrap support higher than 70%.
González-Candelas et al. BMC Biology 2013, 11:76 Page 4 of 13http://www.biomedcentral.com/1741-7007/11/76
the occasional independent referral of several samplesfrom the same patient. Once their coincident originwas verified, they were considered as one single samplein the ensuing analyses.The 134 sequences derived from the PS were not identi-
cal to each other, presenting 28 different haplotypes and anaverage of 2.07 differences in pairwise comparisons. Thesesequences clustered in 2 groups, with 127 and 7 sequences,respectively, which differed in their genetic variability. Thelarge group included 22 different haplotypes and wasless variable (haplotype diversity, H = 0.474; nucleotidediversity, π = 0.0019) than the smaller group (6 haplotypes,H = 0.952, π = 0.0075). The average nucleotide divergencebetween the two groups was 0.0301.After the multiple alignment was obtained (Additional
file 1), we derived neighbor-joining and maximum-likelihood phylogenetic trees for the 4,184 cloned se-quences. Both trees shared a highly supported internalbranch (bootstrap support = 100% and 96% after 1,000replicates in the NJ and ML reconstructions, respectively),which was used to define the patients included in the out-break: sequences from 274 patients were grouped with thesequences from the PS, while the second group included allthe sequences derived from the local controls and
sequences from 47 patients initially considered to belong tothe outbreak (Figure 3 and Additional file 2).Contrary to other cases of molecular epidemiological
analyses of outbreaks produced from one single individualinfected with an RNA virus (for example, [7]), paraphyly ofthe source sequences was not the hallmark of the outbreakand could not be used to define the extent of the outbreakor which patients had actually been infected by the PS. Theminimum clade encompassing all the cloned sequences de-rived from the PS (blue branches in Figure 3 and Additionalfile 2) included 1,011 sequences from 97 different patients(red branches in Figure 3 and Additional file 2). Under theassumption of paraphyly, this would be the group of out-break patients. However, not all the cloned sequences often of these patients were included in this clade. A total of52 sequences obtained from these 10 patients were in-cluded in other groups, external to the clade defined by thecloned sequences from the PS (green branches in Figure 3and Additional file 2). We considered that these sequenceswere also derived from the same initial population althoughno representative of these variants had been found in thesample analyzed from the PS (further discussed below). Asa consequence, we continued evaluating the minimumclade that included all the cloned sequences derived from
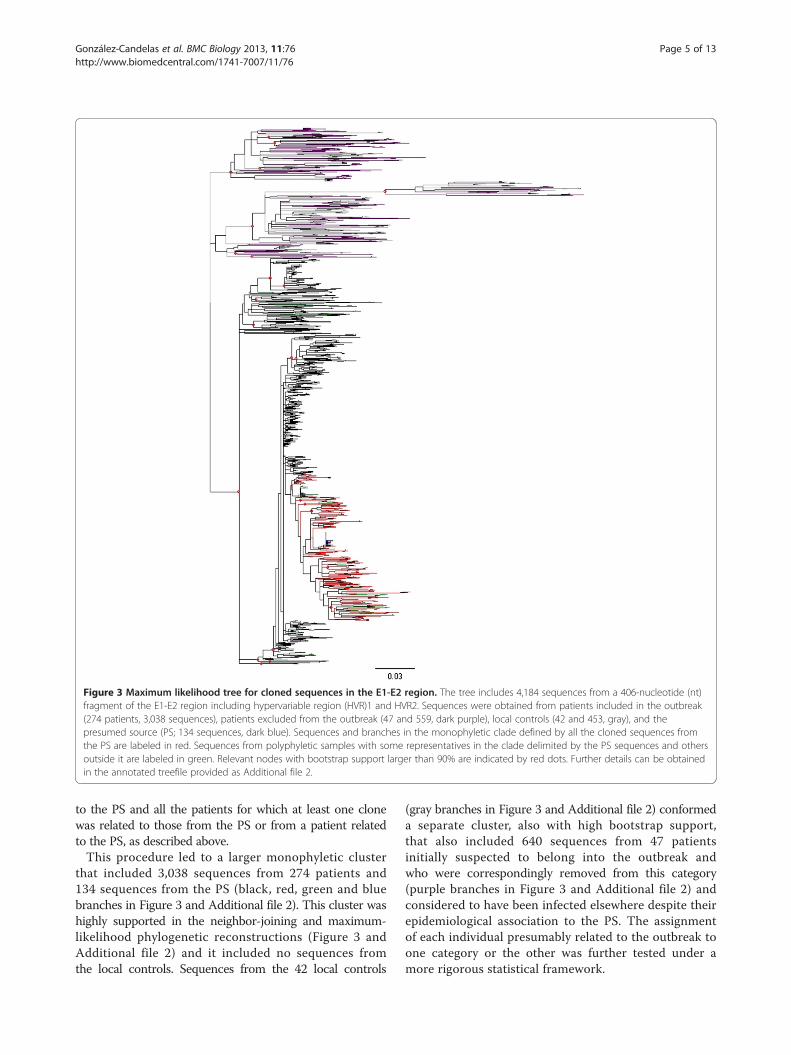
Figure 3 Maximum likelihood tree for cloned sequences in the E1-E2 region. The tree includes 4,184 sequences from a 406-nucleotide (nt)fragment of the E1-E2 region including hypervariable region (HVR)1 and HVR2. Sequences were obtained from patients included in the outbreak(274 patients, 3,038 sequences), patients excluded from the outbreak (47 and 559, dark purple), local controls (42 and 453, gray), and thepresumed source (PS; 134 sequences, dark blue). Sequences and branches in the monophyletic clade defined by all the cloned sequences fromthe PS are labeled in red. Sequences from polyphyletic samples with some representatives in the clade delimited by the PS sequences and othersoutside it are labeled in green. Relevant nodes with bootstrap support larger than 90% are indicated by red dots. Further details can be obtainedin the annotated treefile provided as Additional file 2.
González-Candelas et al. BMC Biology 2013, 11:76 Page 5 of 13http://www.biomedcentral.com/1741-7007/11/76
to the PS and all the patients for which at least one clonewas related to those from the PS or from a patient relatedto the PS, as described above.This procedure led to a larger monophyletic cluster
that included 3,038 sequences from 274 patients and134 sequences from the PS (black, red, green and bluebranches in Figure 3 and Additional file 2). This cluster washighly supported in the neighbor-joining and maximum-likelihood phylogenetic reconstructions (Figure 3 andAdditional file 2) and it included no sequences fromthe local controls. Sequences from the 42 local controls
(gray branches in Figure 3 and Additional file 2) conformeda separate cluster, also with high bootstrap support,that also included 640 sequences from 47 patientsinitially suspected to belong into the outbreak andwho were correspondingly removed from this category(purple branches in Figure 3 and Additional file 2) andconsidered to have been infected elsewhere despite theirepidemiological association to the PS. The assignmentof each individual presumably related to the outbreak toone category or the other was further tested under amore rigorous statistical framework.
González-Candelas et al. BMC Biology 2013, 11:76 Page 6 of 13http://www.biomedcentral.com/1741-7007/11/76
For each individual we considered two alternativehypotheses: either the patient had been infected by thePS and should be included in the outbreak, or had beeninfected from a different source and should be excludedfrom the outbreak. In the former case, sequences derivedfrom the case should group with those in the outbreakwhereas in the latter they should group with the controlsand the excluded patients. For each alternative, weobtained the likelihood of the corresponding phylogen-etic tree [14]. For sequences in the outbreak group, asdetermined by the strongly supported interior branchdescribed above, the alternative hypothesis was evaluatedby computing the likelihood of the phylogenetic treeobtained by moving all the sequences obtained from thecorresponding sample to the base of the clade definedby control and non-outbreak samples (Additional file 3).Similarly, the alternative phylogenetic tree for the ex-cluded samples, which corresponded to their assignmentto the outbreak group, was obtained after shifting thecorresponding sequences to the base of the outbreak-defining clade. The ratio between the two likelihoods isa measure of the relative support provided by these datato each hypothesis and, therefore, can be easily trans-lated into an expert forensic evaluation [15].For the cases assigned to the outbreak according to
the phylogenetic reconstruction described above weobtained likelihood ratios (LRs) in the range 1.051 to6.622 × 1095. The lowest values corresponded to thepatients whose sequences, although included in theoutbreak, were the closest to the control and non-outbreak group. For these patients, the change in likelihoodwas minimal, since the topologies used in the test weredevised as the most favorable for the accused (the PS), thusminimizing the probability of incorrect assignment ofpatients to the outbreak. For most patients (n = 240), theLR value was higher than 105, which represents a verystrong support for their individual assignment to the out-break group. Similarly, support values for those patientswho were finally excluded from the outbreak group,given by the LR between this hypothesis and the alternativeof their inclusion in the outbreak, ranged between 1.330and 4.408 × 1084, also providing very high support for theirlack of association to the outbreak. Based on these results,47 patients who were initially considered to be part of itbecause of their epidemiological links to the PS wereexcluded from the outbreak. The court accepted thisargument and removed these patients from the courtprocess.The phylogenetic analysis was consistent with the
epidemiological evidence in identifying the PS as thesource of the outbreak. In the next step of our analysiswe assumed that the PS was indeed the source and usedthe Bayesian method with constant population sizeand relaxed molecular clock implemented in BEAST
(‘Bayesian Evolutionary Analysis by Sampling Trees’)[16] to estimate the infection dates of the 274 patientsincluded in the outbreak. For each patient, E1-E2 clonedsequences were used to establish the time to the mostrecent common ancestor (MRCA) to the closest groupof E1-E2 cloned sequences derived from the PS. Apartfrom the information on the dates when samples had beenobtained, we used the known infection dates of 24 patientsin the outbreak [17]. These patients were chosen becausethey had had contact with the PS only once, at a knowndate, and had tested negative for HCV before that date andpositive afterwards. Consequently, their sequences wereused to calibrate the molecular clock estimates for theMRCA of each outbreak patient and the PS (Additionalfile 4).Estimates of divergence for each outbreak patient from
the PS ranged between January 1987 and April 1998. Thesevalues correspond to the medians of the 95% Bayesianhighest posterior density (HPD) for each estimated date tothe MRCA with the PS. When the upper and lower ends ofeach interval were considered, the latter date is not contra-dictory with the detection of the outbreak in February1998. The estimated time of infection for the PS was June1988, with 95% HPD intervals ranging from August 1984to October 1991, and it was thus compatible with theearliest estimate for the date of infection of an outbreakpatient. The estimated time of infection for each patientwas compared to independently derived estimates bythe prosecution during the trial. These were based onhospital records and other documents, and did not considerany sequence-based information.A comparison between these 2 estimates for each patient
is shown in Figure 4, where it can be observed that in 176cases (65%) the HPD interval for the Bayesian estimate ofinfection included the most likely estimated date given bythe prosecution to the court, based on documents and tes-timonies from several sources, but in some cases alternativedates were possible (Additional file 5: Figure S1). Mostdifferences between the two estimates corresponded eitherto the oldest infections or to the most recent ones. Theformer can be explained by lack of appropriate calibrationsamples, since the earliest date in this group correspondedto a patient infected in March 1995. It should be notedthat estimates correspond to divergence from the lastcommon ancestor and these should precede the actualdate of transmission from the source to the recipient. Theunderestimation of the date of some recent infections maystem from the still insufficient sampling of the PS viralpopulation. These patients were likely infected by a sub-group of PS variants that were not represented in the PSsample used in our analyses. If so, the estimates wouldcorrespond to the time of divergence to the PS variantsincluded in our sampling, not actual infection dates, andwould predate them.
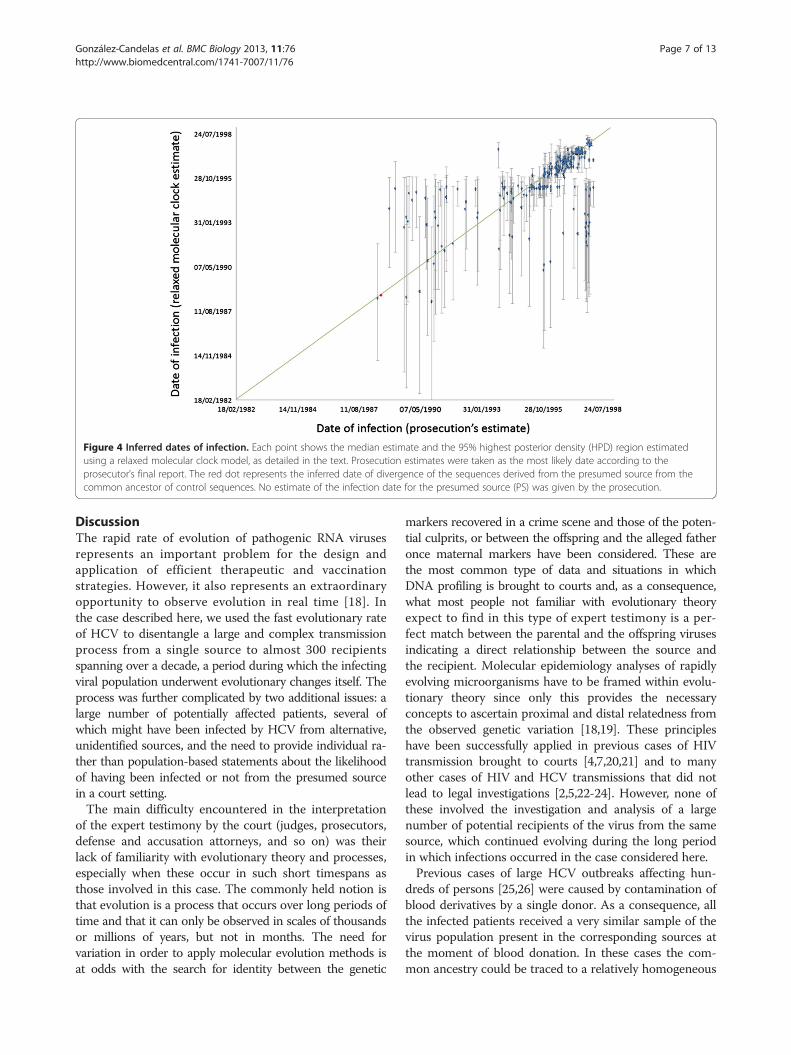
Figure 4 Inferred dates of infection. Each point shows the median estimate and the 95% highest posterior density (HPD) region estimatedusing a relaxed molecular clock model, as detailed in the text. Prosecution estimates were taken as the most likely date according to theprosecutor’s final report. The red dot represents the inferred date of divergence of the sequences derived from the presumed source from thecommon ancestor of control sequences. No estimate of the infection date for the presumed source (PS) was given by the prosecution.
González-Candelas et al. BMC Biology 2013, 11:76 Page 7 of 13http://www.biomedcentral.com/1741-7007/11/76
DiscussionThe rapid rate of evolution of pathogenic RNA virusesrepresents an important problem for the design andapplication of efficient therapeutic and vaccinationstrategies. However, it also represents an extraordinaryopportunity to observe evolution in real time [18]. Inthe case described here, we used the fast evolutionary rateof HCV to disentangle a large and complex transmissionprocess from a single source to almost 300 recipientsspanning over a decade, a period during which the infectingviral population underwent evolutionary changes itself. Theprocess was further complicated by two additional issues: alarge number of potentially affected patients, several ofwhich might have been infected by HCV from alternative,unidentified sources, and the need to provide individual ra-ther than population-based statements about the likelihoodof having been infected or not from the presumed sourcein a court setting.The main difficulty encountered in the interpretation
of the expert testimony by the court (judges, prosecutors,defense and accusation attorneys, and so on) was theirlack of familiarity with evolutionary theory and processes,especially when these occur in such short timespans asthose involved in this case. The commonly held notion isthat evolution is a process that occurs over long periods oftime and that it can only be observed in scales of thousandsor millions of years, but not in months. The need forvariation in order to apply molecular evolution methods isat odds with the search for identity between the genetic
markers recovered in a crime scene and those of the poten-tial culprits, or between the offspring and the alleged fatheronce maternal markers have been considered. These arethe most common type of data and situations in whichDNA profiling is brought to courts and, as a consequence,what most people not familiar with evolutionary theoryexpect to find in this type of expert testimony is a per-fect match between the parental and the offspring virusesindicating a direct relationship between the source andthe recipient. Molecular epidemiology analyses of rapidlyevolving microorganisms have to be framed within evolu-tionary theory since only this provides the necessaryconcepts to ascertain proximal and distal relatedness fromthe observed genetic variation [18,19]. These principleshave been successfully applied in previous cases of HIVtransmission brought to courts [4,7,20,21] and to manyother cases of HIV and HCV transmissions that did notlead to legal investigations [2,5,22-24]. However, none ofthese involved the investigation and analysis of a largenumber of potential recipients of the virus from the samesource, which continued evolving during the long periodin which infections occurred in the case considered here.Previous cases of large HCV outbreaks affecting hun-
dreds of persons [25,26] were caused by contamination ofblood derivatives by a single donor. As a consequence, allthe infected patients received a very similar sample of thevirus population present in the corresponding sources atthe moment of blood donation. In these cases the com-mon ancestry could be traced to a relatively homogeneous
González-Candelas et al. BMC Biology 2013, 11:76 Page 8 of 13http://www.biomedcentral.com/1741-7007/11/76
initial sample, which does not evolve until transferred to anew host that, with no doubt, facilitates the identificationof a common origin of the outbreaks. In the case reportedhere, the sequences recovered from the outbreak patientscorrespond to different inoculums from a viral populationthat had been evolving continuously under the pressure ofthe immune system of the source for about 10 years, thetime since the infection of the anesthetist from an unknownsource until the detection of the outbreak and the cessationof his professional activity. Evolution in the source duringthe long period along which transmissions occurred furthercombined with evolutionary changes in each infectedpatient have produced a wide array of viral sequenceswhose common ancestry could only be inferred after takinginto account the whole spectrum of variants generatedduring the process.In addition, there is mounting evidence that com-
partmentalization occurs in individuals infected withHCV [27-33] and the analysis of E1-E2 cloned sequences inpatients related to this outbreak further supports this possi-bility. Compartmentalization refers to the microevolution-ary processes of viral populations occurring in separatetissues and organs of an infected individual that might leadto significant differences among subpopulations within thatindividual. HCV is transmitted through blood, but theblood is not the primary reservoir for the virus in theinfected body. In fact, although the liver is the main organinfected by HCV, this virus has been shown to infect andreplicate in other tissues that will eventually contribute tothe HCV population circulating in the bloodstream.In addition to compartmentalization, an additional
process has likely contributed to generate the complexpattern of variation in the viral populations obtainedfrom the PS and the infected patients. Several featuresof HCV populations such as re-emergence of variantsafter treatment or lack of association between viral featuresand response to treatment or disease progression have beenrecently interpreted in light of within-patient dynamics ofthe virus [34-36]. These analyses have revealed the coex-istence of relatively divergent lineages within chronically,but also acutely, infected patients that are not necessarilypresent simultaneously in plasma. Given that HCV ismainly transmitted through blood, which actual variantsare transmitted from the same source to different re-cipients can vary depending on the viral populationcirculating at the moment of infection. Although thesepopulations have been characterized in serial samplesfrom the same patients usually a few weeks or monthsapart, it is evident that this same process may explaindifferences observed on larger timescales. For instance,patients receiving HCV-infected sera from a commonblood donor were shown to harbor different viral sub-populations that were still present a few months/yearsafter infection and that evolved into well differentiated
clades a few years later [37]. Hence, it is possible thatcompartmentalization and intra-patient fluctuations ofgenetic variants caused a departure from the paraphylymodel postulated to characterize the populations ofdonor and recipients in viral transmission cases [7] inthe case of the E1-E2 cloned sequences analyzed here,if different patients received different viral inoculumsdepending on the actual populations circulating in theblood of the donor at the time of infection. Naturally,further independent evolution within each new hostwould enhance any differences at the time of infection.In this case, it is also necessary to consider the longperiod of infection of the PS, which further facilitatesdifferentiation of viral subpopulations within and amongcompartments.Paraphyly of source sequences is usually invoked to
determine the direction of transmission [7]. As discussedpreviously, not all the sequences derived from patientsconsidered to be in the outbreak group were included inthe monophyletic group defined by the sequences derivedfrom the PS. Our preferred explanation for this observa-tion has been discussed in the previous paragraphs, but itcould be hypothesized that the PS had been infected bysome of his patients and that he had subsequently infectedothers. In this case, the PS would be an intermediate linkin a transmission chain and not the central hub in a largeseries of transmission pairs. The reasons for discardingthis alternative possibility were as follows. There are twoways in which some patients have non-monophyleticsequences, with one group of them included in themonophyletic group defined by the common ancestorto the sequences of the PS and the other in separate,but nevertheless related, groups. One is that each of thesepatients had been coinfected by the PS and by an alterna-tive source. The other is that there had been only one in-fection from the PS but the infecting viruses were alreadyheterogeneous and relatively divergent in the source so thatdifferences between the two groups within these patientswould lead to the observed pattern. Our main argumentagainst the first possibility is that a secondary commonsource (in fact several sources) would have to exist thatmight explain their grouping with other sequences frompatients whose only known (and common) risk for HCVinfection was determined in the epidemiological investi-gation to be the physician. How can we explain, andprefer, the second possibility? Firstly, the already men-tioned epidemiological linkage was very strong and itled us to prefer any possibility with one single infectionrather than alternatives with two or more infections forwhich no evidence was ever found. Secondly, we havealready discussed how compartmentalization within thePS and viral evolution within him over a 10-year periodcan explain the observed pattern without any need forunsupported claims of other processes.
González-Candelas et al. BMC Biology 2013, 11:76 Page 9 of 13http://www.biomedcentral.com/1741-7007/11/76
We must emphasize that the methodology used in thiswork is appropriate for testing hypotheses derived fromprevious, independent investigations. In this case, theepidemiological enquiry revealed a highly likely sourcefor the outbreak and our goal was to test this hypothesisas rigorously as possible. Given the size of the outbreakand the prevalence of HCV infection in our country, itwas a likely possibility that not all the outbreak-relatedcases had been infected by the same source, and thiswas actually proven for 47 infections. Similarly, thedirection of the infection, although strongly suggestedfrom the global tree from the E1-E2 region shown inFigure 2 to be from the PS to the patients and especiallyfor the smaller clade encompassing all the sequencesderived from the PS, was also grounded in our previousknowledge of epidemiological investigation, with only1 common link for the 275 patients included in theoutbreak (namely, their anesthetist). This implied a par-ticular direction of the infections that is compatiblewith the non-molecular evidence and also, as detailedin the preceding paragraphs, with the sequence dataobtained once knowledge about the intrapatient dynamicsof chronically infecting virus such as HCV is taken intoaccount. As established by Evett and Weir [15], and furtherdiscussed below, the scientific expert must give a quan-titative estimate of the relative support that the data inhis/her domain provide to each hypotheses (innocenceor culpability), which should be considered along withadditional pieces of evidence gathered from other sourcesof investigation.We agree that this is an unusual and also unexpected
pattern for a single viral outbreak, but this is so not onlyat the molecular level. As commented previously, thiswas an unprecedented outbreak for an RNA virus capableof establishing a chronic, asymptomatic infection, whichcertainly contributed to its long duration and large numberof infected patients. A similar case, also involving a medicalprofessional spanning several years and in differentgeographical locations with possibly dozens of infectedindividuals from the same source, has been recentlyreported in the USA [38]. If similar circumstances tothose exposed in the case described here concur in thisnew case, we anticipate that similar patterns at the mo-lecular epidemiological level will be observed. The actualprocedure on how the anesthetist infected so many of hispatients and the reasons for doing so are naturally out ofthe scope of this report. Nevertheless, the court sentenceestablished that the anesthetist had used for himself thesame materials and drugs employed with his patients,and that these uses were previous to the correspondingmedical acts (anesthesia, painkilling, and so on). Noevidence was established in the trial about him knowinglyinfecting the patients or having information about his ownHCV-positive status.
Molecular phylogenetic reconstructions have becomeincreasingly popular over the last few decades mainly asa result of easy and cheap access to gene, genome andother large-scale sequencing methods and to the devel-opment of user-friendly platforms for the analysis ofsequence data. However, the direct application of thesemethods in forensic analysis has to be made even morecautiously than for general scientific enquiries given thepotentially serious consequences of a wrong inference orconclusion in a criminal setting. Some of the problemsarising in the inference of transmission chains or outbreaksources on the basis of molecular phylogenetic analyseshave been commented on elsewhere [39,40]. For instance,the use of an inappropriate genome region can lead toerroneous inferences, as we observed in the analysis of theNS5B region in this outbreak.The development of next-generation sequencing meth-
odologies for fast and accurate analysis of viral popula-tions [41-43] has already led to its application in a case ofHCV transmission [44] and it might become eventually aroutine technique in this setting [45], thus overcomingsome of the limitations derived from the strategy of clon-ing and sequencing PCR products that we had to use inthis work. Similarly, recent developments in algorithmsand computer speed and capabilities [46,47] may also allowthe application of more rigorous and encompassingphylogenetic analyses than those we were able to applyto these data, such as obtaining global estimates for thedates of infection for all the patients in the outbreak orusing all the sequences available from each patient toobtain those estimates.Beyond methodological issues on the use of one or other
marker for molecular epidemiology or the most appropriatemodel for phylogenetic inference, the application ofEvett and Weir’s [15] procedure and the extension thatwe propose in this work are highly recommendable.According to Evett and Weir, scientific experts mustinform on the likelihood of the observed data underthe different hypotheses and in light of other evidencesavailable. This is especially relevant in the determination ofoutbreak sources because other alternative routes of infec-tion, such as secondary infection from a primarily infectedpatient or infection from a third unidentified source,have to be ruled out. In the case described here, thesepossibilities were discarded in the course of an exten-sive epidemiological investigation and in our testimonyin court we simply provided an evaluation on the likelihoodof the sequences derived from each patient suspected tohave been infected from the presumed source. Similarly,and in this situation this was notably important in terms ofpreserving the assumption of innocence unless otherwiseproven, we were able to discard from the outbreak a groupof 47 patients who complied with all the epidemiologicalcriteria for inclusion in the outbreak but whose viruses had
González-Candelas et al. BMC Biology 2013, 11:76 Page 10 of 13http://www.biomedcentral.com/1741-7007/11/76
a higher likelihood of having a different origin than thosefrom the outbreak.
ConclusionsThe combination of recent developments in molecular evo-lutionary analysis and the statistical framework developedfor the forensic study of nucleic acid samples has allowedus to incorporate molecular epidemiology, with its naturalcomponents of molecular phylogenetics and populationgenetics, into the realm of forensic analysis. Despite tre-mendous progress in the prevention of infections by HCVand other blood-borne viruses in the last decades, nosoco-mial and other transmissions related to medical proceduresstill occur [48,49]. Here, we have provided an adequatemethodology for the rigorous testing of alternative hypoth-eses used in the epidemiological and forensic analysis ofthese infections in a real, complex and massive case.
MethodsSource of INNO-LiPA, HCV II, Innogenetics, Ghent, Belgium-positive samplesPersons suspected to have been exposed to HCV infectionby the PS were actively searched for by the regional PublicHealth Services. Serum samples from these patients andunrelated local controls were tested for HCV infection byenzyme-linked immunosorbent assays (ELISA) and furtherconfirmed by HCV-specific RNA amplification. Deter-mination of HCV genotype was performed by reversehybridization of PCR amplicons of the 5′ non-coding re-gion (INNO-LiPA HCV II, Innogenetics, Ghent, Belgium).
Samples and patientsSamples were collected as contemporarily as possible. Toavoid cross-contamination, each sample was physically iso-lated during RNA purification and gloves were changed fre-quently during all procedures. Different laboratories anddevices were used for RNA isolation, DNA amplification,cloning and sequencing, and negative controls were in-cluded at all steps.
RNA extraction and reverse transcriptionViral RNA was purified from 200 μl of serum using theHigh Pure Viral RNA Kit (Roche Diagnostics GmbH,Mannheim, Germany). RT was carried out in a 20-μl vol-ume containing 5 μl of eluted RNA, 5 × RT buffer, 500 μMof each dNTP, 1 μM of hexamers, 100 U of M-MLV Re-verse Transcriptase (Promega Corp., Madison, WI, USA),and 20 U of Recombinant RNasin® Ribonuclease Inhibitor(Promega). Reaction mixtures were incubated at 37°C for60 minutes, followed by 2 minutes at 95°C.
Amplification and direct sequencing of the NS5B regionDirect sequences of PCR products were obtained for a337-nt fragment of the NS5B gene, although we used only
a 229-nt subfragment corresponding to the sequence ofthe PS initially determined by another laboratory. PCRswere performed in a 50-μl volume containing 5 μl of RTproduct, 100 μM of each dNTP, 200 nM of each primer,and 2.5 U of Taq polymerase (Amersham Biosciences,Piscataway, NJ, USA). Oligonucleotides used for ampli-fication and direct sequencing of NS5B region were:5′-TATGATACYCGCTGYTTYGACTC-3′ (sense) and5′-GTACCTRGTCATAGCCTCCGTGAA-3′ (antisense).Direct sequencing of purified PCR products was performedon an 8-μl volume, including 1.0 μl of DNA, with theABI PRISM BigDye Terminator Cycle Sequencing ReadyReaction kit in ABI 377 or ABI 310 automated sequencers(Applied Biosystems, Foster City, CA, USA). Both strandswere assembled using the Staden Package. Sequences wereverified and deposited in GenBank with accession numbersFR670793-FR671156.
Amplification, cloning and sequencing of the E1-E2 regionA 406-nt fragment of the E1-E2 region was amplified bynested PCR. The first amplification was performed in a100-μl volume containing 10 μl of cDNA, 10 × PCR buffer,100 μM (each) dNTP, 400 nM (each) oligonucleotideand 2.5 U of Pfu DNA polymerase (Stratagene, La Jolla,CA, USA). Oligonucleotides used for amplification ofE1-E2 region were: 5′-CGCATGGCATGGRATATGAT-3′(sense), 5′-GGAGTGAAGCARTAYACYGG-3′ (antisense),5′-GGRATATGATGATGAACTGGTC-3′ (nested sense).Both primary and nested PCR were performed with thefollowing thermal profile: 94°C for 3 minutes; 5 cycles at94°C for 30 s, 55°C for 30 s, and 72°C for 3 minutes; 35cycles at 94°C for 30 s, 52°C for 30 s, and 72°C for 3minutes; and a final extension at 72°C for 10 minutes.Amplification products were purified and directly cloned inEcoRV-digested pBluescript II SK(+) phagemid (Stratagene).Plasmid DNA was purified with the High Pure PlasmidIsolation Kit (Roche). Recombinant clones were sequencedby the use of KS and SK oligonucleotides (Stratagene) andthe same procedure described above for the NS5B regionbut using 5 μl of purified cloned DNA. The obtainedsequences have been deposited in GenBank with accessionnumbers FR671450-FR675633.
Molecular phylogenetics and evolutionary analysisMultiple alignments were obtained with ClustalW 1.82 [50].Estimates of Hamming’s distance between each NS5Bsequence and that obtained from the PS were obtainedwith MEGA 2.0 [51]. Due to computational limitationsat the time of the initial analysis (1999 to 2001), an initialphylogenetic tree was obtained with the neighbor-joiningalgorithm [52] using Kimura-2P distance [53] for pairsof sequences with program ClustalW. Subsequently, thesame sequences were used with program PHYML [54]to obtain a maximum likelihood tree using the GTR + I + G
González-Candelas et al. BMC Biology 2013, 11:76 Page 11 of 13http://www.biomedcentral.com/1741-7007/11/76
model determined by Modeltest [55] using AIC [56].Support for internal nodes was evaluated with 1,000bootstrap replicates [57].
Statistical analysis of competing hypothesisWe adopted Evett and Weir’s [15] method for the useof genetic analyses in forensic settings using a Bayesianframework. This method is consistent with the judicialprocedures in Spanish courts. Briefly, these authors indicatethat scientific experts’ contribution to forensic analyses ofgenetic information should restrict to the evaluation of theavailable genetic data in light of the two competing hypoth-eses, those of the prosecution and the defense. The jury orjudges must integrate that information, ideally in a numer-ical way, with the information provided by other types ofevidence. Formally, this is accomplished by computing theratio of two posterior probabilities, those of the prosecutionand the defense proposals conditioned on all types ofevidence for whose computation it is necessary to usethe corresponding priors, here defined as the probabilityof each hypothesis in light of the non-genetic evidence (I),and the likelihood of the genetic data (G) conditioned onthe non-genetic evidence and each hypothesis (Hp and Hd):
PrðHpjG; IÞPr HdjG; Ið Þ ¼
PrðGjHp; IÞPr GjHd; Ið Þ �
PrðHp Ij ÞPr Hd Ij Þð
In the context of molecular phylogenetic analysis appliedto forensic epidemiology, the two competing hypothesescorrespond to the assignment of a given patient to thegroup of patients infected from a common source or to thatof control sequences in which there is no common sourceof infection. The evaluation of competing phylogenetichypotheses under a maximum likelihood frameworkdirectly provides their likelihood ratio (LR), thus allowingus to derive individual estimates of the support from thesequence data to the two relevant alternative proposals:(i) a given patient was infected with HCV in the outbreak,and as a consequence viral sequences obtained fromhim that share a closer common ancestor with thoseobtained from the source and other patients in the out-break, or (ii) the patient was infected from other sourcenot linked to the outbreak, so that his or her viral se-quences are evolutionarily closer to those from con-trols and patients excluded from the outbreak than tosequences from outbreak patients. Hence, it is possibleto provide quantitative criteria for deciding betweenalternative possibilities to the jury or those in charge oftaking a judicial decision.Patients were included or excluded in the outbreak
depending on their grouping in the phylogenetic treeof the E1-E2 region sequences. The likelihood of each al-ternative topology was obtained with program fastDNAml[58], allowing it to optimize branch lengths for each case.
The LR for each patient was computed considering thewhole data set: the PS, the controls, the excluded patients,the remaining patients in the outbreak and the target pa-tient. Hence, values are referred to the change in likelihoodof the E1-E2 cloned sequences tree when the sequencesof each patient were placed in the node delimiting thecontrols and non-outbreak clade (for outbreak patients)or the outbreak clade (or non-outbreak patients).
Estimation of infection dates in the Bayesian Markovchain Monte Carlo (MCMC) frameworkThe relaxed molecular clock model [59] implementedin BEAST [16], under constant population size (morecomplex models did not increase the accuracy of theestimation; [17]) and using the GTR + I + G model,was used to estimate the infection dates of the 274 patientsincluded in the outbreak and for whom E1-E2-regioncloned sequences were available. Sequences from 24patients for which the infection dates were known withcertainty were employed to calibrate the clock [17].The method used here for the estimation of infectiondates is an extension of the approach we used previouslyin a validation study that tested the accuracy of estimationof infection dates in this outbreak using the Bayesianapproach [17] for the 24 patients whose infection dateswere known. The calibration assumed that the infec-tion dates for these 24 patients corresponded to thetime of the most recent common ancestor between thesequences of a given patient and the appropriate PS popu-lation (see above). In all the analyses, the tips were datedwith the corresponding sampling times for all the patients,controls and the PS. For computational reasons, estimatesof dates of infection were obtained separately for each ofthe 249 patients with E1-E2 sequences. For this, 1 sequencefrom each target patient, 1 from each of the 24 patientsused for calibration, and 2 sequences from the PS wereused in each estimate run.Based on previous results [17], the parameters in the
evolutionary and the coalescent model were given uni-form or little-constrained priors (Additional file 4). Thevalues for the parameters were saved every 500 stepsand the trees every 5,000 steps. The pre-burn-in was100,000 steps, and the burn-in was 300,000 steps. Forseveral patients the number of steps necessary for all theparameters to have the adequate effective sample size(ESS >200) differed by an order of magnitude (fromabout 1 × 10⁶ to 3 × 10⁷ steps).
Additional files
Additional file 1: Phylip-formatted file with the E1-E2 sequencesused in the phylogenetic reconstruction and analyses of the outbreak.
Additional file 2: Nexus file corresponding to the maximum likelihoodtree shown in Figure 3. Each sequence has been colored according to the
González-Candelas et al. BMC Biology 2013, 11:76 Page 12 of 13http://www.biomedcentral.com/1741-7007/11/76
coloring scheme used in that figure. The file can be opened and visualizedwith FigTree (available from http://tree.bio.ed.ac.uk/software/figtree).
Additional file 3: Newick file used to test the alternative hypothesisfor each patient suspected to be part of the outbreak. This tree wasmanually edited to replace the sequence labeled ‘test’ by the cladeconformed by all the sequences derived from each patient and its likelihoodwas compared with that of the original tree (without the ‘test’ sequence).
Additional file 4: BEAST (‘Bayesian Evolutionary Analysis bySampling Trees’) file used for deriving the date of infection ofpatients included in the outbreak. This file corresponds to patient10,067 and the sequenced used was picked at random from the clonedE1-E2 sequences available for this patient. The same procedure, usingone random E1-E2 sequence, was applied to the remaining patients inthe outbreak.
Additional file 5: Figure S1. Comparison between estimates ofinfection dates obtained by the Bayesian method with a relaxedmolecular clock implemented in BEAST (‘Bayesian Evolutionary Analysisby Sampling Trees’) and those obtained independently by theprosecution when more than one possible infection date was consideredlikely by the prosecution. Bayesian estimates are provided as mediansand 95% highest posterior density (HPD) intervals. Prosecution estimatesare shown as red (most likely date of infection as indicated during thetrial) or dark-blue dots (alternative dates).
Competing interestsThe authors declare that they have no competing interests.
Authors’ contributionsFG-C, MAB and AM designed research; FG-C, MAB, BW and AM performedresearch; FG-C and BW analyzed data; and FG-C wrote the paper. All authorsread and approved the final manuscript.
AcknowledgementsWe thank the technical assistance of M Torres, N Jiménez and theSequencing Service (SCSIE) from the University of Valencia. We are indebtedto H Vanaclocha, F Martínez, J García de Lomas, M Gobernado, E Ortega andthe other members of the Comisión Científica para el Estudio del Brote deHepatitis C-1a de la Ciudad de Valencia-1998 for their support anddiscussions during the early stages of the investigation of the outbreak. Wethank the prosecutor, J Carceller, for kindly providing access to his estimatesof dates of infection. We also thank the comments and observations byanonymous reviewers that helped to improve the first versions of themanuscript. Financial support for this research was provided by GeneralitatValenciana (Direcció General de Salut Pública, Conselleria de Sanitat).Additional funds were received from the Spanish Government (projectsBMC2001-3096, BFU2005-00503/BMC from MCYT, CP07/00078 from ISCIII-FIS,BFU2008-03000 from MICINN and BFU2011-24112 from MECO) and theEuropean Union (projects HPMD-CT-2000-00056 and MERG-CT-2004-006328).
Author details1Joint Research Unit ‘Genómica y Salud’ CSISP (FISABIO), Instituto Cavanilles/Universidad de Valencia, c/ Catedrático José Beltrán, 2 46980-Paterna,Valencia, Spain. 2Centro de Investigación Biomédica en Red enEpidemiología y Salud Pública (CIBERESP), Valencia, Spain. 3Department ofGenetics and Marine Biotechnology, Institute of Oceanology, Polish Academyof Sciences, Powstańców Warszawy 55, 81-712 Sopot, Poland. 4Laboratory ofBioinformatics, Institute of Molecular Biology and Biotechnology, AdamMickiewicz University in Poznań, Umultowska 89, 61-614 Poznań, Poland.
Received: 26 July 2012 Accepted: 24 May 2013Published: 19 July 2013
References1. Ou CY, Ciesielski CA, Myers G, BAndea CI, Luo CC, Korber BTM, Mullins JI,
Schochetman G, Berkelman RL, Economou AN, Witte JJ, Furman LJ, SattenGA, Maclnnes KA, Curran JW, Jaffe HW, Laboratory Investigation Group,Epidemiologic Investigation Group: Molecular epidemiology of HIVtransmission in a dental practice. Science 1992, 256:1165–1171.
2. Esteban JI, Gómez J, Martell M, Cabot B, Quer J, Camps J, González A, OteroT, Moya A, Esteban R, Guardia J: Transmission of hepatitis C virus by acardiac surgeon. N Engl J Med 1996, 334:555–560.
3. Birch CJ, McCaw RF, Bulach DM, Revill PA, Carter JT, Tomnay J, Hatch B,Middleton TV, Chibo D, Catton MG, Pankhurst JL, Breschkin AM, LocarniniSA, Bowden DS: Molecular analysis of human immunodeficiency virusstrains associated with a case of criminal transmission of the virus.J Infect Dis 2000, 182:941–944.
4. Metzker ML, Mindell DP, Liu XM, Ptak RG, Gibbs RA, Hillis DM: Molecularevidence of HIV-1 transmission in a criminal case. Proc Natl Acad Sci USA2002, 99:14292–14297.
5. Bracho MA, Gosalbes MJ, Blasco D, Moya A, Gonzalez-Candelas F: Molecularepidemiology of a hepatitis C virus outbreak in a hemodialysis unit.J Clin Microbiol 2005, 43:2750–2755.
6. Learn GH, Mullins JI: The microbial forensic use of HIV sequences. In HIVSequence Compendium 2003. Edited by Leitner T, Foley B, Hahn B, Marx P,McCutchan F, Mellors J, Wolinsky F, Korber B. Los Alamos, NM: TheoreticalBiology and Biophysics Group, Los Alamos National Laboratory; 2003:22–37.
7. Scaduto DI, Brown JM, Haaland WC, Zwickl DJ, Hillis DM, Metzker ML:Source identification in two criminal cases using phylogeneticanalysis of HIV-1 DNA sequences. Proc Natl Acad Sci USA 2010,107:21242–21247.
8. Penin F, Dubuisson J, Rey FA, Moradpour D, Pawlotsky JM: Structuralbiology of hepatitis C virus. Hepatology 2004, 39:5–19.
9. Lavanchy D: Evolving epidemiology of hepatitis-C virus. Clin MicrobiolInfect 2011, 17:107–115.
10. Afdhal NH: The natural history of hepatitis C. Semin Liver Dis 2004, 24:3–8.11. Esteban JI, Sauleda S, Quer J: The changing epidemiology of hepatitis C
virus infection in Europe. J Hepatol 2008, 48:148–162.12. Akehurst C: Outbreak of hepatitis C associated with two hospitals in
Spain. Euro Surveill 1998, 2:1217.13. Simmonds P, Tuplin A, Evans DJ: Detection of genome-scale ordered RNA
structure (GORS) in genomes of positive-stranded RNA viruses: implicationsfor virus evolution and host persistence. RNA 2004, 10:1337–1351.
14. Gonzalez-Candelas F, Bracho MA, Moya A: Molecular epidemiology andforensic genetics: application to a hepatitis C virus transmission event ata hemodialysis unit. J Infect Dis 2003, 187:352–358.
15. Evett IW, Weir BS: Interpreting DNA evidence. Sunderland, MA: Sinauer; 1998.16. Drummond AJ, Rambaut A: BEAST: Bayesian evolutionary analysis by
sampling trees. BMC Evol Biol 2007, 7:214.17. Wrobel B, Torres-Puente M, Jimenez N, Bracho MA, Garcia-Robles I, Moya A,
Gonzalez-Candelas F: Analysis of the overdispersed clock in the short-termevolution of hepatitis C virus: using the E1/E2 gene sequences to inferinfection dates in a single source outbreak. Mol Biol Evol 2006, 23:1242–1253.
18. Drummond AJ, Pybus OG, Rambaut A, Forsberg R, Rodrigo AG: Measurablyevolving populations. Trends Ecol Evol 2003, 18:481–488.
19. Holmes EC: The Evolution and Emergence of RNA Viruses. Oxford, UK: OxfordUniversity Press; 2009.
20. Machuca R, Jorgensen LB, Theilade P, Nielsen C: Molecular investigation oftransmission of human immunodeficiency virus type 1 in a criminalcase. Clin Diagn Lab Immunol 2001, 8:884–890.
21. Lemey P, Van Dooren S, Van Laethem K, Schrooten Y, Derdelinckx I, GoubauP, Brun-Vezinet F, Vaira D, Vandamme AM: Molecular testing of multipleHIV-1 transmissions in a criminal case. AIDS 2005, 19:1649–1658.
22. Rogers AS, Froggatt JW III, Townsend T, Gordon T, Brown AJ, Holmes EC,Zhang LQ, Moses H III: Investigation of potential HIV transmission to thepatients of an HIV-infected surgeon. JAMA 1993, 269:1795–1801.
23. Blanchard A, Ferris S, Chamaret S, Guetard D, Montagnier L: Molecularevidence for nosocomial transmission of human immunodeficiency virusfrom a surgeon to one of his patients. J Virol 1998, 72:4537–4540.
24. Goujon CP, Schneider VM, Grofti J, Montigny J, Jeantils V, Astagneau P,Rozenbaum W, Lot F, Frocrain-Herchkovitch C, Delphin N, Le Gal F, NicolasJC, Milinkovitch MC, Dény P: Phylogenetic analyses indicate an atypicalnurse-to-patient transmission of human immunodeficiency virus type I.J Virol 2000, 74:2525–2532.
25. Power JP, Lawlor E, Davidson F, Holmes EC, Yap PL, Simmonds P: Molecularepidemiology of an outbreak of infection with hepatitis C virus inrecipients of anti-D immunoglobulin. Lancet 1995, 345:1211–1213.
26. Wiese M, Berr F, Lafrenz M, Porst H, Oesen U: Low frequency of cirrhosis ina hepatitis C (genotype 1b) single-source outbreak in Germany: a 20-yearmulticenter study. Hepatology 2000, 32:91–96.
González-Candelas et al. BMC Biology 2013, 11:76 Page 13 of 13http://www.biomedcentral.com/1741-7007/11/76
27. Blackard JT: HCV superinfection and reinfection. Antivir Ther 2012,17:1443–1448.
28. Di Liberto G, Roque-Afonso AM, Kara R, Ducoulombier D, Fallot G, SamuelD, Feray C: Clinical and therapeutic implications of hepatitis C viruscompartmentalization. Gastroenterology 2006, 131:76–84.
29. Fan X, Lyra AC, Di Bisceglie AM: Compartmentalization of hepatitis C viralquasispecies. In Frontiers in Viral Hepatitis. Edited by Raymond FS, Jean-Pierre S, Charles MR. Amsterdam, The Netherlands: Elsevier; 2003:123–130.
30. Farci P: New insights into the HCV quasispecies andcompartmentalization. Semin Liver Dis 2011, 31:356–374.
31. Roque-Afonso AM, Ducoulombier D, Di Liberto G, Kara R, Gigou M, DussaixE, Samuel D, Feray C: Compartmentalization of hepatitis C virusgenotypes between plasma and peripheral blood mononuclear cells.J Virol 2005, 79:6349–6357.
32. Schramm F, Soulier E, Royer C, Weitten T, Fafi-Kremer S, Brignon N,Meyer N, Ellero B, Woehl-Jaegle ML, Meyer C, Wolf P, Doffoël M, BaumertTF, Stoll-Keller F, Schvoerer E: Frequent compartmentalization ofhepatitis C virus with leukocyte-related amino acids in the setting ofliver transplantation. J Infect Dis 2008, 198:1656–1666.
33. Zehender G, De Maddalena C, Bernini F, Ebranati E, Monti G, Pioltelli P,Galli M: Compartmentalization of hepatitis C virus quasispecies inblood mononuclear cells of patients with mixed cryoglobulinemicsyndrome. J Virol 2005, 79:9145–9156.
34. Gray RR, Salemi M, Klenerman P, Pybus OG: A new evolutionary model forhepatitis C virus chronic infection. PLoS Pathog 2012, 8:e1002656.
35. Gray RR, Strickland SL, Veras NM, Goodenow MM, Pybus OG, Lemon SM,Fried MW, Nelson DR, Salemi M: Unexpected maintenance of hepatitis Cviral diversity following liver transplantation. J Virol 2012, 86:8432–8439.
36. Li H, Stoddard MB, Wang S, Blair LM, Giorgi EE, Parrish EH, Learn GH, HraberP, Goepfert PA, Saag MS, Denny TN, Haynes BF, Hahn BH, Ribeiro RM,Perelson AS, Korber BT, Bhattacharya T, Shaw GM: Elucidation of hepatitis Cvirus transmission and early diversification by single genomesequencing. PLoS Pathog 2012, 8:e1002880.
37. Löve A, Molnegren V, Månsson AS, Smáradóttir A, Thorsteinsson SB, WidellA: Evolution of hepatitis C virus variants following blood transfusionfrom one infected donor to several recipients: a long-term follow-up.J Gen Virol 2004, 85:441–450.
38. ProMED: Hepatitis C - USA (07): (NH) nosocomial 20120816.1247522. http://www.promedmail.com/direct.php?id=20130607.1760734.
39. González-Candelas F, Moya A: Time and rate of evolution are the key toestablish transmission cases. AIDS 2005, 19:1552–1553.
40. Pillay D, Fisher M: Primary HIV infection, phylogenetics, and antiretroviralprevention. J Infect Dis 2007, 195:924–926.
41. Capobianchi MR, Giombini E, Rozera G: Next-generation sequencingtechnology in clinical virology. Clin Microbiol Infect 2013, 19:15–22.
42. Prosperi M, Prosperi L, Bruselles A, Abbate I, Rozera G, Vincenti D, SolmoneMC, Capobianchi MR, Ulivi G: Combinatorial analysis and algorithms forquasispecies reconstruction using next-generation sequencing.BMC Bioinforma 2011, 12:5.
43. Archer J, Baillie G, Watson S, Kellam P, Rambaut A, Robertson D: Analysis ofhigh-depth sequence data for studying viral diversity: a comparison ofnext generation sequencing platforms using Segminator II.BMC Bioinforma 2012, 13:47.
44. Escobar-Gutiérrez A, Vazquez-Pichardo M, Cruz-Rivera M, Rivera-Osorio P,Carpio-Pedroza JC, Ruíz-Pacheco JA, Ruiz-Tovar K, Vaughan G: Identificationof hepatitis C virus transmission using a next-generation sequencingapproach. J Clin Microbiol 2012, 50:1461–1463.
45. Pybus OG, Fraser C, Rambaut A: Evolutionary epidemiology: preparing foran age of genomic plenty. Phil Trans R Soc B 2013, 368:20120193.
46. Drummond AJ, Suchard MA, Xie D, Rambaut A: Bayesian phylogeneticswith BEAUti and the BEAST 1.7. Mol Biol Evol 2012, 29:1969–1973.
47. Suchard MA, Rambaut A: Many-core algorithms for statisticalphylogenetics. Bioinformatics 2009, 25:1370–1376.
48. Karmochkine M, Carrat F, Dos Santos O, Cacoub P, Raguin G: A case-controlstudy of risk factors for hepatitis C infection in patients withunexplained routes of infection. J Viral Hep 2006, 13:775–782.
49. Prati D: Transmission of hepatitis C virus by blood transfusions and othermedical procedures: a global review. J Hepatol 2006, 45:607–616.
50. Thompson JD, Higgins DG, Gibson TJ: CLUSTAL W: improving thesensitivity of progressive multiple sequence alignment through
sequence weighting, positions-specific gap penalties and weight matrixchoice. Nucl Acids Res 1994, 22:4673–4680.
51. Kumar S, Tamura K, Jakobsen IB, Nei M: MEGA2: molecular evolutionarygenetics analysis software. Bioinformatics 2001, 17:1244–1245.
52. Saitou N, Nei M: The neighbor-joining method: a new method forreconstructing phylogenetic trees. Mol Biol Evol 1987, 4:406–425.
53. Kimura M: A simple method for estimating rate of base substitutionthrough comparative studies of nucleotide sequences. J Mol Evol 1980,16:111–120.
54. Guindon S, Gascuel O: A simple, fast, and accurate algorithm to estimatelarge phylogenies by maximum likelihood. Syst Biol 2003, 52:696–704.
55. Posada D, Crandall KA: Modeltest: testing the model of DNA substitution.Bioinformatics 1998, 14:917–918.
56. Akaike H: A new look at the statistical model identification. IEEE Trans InfTech Biomed 1974, 19:716–723.
57. Felsenstein J: Confidence limits on phylogenies: an approach using thebootstrap. Evolution 1985, 39:783–791.
58. Olsen GJ, Matsuda H, Hagstrom R, Overbeek R: fastDNAml: a tool forconstruction of phylogenetic trees of DNA sequences using maximumlikelihood. Comput Applic Biosci 1994, 10:41–48.
59. Drummond AJ, Ho SYW, Phillips MJ, Rambaut A: Relaxed phylogeneticsand dating with confidence. PLoS Biol 2006, 4:e88.
doi:10.1186/1741-7007-11-76Cite this article as: González-Candelas et al.: Molecular evolution incourt: analysis of a large hepatitis C virus outbreak from an evolvingsource. BMC Biology 2013 11:76.
Submit your next manuscript to BioMed Centraland take full advantage of:
• Convenient online submission
• Thorough peer review
• No space constraints or color figure charges
• Immediate publication on acceptance
• Inclusion in PubMed, CAS, Scopus and Google Scholar
• Research which is freely available for redistribution
Submit your manuscript at www.biomedcentral.com/submit