Embed Size (px)
Citation preview

7/31/2019 Analysis of 3D Surface Data for on-line Determination of the Size Distribution of Iron Ore Pellet Piles on Conveyor …
http://slidepdf.com/reader/full/analysis-of-3d-surface-data-for-on-line-determination-of-the-size-distribution 1/130
L IC EN TI AT E T H E S I S
Luleå University of TechnologyDepartment of Computer Science and Electrical Engineering
EISLAB
2007:48 | : 402- 757 | : - c -- 07⁄48 --
2007:48
Analysis of 3D surface data for on-linedetermination of the size distribution
of iron ore pellet piles on conveyor belt
Tobias Andersson

7/31/2019 Analysis of 3D Surface Data for on-line Determination of the Size Distribution of Iron Ore Pellet Piles on Conveyor …
http://slidepdf.com/reader/full/analysis-of-3d-surface-data-for-on-line-determination-of-the-size-distribution 2/130

7/31/2019 Analysis of 3D Surface Data for on-line Determination of the Size Distribution of Iron Ore Pellet Piles on Conveyor …
http://slidepdf.com/reader/full/analysis-of-3d-surface-data-for-on-line-determination-of-the-size-distribution 3/130
Analysis of 3D surface data foron-line determination of the size
distribution of iron ore pellet pileson conveyor belt
Tobias Andersson
EISLABDept. of Computer Science and Electrical Engineering
Lulea University of TechnologyLulea, Sweden
Supervisors:
Associate Professor Johan CarlsonAssistant Professor Matthew J. Thurley

7/31/2019 Analysis of 3D Surface Data for on-line Determination of the Size Distribution of Iron Ore Pellet Piles on Conveyor …
http://slidepdf.com/reader/full/analysis-of-3d-surface-data-for-on-line-determination-of-the-size-distribution 4/130
ii

7/31/2019 Analysis of 3D Surface Data for on-line Determination of the Size Distribution of Iron Ore Pellet Piles on Conveyor …
http://slidepdf.com/reader/full/analysis-of-3d-surface-data-for-on-line-determination-of-the-size-distribution 5/130
To Anna

7/31/2019 Analysis of 3D Surface Data for on-line Determination of the Size Distribution of Iron Ore Pellet Piles on Conveyor …
http://slidepdf.com/reader/full/analysis-of-3d-surface-data-for-on-line-determination-of-the-size-distribution 6/130
iv

7/31/2019 Analysis of 3D Surface Data for on-line Determination of the Size Distribution of Iron Ore Pellet Piles on Conveyor …
http://slidepdf.com/reader/full/analysis-of-3d-surface-data-for-on-line-determination-of-the-size-distribution 7/130
Abstract
Size measurement of iron ore pellets in industry is usually performed by manual samplingand sieving techniques. The manual sampling is performed infrequently and is inconsis-tent, invasive and time-consuming. Iron ore pellet’s sizes are critical to the efficiency of the blast furnace process in the production of steel. Overly coarse pellets affect the blastfurnace process negatively, however this affect can be minimized by operating the furnacewith different parameters. An on-line system for measurement of pellet sizes would im-prove productivity through fast feedback and efficient control of the blast furnace. Also,fast feedback of pellet sizes would improve pellet quality in pellet production.
Image analysis techniques promise a quick, inexpensive, consistent and non-contactsolution to determining the size distribution of a pellet pile. Such techniques captureinformation of the surface of the pellet pile which is then used to infer the pile sizedistribution. However, there are a number of sources of error relevant to surface analysistechniques.
The objective of this thesis is to address and overcome aspects of these sources of
error relevant to surface analysis techniques. The research problem is stated as:How can the pellet pile size distribution be estimated with surface analysistechniques using image analysis?
This problem is addressed by dividing the problem into sub-problems. The focusof the presented work is to develop techniques to overcome, or minimize, two of thesesources of error; overlapped particle error and prole error. Overlapped particle errordescribes the fact that many pellets on the surface of a pile are only partially visible anda large bias results if they are sized as if they were smaller entirely visible pellets. Noother researchers make this determination. Prole error describes the fact that only one
side of an entirely visible pellet can be seen making it difficult to estimate pellets size.Statistical classication methods are used to overcome these sources of error.
The thesis is divided into two parts. The rst part contains an introduction to theresearch area together with a summary of the contributions, and the second part is acollection of four papers describing the research.
v

7/31/2019 Analysis of 3D Surface Data for on-line Determination of the Size Distribution of Iron Ore Pellet Piles on Conveyor …
http://slidepdf.com/reader/full/analysis-of-3d-surface-data-for-on-line-determination-of-the-size-distribution 8/130
vi
7/31/2019 Analysis of 3D Surface Data for on-line Determination of the Size Distribution of Iron Ore Pellet Piles on Conveyor …
http://slidepdf.com/reader/full/analysis-of-3d-surface-data-for-on-line-determination-of-the-size-distribution 9/130
Contents
Chapter 1 – Thesis Introduction 11.1 Introduction . . . . . . . . . . . . . . . . . . . . . . . . . . . . . . . . . . 11.2 Statement of research problem . . . . . . . . . . . . . . . . . . . . . . . . 21.3 Thesis outline . . . . . . . . . . . . . . . . . . . . . . . . . . . . . . . . . 3
Chapter 2 – Iron ore to steel 5Chapter 3 – Size measurement techniques 7
3.1 Size measurement techniques . . . . . . . . . . . . . . . . . . . . . . . . . 73.2 Manual sampling and sieving . . . . . . . . . . . . . . . . . . . . . . . . 73.3 Image analysis . . . . . . . . . . . . . . . . . . . . . . . . . . . . . . . . . 8
Chapter 4 – Summary of contribution 114.1 Summary of contribution . . . . . . . . . . . . . . . . . . . . . . . . . . . 114.2 Conclusions . . . . . . . . . . . . . . . . . . . . . . . . . . . . . . . . . . 144.3 Future Research . . . . . . . . . . . . . . . . . . . . . . . . . . . . . . . . 14
Appendix A – An introduction to multivariate discriminant analysis 171 Introduction . . . . . . . . . . . . . . . . . . . . . . . . . . . . . . . . . . 172 Denitions and notations . . . . . . . . . . . . . . . . . . . . . . . . . . . 173 Graphical methods . . . . . . . . . . . . . . . . . . . . . . . . . . . . . . 234 Discriminant analysis . . . . . . . . . . . . . . . . . . . . . . . . . . . . . 285 Logistic regression . . . . . . . . . . . . . . . . . . . . . . . . . . . . . . 336 Variable selection procedures . . . . . . . . . . . . . . . . . . . . . . . . . 357 Estimating probabilities of misclassication . . . . . . . . . . . . . . . . . 36
Paper A 43
1 Introduction . . . . . . . . . . . . . . . . . . . . . . . . . . . . . . . . . . 452 Methods . . . . . . . . . . . . . . . . . . . . . . . . . . . . . . . . . . . . 463 Performance of spherical tting . . . . . . . . . . . . . . . . . . . . . . . 484 Conclusions . . . . . . . . . . . . . . . . . . . . . . . . . . . . . . . . . . 54
Paper B 571 Introduction . . . . . . . . . . . . . . . . . . . . . . . . . . . . . . . . . . 592 Sample of Pellet Pile . . . . . . . . . . . . . . . . . . . . . . . . . . . . . 603 Estimating Pellet Size . . . . . . . . . . . . . . . . . . . . . . . . . . . . 614 Classication . . . . . . . . . . . . . . . . . . . . . . . . . . . . . . . . . 635 Validation of Visibility Classication . . . . . . . . . . . . . . . . . . . . 67
vii

7/31/2019 Analysis of 3D Surface Data for on-line Determination of the Size Distribution of Iron Ore Pellet Piles on Conveyor …
http://slidepdf.com/reader/full/analysis-of-3d-surface-data-for-on-line-determination-of-the-size-distribution 10/130
viii
6 Overcoming Overlapped Particle Error . . . . . . . . . . . . . . . . . . . 677 Conclusion . . . . . . . . . . . . . . . . . . . . . . . . . . . . . . . . . . . 68
8 Acknowledgment . . . . . . . . . . . . . . . . . . . . . . . . . . . . . . . 68Paper C 73
1 Introduction . . . . . . . . . . . . . . . . . . . . . . . . . . . . . . . . . . 752 Sample of Pellet Pile . . . . . . . . . . . . . . . . . . . . . . . . . . . . . 773 Size and Shape Measurement Methods . . . . . . . . . . . . . . . . . . . 794 Sieve Size Classication . . . . . . . . . . . . . . . . . . . . . . . . . . . 815 Conclusions . . . . . . . . . . . . . . . . . . . . . . . . . . . . . . . . . . 866 Acknowledgment . . . . . . . . . . . . . . . . . . . . . . . . . . . . . . . 88
Paper D 91
1 Introduction . . . . . . . . . . . . . . . . . . . . . . . . . . . . . . . . . . 932 Segmentation of 3D Surface Data . . . . . . . . . . . . . . . . . . . . . . 953 Overcoming Overlapped Particle Error . . . . . . . . . . . . . . . . . . . 994 Industrial System . . . . . . . . . . . . . . . . . . . . . . . . . . . . . . . 1035 Future research . . . . . . . . . . . . . . . . . . . . . . . . . . . . . . . . 1086 Comments . . . . . . . . . . . . . . . . . . . . . . . . . . . . . . . . . . . 1087 Conclusion . . . . . . . . . . . . . . . . . . . . . . . . . . . . . . . . . . . 1098 Acknowledgments . . . . . . . . . . . . . . . . . . . . . . . . . . . . . . . 109

7/31/2019 Analysis of 3D Surface Data for on-line Determination of the Size Distribution of Iron Ore Pellet Piles on Conveyor …
http://slidepdf.com/reader/full/analysis-of-3d-surface-data-for-on-line-determination-of-the-size-distribution 11/130
Preface
Thank you, Assistant Professor Olov Marklund. You have inspired me and I will alwaysremember our talks. Your thoughts were great.
Assistant Professor Matthew J. Thurley, without your expert knowledge I would notbe here today. Your guidance and advice have been invaluable. You are always supportiveand help without hesitation even though you have your day full. I am very grateful forthat. I’m glad you and your family moved to Sweden and I hope you like it here.
I thank my new supervisor, Associate Professor Johan E. Carlsson, for all support,especially in stressful times.
I thank Professor Kerstin V¨annman at the Department of Mathematics for her knowl-edge in statistics and her generous assistance. Our discussion about multivariate methodsand how they can be applied have proven very important. I would also like to thankPh.D. student Malin Albing for the discussions related to statistics.
I also thank the staff at ProcessIT Innovations for all their time and effort in makingthis research possible. I thank all industry partners in the research project; MBV Sys-
tems, Boliden, LKAB, SSAB and SICK-IVP. Also, VINNOVA (Swedish GovernmentalAgency for Innovation Systems) supported the project and I am grateful for that.
All colleagues at the Department of Computer Science and Electrical Engineering, Iwould like to thank you as you are the ones that make my work place to what it is. Iespecially want to thank Tamas Jantvik for comments and suggestions to my work, JesperMartinsson for always having an answer and Fredrik H¨ agglund for great competition.
I thank my family who I know always care for me.Finally, I thank you Anna for your love, support and encouragement. You make me
happy and I would not have had the energy to write this thesis without you. I love everyday we share.
ix

7/31/2019 Analysis of 3D Surface Data for on-line Determination of the Size Distribution of Iron Ore Pellet Piles on Conveyor …
http://slidepdf.com/reader/full/analysis-of-3d-surface-data-for-on-line-determination-of-the-size-distribution 12/130
x

7/31/2019 Analysis of 3D Surface Data for on-line Determination of the Size Distribution of Iron Ore Pellet Piles on Conveyor …
http://slidepdf.com/reader/full/analysis-of-3d-surface-data-for-on-line-determination-of-the-size-distribution 13/130

7/31/2019 Analysis of 3D Surface Data for on-line Determination of the Size Distribution of Iron Ore Pellet Piles on Conveyor …
http://slidepdf.com/reader/full/analysis-of-3d-surface-data-for-on-line-determination-of-the-size-distribution 14/130
xii

7/31/2019 Analysis of 3D Surface Data for on-line Determination of the Size Distribution of Iron Ore Pellet Piles on Conveyor …
http://slidepdf.com/reader/full/analysis-of-3d-surface-data-for-on-line-determination-of-the-size-distribution 15/130
Chapter 1
Thesis Introduction
1.1 IntroductionThis thesis is the result of my work in the 3D measurement project, which was coordinatedby ProcessIT Innovations 1. The goal of ProcessIT Innovations is to bring different partiesin the local region together and strengthen industry, university and the local community.The 3D measurement project was a collaboration between Boliden, LKAB, SSAB, SICK-IVP, MBV Systems, Monash University and Lulea University of Technology.
1.1.1 BackgroundTo produce steel efficiently, excavated iron ore is often upgraded to a high quality productcalled iron ore pellets. Annually, LKAB produce over 20 million tons of iron ore pelletsin their pelletizing plants. Iron ore pellets are an important product and account for over75 % of LKAB’s sales each year. LKAB’s intention is to further improve the pelletizationprocess and increase their sales of iron ore pellets.
LKAB produce a variety of pellet products that differ in chemical composition andsize to meet various steel producer’s demands. One of the major quality aspects of ironore pellets is their size. Variation in the pellet size distribution affects the steel productionprocess negatively [1] and improved control of the pelletizing process is desired to producea pellet product with higher quality.
Manual sampling followed by sieving with a square mesh is generally used for qual-ity control. This measurement technique is invasive, inconsistent, time consuming andhas long response times. These properties make the results of the manual estimationof pellets size unsuitable for process control. Automatic on-line analysis of pellet sizebased on image analysis techniques would allow non-invasive, frequent and consistentmeasurement. The results from an image analysis system would be possible to use for
1ProcessIT Innovations is a collaboration between the process- and manufacturing indus-try, universities and product-owning companies in the Norrbotten and V¨ asterbotten region.http://www.processitinnovations.se
1

7/31/2019 Analysis of 3D Surface Data for on-line Determination of the Size Distribution of Iron Ore Pellet Piles on Conveyor …
http://slidepdf.com/reader/full/analysis-of-3d-surface-data-for-on-line-determination-of-the-size-distribution 16/130
2 Thesis Introduction
efficient control of the pelletizing process and also control of the blast furnace.The 3D measurement project’s objective was to develop algorithms to allow on-line
determination of the size distribution of iron ore pellet piles on conveyor belts. The maingoal of the project was to implement an industrial prototype to be installed in a pelletplant.
1.2 Statement of research problemImage analysis techniques promise a quick, inexpensive and non-contact solution to de-termining the size distribution of a pellet pile. Such techniques capture information of thesurface of the pellet pile which is then used to infer the pile size distribution. However,Thurley and Ng [2] identies a number of sources of error relevant to surface analysis
techniques.
1.2.1 Sources of error relevant to surface analysis techniquesThe sources of errors relevant to surface analysis techniques identied by Thurley andNg are:
• Segregation and grouping error, more generally known as the brazil nut effect [3],describes the tendency of the pile to separate into groups of similarly sized particles.It is caused by vibration or motion (for example as rocks are transported by truckor conveyor) with large particles being moved to the surface.
• Capturing error [4, 5], describes the varying probability based on size, that a particlewill appear on the surface of the pile.
• Prole error, describes the fact that only one side of an entirely visible particle canbe seen making it difficult to estimate the particles size.
• Overlapped particle error, describes the fact that many particles are only partiallyvisible and a large bias to the smaller size classes results if they are treated as smallentirely visible particles and sized using only their visible prole.
1.2.2 Research problemsThe objective of this thesis is to address the sources of error relating to surface analysistechniques and develop algorithms to overcome these. The research problem is stated as:
How can the pellet pile size distribution be estimated with surface analysistechniques using image analysis?
This is a broad question and to be able to approach this question it is divided into morespecic questions that are addressed separately. The main goal for the 3D measurementproject was to develop algorithms that allow on-line determination of the size distribution

7/31/2019 Analysis of 3D Surface Data for on-line Determination of the Size Distribution of Iron Ore Pellet Piles on Conveyor …
http://slidepdf.com/reader/full/analysis-of-3d-surface-data-for-on-line-determination-of-the-size-distribution 17/130
1.3. Thesis outline 3
of iron ore green pellet piles on conveyor belt. Before the iron ore green pellets are bakedin the kiln, they are wet and sticky and remain almost entirely xed in place when
they are transported along the conveyor belt. Therefore, segregation and grouping errorappears not to be signicant in this case. Capturing error is not addressed in this thesisand remain to be investigated in the future. The remaining two predominant sourcesof error, prole error and overlapped particle error, are addressed in this thesis. Tworesearch questions are formulated to address these sources of error:
1. Can overlapped particle error be overcome by identication and exclusion of partially visible pellets from any size estimates?
2. Can different size and shape measurements be analyzed to minimize the prole error?
1.2.3 Research methodIn this research project we used an imagining system that captured 3D surface databased on a projected laser line and camera triangulation. It has a high speed digitalcamera capable of 4000 frames per second and a continuous wave diode laser with linegenerating optics. Two implementations of this setup were used; one in laboratory andone industrial prototype installed at LKAB’s pellet plant in Malmberget.
The initial research work was performed on data captured in the controlled laboratoryenvironment. The results from this research was then applied to an industrial prototype
imaging and analysis system that measures the pellet sieve size distribution into 9 sievesize classes between 5 mm and 16+ mm.
1.3 Thesis outlineThe thesis is divided into two parts. Part I gives the general background of the thesiswork. Part II of the thesis is composed of a collection of journal and conference papers.An introduction to iron ore mining and steel production is given in Chapter 2, whichhelps the reader to understand what pellets are. Chapter 3 introduce the reader to sizemeasurement techniques and in Chapter 4 a summary of contributions presented in the
papers is given. Finally, an introduction to multivariate methods is given in appendix Aas multivariate methods are used in the theoretical work of paper B and C.

7/31/2019 Analysis of 3D Surface Data for on-line Determination of the Size Distribution of Iron Ore Pellet Piles on Conveyor …
http://slidepdf.com/reader/full/analysis-of-3d-surface-data-for-on-line-determination-of-the-size-distribution 18/130
4 Thesis Introduction

7/31/2019 Analysis of 3D Surface Data for on-line Determination of the Size Distribution of Iron Ore Pellet Piles on Conveyor …
http://slidepdf.com/reader/full/analysis-of-3d-surface-data-for-on-line-determination-of-the-size-distribution 19/130
Chapter 2
Iron ore to steel
A short introduction to steel production is given here to introduce the reader to ironore pellets. Most of the information in this chapter is taken from LKAB’s informationbrochure [6] where LKAB’s process chain is explained. Information about the blastfurnace process is taken from SSAB’s information brouchure [7].
LKAB’s process chain begins at a depth of 1000 meters beneath the original peaksof the mountains in Kiruna and Malmberget. Mining at this depth is expensive andlarge-scale mining methods are a necessity for a protable process. In total, about 40million tonnes of crude ore is mined every year. The ore is mined using sublevel cavingmethods. Tunnels are made into the ore body and holes that are charged with explosivesare drilled into the roof. The explosives are blasted and load haul dump units hauls theblasted rocks to a crusher.
The crushed ore is then hoisted to surface level for further renement in processingplants. In the concentration plants, the crushed ore is ground to a ne powder in severalsteps. Undesirable components are removed by magnetic separators and nally the con-centrate is mixed with water to form a slurry. The slurry is pumped to a pelletizing plantwhere the slurry is dewatered. Depending on which pellet product is to be produced,additional binders and additives are added. Examples of additives are olivine, quartize,limestone and dolomite.
At this stage, the mixture is transported into large spinning drums or onto largedisks. The mixture is aggregated into small green pellets. The size of the pellets may becontrolled by the amount of binders added, amount of water removed and speed of thepelletizing drums and disks.
As soon as the pellets are formed to the correct size, they are transported on con-veyor belt into a large kiln at 1250 degrees Celsius to become hardened pellets that canwithstand long transports by rail and ship. The pellets are then sold to steel producersfor use in blast furnaces for steel production or for use in direct reduction processes forsponge iron production.
SSAB is a steel producer in Lulea that uses iron ore pellets produced in Kiruna andMalmberget. The pellets are fed into their blast furnace together with coke, lime and
5

7/31/2019 Analysis of 3D Surface Data for on-line Determination of the Size Distribution of Iron Ore Pellet Piles on Conveyor …
http://slidepdf.com/reader/full/analysis-of-3d-surface-data-for-on-line-determination-of-the-size-distribution 20/130
6 Iron ore to steel
other additives. The mixture slowly sinks through the blast furnace while hot blast airand carbon powder is blown into the lower part. The process through the blast furnace
takes approximately eight hours. At 2200 degrees Celsius the coke pieces are incineratedand raw iron collects at in the bottom of the furnace, from where it is poured. The dailyproduction of raw iron ore is approximately 6500 tons.
Finally, to produce steel the raw iron have to be rened in a metallurgy renery wheresulphur, carbon and other components are removed from the iron. The carbon content isreduced using acid and when the carbon content is less than 2%, the iron becomes steel.

7/31/2019 Analysis of 3D Surface Data for on-line Determination of the Size Distribution of Iron Ore Pellet Piles on Conveyor …
http://slidepdf.com/reader/full/analysis-of-3d-surface-data-for-on-line-determination-of-the-size-distribution 21/130
Chapter 3
Size measurement techniques
3.1 Size measurement techniques
This chapter describe the available size measurement techniques for iron ore pellets.Manual sampling and sieving techniques are used for quality control of pellet’s size.Limited work have been presented on size estimation of pellets using image analysis.Most work on particle size measurement using image analysis has focused on size andshape analysis of rock fragments and this work is briey reviewed here.
3.2 Manual sampling and sieving
To get an estimate of the produced pellet sieve size distribution, a sample is manuallycollected from the conveyor belt after a pelletizing drum or disk. The sample is collectedby moving a bucket under the stream of pellets that falls from one conveyor belt ontoanother. The speed of the movement should be constant throughout the complete move-ment under the stream of pellets. This is of course difficult to achieve in practice andmakes the manual sampling process inconsistent.
After collection, the sample is measured to estimate the sieve size distribution. Asample of green pellets requires a careful manual sampling as the pellets are quite softand fragile.
The method of manual sampling to estimate pellet’s sieve size distribution is a time-consuming process. It is not suitable for process control as the long response times resultin tons of pellet’s produced before any change is possible depending on the sieve size resultobtained by manual sampling. Also, the measurement method is invasive, infrequent andinconsistent which further calls for a new measurement method to allow a more efficientprocess control of pellet manufacturing.
7

7/31/2019 Analysis of 3D Surface Data for on-line Determination of the Size Distribution of Iron Ore Pellet Piles on Conveyor …
http://slidepdf.com/reader/full/analysis-of-3d-surface-data-for-on-line-determination-of-the-size-distribution 22/130
8 Size measurement techniques
3.3 Image analysis
Automatic on-line analysis of pellet size based on image analysis techniques would allownon-invasive, frequent and consistent measurement. The results could be used for efficientcontrol of the pelletizing process and also control of the blast furnace.
3.3.1 2D imaging systems2D imaging systems for size measurements [8, 9, 10, 11] use photographs to capture thesurface of a pile. However, 2D imaging systems have numerous sources of errors, someof which are listed here:
•Lighting of the scene is crucial for any 2D photography. In pellet plants, theenvironment is full of magnetite dust and the ambient light is often weak but maysuddenly change. The lighting has to be controlled by a lighting rig to ensurethat the scene is always subjected to the same lighting condition. Color, shadowand reection variation are dependent on the lighting which affects segmentation.Segmentation errors are a signicant problem in 2D vision systems.
• Preventive maintenance is necessary to ensure that lighting rigs are fully opera-tional. If lamps do not work properly, the captured photographs will have unex-pected color, shadow and reection variation that result in uncertain image analysisand size measurements.
• Scaling and perspective information cannot be directly extracted from a 2D image.A seemingly large object in a 2D image may be a small object close to the camera.And a seemingly small object in a 2D image may be a large object far from thecamera. This makes determination of size distribution of iron ore green pellet piles,based on 2D images, subject to scaling errors and perspective distortion.
Finally, criticism of 2D imaging systems have been raised as they do not provide ageneral solution and Cunningham [12, pg. 16] concludes that ”optical (2D) methods forfragmentation are intrinsically and seriously inaccurate for certain applications”. LKABhas tested commercial fragmentation measurement systems for measurement of the ironore green pellets with unsatisfactory results.
3.3.2 3D imaging systems3D imaging systems for size measurements [13, 14, 15, 16] can use different measurementmethods to capture the surface of a pile. In the 3D measurement project, a 3D measure-ment system implemented by MBV-Systems was used. The imagining system captures3D surface data based on a projected laser line and camera triangulation. It has a highspeed digital camera capable of 4000 frames per second and a continuous wave diodelaser with line generating optics. The high speed digital camera ensures a high density of

7/31/2019 Analysis of 3D Surface Data for on-line Determination of the Size Distribution of Iron Ore Pellet Piles on Conveyor …
http://slidepdf.com/reader/full/analysis-of-3d-surface-data-for-on-line-determination-of-the-size-distribution 23/130
3.3. Image analysis 9
3D points at approximately a spacing of 0.5 mm in the plane of the conveyor belt, whichmoves at 2 m/s.
The measurement method is robust and accurate as is not subjected to the samesources of error as the 2D imaging systems. Changes in ambient lighting do not affectthe captured data signicantly. The imagining system comprises a projected laser linewhich is observed by the camera. To reduce light of other wavelengths that may causeinaccurate registration, the camera is equipped with a lter that matches the wavelengthof the laser. As the system provides its own light source which is effectively independent of the ambient illumination, unexpected shadows is not a source of error. Also, as every 3Dpoint is registered in real coordinates, scaling and perspective errors are also overcome.This make segmentation of the surface and analysis of particle’s size and shape morerobust.
And most importantly, the setup is reliable and accurate in the harsh environmentof a pellet plant. Limited preventive maintenance is required and at the time of writing,the 3D imaging system has been operational in LKAB’s pellet plant in Malmberget for14 months without any need for maintenance.

7/31/2019 Analysis of 3D Surface Data for on-line Determination of the Size Distribution of Iron Ore Pellet Piles on Conveyor …
http://slidepdf.com/reader/full/analysis-of-3d-surface-data-for-on-line-determination-of-the-size-distribution 24/130
10 Size measurement techniques

7/31/2019 Analysis of 3D Surface Data for on-line Determination of the Size Distribution of Iron Ore Pellet Piles on Conveyor …
http://slidepdf.com/reader/full/analysis-of-3d-surface-data-for-on-line-determination-of-the-size-distribution 25/130
Chapter 4
Summary of contribution
4.1 Summary of contributionThis section gives a short summary of the papers included in Part II of this thesis.Furthermore, the contributions of the various authors are presented. Olov Marklund wasthe main supervisor and provided valuable discussions and suggestions throughout therst two papers. Co-supervisor Matthew J. Thurley has with his expert knowledge inthe research area provided many interesting discussions and suggestions throughout allpapers in this thesis.
In paper A, an evaluation of a previously used measurement method for sizing pelletsis performed. Paper B and C address subproblem 1 and 2 listed in the introduction of this thesis. Paper D present the result of sieve size estimation of green iron ore pelletsusing the prototype during pellet production.
4.1.1 Paper A - Pellet Size Estimation Using Spherical FittingAuthors: Tobias Andersson, Matthew J. Thurley and Olov MarklundReproduced from: Proceedings of the IEEE Instrumentation and Measurement Technol-ogy Conference, pp 1-5, (Warsaw, Poland), 2007
Summary Evaluation of Spherical Fitting as a technique for sizing iron ore pellets is performed. Sizemeasurement of pellets in industry is usually performed by manual sampling and sievingtechniques. Automatic on-line analysis of pellet size would allow non-invasive, frequentand consistent measurement. Previous work has used an assumption that pellets arespherical to estimate pellet sizes. In this research we use a 3D laser camera system in alaboratory environment to capture 3D surface data of pellets and steel balls. Validation of the 3D data against a spherical model has been performed and demonstrates that pelletsare not spherical and have physical structures that a spherical model cannot capture.
11

7/31/2019 Analysis of 3D Surface Data for on-line Determination of the Size Distribution of Iron Ore Pellet Piles on Conveyor …
http://slidepdf.com/reader/full/analysis-of-3d-surface-data-for-on-line-determination-of-the-size-distribution 26/130
12 Summary of contribution
Personal contribution The general idea together with the co-authors. Theoretical work and implementations
together with Matthew J. Thurley.
4.1.2 Paper B - Visibility Classication of Pellets in Piles forSizing Without Overlapped Particle Error
Authors: Tobias Andersson, Matthew J. Thurley and Olov MarklundTo appear in: Proceedings of the Digital Image Computing: Techniques and ApplicationsConference, (Adelaide, Austraila), 2007
Summary Size measurement of pellets in industry is usually performed by manual sampling andsieving techniques. Automatic on-line analysis of pellet size based on image analysistechniques would allow non-invasive, frequent and consistent measurement. We makea distinction between entirely visible and partially visible pellets. This is a signicantdistinction as the size of partially visible pellets cannot be correctly estimated withexisting size measures and would bias any size estimate. Literature review indicates thatother image analysis techniques fail to make this distinction. Statistical classicationmethods are used to discriminate pellets on the surface of a pile between entirely visibleand partially visible pellets. Size estimates of the surface of a pellet pile show thatoverlapped particle error can be overcome by estimating the surface size distributionusing only the entirely visible pellets.
Personal contribution The general idea together with the co-authors. Implementation and theoretical worktogether with Matthew J. Thurley.
4.1.3 Paper C - Sieve Size Estimation of Iron Ore Green Pelletswith Multiple Features Selected Using Ordinal LogisticRegression
Authors: Tobias Andersson and Matthew J. Thurley
Submitted to: Powder Technology JournalSummary Size measurement of pellets in industry is usually performed by manual sampling andsieving techniques. Automatic on-line analysis of pellet size based on image analysistechniques would allow non-invasive, frequent and consistent measurement. We evaluatecommonly used size and shape measurement methods and combine these to achieve betterestimation of pellet size. Literature review indicates that other image analysis techniquesfail to perform this analysis and use a simple selection of sizing method without evaluatingtheir statistical signicance. Backward elimination and forward selection of features isused to select two feature sets that are statistically signicant for discriminating between

7/31/2019 Analysis of 3D Surface Data for on-line Determination of the Size Distribution of Iron Ore Pellet Piles on Conveyor …
http://slidepdf.com/reader/full/analysis-of-3d-surface-data-for-on-line-determination-of-the-size-distribution 27/130
4.1. Summary of contribution 13
different sieve size classes of pellets. The diameter of a circle of equivalent area is shown tobe the most effective feature based on the forward selection strategy, but an unexpected
5 feature classier is the result using the backward elimination strategy. Size estimatesof the surface of a pellet pile using the two feature sets show that the estimated sievesize distribution follows the known sieve size distribution.
Personal contribution The general idea and implementation together with Matthew J. Thurley. Theoreticalwork by the Tobias Andersson.
4.1.4 Paper D - An industrial 3D vision system for size mea-surement of iron ore green pellets using morphologicalimage segmentation
Authors: Matthew J. Thurley and Tobias AnderssonAccepted to: Minerals Engineering Journal, October 2007
Summary
An industrial prototype 3D imaging and analysis system has been developed that mea-sures the pellet sieve size distribution into 9 sieve size classes between 5 mm and 16+ mm.The system is installed and operational at a pellet production plant capturing andanalysing 3D surface data of piled pellets on the conveyor belt. It provides fast, frequent,non-contact, consistent measurement of the pellet sieve size distribution and opens thedoor to autonomous closed loop control of the pellet balling disk or drum in the future.Segmentation methods based on mathematical morphology are applied to the 3D surfacedata to identify individual pellets. Determination of the entirely visible pellets is madeusing a new two feature classication, the advantage being that this system eliminatesthe resulting bias due to sizing partially visible (overlapped) particles based on theirlimited visible prole. Literature review highlights that in the area of size measurementof pellets and rocks, no other researchers make this distinction between entirely and par-tially visible particles. Sizing is performed based on best-t-rectangle, classied into sizeclasses based on one quarter of the measured sieving samples, and then compared againstthe remaining sieve samples.
Personal contribution General idea, theoretical work and implementation by Matthew J. Thurley. Tobias An-dersson contributed mainly to the theoretical work of visibility classication, with com-ments to the general idea, and with demonstration of the suitability of morphologicallaplacian as a complimentary edge detection strategy.
7/31/2019 Analysis of 3D Surface Data for on-line Determination of the Size Distribution of Iron Ore Pellet Piles on Conveyor …
http://slidepdf.com/reader/full/analysis-of-3d-surface-data-for-on-line-determination-of-the-size-distribution 28/130
14 Summary of contribution
4.2 ConclusionsPreviously presented techniques for sizing iron ore pellets have assumed that pellets arespherical. The evaluation of spherical tting as a technique for sizing iron ore pelletsin paper A shows that pellets have physical structures that a spherical model cannotcapture. This shows that other measurement methods for accurate size estimation areneeded.
The problem of overlapped particle error (Ch 1, pg 3) is answered in paper B. Itis shown that statistical classication methods can be used to automatically identifypartially visible pellets and exclude these from any surface size distribution estimate.Thurley [17] has shown that overlapped particle error can be overcome by visibility clas-sication when estimating size of rock fragments. Statistical classication methods andfeature selection procedures applied to commonly used shape measurements for visibilityclassication of iron ore pellets have not been used before. This is a signicant con-tribution to the research area as efficient and correct visibility classication is requiredfor accurate size estimation of pellets in piles. The presented classication method andfeature selection procedure are also useful for analysis of rocks in piles.
The problem of prole error (Ch 1, pg 3) is answered in paper C. Evaluation of com-monly used size and shape measurement methods is performed based on their statisticalsignicance. Backward elimination and forward selection of features is used to select twofeature set that are efficient for discriminating between pellet’s size. This evaluation isa new contribution in the eld of size estimation of iron ore pellets. The methods toevaluate size and shape measurement methods for efficient size estimation will also be
useful for analysis of rock fragments and other material.The main goal of the 3D measurement project was to implement an industrial proto-
type to be installed in a pellet plant and the implementation of the prototype is presentedin paper D. The imaging and analysis system is capable of measuring the iron ore greenpellet sieve size distribution into 9 sieve size classes between 5 mm and 16+ mm. Accuratesizing of iron ore green pellets is achieved and the system is now in a commercializationphase by MBV-Systems 1.
4.3 Future ResearchThe methods used for accurate sizing of green iron ore pellets will form the foundation tonew research in application areas as size determination of rock fragments. A list of topicsthat needs consideration when measuring rock fragments instead of pellets is presentedhere:
1. Use feature selection procedures to select a set of features that can be used todiscriminate between entirely visible and partially visible rocks. The methods usedin paper B and C can be applied to data of rock fragments in piles. However, new
1Any commercial enquiries can be directed to John Erik Larsson at MBV-Systems. E-mail:John.Erik. [email protected]

7/31/2019 Analysis of 3D Surface Data for on-line Determination of the Size Distribution of Iron Ore Pellet Piles on Conveyor …
http://slidepdf.com/reader/full/analysis-of-3d-surface-data-for-on-line-determination-of-the-size-distribution 29/130
4.3. Future Research 15
shape, size and visibility features may be required to be implemented due to theirregularities in rock fragment’s shape.
2. Improve classication algorithms to estimate size for entirely visible rock fragmentsin piles. The methods presented in paper C can be applied to data of rock frag-ments in piles. It will be interesting to compare the results of the feature selectionprocedures with the results presented in paper C. A completely new set of featureswill probably be selected to accurately determine rock size. Also, implementationof new features to measure size may be useful for improved size estimation.
3. For rock fragments in piles, errors due to surface bias and segregation are signicant.Methods to overcome these errors have to be investigated.
4. Investigate wether the 3D imaging system needs an additional camera for measure-ment of rock fragments in piles. Due to the irregularities in rock fragment’s shape,more data may be required for an accurate analysis.
5. The 3D measurement system may also be used to analyze piles with mixed material.An example of piles with mixed material is when pellets, coke, lime and aggregatematerial are fed into a blast furnace via a conveyor belt. Estimates of the sizedistribution of all material going into the blast furnace would give more control of the blast furnace process. Size estimation of mixed material may be achieved withstatistical classication methods. New shape, size and visibility features will prob-ably be required. Sensor fusion with an additional color camera may be necessary
to solve this problem.

7/31/2019 Analysis of 3D Surface Data for on-line Determination of the Size Distribution of Iron Ore Pellet Piles on Conveyor …
http://slidepdf.com/reader/full/analysis-of-3d-surface-data-for-on-line-determination-of-the-size-distribution 30/130
16 Summary of contribution
7/31/2019 Analysis of 3D Surface Data for on-line Determination of the Size Distribution of Iron Ore Pellet Piles on Conveyor …
http://slidepdf.com/reader/full/analysis-of-3d-surface-data-for-on-line-determination-of-the-size-distribution 31/130
Appendix A
An introduction to multivariatediscriminant analysis
1 Introduction
The intention of this appendix is to introduce basic notation and denition that is neededto understand and apply multivariate methods to analyze data. A description of dis-criminant analysis and logistic regression is given and methods for feature selection and
evaluation of classier performance are also described. Most of this appendix is directlyborrowed from Johnson’s book Applied Multivariate Methods for Data Analysts [18].
2 Denitions and notations
2.1 Experimental unit
An experimental unit is any object or item that can be measured or evaluated in someway. Examples of experimental units include people, particles and companies. In differentelds of research different objects may be of interest. Whenever a researcher is analyzingmore than one attribute or characteristic of each experimental unit, the researcher analyzea multivariate data.
It is important to note that one condition that must be satised by almost all mul-tivariate methods is that the attributes measured on a given experimental unit must beindependent of similar variables on any other experimental unit. To exemplify this, con-sider a data that describe yearly population growth in a country over 50 years. This dataclearly has dependence between experimental units and in this case many multivariatemethods cannot be appropriately applied.
17

7/31/2019 Analysis of 3D Surface Data for on-line Determination of the Size Distribution of Iron Ore Pellet Piles on Conveyor …
http://slidepdf.com/reader/full/analysis-of-3d-surface-data-for-on-line-determination-of-the-size-distribution 32/130
18 Appendix A
2.2 VariablesAn experimental unit may be measured or evaluated in different ways to describe somespecic attribute or characteristic. These attributes or characteristics are usually calledvariables or features .
Stevens [19] presented a typology for data scales, which is widely adopted wherevariables is said to be of four different types:
• Nominal variables are nonnumeric and discrete. They cannot be ordered or quan-tied. Typical nonnumeric discrete variables that cannot be ordered are gender,species, brands et cetera.
• Ordinal variables are numerical and discrete. These variables can, in contrast tonominal variables, be quantied and ordered. Examples of ordinal variables arenumber of children in a family, number of students in a program et cetera.
• Interval variables are numerical, continuous and discrete but with the signicantdifference that difference is possible to interpret. Interval variables are for examplemeasurements like temperatures.
• Ratio variables are numerical and continuous where the ratio is possible to inter-pret. An example is length measurements.
However, criticism to this typology have been raised and Velleman and Wilkinson[20] review the taxonomy. I briey note that that Velleman and Wilkinson argue thatsome general-purpose microcomputer statistical packages have based their interface onStevens’s taxonomy to allow automatic selection of ”appropriate” analyzes for a givendata. Although the taxonomy may be useful, they may be misleading. Johnson dividesvariable types into continuous variables and discrete variables as follows;
• Continuous variables are numeric and could feasibly occur anywhere within someinterval; the only thing that limits a continuous variable’s value is the ability tomeasure the variable accurately.
• Discrete variables may be numeric and nonnumeric. Nonnumeric discrete variablescan not be quantied or ordered. Typical nonnumeric discrete variables are gender,species, brands et cetera. Numeric discrete variables can be ordered. Typicalnumeric discrete variables are number of children in a family, number of studentsin a program et cetera.
2.3 Data Matrices and Vectors2.3.1 Variable notation
The number of numeric response variables being measured is denoted, p. N is always thenumber of experimental units on which variables are being measured. The j th responsevariable on the r th experimental unit is denoted x rj for r = 1 , 2,...,N and j = 1 , 2,...,p .

7/31/2019 Analysis of 3D Surface Data for on-line Determination of the Size Distribution of Iron Ore Pellet Piles on Conveyor …
http://slidepdf.com/reader/full/analysis-of-3d-surface-data-for-on-line-determination-of-the-size-distribution 33/130
2. Definitions and notations 19
2.3.2 Data Matrix
Each experimental unit’s measured response variables can be arranged in a matrix, calledthe data matrix and is denoted X . The data matrix is arranged so that xrj is the elementin the r th row and the j th column of the matrix. Thus, the data matrix notation is seenin equation A.1.
X = ⎡⎢⎢⎢⎣
x11 x12 ... x1 p
x21 x22 ... x2 p...
... . . . ...xN 1 xN 2 ... xNp
⎤⎥⎥⎥⎦
(A.1)
2.3.3 Data Vectors
The rows in a data matrix are called row vectors. The data that occurs in the r th rowof X is denoted by x r , seen in equation A.2.
x r = xr 1 xr 2 ... x rp (A.2)
When the data in the r th row of X are written in a column vector it is denoted byx r , seen in equation A.3.
x r =
⎡⎢⎢⎢⎣
xr 1
xr 2
...xrp ⎤⎥⎥⎥⎦
(A.3)
2.4 The Multivariate Normal DistributionMost traditional multivariate methods depend on the assumption that data vectors beingrandom samples from multivariate normal distributions. It has to be mentioned that mostmultivariate techniques are robust and work well when data vectors are not multivari-ate normally distributed, provided that data vectors still have independent probabilitydistributions
There are several ways to dene a multivariate normal distribution and I present thedenition given by Johnson. The denition used by Johnson do not require the readerto be a mathematical statistician to understand the denition. It does however requireknowledge about the univariate normal distribution. It is said that a vector of randomvariables,
x = ⎡⎢⎢
⎢⎣
x1
x2...
x p
⎤⎥⎥
⎥⎦

7/31/2019 Analysis of 3D Surface Data for on-line Determination of the Size Distribution of Iron Ore Pellet Piles on Conveyor …
http://slidepdf.com/reader/full/analysis-of-3d-surface-data-for-on-line-determination-of-the-size-distribution 34/130
20 Appendix A
have a multivariate normal distribution if
a x = a1 a2 ... a p ⎡⎢⎢⎢⎣
x1x2...
x p
⎤⎥⎥⎥⎦= a1x1 + a2x2 + ... + a px p
= p
i=1
a i xi
has a univariate normal distribution for every possible set of selected values for the
elements in the vector a .
2.4.1 Summarizing Multivariate Distributions
A univariate distribution is often summarized by its rst two moments, namely, its meanand its variance (or standard deviation). The mean of a random variable x is usuallydenoted by μ and is dened by μ = E( x), where E(·) denotes expected value. The varianceof a random variable x is usually denoted by σ2 and is dened by σ2 = E[( x −μ)2]. Thus,the variance of x is, conceptually, the average value of ( x −μ)2 in the population beingsampled. The square root of the variance of x is called the standard deviation of x an isusually denoted σ.
To summarize multivariate distributions, we need the mean and variance of each of the p variables in x . Additionally, we need either the correlations between all pairsof variables in x or the covariances between all pairs of variables. If we are given thevariances and covariances, then the correlations can be determined. Likewise, if we havevariances and correlations, then one can determine the covariances.
The mean of a vector of random variables x is denoted by μ and the covariance matrixof x is denoted by Σ . These are dened by equations A.4 are A.5. Interesting to noteis that the i th diagonal element in the covariance matrix correspond to the variance of variable xi . The other elements in the covariance matrix correspond to the covariancebetween specic variables. This is shown in equation A.6 and A.7.
μ = ⎡⎢⎢⎢⎣
E(x1)E(x2)
...E(x p)
⎤⎥⎥⎥⎦
= ⎡⎢⎢⎢⎣
μ1
μ2...
μ p
⎤⎥⎥⎥⎦
(A.4)
Σ = Cov( x) = E[( x −μ )(x −μ ) ] =⎡⎢⎢
⎢⎣
σ11 σ12 ... σ1 p
σ21 σ22 ... σ2 p...
... . . . ...σ p1 σ p2 ... σ pp
⎤⎥⎥
⎥⎦
(A.5)
7/31/2019 Analysis of 3D Surface Data for on-line Determination of the Size Distribution of Iron Ore Pellet Piles on Conveyor …
http://slidepdf.com/reader/full/analysis-of-3d-surface-data-for-on-line-determination-of-the-size-distribution 35/130
2. Definitions and notations 21
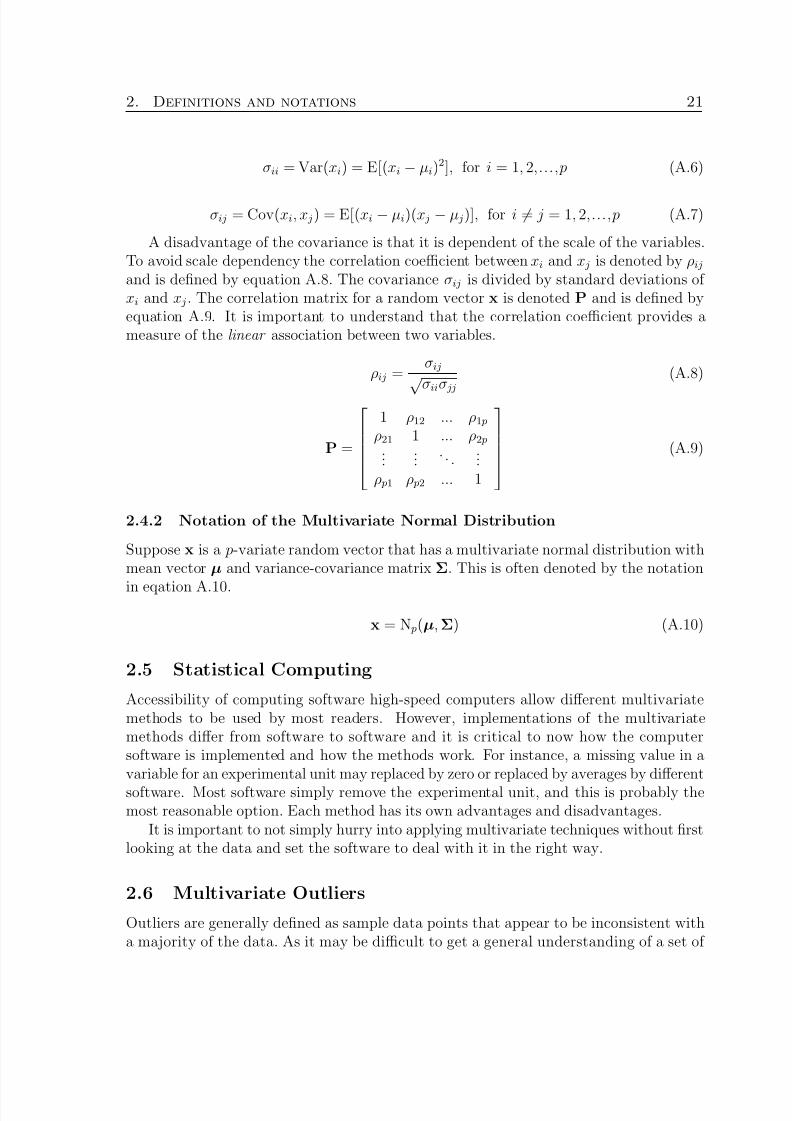
σii = Var( xi ) = E[( x i −μi )2], for i = 1 , 2,...,p (A.6)
σij = Cov( xi , x j ) = E[( xi −μi )(x j −μ j )], for i = j = 1 , 2,...,p (A.7)
A disadvantage of the covariance is that it is dependent of the scale of the variables.To avoid scale dependency the correlation coefficient between xi and x j is denoted by ρij
and is dened by equation A.8. The covariance σij is divided by standard deviations of x i and x j . The correlation matrix for a random vector x is denoted P and is dened byequation A.9. It is important to understand that the correlation coefficient provides ameasure of the linear association between two variables.
ρij
=σij
√ σii σ jj(A.8)
P = ⎡⎢⎢⎢⎣
1 ρ12 ... ρ1 p
ρ21 1 ... ρ2 p...
... . . . ...ρ p1 ρ p2 ... 1
⎤⎥⎥⎥⎦
(A.9)
2.4.2 Notation of the Multivariate Normal Distribution
Suppose x is a p-variate random vector that has a multivariate normal distribution with
mean vector μ and variance-covariance matrix Σ . This is often denoted by the notationin eqation A.10.
x = N p(μ , Σ ) (A.10)
2.5 Statistical ComputingAccessibility of computing software high-speed computers allow different multivariatemethods to be used by most readers. However, implementations of the multivariatemethods differ from software to software and it is critical to now how the computersoftware is implemented and how the methods work. For instance, a missing value in avariable for an experimental unit may replaced by zero or replaced by averages by differentsoftware. Most software simply remove the experimental unit, and this is probably themost reasonable option. Each method has its own advantages and disadvantages.
It is important to not simply hurry into applying multivariate techniques without rstlooking at the data and set the software to deal with it in the right way.
2.6 Multivariate OutliersOutliers are generally dened as sample data points that appear to be inconsistent witha majority of the data. As it may be difficult to get a general understanding of a set of

7/31/2019 Analysis of 3D Surface Data for on-line Determination of the Size Distribution of Iron Ore Pellet Piles on Conveyor …
http://slidepdf.com/reader/full/analysis-of-3d-surface-data-for-on-line-determination-of-the-size-distribution 36/130
22 Appendix A
data by observing specic values, graphical procedures are often used to locate possibleoutliers.
When a possible outlier is located, knowing how to deal with them is a difficultproblem. The rst step to take, if possible, is to determine if the outlier is a recordingerror or data entry error in the collection of data. If it is, the data entry may be correctedor removed. If no recording error or data entry has occurred, the researcher has to usetheir own expert opinion about the populations being sampled to make a subjectivedecision.
There is no accepted general solution when dealing with outliers. It must be remem-bered that outliers may inuence the result of a multivariate analysis and care has tobe taken when dealing with outliers. It may also be useful to compare the result of ananalysis with the outliers in the data with an analysis where the outliers are removedfrom the data.
2.7 Multivariate Summary StatisticsIn earlier description of multivariate distributions, the theoretical mean vector, μ , covari-ance matrix, Σ , and correlation matrix , R , has been used. To actually estimate these,equation A.11, A.12 and A.13 are used.
μ =1N
N
r =1
x r =x1 + x2 + · · ·+ xN
N (A.11)
Σ =1
N −1
N
r =1
(x r −μ )(x r −μ ) (A.12)
R = ⎡⎢⎢⎢⎣
1 r 12 ... r 1 p
r 21 1 ... r 2 p...
... . . . ...r p1 r p2 ... 1
⎤⎥⎥⎥⎦
(A.13)
where
r ij = σij
σii σ jj
2.8 Standardized Data and/or Z ScoresSometimes data are easier to understand and compare when the response variables arestandardized so that they are measured in comparable units. This is usually done byeliminating the units of measurement altogether. Standardization of data is done byequation A.14. The variable Z rj is called the Z score for the j th response variable on ther th experimental unit and the matrix of Z scores is shown below.

7/31/2019 Analysis of 3D Surface Data for on-line Determination of the Size Distribution of Iron Ore Pellet Piles on Conveyor …
http://slidepdf.com/reader/full/analysis-of-3d-surface-data-for-on-line-determination-of-the-size-distribution 37/130
3. Graphical methods 23
Z =
⎡⎢⎢⎢⎣
Z 11 Z 12 ... Z 1 p
Z 21 Z 22 ... Z 2 p...... . . . ...
Z N 1 Z N 2 ... Z Np ⎤⎥⎥⎥⎦z rj =
xrj −μ j
σ jj, for r = 1 , 2, ..., N, j = 1 , 2,...,p (A.14)
Standardization of data is recommended when the measured variables are in com-pletely different units. For example, suppose a researcher has measurements on heightand weight of individuals. These measurements, by necessity, are in completely differentunits. It is often much easier to compare individuals with respect to these two variables
if each variable is standardized.
3 Graphical methodsBefore any multivariate method is considered it is useful to analyze the data with graph-ical methods to get some knowledge about the data. Graphical methods are often muchmore informative than a printout of the data. Interpretation of visual display of mul-tivariate data may reveal abnormalities in the data. Another use of graphical analysisis that possible relationships between variables can be identied. Also, with graphicalanalysis, made assumptions about the data can be controlled.
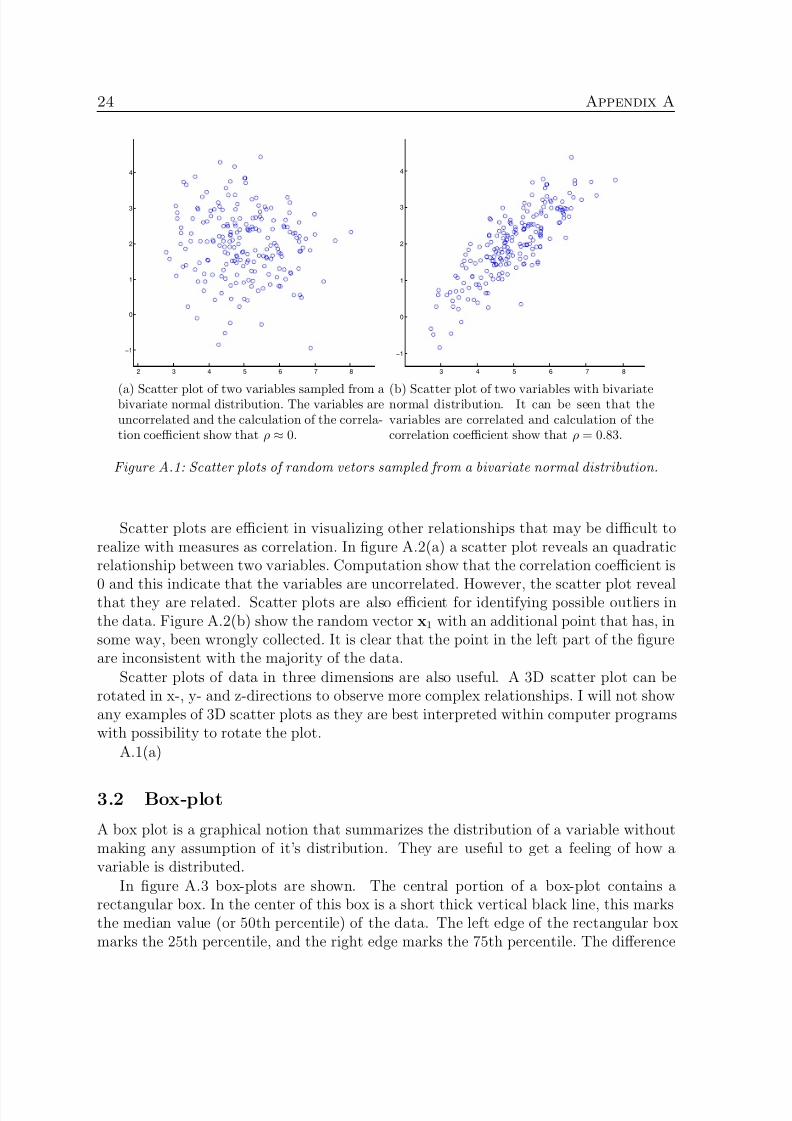
3.1 Scatter plotScatter plots are useful as relationships between variables easily can be observed. Also,outliers in data may clearly be identied in these plots. Suppose x and y are bivariaterandom vectors that has bivariate normal distributions. Their mean vector and variance-covariance matrix is shown below.
x∼N p(μ x , Σ x ), where μ x = 52 and Σ x = 1 0
0 1
y∼N p(μ y , Σ y ), where μ y = 52 and Σ y = 1 0.85
0.85 1
x is chosen to be uncorrelated between the two row vectors x1 and x2. y has corre-lation between the two row vectors and this can easily be seen in gure A.1 that showscatter plots of the two random samples. In gure A.1(a) the random sample x is shownand it can be noted that the scatter of points form a round cloud. This is typical for abivariate normal distribution where the row vectors have the same variance and wherethe correlation is close to zero. For the random variable y , the cloud is tilted and thiscan be seen in gure A.1(b). This is typical for correlated variables.
7/31/2019 Analysis of 3D Surface Data for on-line Determination of the Size Distribution of Iron Ore Pellet Piles on Conveyor …
http://slidepdf.com/reader/full/analysis-of-3d-surface-data-for-on-line-determination-of-the-size-distribution 38/130
24 Appendix A
2 3 4 5 6 7 8
−1
0
1
2
3
4
(a) Scatter plot of two variables sampled from abivariate normal distribution. The variables areuncorrelated and the calculation of the correla-tion coefficient show that ρ ≈0.
3 4 5 6 7 8
−1
0
1
2
3
4
(b) Scatter plot of two variables with bivariatenormal distribution. It can be seen that thevariables are correlated and calculation of thecorrelation coefficient show that ρ = 0 .83.
Figure A.1: Scatter plots of random vetors sampled from a bivariate normal distribution.
Scatter plots are efficient in visualizing other relationships that may be difficult torealize with measures as correlation. In gure A.2(a) a scatter plot reveals an quadratic
relationship between two variables. Computation show that the correlation coefficient is0 and this indicate that the variables are uncorrelated. However, the scatter plot revealthat they are related. Scatter plots are also efficient for identifying possible outliers inthe data. Figure A.2(b) show the random vector x1 with an additional point that has, insome way, been wrongly collected. It is clear that the point in the left part of the gureare inconsistent with the majority of the data.
Scatter plots of data in three dimensions are also useful. A 3D scatter plot can berotated in x-, y- and z-directions to observe more complex relationships. I will not showany examples of 3D scatter plots as they are best interpreted within computer programswith possibility to rotate the plot.
A.1(a)
3.2 Box-plotA box plot is a graphical notion that summarizes the distribution of a variable withoutmaking any assumption of it’s distribution. They are useful to get a feeling of how avariable is distributed.
In gure A.3 box-plots are shown. The central portion of a box-plot contains arectangular box. In the center of this box is a short thick vertical black line, this marksthe median value (or 50th percentile) of the data. The left edge of the rectangular boxmarks the 25th percentile, and the right edge marks the 75th percentile. The difference

7/31/2019 Analysis of 3D Surface Data for on-line Determination of the Size Distribution of Iron Ore Pellet Piles on Conveyor …
http://slidepdf.com/reader/full/analysis-of-3d-surface-data-for-on-line-determination-of-the-size-distribution 39/130
3. Graphical methods 25
−50 −40 −30 −20 −10 0 10 20 30 40 500
500
1000
1500
2000
2500
(a) Scatter plot that reveal that two variables arerelated. Calculation of the correlation coefficientshow that ρ = 0. The scatter plot clearly showrelationships that measurements do not.
−2 0 2 4 6 8−3
−2
−1
0
1
2
3
4
5
6
(b) Scatter plot of the same random vector as inA.1(a) but here an additional sample has beenwrongly sampled. The point in the left part of the gure is inconsistent with the majority of thedata and is a possible outlier.
Figure A.2: Scatter plots that reveal relationships that is not easily found with measurements and, also, a plot that show how to identify outliers in the data.
between the 75th and 25th percentile is the interquartile range (IQR). The IQR is arobust estimate of the spread of the data. The circular dots to the left and right of each box-plot indicate values that are statistically determined to be outliers. Values aredened to be outliers when they are less than the 25th percentile - 1.5IQR or greater thanthe 75th percentile + 1.5IQR. These values correspond to pellets that are particularlynon-spherical. The dashed lines extending to the left and right of the rectangular boxextend to the statistically valid min and max. The graphs and determination of outlierswere calculated using Matlab.
The box-plot in gure A.3(a) show the ve number summary of the random vectorx1. Again, an additional point has been collected falsely. The falsely collected point isdetermined to be an outlier and the point can be found in the left part of the image.There are two more possible outliers in the data. The median value is close to the centerof the box and the statistically valid min and max stretches almost the same length fromthe box. This is typical for normal distributions. In gure A.3(b) the distribution of the y-values of the quadratic function is shown. Here, it is clear that the distribution isskewed towards lower values.
3.3 Normal Probability plot
As most statistical methods is developed with the assumption that data is normallydistributed a graphical method to analyze data with respect to this assumption is useful.Most statistical packages can generate normal probability plots.

7/31/2019 Analysis of 3D Surface Data for on-line Determination of the Size Distribution of Iron Ore Pellet Piles on Conveyor …
http://slidepdf.com/reader/full/analysis-of-3d-surface-data-for-on-line-determination-of-the-size-distribution 40/130
26 Appendix A
−2 0 2 4 6 8
Variable
Values
(a) Box-plot of the same random vector asin A.2(b). The distribution is evenly spread
around the median value, which is typical for anormal distribution. The falsely collected valueat -3.2 is clearly inconsistent with the majorityof the data.
0 500 1000 1500 2000 2500
Variable
Values
(b) Box-plot of the y-values of A.2(a). Thisplot indicate that the distribution is skewed.
Figure A.3: Box-plots that show the ve number summary of a distribution.
Two normal probability plots generated by the Statistics Toolbox in Matlab is shownin gure A.4. The plot display the sample data with the symbol ’+’. Superimposed onthe plot is a line joining the rst and the third quartiles. The line is extrapolated outto the ends of the sample values to help evaluate the linearity of the data. If the datacome from a normal distribution, the plot will appear linear. Other distributions willintroduce curvature in the plot.
The normal probability plot for the random vector x1 is shown in A.4(a), where itis clear the the data points follow the linear line in the normal plot. This indicate thatthe values are normally distributed. In gure A.4(b) the normal probability plot of they-values of the quadratic function is shown. Curvature in this plot indicate that thevalues are from some other distribution.
3.4 HistogramA histogram shows the distribution of data values. The histogram bins each value into acontainer. Every container range from two values and the number of values in a variablethat falls into a container is showed by a histogram. The number of bins can be set to avalue to produce a plot that is useful for the desired task.
Examples of histograms for the random vector x1 and the y-values of the quadraticfunction is shown in gure A.5, which where generated by Matlab. The two histogramexemplify how the distribution of values can be examined. The random vector x1 thatis sampled from the normal distribution follow the typical bell shape. The histogram of the y-values of the quadratic function is skewed.

7/31/2019 Analysis of 3D Surface Data for on-line Determination of the Size Distribution of Iron Ore Pellet Piles on Conveyor …
http://slidepdf.com/reader/full/analysis-of-3d-surface-data-for-on-line-determination-of-the-size-distribution 41/130
3. Graphical methods 27
2 3 4 5 6 7 8
0.003
0.01
0.02
0.05
0.10
0.25
0.50
0.75
0.90
0.95
0.98
0.99
0.997
Data
P r o b a b i l i t y
Normal Probability Plot
(a) Normal probability plot of the random vector x 1 . As the pointsfollow the linear line in this plot, the points possibly are normally dis-tributed.
0 500 1000 1500 2000 25000.003
0.01
0.02
0.05
0.10
0.25
0.50
0.75
0.90
0.95
0.98
0.99
0.997
Data
P r o b a b i l i t y
Normal Probability Plot
(b) Normal probability plot of the y-values of the quadratic function.Curvature in the plot indicate that the data is not normally distributed.
Figure A.4: Normal probability plots.

7/31/2019 Analysis of 3D Surface Data for on-line Determination of the Size Distribution of Iron Ore Pellet Piles on Conveyor …
http://slidepdf.com/reader/full/analysis-of-3d-surface-data-for-on-line-determination-of-the-size-distribution 42/130
28 Appendix A
1 2 3 4 5 6 7 8 90
5
10
15
20
25
30
35
40
45
50
(a) Histogram of the random vector x 1 . The his-togram show that the sample values follow the bellshape that is typical for the normal distribution.
125 375 625 875 1125 1375 1625 1875 2125 23750
5
10
15
20
25
30
35
(b) The histogram of the y-values of the quadraticfunction show that the values are skewed.
Figure A.5: Histograms.
4 Discriminant analysis
4.1 Discrimination for Two Multivariate Normal PopulationsSuppose there are two multivariate normal populations, say, Π 1 that is N p(μ
1, Σ 1) and Π2
that is N p(μ 2, Σ 2). Suppose a new observation vector x is known to come from either Π1
or Π2. A rule is needed that can be used to predict from which of the two populations x ismost likely to have come. Four different ways of looking at this problem are considered.For many cases, these four ways of developing a discrimination rule are equivalent.
4.1.1 A Likelihood Rule
For mathematical statisticians, a reasonable rule might be:
Choose Π1, if L(x , μ 1, Σ 1) > L (x , μ 2, Σ 2) and choose Π2 otherwise, whereL(x , μ i , Σ i ) is the likelihood function for the i th population evaluated at x ,i = 1 , 2.
Note that the likelihood function for x is simply the multivariate normal probabilitydensity function.
4.1.2 The Linear Discriminant Function Rule
When two multivariate normal populations have equal variance-covariance matrices (i.e.,when Σ 1 = Σ 2), the likelihood rule simplies to:

7/31/2019 Analysis of 3D Surface Data for on-line Determination of the Size Distribution of Iron Ore Pellet Piles on Conveyor …
http://slidepdf.com/reader/full/analysis-of-3d-surface-data-for-on-line-determination-of-the-size-distribution 43/130
4. Discriminant analysis 29
Choose Π1 if b x −k > 0 and choose Π2 otherwise, where b = Σ − 1(μ 1 −μ 2)and k = (1 / 2)(μ 1 −μ 2)Σ − 1(μ 1 + μ 2).
The function b x is called the linear discriminant function of x . It is the single linearfunction of the elements in x that summarizes all of the information in x that is availablefor effective discrimination between two multivariate normal populations that have equalvariance-covariance matrices.
4.1.3 A Mahalanobis Distance Rule
When two multivariate normal populations have equal variance-covariance matrices, thelikelihood rule is also equivalent to:
Choose Π1 when d1 < d 2 where d = ( x −μ i ) Σ − 1(x −μ i ) for i = 1 , 2.
The quantity di is, in some sense, a measure of how farx is from μ , and di is called theMahalanobis squared distance between x and μ i , for i = 1 , 2. This distance measure takesthe variances and covariances of the measured variables into account. The Mahalanobissquared distance rule classies an observation into the population to whose mean it is”closest”.
4.1.4 A Posterior Probability RuleWhen the variance-covariance matrices are equal, the quantity P (Π i |x) dened by
P (Π i |x) = e−
12 d i
e−
12 d 1 + e
−12 d 2
is called the posterior probability of population Π i given x , for i = 1 , 2.The posterior probability is not actually a true probability because no random event
is under consideration. The observation either belongs to one population or the other.The uncertainty comes with a researcher’s ability to choose the correct population. Themajor benet of the posterior probability is that it gives an indication of how condentone might feel that he or she is making a correct decision when x is being assigned toone of the two populations. For example, if the posterior probability for Π 1 and Π2 isclose to 0.5, then any classication is made without condence. However, if the posteriorfor Π1 is about 0.95 and that for Π 2 is 0.05, then a decision that x belongs to Π1 can bemade with condence.
As suggested by the previous paragraph, a discriminant rule based on posterior prob-abilities is:
Choose Π1 if P (Π1
|x) > P (Π2
|x) and choose Π2 otherwise.

7/31/2019 Analysis of 3D Surface Data for on-line Determination of the Size Distribution of Iron Ore Pellet Piles on Conveyor …
http://slidepdf.com/reader/full/analysis-of-3d-surface-data-for-on-line-determination-of-the-size-distribution 44/130
30 Appendix A
4.1.5 Sample Discriminant Rules
The preceding descriptions of the four equivalent discriminant rules assume knowledgeof the true values of μ 1, μ 2, Σ 1 and Σ 2. In practice, this will never be the case; instead,it is necessary to produce discriminant rules based on sample estimates of μ 1, μ 2, Σ 1 andΣ 2.
When we have random samples from each of the two populations of interest, unbiasedestimates of μ 1, μ 2, Σ 1 and Σ 2 are given by μ 1, μ 2, Σ 1 and Σ 2. If the two variance-covariance matrices are equal, then a pooled estimate of Σ , the common variance-covariance matrix, is given by
Σ = (N 1 − 1)Σ 1 +( N 2 − 1)Σ 2
N 1 + N 2 − 2
where N 1 and N 2 are the sizes of the random samples taken from Π 1 and Π2, respec-tively.
Discriminant rules based on samples from each population can then be formed exactlylike those based on population values simply by substituting sample estimates for theparameters in the discriminant rules described earlier.
4.2 Cost-Functions and Prior ProbabilitiesThe discriminant rules given in section 4.1 do not take into account the relative risks of making errors of misclassication. When there are only two competing populations, these
rules have the property that the probability of misclassifying an observation is equal forobservations that comes from both populations
In some applications misclassication of a particular population may be disastrous.A typical area where misclassication may be disastrous is in medicine. Here, people’shealth may be affected by a diagnostics that are wrong.
To see how the probabilities of misclassication can be changed and to see the effectsof such changes, let
U = ( μ 1 −μ 2) Σ − 1x −1/ 2(μ 1 −μ 2) Σ − 1(μ 1 + μ 2)
Note that U = b x −k where b and k were dened earlier. We can show that if xcomes from Π1, then U will be distributed N(1 / 2δ, δ ), and if x comes from Π2 then U will be distributed N( −1/ 2δ, δ ) where
δ = ( μ 1 −μ 2) Σ − 1(μ 1 −μ 2)
Note that δ measures the Mahalanobis squared distance between the two populationmeans.
The four discriminant rules descried in Section 4.1 are also equivalent to this rule:
Choose Π1 if U > 0, and choose Π2 otherwise.

7/31/2019 Analysis of 3D Surface Data for on-line Determination of the Size Distribution of Iron Ore Pellet Piles on Conveyor …
http://slidepdf.com/reader/full/analysis-of-3d-surface-data-for-on-line-determination-of-the-size-distribution 45/130
4. Discriminant analysis 31
It is possible to reduce the probability of making a misclassication of one populationsimply by taking a discriminant rule of the form:
Choose Π1 if U > u, and choose Π2 otherwise, where u is some nonzeroconstant.
If the probability of misclassifying an observation into the second population whenit comes from the rst should be most α, then u should be chosen to be u = 1 / 2δ −z α √ δ where z α is the upper α ·100% critical point of the standard normal probabilitydistribution.
For example, suppose that δ = 9, and that we want the probability of misclassifying anobservation into Π 2 when it comes from Π1 to be at most 0.01. Then we would take u =4.5 −(2.326)(3) = −2.478. This value of u makes the probability of misclassication
in the other direction equal to 0.2503. When δ = 9 and u = 0, the probability of amisclassication into either population when it comes from the other is 0.0668.
4.3 A Procedure For Developing Discriminant RulesIn this section, a general procedure for developing discriminant rules is given. These rulesallow researchers to take into account the fact that misclassication of one populationmay be much more serious than errors of other populations by assigning relative coststo these two kinds of errors. These rules also allow researchers to use prior informationabout the relative frequency with which the two groups generally occur whenever thatrelative frequency is known or can be estimated.
The rules given in this section require that the probability density functions to beknown for each of the groups or, at least, that the densities can be estimated. Therules do not require the groups to have probability distributions that belong to the samegeneral class.
Suppose Π1 is distributed according to the probability density function f 1(x; θ1),which depends on some parameters θ1, and suppose Π2 is distributed according to theprobability density function f 2(x; θ2), which depends on some parameters θ2. A generaldiscriminant rule must divide the p-dimensional sample space into two parts, R1 and R2,so that when x falls in R1, Π1 is chosen, and when x falls in R2, Π2 is chosen.
4.3.1 A Cost Function
Let C(i| j ) represent the cost of misclassifying an observation from Π j into Π i . Withoutany loss of generality, there is no reward for classifying an observaton correctly, only apenalty if an observation is classied incorrectly. Also, let P( i| j ) represent the probabilityof misclassifying an observation from Π j into Π i
4.3.2 Prior Probabilities
In some cases, a researcher may have prior knowledge as to how likely it is that a ran-domly selected observation would come from each of the two groups. For example, a

7/31/2019 Analysis of 3D Surface Data for on-line Determination of the Size Distribution of Iron Ore Pellet Piles on Conveyor …
http://slidepdf.com/reader/full/analysis-of-3d-surface-data-for-on-line-determination-of-the-size-distribution 46/130
32 Appendix A
anesthesiologist may know that, in the absence of any other information about the pa-tients, 80% of them are sage for the anesthetic. A good discriminant rule should be able
to take this information into account.Let pi (called the prior probability for group i) represent the probability that a ran-domly selected observation comes from Π i for i = 1 , 2.
4.3.3 Average Cost of Misclassication
The average cost of the misclassication of a randomly selected observation can be shownto be
p1 ·C(2|1) ·P(2 |1) + p2 ·C(1|2) ·P(1 |2)
4.3.4 A Bayes Rule
Given prior probabilities p1 and p2 for each population, a rule that minimizes the averagecost of misclassication of a randomly selected observation is called a Bayes rule withrespect to prior probabilities p1 and p2.
The Bayes rule is:
Choose Π1 if p2 · f 2(x ; θ2) ·C(1|2) < p 1 · f 1(x; θ1) ·C(2|1), and choose Π2
otherwise.
4.3.5 Classication Functions
When the costs of classication errors and when the variance-covariance matrices in bothpopulations are equal, we can compute functions, called classication functions , for eachgroup. The classication function for the i th group is dened by
ci = μ i Σ− 1x −1/ 2μ i Σ
− 1μ i + ln( pi )
It can be shown thatd∗
1 < d ∗
2if and only if c1 > c 2. Thus, we could compute thte value for each group’s classication
function for an observed data vector, and assign the data vector to the population thatproduces the largest value for the classication function.
4.3.6 Unequal Covariance Matrices
Suppose Σ 1 = Σ 2. In this case the Bayes rule becomes:
Choose Π1 if d∗∗
1 < d ∗∗
2 whered∗∗
i = 1 / 2(x −μ i ) Σ − 1(x −μ i ) + 1 / 2log(|Σ i |) −log[ pi ·C( j |i)]For equal costs of misclassication in each direction, the Bayes rule simpiles to:
Choose Π1 if d∗∗∗
1 < d ∗∗∗
2 whered∗∗∗
i = 1 / 2(x −μ i ) Σ − 1(x −μ i ) + 1 / 2log(|Σ i |) −log[ pi ]
Some authors refer to the two rules based on the d∗∗
i and d∗∗∗
i as quadratic discriminant rules since they involve quadratic functions of the elements in x .

7/31/2019 Analysis of 3D Surface Data for on-line Determination of the Size Distribution of Iron Ore Pellet Piles on Conveyor …
http://slidepdf.com/reader/full/analysis-of-3d-surface-data-for-on-line-determination-of-the-size-distribution 47/130
5. Logistic regression 33
4.4 Discriminant Rules (More Than Two Populations)The previous sections discussed general discriminant rules for cases when there are justtwo populations under consideration. Often, a researcher will have several populationsinto which observations as to be classied.
Except for being able to obtain a single linear discriminant rule, all of the proposalsfor discriminating described in Section 4.1 can be extended to cases where there are morethan two populations. In cases where there are more than two populations in which toclassify observations, one can still
1. compute the Mahalanobis squared distance between an observation and each of thepopulation means, and then classify the observation into the population to whosemean it is closest;
2. compute the posterior probability of an observation for each of the competing pop-ulations, and classify the observation into the population that gives the largestposterior probability; or
3. compute the value of each population’s classication function, and classify an obser-vation into the population that gives the largest value for the classication function.
Each of these alternatives is equivalent. It is simply a matter of how the user of discriminant analysis prefers to view a solution to the discrimination problem.
The only concept for discriminating between two populations that does not generalizeto discriminating between more than two populations is that of being able to take therelative costs of misclassication errors into account.
5 Logistic regressionIf it is known that predictor variables have a multivariate normal distribution, then thediscriminant rules described in Section 4 are known to be the best at discriminating.However, Logistic regression can be used in situations where the predictor variables arenot normally distributed and in situations where some or all of the predictor variablesare discrete or categorial.
In logistic regression, the dependent variable is usually binary (i.e, it takes on onlytwo possible values) but logistic regression can also be used to discriminate sample intomore than two populations.
5.1 Logistic Regression Model for Two PopulationsLet x be a data vector for a randomly selected experimental unit and let y be the valueof a binary outcome variable so that y = 1 if x comes from population 1 and y = 0 if x comes from population 2. Let p(y = 1 |x) equal the probability that y = 1 given theobserved data vector x . The form of the logistic regression model is shown in equationA.15.
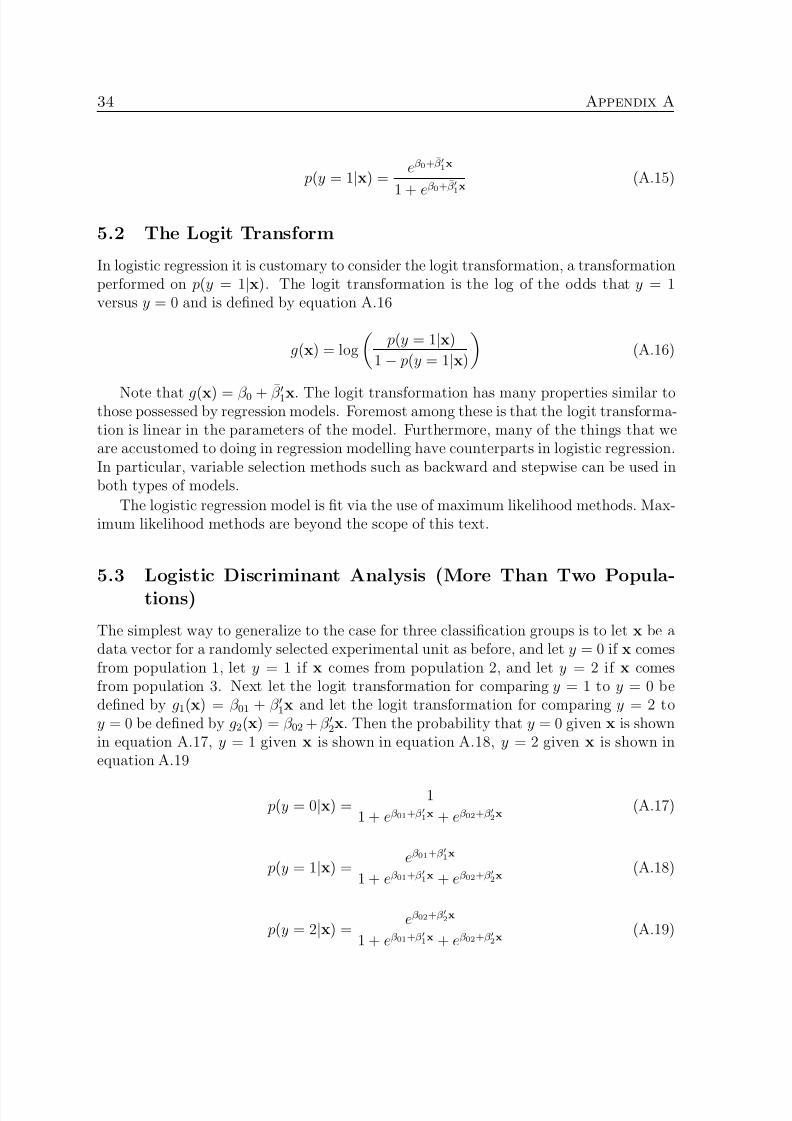
7/31/2019 Analysis of 3D Surface Data for on-line Determination of the Size Distribution of Iron Ore Pellet Piles on Conveyor …
http://slidepdf.com/reader/full/analysis-of-3d-surface-data-for-on-line-determination-of-the-size-distribution 48/130
34 Appendix A
p(y = 1
|x) =
eβ 0 + β 1 x
1 + eβ 0 +¯β 1
x(A.15)
5.2 The Logit Transform
In logistic regression it is customary to consider the logit transformation, a transformationperformed on p(y = 1 |x). The logit transformation is the log of the odds that y = 1versus y = 0 and is dened by equation A.16
g(x) = logp(y = 1 |x)
1 − p(y = 1 |x)(A.16)
Note that g(x) = β 0 + β 1x . The logit transformation has many properties similar tothose possessed by regression models. Foremost among these is that the logit transforma-tion is linear in the parameters of the model. Furthermore, many of the things that weare accustomed to doing in regression modelling have counterparts in logistic regression.In particular, variable selection methods such as backward and stepwise can be used inboth types of models.
The logistic regression model is t via the use of maximum likelihood methods. Max-imum likelihood methods are beyond the scope of this text.
5.3 Logistic Discriminant Analysis (More Than Two Popula-tions)
The simplest way to generalize to the case for three classication groups is to let x be adata vector for a randomly selected experimental unit as before, and let y = 0 if x comesfrom population 1, let y = 1 if x comes from population 2, and let y = 2 if x comesfrom population 3. Next let the logit transformation for comparing y = 1 to y = 0 bedened by g1(x) = β 01 + β 1x and let the logit transformation for comparing y = 2 toy = 0 be dened by g2(x) = β 02 + β 2x . Then the probability that y = 0 given x is shownin equation A.17, y = 1 given x is shown in equation A.18, y = 2 given x is shown in
equation A.19
p(y = 0 |x) =1
1 + eβ 01 + β 1 x + eβ 02 + β 2 x(A.17)
p(y = 1 |x) =eβ 01 + β 1 x
1 + eβ 01 + β 1 x + eβ 02 + β 2 x(A.18)
p(y = 2 |x) =eβ 02 + β 2 x
1 + eβ 01 + β 1 x + eβ 02 + β 2 x(A.19)

7/31/2019 Analysis of 3D Surface Data for on-line Determination of the Size Distribution of Iron Ore Pellet Piles on Conveyor …
http://slidepdf.com/reader/full/analysis-of-3d-surface-data-for-on-line-determination-of-the-size-distribution 49/130
6. Variable selection procedures 35
6 Variable selection proceduresWhen several variables are being considered for discrimination purposes, an importantquestion to ask is if all the variables really are necessary for effective discrimination andwhich variables are the best discriminators?
Variable selection procedures have been proposed that can provide some guidance toresearchers wishing to select a subset of the measured variables to use for discrimina-tion purposes. The methods discussed here are forward selection procedure, backwardelimination procedure, and a stepwise procedure that is a combination of the rst two.
6.1 Forward Selection ProcedureThe forward selection procedure begins by choosing the variable that is expected to bethe best discriminator among all of the available variables. If no variable is signicant ata chosen signicance level, then we can conclude that the prospective variables will notdiscriminate between the groups.
If one of the variables is selected, then choosing a second variable is considered. If no second variable is statistically signicant, the procedure stops and the rst variableis the only one selected. If a second variable is selected, then choosing a third variableis considered, etc. The forward procedure stops when none of the remaining variables isstatistically signicant.
6.2 Backward Elimination ProcedureThe backward elimination procedure begins by including all prospective variables as dis-criminators, after which it removes the variable that seem to be the least useful for dis-criminating. If all variables are statistically signicant at a chosen signicance level, theprocedure stops; but if some variables are not statistically signicant then the procedureremoves the variable that is least signicant.
If a variable is removed, then the backward elimination procedure looks for a secondvariable to remove. If all remaining variables are statistically signicant, the procedurestops. If some remaining variables are not statistically signicant then the procedureremoves the variable that is least signicant. If a second variable is removed, then the
procedure look for a third variable, etc. The backward elimination procedure stops whenall remaining variables are statistically signicant.
6.3 Stepwise Selection ProcedureThe stepwise procedure is a combination of the forward selection procedure and thebackward elimination procedure. This procedure selects variables for inclusion withineach step in exactly the same way that the forward selection procedure selects variables.Where the stepwise procedure differs from the forward selection procedure is that ateach step, before choosing a new variable to include, it checks to see if all of the variablespreviously selected remain signicant. In some instances, a variable may seem useful early

7/31/2019 Analysis of 3D Surface Data for on-line Determination of the Size Distribution of Iron Ore Pellet Piles on Conveyor …
http://slidepdf.com/reader/full/analysis-of-3d-surface-data-for-on-line-determination-of-the-size-distribution 50/130
36 Appendix A
in the selection process, but after a few additional variables are included, one selectedearlier may no longer be useful. This procedure would remove such a variable, while
the forward selection procedure would never removes any variables. The procedure stopswhen no other variables meet the criteria for entry or when the variable to be includednext is one that was just removed.
6.4 RecommendationsMany statistical computing packages allow the use of variable selection procedures. John-son believe that the best selection procedure is the backward elimination procedure pro-vided that the number of prospective variables is at most 15. When the number of variables exceeds 15, then the stepwise procedure is recommended. The forward selec-tion procedure is not recommended since it may produce sets of discriminating variablesfor which not every variable is signicant.
When using variable selection procedures, a signicance level at which variables enterinto the discriminating set of variables or are removed from this set is chosen. When usingthe backward elimination procedure, Johnson recommend that a signicance level for avariable to remain in the model be set at α = 0 .01. When using the stepwise selectionprocedure, Johnson recommend that the signicance level for entry of a variable into thediscriminating sets be xed at an α somewhere between 0.25 and 0.5, and the signicancelevel for a variable remaining in the discriminating set be xed a α = 0 .15
Finally, when using statistical computing packages, researches should try to see theresults of a large number of possible subsets of discriminating variables. There is no law,written or unwritten, that says a researcher must use the set of variables occurring onthe last page of the computer printout.
7 Estimating probabilities of misclassicationWhen performing a discriminant analysis, it is necessary to be able to determine orestimate the probabilities of correct classications of new observations. Unfortunately,estimating the probabilities of correct classication is not easy. Three basic methods canbe used as explained in the following subsections.
7.1 Resubstitution EstimatesOne simple method called the resubstitution method is to apply a discriminant rule tothe data used to develop the rule and observe how often the rule correctly classiesthese observations. The biggest drawback to this method is that it overestimates theprobabilities of correct classication. Obviously, a rule is likely to do better on the dataused to build the rule than it might do on any other data set. Nevertheless, almostall computer programs that perform discriminant analyzes will produce a ”classicationsummary matrix” that shows where observations in the sample data would be classiedby the discriminant rule developed. If the discriminant rule does not work well for the

7/31/2019 Analysis of 3D Surface Data for on-line Determination of the Size Distribution of Iron Ore Pellet Piles on Conveyor …
http://slidepdf.com/reader/full/analysis-of-3d-surface-data-for-on-line-determination-of-the-size-distribution 51/130
7. Estimating probabilities of misclassification 37
data use to construct the rule, then we should expect the rule to be even worse for newdata sets.
7.2 Estimates from Holdout DataA second method for estimating the probabilities of correct classication, called theholdout method, uses a holdout data set , also called a test data set . A holdout data setis one for which we know where the observations should be classied, but the holdoutdata are not used to develop the discriminant rule. Then a discriminant rule developedfrom other data can be applied to the holdout data set to see how well observations inthe holdout data set are classied according to the rule. This method has been shown toproduce unbiased estimates of the probabilities of correct classication.
The biggest drawback to using a holdout data set is that you may not actually begetting the ”best” possible discrimination rule because all the data are not being usedto obtain the rule.
7.3 Cross-Validation EstimatesA third method, which is usually preferred to the rst two, is known as cross-validation .It can be described in the following manner: Remove the rst observation vector fromthe data set, form a discriminant rule based on all of the remaining data, use this rule toclassify the rst observation, and note whether the observation is correctly classied ornot. Next, replace the rst observation and remove the second observation from the data
set, form a discriminant rule based on all of the remaining data, use this rule to classifythe second observation, and note whether the observation is correctly classied or not.Continue this process though the entire data set, removing one observation at a time, andnoting whether that particular observation would be correctly classied by a rule formedfrom all of the remaining data. Finally create a summary matrix for these cross-validatedestimates. These estimates have been shown to be nearly unbiased estimates of the trueprobabilities of correct and incorrect classications. This method is also referred to as”jackkning”.

7/31/2019 Analysis of 3D Surface Data for on-line Determination of the Size Distribution of Iron Ore Pellet Piles on Conveyor …
http://slidepdf.com/reader/full/analysis-of-3d-surface-data-for-on-line-determination-of-the-size-distribution 52/130
38 Appendix A

7/31/2019 Analysis of 3D Surface Data for on-line Determination of the Size Distribution of Iron Ore Pellet Piles on Conveyor …
http://slidepdf.com/reader/full/analysis-of-3d-surface-data-for-on-line-determination-of-the-size-distribution 53/130
References
[1] L. S. Okvist, A. Dahlstedt, and M. Hallin, “The effect on blast furnace process of changed pellet size as a result of segregation in raw material handling,” Ironmaking Conference Proceedings , pp. 167–178, 2001.
[2] M. J. Thurley and K. Ng, “Identication and sizing of the entirely visible rocksfrom a 3d surface data segmentation of laboratory rock piles,” Computer Vision and Image Understanding , 2007.
[3] A. Rosato, K. J. Strandburg, F. Prinz, and R. H. Swendsen, “Why the brazil nutsare on top: Size segregation of particulate matter by shaking,” Physical Review Letter , vol. 58, pp. 1038 – 1040, 1987.
[4] R. Chavez, N. Cheimanoff, and J. Schleifer, “Sampling problems during grain sizedistribution measurements,” Proceedings of the Fifth International Symposium on Rock Fragmentation by Blasting - FRAGBLAST 5 , pp. 245–252, Aug 1996.
[5] M. J. Thurley and K. C. Ng, “Modelling the relationship between the surface frag-ments and the pile size distribution in laboratory rock piles,” In submission .
[6] “Lkab in brief,” 2007. Downloadable from www.lkab.com. (October 2007).
[7] “People and steel,” 2007. Presentation of SSAB Tunnplat. Downloadable fromwww.ssab.com. (October 2007).
[8] N. Maerz, T. Palangio, and J. Franklin, “Wipfrag image based granulometry sys-tem,” in Measurement of Blast Fragmentation – Proceedings of the FRAGBLAST 5
Workshop (J. Franklin and T. Katsabanis, eds.), pp. 91–99, Balkema, 1996.[9] J. Schleifer and B. Tessier, “Fragmentation assessment using the Fragscan system:
Quality of a blast,” in Explosives in Mining Conference [21], pp. 365–372.
[10] J. Kemeny, E. Mofya, R. Kaunda, and P. Lever, “Improvements in blast fragmen-tation models using digital image processing,” in Explosives in Mining Conference [21], pp. 357–363.
[11] R. A. Salinas, U. Raff, and C. Farfan, “Automated estimation of rock fragment dis-tributions using computer vision and its applcation in mining,” in IEE Proceedings:Vision, Image and Signal Processing , vol. 152(1), pp. 1–8, February 2005.
39

7/31/2019 Analysis of 3D Surface Data for on-line Determination of the Size Distribution of Iron Ore Pellet Piles on Conveyor …
http://slidepdf.com/reader/full/analysis-of-3d-surface-data-for-on-line-determination-of-the-size-distribution 54/130

7/31/2019 Analysis of 3D Surface Data for on-line Determination of the Size Distribution of Iron Ore Pellet Piles on Conveyor …
http://slidepdf.com/reader/full/analysis-of-3d-surface-data-for-on-line-determination-of-the-size-distribution 55/130
Part II

7/31/2019 Analysis of 3D Surface Data for on-line Determination of the Size Distribution of Iron Ore Pellet Piles on Conveyor …
http://slidepdf.com/reader/full/analysis-of-3d-surface-data-for-on-line-determination-of-the-size-distribution 56/130
42

7/31/2019 Analysis of 3D Surface Data for on-line Determination of the Size Distribution of Iron Ore Pellet Piles on Conveyor …
http://slidepdf.com/reader/full/analysis-of-3d-surface-data-for-on-line-determination-of-the-size-distribution 57/130
Paper A
Pellet Size Estimation UsingSpherical Fitting
Authors:Tobias Andersson, Matthew J. Thurley, Olov Marklund
Reformatted version of paper originally published in:Proceedings of the IEEE Instrumentation and Measurement Technology Conference, pp1-5, (Warsaw, Poland), 2007
c 2007, IEEE, Reprinted with permission.
43

7/31/2019 Analysis of 3D Surface Data for on-line Determination of the Size Distribution of Iron Ore Pellet Piles on Conveyor …
http://slidepdf.com/reader/full/analysis-of-3d-surface-data-for-on-line-determination-of-the-size-distribution 58/130

7/31/2019 Analysis of 3D Surface Data for on-line Determination of the Size Distribution of Iron Ore Pellet Piles on Conveyor …
http://slidepdf.com/reader/full/analysis-of-3d-surface-data-for-on-line-determination-of-the-size-distribution 59/130
Pellet Size Estimation Using Spherical Fitting
Tobias Andersson, Matthew Thurley and Olov Marklund
Abstract
Evaluation of Spherical Fitting as a technique for sizing iron ore pellets is performed. Sizemeasurement of pellets in industry is usually performed by manual sampling and sieving
techniques. Automatic on-line analysis of pellet size would allow non-invasive, frequentand consistent measurement. Previous work has used an assumption that pellets arespherical to estimate pellet sizes. In this research we use a 3D laser camera system in alaboratory environment to capture 3D surface data of pellets and steel balls. Validation of the 3D data against a spherical model has been performed and demonstrates that pelletsare not spherical and have physical structures that a spherical model cannot capture.
1 Introduction
Pellet’s sizes are critical to the efficiency of the blast furnace process in production of steel. Okvist et al. [1] shows how different pellet size distributions effect the blastfurnace process. Overly coarse pellets effect the blast furnace process negatively andOkvist et al. [1] reports on how to minimize the effect by operating the furnace withdifferent parameters. An on-line system for measurement of pellet sizes would improveproductivity through fast feedback and efficient control of the blast furnace.
In pellet manufacturing, manual sampling followed by sieving with a square mesh isused for quality control. The manual sampling is performed infrequently and is time-consuming. Fast feedback of pellets sizes is desirable.
Blomquist and Wernerson [2] use a statistical model that assumes pellets are sphericalto measure diameter and diameter deviation of pellets from chord lengths.
Bouajila et al. [3] estimate size of green pellets with a 3D laser camera. Based onthe assumption that pellets are spherical, they apply a spherical smoothing method toobtain a complete size distribution of the produced pellets. Bouajila et al. [3] reportthat the estimated size distribution correlates well with the reference values.
In the presented research we use an industrial prototype 3D imaging system to capture3D surface data of pellet piles on a conveyor. Estimation of pellet sizes is made based onthe assumption that pellets are spherical. An evaluation of the suitability of the sphericalassumption is made.
45

7/31/2019 Analysis of 3D Surface Data for on-line Determination of the Size Distribution of Iron Ore Pellet Piles on Conveyor …
http://slidepdf.com/reader/full/analysis-of-3d-surface-data-for-on-line-determination-of-the-size-distribution 60/130
46 Paper A
2 Methods
In this section we outline the methods used to capture the 3D surface data, segment it,determine segmented regions sizes and evaluate the spherical model.
2.1 Imaging SystemAn imaging system that captures 3D surface data has been implemented by MBV Sys-tems [4]. The system is based on a projected laser line and camera triangulation [5,triangulation, structured light]. It has a continuous wave diode laser with line generatingoptics and a high speed digital camera capable of 4000 frames per second. The anglebetween the line of sight and the laser is approximately 30 degrees.
2.2 Collection of Data2.2.1 Pellets
Mechanical sieving is the accepted industry technique for sizing pellets. A sample of baked pellets was sieved into 6 size gradings and is shown in table 1.1.
Sieve size (mm) † Weight (kg) % Cum. %6.3 4.089 12.9 12.9
9 4.755 14.9 27.810 12.613 39.6 67.411.2 7.493 23.5 91.012.5 2.445 7.68 98.714 0.4233 1.33 100
† The lower bound of each sieve size incre-ment
Table 1.1: Sieve size distribution of the sample of baked pellets.
Each size class is captured individually with the imaging system in a laboratory setup.The pellets are spread out on a conveyor belt to make sure that the surface of each pelletis not occluded by other pellets.
2.2.2 Steel Balls
The steel balls have a known diameter and have been painted with a thin layer of matgrey paint to allow data capture with the imaging system. The steel balls are positionedseparately on a tray. The imaging system captures a sample of 45 balls each of size 5,10, 12.7 and 16 mm, 30 balls of 17.5 mm and 15 balls each of 20 and 25 mm.

7/31/2019 Analysis of 3D Surface Data for on-line Determination of the Size Distribution of Iron Ore Pellet Piles on Conveyor …
http://slidepdf.com/reader/full/analysis-of-3d-surface-data-for-on-line-determination-of-the-size-distribution 61/130

7/31/2019 Analysis of 3D Surface Data for on-line Determination of the Size Distribution of Iron Ore Pellet Piles on Conveyor …
http://slidepdf.com/reader/full/analysis-of-3d-surface-data-for-on-line-determination-of-the-size-distribution 62/130
48 Paper A
Residuals, which is the part of the data that the model could not reproduce, mayalso indicate how well the model describes the data. A spherical model’s residuals are
calculated by equation 5, where xi , yi and z i is the coordinates for point i.
i = (xi −x0)2 + ( yi −y0)2 + ( z i −z 0)2 −R (5)
Ljung [8] suggest analysis of basic statistics for residuals and we will use root-mean-square error as shown in equation 6 in this analysis where i is the residual for point iand m is the number of points.
RMS Error = 1mm
i=1
2i (6)
The comparison of estimated values with known data and the residual analysis givea good indication of how well the model captures the data.
3 Performance of spherical ttingThe accuracy of the imaging system and the spherical model as a measurement methodis evaluated by sizing perfect steel balls and sieved pellets.
3.1 Steel BallsThe model is tted to each steel ball and the result of estimated sizes and residualstatistics is shown in table 1.2.
The median of the estimated sizes is close to the known values of the steel ballsdiameter. The residual analysis indicate some deviation between data and the model.The median of RMS Error range from 0.107 to 0.128 for all size classes.
For perfect steel balls the model and measurement system seems to give good results.The physical comparison to known sizes of the balls is very good. The residual analysisindicate that there is some deviation from the model but it is small.
3.2 PelletsTo evaluate if a spherical assumption of pellets shape is adequate the spherical modelis tted to each pellet. The estimated diameters and statistics for the residuals for thedifferent classes are calculated. We present the distribution of the estimated diametersand RMS error for the different classes in Table 1.3. The result is also shown graphicallyin gures 1 and 2 using the graphical convention of horizontal box-plots.
The central portion of a box-plot contains a rectangular box. In the center of this boxis a short thick vertical black line, this marks the median value (or 50th percentile) of thedata. The left edge of the rectangular box marks the 25th percentile, and the right edgemarks the 75th percentile. The difference between the 75th and 25th percentile is the

7/31/2019 Analysis of 3D Surface Data for on-line Determination of the Size Distribution of Iron Ore Pellet Piles on Conveyor …
http://slidepdf.com/reader/full/analysis-of-3d-surface-data-for-on-line-determination-of-the-size-distribution 63/130
Paper A 49
Size∗ Nbr Size est. (mm) RMS Error
†(mm) Median IQR Median IQR5 45 5.432 0.308 0.107 0.013310 45 10.35 0.165 0.107 0.007312.7 45 12.95 0.108 0.106 0.004816 45 16.18 0.106 0.119 0.005417.5 30 17.63 0.081 0.117 0.005920 15 20.03 0.073 0.118 0.005925 15 24.95 0.169 0.128 0.0099
∗Known diameter of steel ballEstimated size. Diameter of tted sphere
† Root-mean-square error. Equation 6Interquartile range. Range between 25 th
and 75th percentile
Table 1.2: Result for spherical t to measured steel balls. Estimated sizes correlate well with known sizes and the RMS Error estimate is small. The interquartile range is small for both estimated diameter and RMS Error.
Size∗ Nbr Size est. (mm) RMS Error †(mm) Median IQR Median IQR6.3 1010 10.34 1.777 0.261 0.1349 755 11.34 1.553 0.266 0.11710 867 12.12 1.504 0.274 0.11011.2 677 13.58 1.794 0.299 0.12412.5 477 15.02 1.887 0.329 0.13314 61 16.00 1.690 0.350 0.127
∗
The lower bound of each sieve size incre-mentEstimated size. Diameter of tted sphere
† Root-mean-square error. Equation 6Interquartile range. Range between 25 th
and 75th percentile
Table 1.3: Result for spherical t to measured pellets. The estimated size is constantly overes-timated and the interquartile range is relatively large. The RMS Error is large.

7/31/2019 Analysis of 3D Surface Data for on-line Determination of the Size Distribution of Iron Ore Pellet Piles on Conveyor …
http://slidepdf.com/reader/full/analysis-of-3d-surface-data-for-on-line-determination-of-the-size-distribution 64/130
50 Paper A
interquartile range (IQR). The IQR is a robust estimate of the spread of the data. Thecircular dots to the left and right of each box-plot indicate values that are statistically
determined to be outliers. Values are dened to be outliers when they are less thanthe 25th percentile - 1.5IQR or greater than the 75th percentile + 1.5IQR. These valuescorrespond to pellets that are particularly non-spherical. The dashed lines extending tothe left and right of the rectangular box extend to the statistically valid min and max.The graphs and determination of outliers were calculated using the R statistical analysispackage [9].
In gure 1, it is clear that the size estimate for pellets is constantly overestimated.Also, it is important to notice that the interquartile range of the size estimates is gen-erally larger than the intervals between the different classes. The classes are not clearlyseparable and will not be suitable for determining pellet size that corresponds to squaremesh sieving techniques.
The median value of the RMS Error, shown in table 1.3, range from 0.261 for thesmallest size class to 0.366 for the biggest size class. The interquartile range is above 0.1for all size classes. The RMS Error clearly indicates that pellets are not spherical andthe distribution of the RMS error for the different classes can be seen in gure 2.
The physical comparison to known sizes of pellets combined with the residual anal-ysis indicate that pellets are not spherical. It is important to notice that the physicalcomparison of the calculated size and the known sieve sizes show that the estimated sizesare wrong and sensitive to input data.
For comparison we show the box-plots for steel balls in gures 3 and 4 drawn at thesame scale as gure 1 and 2. Analyzing gure 3 and 1, it is clear that the distributionsfor the estimated sizes are very narrow and close to the known sizes for steel balls. Forpellets the distributions are broad and the size estimates are constantly overestimated.Analyzing gure 4 and 2, it is clear that the RMS Errors are comparatively large forpellets.
In addition, the residuals are shown in gure 5 for pellets in size class 10 mm. Forcomparison we show the residuals for steel balls with a diameter of 10 mm in gure 6.It is obvious that the model does not capture certain areas of pellets that deviate froma spherical model. The gures show a signicantly greater variation of the residualsfor pellets than for steel balls and this indicate that the spherical model works well forperfect steel balls but do not account for all variations in pellet’s structure.

7/31/2019 Analysis of 3D Surface Data for on-line Determination of the Size Distribution of Iron Ore Pellet Piles on Conveyor …
http://slidepdf.com/reader/full/analysis-of-3d-surface-data-for-on-line-determination-of-the-size-distribution 65/130
Paper A 51
6.3mm
9mm
10mm
11.2mm
12.5mm
14mm
5 10 15 20
Sphere Fitting Diameter for Pellets of Various Sizes
Calculated Sphere Diameter (mm)
Figure 1: Distribution of estimated sphere diameters for different size classes. The dashed lines corresponds to the lower bound of each size class.
6.3mm
9mm
10mm
11.2mm
12.5mm
14mm
0.5 1.0 1.5
Sphere Fitting RMS Error for Pellets of Various Sizes
Figure 2: Distribution of estimated error of t for different size classes.

7/31/2019 Analysis of 3D Surface Data for on-line Determination of the Size Distribution of Iron Ore Pellet Piles on Conveyor …
http://slidepdf.com/reader/full/analysis-of-3d-surface-data-for-on-line-determination-of-the-size-distribution 66/130
52 Paper A
5mm
10mm
12.7mm
16mm
17.4mm
20mm
25mm
5 10 15 20 25
Sphere Fitting Diameter for Steel Balls of Various Diameters
Calculated Sphere Diameter (mm)
Figure 3: Distribution of estimated sphere diameters for different size classes. The dashed lines corresponds to known diameters for the balls.
5mm
10mm
12.7mm
16mm
17.4mm
20mm
25mm
0.5 1.0 1.5
Sphere Fitting RMS Error for Steel Balls of Various Diameter
Figure 4: Distribution of estimated error of t for different size classes.

7/31/2019 Analysis of 3D Surface Data for on-line Determination of the Size Distribution of Iron Ore Pellet Piles on Conveyor …
http://slidepdf.com/reader/full/analysis-of-3d-surface-data-for-on-line-determination-of-the-size-distribution 67/130
Paper A 53
Figure 5: Sample of residuals for pellets in class 10 mm. That is pellets of size between 10 and 11.2 mm.
Figure 6: Sample of residuals for balls with a diameter of 10 mm.

7/31/2019 Analysis of 3D Surface Data for on-line Determination of the Size Distribution of Iron Ore Pellet Piles on Conveyor …
http://slidepdf.com/reader/full/analysis-of-3d-surface-data-for-on-line-determination-of-the-size-distribution 68/130
54 Paper A
4 ConclusionsA study of the adequacy of the assumption that pellets are spherical is made. Pellets arecollected and mechanically sieved into different classes. Also perfect steel balls with wellknown properties are collected. The two samples are captured by an imaging system thatproduces 3D surface data. The surface is segmented and a spherical model tted to eachpellet and steel ball. Model evaluation based on physical properties and residual analysisshow that the spherical model works well for perfect steel balls but not for pellets.
ACKNOWLEDGMENT
We wish to thank the staff at ProcessIT Innovations for all time and effort to makethis research possible. We thank John Erik Larsson at MBV-systems for adjustments
and development of the 3D surface imaging system. We thank Kjell-Ove Mickelsson andRobert Johannson for their invaluable industry knowledge and advice.

7/31/2019 Analysis of 3D Surface Data for on-line Determination of the Size Distribution of Iron Ore Pellet Piles on Conveyor …
http://slidepdf.com/reader/full/analysis-of-3d-surface-data-for-on-line-determination-of-the-size-distribution 69/130
References
[1] L. S. Okvist, A. Dahlstedt, and M. Hallin, “The effect on blast furnace process of changed pellet size as a result of segregation in raw material handling,” Ironmaking Conference Proceedings , pp. 167–178, 2001.
[2] M. Blomquist and A. Wernerson, “Range camera on conveyor belts: estimating sizedistribution and systematic errors due to occlusion,” Proceedings of the SPIE - The International Society for Optical Engineering , vol. 3835, pp. 118–126, Sept 1999.
[3] A. Bouajila, M. Bourassa, J.-A. Boivin, G. Ouellet, and T. I. Martinovic, “On-linenon-intrusive measurement of greeen pellet diameter,” Ironmaking Conference Pro-ceedings , pp. 1009–1020, 1998.
[4] J. E. Larsson, “[email protected],”
[5] Wikipedia, “3d scanner,” July 2007.
[6] M. J. Thurley, “On-line 3d surface measurement of iron ore green pellets,” in Pro-ceedings of the International Conference on Computational Intelligence for Modelling,Control and Automation , IEEE, November 2006.
[7] M. Thurley and K. Ng, “Identifying, visualizing, and comparing regions in irregularlyspaced 3d surface data,” Computer Vision and Image Understanding , vol. 98, pp. 239–270, February 2005.
[8] L. Ljung, System identication : theory for the user . Prentice Hall, 2. ed. ed., 1999.ISBN: 0-13-656695-2.
[9] R. Ihaka and R. Gentleman, “R: A language for data analysis and graphics,” Jour-nal of Computational and Graphical Statistics , vol. 5, no. 3, pp. 299–314, 1996.http://www.r-project.org /.
55

7/31/2019 Analysis of 3D Surface Data for on-line Determination of the Size Distribution of Iron Ore Pellet Piles on Conveyor …
http://slidepdf.com/reader/full/analysis-of-3d-surface-data-for-on-line-determination-of-the-size-distribution 70/130
56

7/31/2019 Analysis of 3D Surface Data for on-line Determination of the Size Distribution of Iron Ore Pellet Piles on Conveyor …
http://slidepdf.com/reader/full/analysis-of-3d-surface-data-for-on-line-determination-of-the-size-distribution 71/130
Paper B
Visibility Classication of Pellets inPiles for Sizing Without
Overlapped Particle Error
Authors:Tobias Andersson, Matthew J. Thurley, Olov Marklund
Reformatted version of paper accepted for publication in:Proceedings of the Digital Image Computing: Techniques and Applications Conference,(Adelaide, Austraila), 2007
c 2007, IEEE, Reprinted with permission.
57

7/31/2019 Analysis of 3D Surface Data for on-line Determination of the Size Distribution of Iron Ore Pellet Piles on Conveyor …
http://slidepdf.com/reader/full/analysis-of-3d-surface-data-for-on-line-determination-of-the-size-distribution 72/130
58 Paper B

7/31/2019 Analysis of 3D Surface Data for on-line Determination of the Size Distribution of Iron Ore Pellet Piles on Conveyor …
http://slidepdf.com/reader/full/analysis-of-3d-surface-data-for-on-line-determination-of-the-size-distribution 73/130
Visibility Classication of Pellets in Piles for SizingWithout Overlapped Particle Error
Tobias Andersson, Matthew J. Thurley and Olov Marklund
Abstract
Size measurement of pellets in industry is usually performed by manual sampling andsieving techniques. Automatic on-line analysis of pellet size based on image analysis
techniques would allow non-invasive, frequent and consistent measurement. We makea distinction between entirely visible and partially visible pellets. This is a signicantdistinction as the size of partially visible pellets cannot be correctly estimated withexisting size measures and would bias any size estimate. Literature review indicates thatother image analysis techniques fail to make this distinction. Statistical classicationmethods are used to discriminate pellets on the surface of a pile between entirely visibleand partially visible pellets. Size estimates of the surface of a pellet pile show thatoverlapped particle error can be overcome by estimating the surface size distributionusing only the entirely visible pellets.
1 IntroductionIron ore pellet’s sizes are critical to the efficiency of the blast furnace process in productionof steel. Overly coarse pellets effect the blast furnace process negatively, however thiseffect can be minimized by operating the furnace with different parameters [1]. An on-line system for measurement of the pellet size distribution would improve productivitythrough fast feedback and efficient control of the blast furnace.
In pellet manufacturing, manual sampling followed by sieving with a square mesh isused for quality control. The manual sampling is performed infrequently and is time-consuming. Fast feedback of the pellet size distribution is desirable.
Thurley [2] present progress on a now completed online imaging and analysis systemfor non-contact measurement of the size of iron ore green pellets on conveyor belts. A3D surface data capturing system based on active triangulation is used to collect data.Segmentation of the data is achieved with algorithms based on mathematical morphologyfor sparse, irregular 3D surface data. It is also shown that sizing of identied pellets givespromising results using the best-t rectangle [3] measure.
Image analysis techniques promise a quick, inexpensive and non-contact solution todetermining the size distribution of a pellet pile. Such techniques capture information of the surface of the pellet pile which is then used to infer the pile size distribution.
However, there are a number of sources of error relevant to surface analysis techniquesas follows;
59

7/31/2019 Analysis of 3D Surface Data for on-line Determination of the Size Distribution of Iron Ore Pellet Piles on Conveyor …
http://slidepdf.com/reader/full/analysis-of-3d-surface-data-for-on-line-determination-of-the-size-distribution 74/130
60 Paper B
• Segregation and grouping error, more generally known as the brazil nut effect [4],describes the tendency of the pile to separate into groups of similarly sized particles.
It is caused by vibration or motion (for example as rocks are transported by truckor conveyor) with large particles being moved to the surface.
• Capturing error [5, 6], describes the varying probability based on size, that a particlewill appear on the surface of the pile.
• Prole error, describes the fact that only a prole of surface particles can be seenmaking it difficult to estimate size. However, best-t rectangle [3] has been suc-cessfully used as a feature for determining the sieve size of rocks [7] and pellets [2]based on the visible prole.
• Overlapped particle error, describes the fact that many particles are only partiallyvisible and a large bias to the smaller size classes results if they are treated as smallentirely visible particles and sized using only their visible prole.
We eliminate both segregation and capturing error from the presented study by com-paring the results against the pellets on the surface and not the overall pile size distri-bution.
Work has been published on size estimation of iron ore pellets that assumes pelletsare spherical [8, 9]. However, we have previously shown that spherical tting is a poormeasure of pellet size [10]. More work have been presented on size and shape analysisof rock fragments, and we extend our literature review to include presented work in thateld. Comparison of manual sampling and estimates of rock fragment’s size using 2Dimaging analysis has been published [11, 12]. It is reported by Wang and Stephansson [11]that ”a systematic error compared to sieving analysis” is found. With the exception of Thurley [7, 13], 3D surface measurement of rocks has only been applied to segmentationwhere rocks had little or no overlap [14], or to shape measurements of individual rockfragments [15]. Both Kim et al. [14] and Lee et al [15] propose a mechanical solutionto ensure that aggregate particles are not overlapped. However, a mechanical solution isnot practical to consider in an operating mine, as it would demand redesign of existingconveyor belt systems.
The presented research extends the work of Thurley [7] and describes an algorithm
to overcome overlapped particle error by classifying the pellets on the surface of the pilebetween entirely visible and partially visible pellets. Once identied, partially visiblepellets can be excluded from any surface size estimate.
2 Sample of Pellet PileMechanical sieving is the accepted industry technique for sizing pellets. A sample of baked iron ore pellets was sieved into 6 size gradings. Each sieve size was painted andcolor coded to allow manual identication of pellet sizes in mixed pellet piles. The samplewas divided into two separate sets. The rst set will be used to develop algorithms for

7/31/2019 Analysis of 3D Surface Data for on-line Determination of the Size Distribution of Iron Ore Pellet Piles on Conveyor …
http://slidepdf.com/reader/full/analysis-of-3d-surface-data-for-on-line-determination-of-the-size-distribution 75/130
Paper B 61
Figure 1: Close up of the rst set of pellets captured by 3D imaging system viewed from above.The data is comprised of sparse irregularly spaced 3D coordinate points with overlayed color information.
visibility and size classication. The second set will be held out during development of the visibility and size classiers. Thus, the second set will only be used to validate the
classiers performance.The two sets were loaded onto a laboratory conveyor belt and the stream of pelletswas scanned with a 3D imaging system based on laser triangulation. An additional colorcamera is used to collect color information to overlay on the 3D surface data. A portionof the collected data for the two sets of pellets is shown in gure 1 and 2.
We dene the two visibility classes; entirely visible and partially visible. A pelletsvisibility depend on how much of a pellet is visible from above.
The two sets were manually interrogated to specify each pellet’s size and visibilityclass. The rst set has a total number of 842 pellets on the surface of the pile. 292 pelletsare labelled as entirely visible and the remaining 550 pellets are partially visible. Thesieve size distribution of the pellet pile surface and of entirely visible pellets on the surfacefor the rst set is shown in table 2.1. The second set has a total number of 792 pelletson the surface of the pile. 301 pellets are labelled as entirely visible and the remaining491 pellets are partially visible. The sieve size distribution of the complete surface andof the entirely visible pellets on the surface for the second set is shown in table 2.2.
3 Estimating Pellet SizeAs best-t rectangle [3] has been shown to be a feature with a capacity for discriminatingpellets into different sieve sizes [2] we calculate the best-t rectangle for each pellet in

7/31/2019 Analysis of 3D Surface Data for on-line Determination of the Size Distribution of Iron Ore Pellet Piles on Conveyor …
http://slidepdf.com/reader/full/analysis-of-3d-surface-data-for-on-line-determination-of-the-size-distribution 76/130
62 Paper B
Figure 2: Close up of the second set of pellets.
Paint color ∗ Size † All Entirely visibleOrange 6.3 15.68 11.64
Pink 9 16.27 18.84
Grey 10 40.74 41.44
Red 11.2 21.14 20.21
Yellow 12.5 4.04 5.48
Green 14 2.14 2.40
∗Sieve class color.
† The lower bound of each sieve size in-crement (mm)Size distribution of all pellets on thesurface (%)Size distribution of only entirely visiblepellets on the surface (%)
Table 2.1: Known size distribution of pellets on the surface for rst set. Size distributions of all pellets and only visible pellets are shown.
our sample. We visualize the distribution of best-t rectangle values for entirely visibleand partially visible pellets on the surface of a pile using the graphical convention of box-plots in gure 3 and 4.
The central portion of a box-plot [16, 17] contains a rectangular box. In the centerof this box is a dashed vertical line, this marks the median value (or 50th percentile) of the data. The left edge of the rectangular box marks the 25th percentile, and the rightedge marks the 75th percentile.
In gure 3 box-plots of best-t rectangle values for the entirely visible pellets areshown. It is clear that an increase of the best-t rectangle values correlate with anincrease of sieve size. It is noticeable that the distributions slightly overlap, althoughmore signicantly for the smaller size classes 9 mm and 10 mm. Perfect discriminationinto different sieve sized cannot be expected but a majority of the pellets should bepossible to discriminate correctly.
In gure 4 box-plots of best-t rectangle values for the partially visible pellets areshown. As expected, the best-t rectangle values are shifted to smaller values compared

7/31/2019 Analysis of 3D Surface Data for on-line Determination of the Size Distribution of Iron Ore Pellet Piles on Conveyor …
http://slidepdf.com/reader/full/analysis-of-3d-surface-data-for-on-line-determination-of-the-size-distribution 77/130
Paper B 63
Paint color ∗ Size † All Entirely visibleOrange 6.3 15.03 11.63
Pink 9 16.67 15.95
Grey 10 41.29 45.18Red 11.2 17.93 19.27
Yellow 12.5 6.57 6.31
Green 14 2.53 1.66
∗Sieve class color.
† The lower bound of each sieve size in-crement (mm)
Size distribution of all pellets on thesurface (%)Size distribution of only entirely visiblepellets on the surface (%)
Table 2.2: Known size distribution of pellets on the surface for second set. Size distributions of all pellets and visible pellets are shown.
6.3mm
9mm
10mm
11.2mm
12.5mm
14mm
0 50 100 150 200 250 300
Best−Fit−Rectangle Area for Entirely Visible Pellets
Area, Best−Fit−Rectangle (mm²)
Figure 3: Distributions of calculated best-t rectangle for entirely visible pellets. The distribution of the best-t rectangle values do not overlap
with the values for visible pellets. It is important to notice that these distributionsoverlap signicantly, such that they cannot be discriminated between. This emphasisesthe unsuitability for sizing partially visible pellets based only on their visible prole.
It is clear that best-t rectangle values for partially visible pellets cannot be used toestimate sieve size. It is critical to identify these pellets so they can be excluded fromany size estimate of pellet piles.
4 ClassicationGenerally all classiers try to predict a response , here denoted y, from a set of feature values , here denoted x . Detailed information can be found in the books [18] and [19].
In this research, we propose a method to overcome overlapped particle error whenestimating the surface size distribution of a pellet pile. Logistic regression is used toclassify pellets on the surface of a pile between two visibility classes; entirely visible and
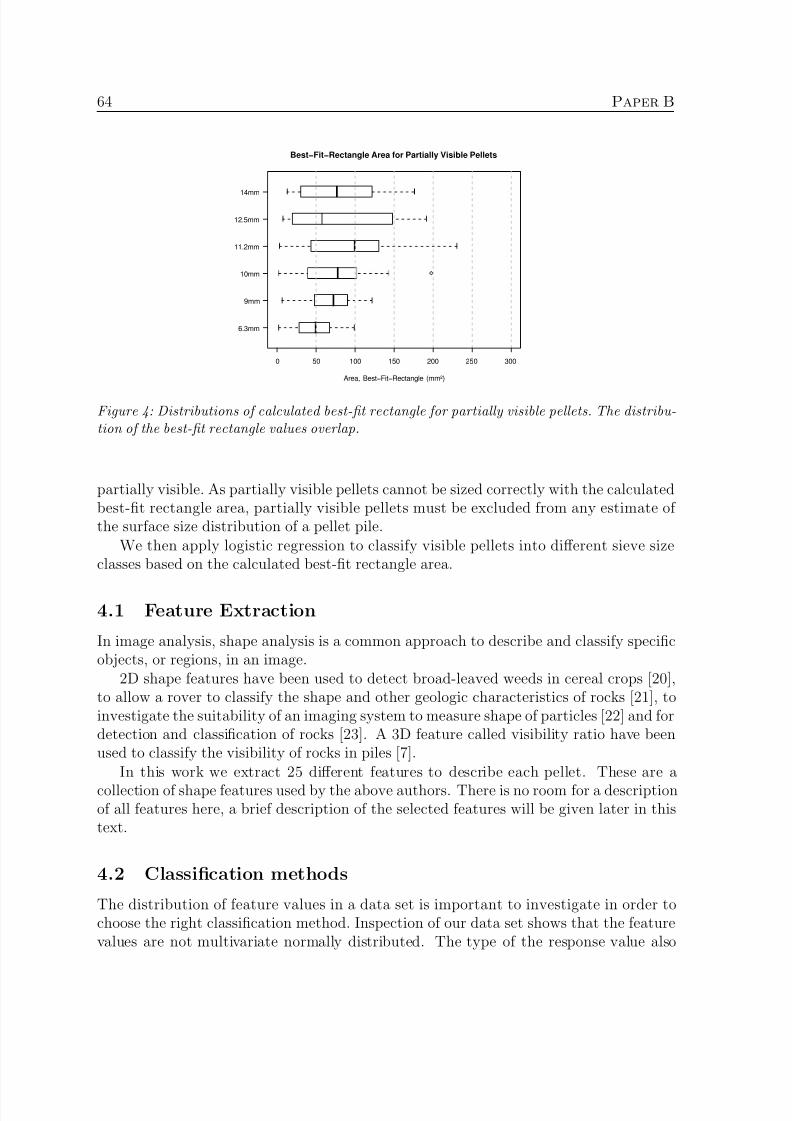
7/31/2019 Analysis of 3D Surface Data for on-line Determination of the Size Distribution of Iron Ore Pellet Piles on Conveyor …
http://slidepdf.com/reader/full/analysis-of-3d-surface-data-for-on-line-determination-of-the-size-distribution 78/130
64 Paper B
6.3mm
9mm
10mm
11.2mm
12.5mm
14mm
0 50 100 150 200 250 300
Best−Fit−Rectangle Area for Partially Visible Pellets
Area, Best−Fit−Rectangle (mm²)
Figure 4: Distributions of calculated best-t rectangle for partially visible pellets. The distribu-tion of the best-t rectangle values overlap.
partially visible. As partially visible pellets cannot be sized correctly with the calculatedbest-t rectangle area, partially visible pellets must be excluded from any estimate of the surface size distribution of a pellet pile.
We then apply logistic regression to classify visible pellets into different sieve sizeclasses based on the calculated best-t rectangle area.
4.1 Feature ExtractionIn image analysis, shape analysis is a common approach to describe and classify specicobjects, or regions, in an image.
2D shape features have been used to detect broad-leaved weeds in cereal crops [20],to allow a rover to classify the shape and other geologic characteristics of rocks [21], toinvestigate the suitability of an imaging system to measure shape of particles [22] and fordetection and classication of rocks [23]. A 3D feature called visibility ratio have beenused to classify the visibility of rocks in piles [7].
In this work we extract 25 different features to describe each pellet. These are acollection of shape features used by the above authors. There is no room for a descriptionof all features here, a brief description of the selected features will be given later in thistext.
4.2 Classication methodsThe distribution of feature values in a data set is important to investigate in order tochoose the right classication method. Inspection of our data set shows that the featurevalues are not multivariate normally distributed. The type of the response value also

7/31/2019 Analysis of 3D Surface Data for on-line Determination of the Size Distribution of Iron Ore Pellet Piles on Conveyor …
http://slidepdf.com/reader/full/analysis-of-3d-surface-data-for-on-line-determination-of-the-size-distribution 79/130
Paper B 65
need to be considered when classication method is chosen. The response variable’s typeis binary for the visibility classication as the visibility class of a pellet is either entirely
visible or partially visible. The response variable’s type for size classication is ordinalas a pellet’s size class range from sieve size 6.3 mm to 14 mm.Johnson [19] suggests to use logistic regression as a classication method when the
features values distribution are not multivariate normal. A rigorous description of logisticregression can be found in An Introduction to Generalized Linear Models [24].
Logistic regression can be used when the response variable are binary, ordinal ornominal. In the case when the response variable can only take two values, the methodis called binary logistic regression. The form of the logistic regression model is shown inequation 1 where y is the response variable, x is a feature vector, β 0 is a constant andβ 1 is a vector of parameters. P (y = 1 |x) denotes the probability that y = 1 given theobserved feature vector x . The model, or more specically, β 0 and β 1 is t to the knowndata via the use of maximum likelihood estimation.
P (y = 1 |x) =eβ 0 + β 1 x
1 + eβ 0 + β 1 x(1)
For response variables that have a natural order, the order can be used to form anexpression for the cumulative probability using ordinal logistic regression. In equation 2the cumulative probability is shown, where the possible response values is i = 1 , 2,...,J and J is the number of possible response values.
P (y ≤ i) =i
j =1P (y = j |x) = e
β 0 j + β x
1 + eβ 0 j + β x (2)
From equation 2 the probability for each category given a feature set is easily derivedknowing that P (y ≤J ) = 1.
Logically, the response of the classiers are y = j where P (y = j |x) > P (y = k|x)1for all k = j .
4.3 Feature SelectionAs stated before, 25 features are extracted to describe each pellet on the surface of thepile. Some features are strongly correlated and some do not contribute with informationthat can be used to discriminate between the two visibility classes. An important stepwhen designing a classier is to select a set of features that can be used to discriminatebetween desired classes efficiently. We use backward elimination to nd a set of featuresthat are statistically signicant for discriminating between different size classes of pellets.
Backward elimination of features is an iterative technique that includes all features inthe model as an initial step. The technique tests whether there are features in the modelthat are statistically insignicant and remove the least signicant one. It is importantto not remove multiple features in each iteration even though they are determined tobe statistically insignicant. Features may be insignicant in combination with other
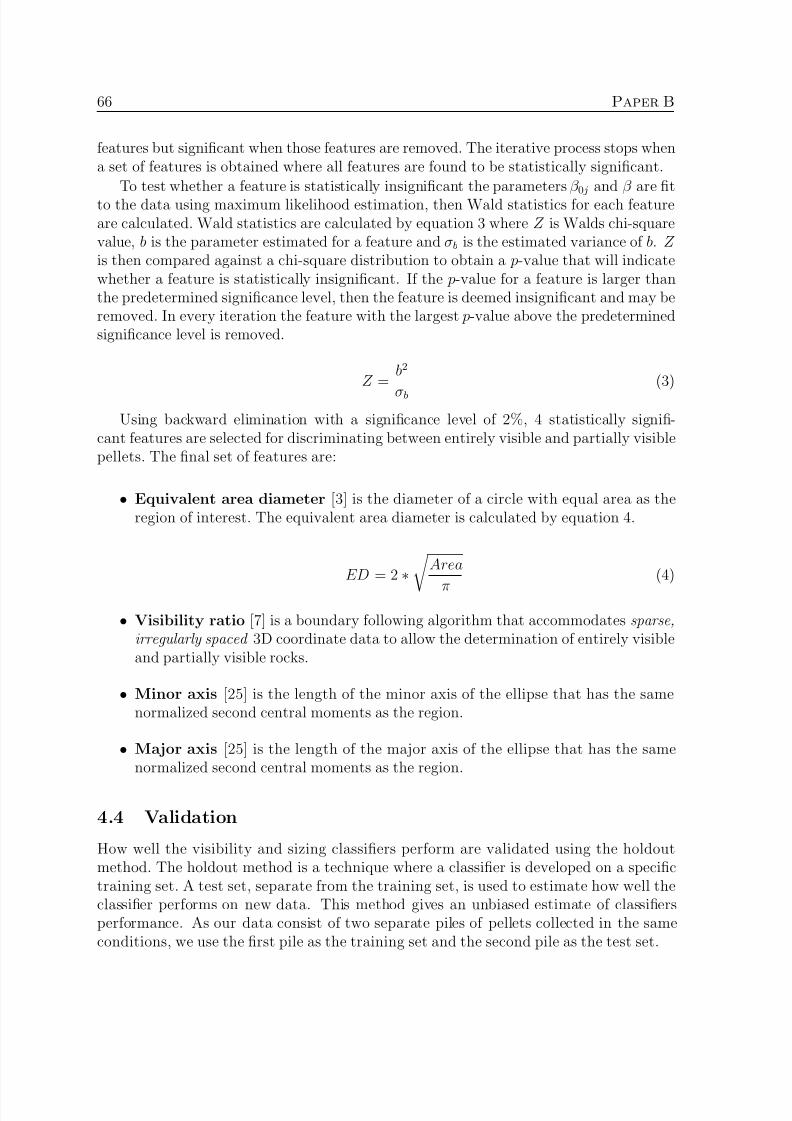
7/31/2019 Analysis of 3D Surface Data for on-line Determination of the Size Distribution of Iron Ore Pellet Piles on Conveyor …
http://slidepdf.com/reader/full/analysis-of-3d-surface-data-for-on-line-determination-of-the-size-distribution 80/130

7/31/2019 Analysis of 3D Surface Data for on-line Determination of the Size Distribution of Iron Ore Pellet Piles on Conveyor …
http://slidepdf.com/reader/full/analysis-of-3d-surface-data-for-on-line-determination-of-the-size-distribution 81/130
Paper B 67
Predicted
K
n o w n Entirely visible Partially visible
Entirely visible 89.7 10.3
Partially visible 3.87 96.13
Table 2.3: Confusion matrix that show how entirely visible and partially visible pellets in the second pile are classied.
Predicted size class (mm)
K n o w n s i z e c l a s s
(mm) 6.3 9 10 11.2 12.5 146.3 84.21 15.78 0 0 0 0
9 18.18 24.64 57.57 0 0 010 0 12.77 82.98 4.26 0 0
11.2 0 0 19.05 73.81 7.14 012.5 0 0 7.14 21.43 14.28 57.14
14 0 0 0 0 0 100
Table 2.4: Confusion matrix (percentages) that show the sizing classication results for entirely visible pellets. The table show how pellets of each size class is classied.
5 Validation of Visibility ClassicationIn table 2.3 a confusion matrix is presented for the visibility classication results of the
second pile. Binary logistic regression with a feature set composed by effective diameter,major axis, minor axis and visibility ratio is used. 89.7 % of the visible pellets and 96.13%of the partially visible pellets are classied correctly.
6 Overcoming Overlapped Particle ErrorTo show how the identication of partially visible pellets may overcome overlapped par-ticle error, ordinal logistic regression is used to classify each entirely visible pellet intoa sieve size class. Best-t rectangle area is used by itself to discriminate between thedifferent size classes.
The sizing classication results for the entirely visible pellets can be seen in table 2.4.The confusion matrix shows the classication accuracy for pellets of size class 6.3 mm,10 mm, 11.2 mm and 14 mm is above 73 %. The classication accuracy is low for thetwo size classes 9 mm and 12.5 mm. However, we note that pellets that are misclassiedare classied to a size class close to the known size class.
Even though perfect classication of pellet’s size class is not achieved, an estimate of the surface size distribution is achieved for the entirely visible pellets. In gure 5 knownand estimated surface size distribution is shown for the entirely visible pellets on thesurface of the pile. The dashed line, which is the estimated surface size distribution,follow the solid line, which is the known surface size distribution.

7/31/2019 Analysis of 3D Surface Data for on-line Determination of the Size Distribution of Iron Ore Pellet Piles on Conveyor …
http://slidepdf.com/reader/full/analysis-of-3d-surface-data-for-on-line-determination-of-the-size-distribution 82/130
68 Paper B
6.3 9 10 11.2 12 140
0.1
0.2
0.3
0.4
0.5
0.6
0.7
Figure 5: Known and estimated surface size distribution for the entirely visible pellets. The
solid line is the known and the dashed line is the estimated surface size distribution of entirely visible pellets.
7 ConclusionVisibility classication of pellets in a pile have been presented to overcome overlappedparticle error. Pellets were collected and manually sieved into different sieve size classes.The pellets were mixed in a pile and scanned with a 3D camera system. We dene twovisibility classes; entirely visible and partially visible. This is a signicant distinction as
partially visible pellet’s size cannot be correctly estimated with existing size measures andwould bias any size estimate. We overcome overlapped particle error by only estimatingthe surface size distribution with entirely visible pellets. Binary logistic regression is usedwith 4 optimal features to describe a pellet selected from a total of 25 features. Holdoutmethod is used to estimate the visibility classier’s accuracy to predict 89.7 % of theentirely visible and 96.13 % of the partially visible pellets correctly. It is shown that thesurface size distribution of the visible pellets can be estimated correctly using best-trectangle.
8 AcknowledgmentWe wish to thank the staff at ProcessIT Innovations for all their time and effort in makingthis research possible. We thank John Erik Larsson at MBV-systems for adjustmentsand development of the 3D surface imaging system. We thank Kjell-Ove Mickelssonat LKAB and Robert Johannson at SSAB for their invaluable industry knowledge andadvice. Finally, we thank Kerstin V¨annman at the department of Mathematics for herknowledge in statistics and generous assistance.

7/31/2019 Analysis of 3D Surface Data for on-line Determination of the Size Distribution of Iron Ore Pellet Piles on Conveyor …
http://slidepdf.com/reader/full/analysis-of-3d-surface-data-for-on-line-determination-of-the-size-distribution 83/130
References
[1] L. S. Okvist, A. Dahlstedt, and M. Hallin, “The effect on blast furnace process of changed pellet size as a result of segregation in raw material handling,” Ironmaking Conference Proceedings , pp. 167–178, 2001.
[2] M. J. Thurley, “On-line 3d surface measurement of iron ore green pellets,” in Proceed-ings of the International Conference on Computational Intelligence for Modelling,Control and Automation , IEEE, November 2006.
[3] W. Wang, F. Bergholm, and O. Stephansson, “Image analysis of fragment size andshape,” in Franklin and Katsabanis [26], pp. 233–243.
[4] A. Rosato, K. J. Strandburg, F. Prinz, and R. H. Swendsen, “Why the brazil nutsare on top: Size segregation of particulate matter by shaking,” Physical Review Letter , vol. 58, pp. 1038 – 1040, 1987.
[5] R. Chavez, N. Cheimanoff, and J. Schleifer, “Sampling problems during grain sizedistribution measurements,” Proceedings of the Fifth International Symposium on Rock Fragmentation by Blasting - FRAGBLAST 5 , pp. 245–252, Aug 1996.
[6] M. J. Thurley and K. C. Ng, “Modelling the relationship between the surface frag-ments and the pile size distribution in laboratory rock piles,” In submission .
[7] M. J. Thurley, Three Dimensional Data Analysis for the Separation and Sizing of Rock Piles in Mining . PhD thesis, Monash University, December 2002.
[8] M. Blomquist and A. Wernerson, “Range camera on conveyor belts: estimating sizedistribution and systematic errors due to occlusion,” Proceedings of the SPIE - The International Society for Optical Engineering , vol. 3835, pp. 118–126, Sept 1999.
[9] A. Bouajila, M. Bourassa, J.-A. Boivin, G. Ouellet, and T. I. Martinovic, “On-line non-intrusive measurement of greeen pellet diameter,” Ironmaking Conference Proceedings , pp. 1009–1020, 1998.
[10] T. Andersson, M. Thurley, and O. Marklund, “Pellet size estimation using spheri-cal tting,” Proceedings of the IEEE Instrumentation and Measurement Technology Conference , pp. 1–5, May 2007.
69

7/31/2019 Analysis of 3D Surface Data for on-line Determination of the Size Distribution of Iron Ore Pellet Piles on Conveyor …
http://slidepdf.com/reader/full/analysis-of-3d-surface-data-for-on-line-determination-of-the-size-distribution 84/130
70 References
[11] W. Wang and O. Stephansson, “Comparison between sieving and image analysis of aggregates,” in Franklin and Katsabanis [26], pp. 141–148.
[12] J. Fernlund, “The effect of particle form on sieve analysis: a test by image analysis,”Engineering Geology , vol. 50, pp. 111–124, 1998.
[13] M. Thurley and K. Ng, “Identifying, visualizing, and comparing regions in irregu-larly spaced 3d surface data,” Computer Vision and Image Understanding , vol. 98,pp. 239–270, February 2005.
[14] H. Kim, A. Rauch, and C. Haas, “Automated quality assessment of stone aggre-gates based on laser imaging and a neural network,” Journal of Computing in Civil Engineering , pp. 58–64, January 2004.
[15] J. Lee, M. Smith, L. Smith, and P. Midha, “A mathematical morphology approachto image based 3d particle shape analysis,” in Machine Vision and Applications ,vol. 16(5), pp. 282–288, Springer–Verlag, 2005.
[16] R. Ihaka and R. Gentleman, “R: A language for data analysis and graphics,” Jour-nal of Computational and Graphical Statistics , vol. 5, no. 3, pp. 299–314, 1996.http://www.r-project.org /.
[17] Wikipedia, “Box plot.” http://en.wikipedia.org/wiki/Boxplot, Jul 2007.
[18] R. O. Duda, P. E. Hart, and D. G. Stork, Pattern Classication . Wiley, second ed.,2001. ISBN 0-471-05669-3.
[19] D. E. Johnson, Applied Multivariate Methods for Data Analysts . Duxbury Press,1998. ISBN: 0-534-23796-7.
[20] A. Perez, F. Lopez, J. Benlloch, and S. Christensen, “Colour and shape analysistechniques for weed detection in cereal elds,” in Proceedings of 1st European Con- ference for Information Technology in Agriculture , Elsevier, February 2000.
[21] J. Fox, R. Cata no, and R. Anderson, “Onboard autonomous rock shape analysis formars rovers,” Proceedings of the IEEE Aerospace Conference , vol. 5, 2002.
[22] R. Carter and Y. Yan, “Measurement of particle shape using digital imaging tech-niques,” Journal of Physics: Conference Series , vol. 15, pp. 177–182, 2005.
[23] D. Thompson, S. Niekum, T. Smith, and D. Wettergreen, “Automatic detection andclassication of features of geologic interest,” Proceedings of the IEEE Aerospace Conference .
[24] A. J. Dobson, An introduction to generalized linear models . Chapman & Hall/CRC,2nd ed. ed., 2002. ISBN: 1-58488-165-8.

7/31/2019 Analysis of 3D Surface Data for on-line Determination of the Size Distribution of Iron Ore Pellet Piles on Conveyor …
http://slidepdf.com/reader/full/analysis-of-3d-surface-data-for-on-line-determination-of-the-size-distribution 85/130
References 71
[25] Matlab R , “Matlab image processing toolbox 5, users guide,” p. 560, 2007. Release2007a.
[26] J. Franklin and T. Katsabanis, eds., Measurement of Blast Fragmentation – Pro-ceedings of the FRAGBLAST 5 Workshop , Balkema, 1996.

7/31/2019 Analysis of 3D Surface Data for on-line Determination of the Size Distribution of Iron Ore Pellet Piles on Conveyor …
http://slidepdf.com/reader/full/analysis-of-3d-surface-data-for-on-line-determination-of-the-size-distribution 86/130
72

7/31/2019 Analysis of 3D Surface Data for on-line Determination of the Size Distribution of Iron Ore Pellet Piles on Conveyor …
http://slidepdf.com/reader/full/analysis-of-3d-surface-data-for-on-line-determination-of-the-size-distribution 87/130
Paper C
Sieve Size Estimation of Iron OreGreen Pellets with Multiple
Features Selected Using OrdinalLogistic Regression
Authors:Tobias Andersson, Matthew J. Thurley
Reformatted version of paper submitted for publication in:Powder Technology Journal
73

7/31/2019 Analysis of 3D Surface Data for on-line Determination of the Size Distribution of Iron Ore Pellet Piles on Conveyor …
http://slidepdf.com/reader/full/analysis-of-3d-surface-data-for-on-line-determination-of-the-size-distribution 88/130
74 Paper C

7/31/2019 Analysis of 3D Surface Data for on-line Determination of the Size Distribution of Iron Ore Pellet Piles on Conveyor …
http://slidepdf.com/reader/full/analysis-of-3d-surface-data-for-on-line-determination-of-the-size-distribution 89/130
Sieve Size Estimation of Iron Ore Green Pellets withMultiple Features Selected Using Ordinal Logistic
Regression
Tobias Andersson and Matthew J. Thurley
Abstract
Size measurement of pellets in industry is usually performed by manual sampling andsieving techniques. Automatic on-line analysis of pellet size based on image analysistechniques would allow non-invasive, frequent and consistent measurement. We evaluatecommonly used size and shape measurement methods and combine these to achieve betterestimation of pellet size. Literature review indicates that other image analysis techniquesfail to perform this analysis and use a simple selection of sizing method without evaluatingtheir statistical signicance. Backward elimination and forward selection of features isused to select two feature sets that are statistically signicant for discriminating betweendifferent sieve size classes of pellets. The diameter of a circle of equivalent area is shown tobe the most effective feature based on the forward selection strategy, but an unexpected5 feature classier is the result using the backward elimination strategy. Size estimatesof the surface of a pellet pile using the two feature sets show that the estimated sievesize distribution follows the known sieve size distribution.
1 IntroductionIron ore pellet’s sizes are critical to the efficiency of the blast furnace process in theproduction of steel. Overly coarse pellets effect the blast furnace process negatively,however this effect can be minimized by operating the furnace with different parameters[1]. An on-line system for measurement of pellet sizes wold improve productivity throughfast feedback and efficient control of the blast furnace.
In pellet manufacturing, manual sampling followed by sieving with a square mesh isused for quality control. The manual sampling is performed infrequently and is time-consuming. Fast feedback of pellets sizes is desirable.
Thurley et al. [2] present an industrial prototype 3D imaging and analysis systemthat measures the pellet sieve size distribution into 9 sieve size classes between 5 mm and16+ mm. The system is installed and operational in a pellet production plant capturingand analyzing 3D surface data of piled pellets on the conveyor belt. Segmentation of thedata is achieved with algorithms based on mathematical morphology for sparse, irregular3D surface data. It is also shown that sizing of identied pellets gives promising resultsusing the best-t rectangle [3] measure.
75
7/31/2019 Analysis of 3D Surface Data for on-line Determination of the Size Distribution of Iron Ore Pellet Piles on Conveyor …
http://slidepdf.com/reader/full/analysis-of-3d-surface-data-for-on-line-determination-of-the-size-distribution 90/130
76 Paper C
Image analysis techniques promise a quick, inexpensive and non-contact solution todetermining the size distribution of a pellet pile. Such techniques capture information of
the surface of the pellet pile which is then used to infer the pile size distribution.However, there are a number of sources of error relevant to surface analysis techniquesas follows;
• Segregation and grouping error, more generally known as the brazil nut effect [4],describes the tendency of the pile to separate into groups of similarly sized particles.It is caused by vibration or motion (for example as rocks are transported by truckor conveyor) with large particles being moved to the surface.
• Capturing error [5, 6], describes the varying probability based on size, that a particlewill appear on the surface of the pile.
• Prole error, describes the fact that only one side of an entirely visible particle canbe seen making it difficult to estimate the particles size.
• Overlapped particle error, describes the fact that many particles are only partiallyvisible and a large bias to the smaller size classes results if they are treated as smallentirely visible particles and sized using only their visible prole.
We eliminate both segregation and capturing error from the presented study by com-paring the results against the actual pellets on the surface and not the overall pile sizedistribution. We have previously shown that visibility classication can overcome over-lapped particle error [7] and in this research we eliminate overlapped particle error by
ignoring the partially visible pellets. In this research we evaluate what commonly usedsize and shape measurements are most efficient at determining an accurate sieve size,and therefore reduce prole error.
Work has been published on size estimation of iron ore pellets that assumes pelletsare spherical [8, 9]. However, we have previously shown that spherical tting is a poormeasure of pellet size [10]. More work have been presented on size and shape analysisof rock fragments, and we extend our literature review to include presented work inthat eld. Comparison of manual sampling and estimates of rock fragment’s size using2D imaging analysis has been published [11, 12, 13, 14]. It is reported by Wang andStephansson [14] that ”a systematic error compared to sieving analysis” is found. Further,
a comparison of six commonly used particle size and shape measurements is published byWang [3] that show how best-t rectangle is more useful than traditional measurements.3D surface measurement of rocks has been applied to segmentation where rocks had littleor no overlap [15], or to shape measurements of individual rock fragments [16], or to rockfragments that lay in piles [17, 18]. Kim [15] use a volumetric measurement method tograde fragments into different size classes and Thurley [17, 18] use the best-t rectangleas measurement method to categorize fragments into different size classes. With theexception of Al-Thybat et. al. [11, 12], previously published work have only used onesingle measurement when categorizing fragments into different size classes. Al-Thybat et.al. measure two parameters from 2D images and construct a joint conditional probabilityfunction to accurately determine fragments size.

7/31/2019 Analysis of 3D Surface Data for on-line Determination of the Size Distribution of Iron Ore Pellet Piles on Conveyor …
http://slidepdf.com/reader/full/analysis-of-3d-surface-data-for-on-line-determination-of-the-size-distribution 91/130
Paper C 77
Figure 1: Close up of the rst set of pellets captured by 3D imaging system viewed from above.The data is comprised of sparse irregularly spaced 3D coordinate points with overlayed color information.
In the presented research, different size and shape measurement method’s signicanceto pellet’s size are evaluated. Backward elimination and forward selection of features is
used to obtain two different feature sets that are used to classify each pellet into a sievesize class. Finally, size estimates of the surface of a pellet pile is compared with theknown sieve size distribution of the pellet pile.
2 Sample of Pellet PileMechanical sieving is the accepted industry technique for sizing pellets. A sample of baked iron ore pellets was sieved into 6 size gradings. Each sieve size class was paintedand color coded to allow manual identication of pellet sizes in mixed pellet piles. Thesample was divided into two separate sets. The rst set will be used for evaluation of sizeand shape measurement method’s signicance to pellet’s size. Also, the rst set will beused to develop algorithms for size classication. The second set will be held out duringdevelopment of the size classiers. Thus, the second set will only be used to validate theclassiers performance.
The two sets were loaded onto a laboratory conveyor belt and the stream of pelletswas scanned with a 3D imaging system based on laser triangulation. An additional colorcamera is used to collect color information to overlay on the 3D surface data. A portionof the collected data for the rst set of pellets is shown in gure 1.
To overcome overlapped particle error, we dene the two visibility classes; entirelyvisible and partially visible. A pellets visibility depend on how much of a pellet is visible

7/31/2019 Analysis of 3D Surface Data for on-line Determination of the Size Distribution of Iron Ore Pellet Piles on Conveyor …
http://slidepdf.com/reader/full/analysis-of-3d-surface-data-for-on-line-determination-of-the-size-distribution 92/130
78 Paper C
Paint color ∗ Size † All Entirely visible% # % #
Orange 6.3 15.70 132 11.64 34Pink 9 16.39 138 18.84 55Grey 10 40.50 341 41.44 121Red 11.2 21.28 179 20.21 59Yellow 12.5 4.04 34 5.48 16Green 14 2.02 17 2.40 7
∗Sieve class color.
† The lower bound of each sieve size in-crement (mm)Size distribution of all pellets on thesurfaceSize distribution of only entirely visiblepellets on the surface
Table 3.1: Known size distribution of pellets on the surface for rst set. Size distributions of all pellets and only visible pellets are shown.
Paint color ∗ Size † All Entirely visible% # % #
Orange 6.3 15.24 121 11.63 35Pink 9 16.62 132 15.95 48Grey 10 41.18 327 45.18 136Red 11.2 17.76 141 19.27 58Yellow 12.5 6.55 52 6.31 19
Green 142.64
211.66
5∗Sieve class color.
† The lower bound of each sieve size in-crement (mm)Size distribution of all pellets on thesurfaceSize distribution of only entirely visiblepellets on the surface
Table 3.2: Known size distribution of pellets on the surface for second set. Size distributions of all pellets and visible pellets are shown.
when viewed from above.The two sets were manually interrogated to specify each pellet’s size and visibility
class. The rst set has a total number of 842 pellets on the surface of the pile. 292 pelletsare labelled as entirely visible and the remaining 549 pellets are partially visible. Thesieve size distribution of the pellet pile surface and of entirely visible pellets on the surfacefor the rst set is shown in table 3.1. The second set has a total number of 794 pelletson the surface of the pile. 301 pellets are labelled as entirely visible and the remaining493 pellets are partially visible. The sieve size distribution of the complete surface andof the entirely visible pellets on the surface for the second set is shown in table 3.2.

7/31/2019 Analysis of 3D Surface Data for on-line Determination of the Size Distribution of Iron Ore Pellet Piles on Conveyor …
http://slidepdf.com/reader/full/analysis-of-3d-surface-data-for-on-line-determination-of-the-size-distribution 93/130
Paper C 79
3 Size and Shape Measurement Methods
Wang [3] compares six measurement methods; chord-sizing, Feret-box, maximum di-ameter, equivalent circle, equivalent area ellipse and multiple Feret-box. The multipleFeret-box is further improved by Wang to be the best-t rectangle. It is concluded thatthe best-t rectangle is more reasonable and useful than the traditional measurements.
In the presented research we use a total number of 16 different measures of a particle’ssize and shape, derived from 5 measurement methods. The 5 measurement methodsinclude 4 of the compared measurement methods by Wang. We exclude the chord-sizingmeasurement method as it is less efficient than the simple Feret-box. The multipleFeret-box is also omitted as the best-t rectangle is shown by Wang to be an improvedmultiple Feret-box. In addition, we also include the non-perpendicular axes method inthis analysis. The 5 measurement methods are depicted in gure 2 and a description of the methods are given here:
3.1 Feret-box
The Feret-box is calculated by nding the maximum and minimum value of the particlesx or y values. The four measures; length, width, diagonal of the rectangle (maximumlength) and area of the rectangle are extracted from the Feret-box.
3.2 Best-t rectangle
The best-t rectangle is dened to be the rectangle with least area that ts around theregion of interest at any rotation. We calculate the best-t rectangle by simply determinethe area of a rectangle that ts around the region for every 1 degree rotation and nd therectangle with the least area. Seven measures are extracted from the best-t rectangleto describe the size and shape of the particle. The following measures are extracted;length, width, diagonal, area, angle (orientation), elongation (length divided by width)and rectangularity (area divided by particle area).
3.3 Equivalent area circle
Equivalent area circle is the circle with the same area as the particle. The diameter of the equivalent area circle describe the size of the particle.
3.4 Equivalent area ellipse
Equivalent area ellipse is the ellipse that has the same area and orientation as the particle,where the center of the ellipse equal the center of the particle. To describe the sizeand shape of the particle of interest, the major and minor axes are extracted from theequivalent ellipse.

7/31/2019 Analysis of 3D Surface Data for on-line Determination of the Size Distribution of Iron Ore Pellet Piles on Conveyor …
http://slidepdf.com/reader/full/analysis-of-3d-surface-data-for-on-line-determination-of-the-size-distribution 94/130
80 Paper C
0 10 20 30 40 50 60 70 80
10
20
30
40
50
60
70
(a) XY-projection of a pellet
0 10 20 30 40 50 60 70 80
10
20
30
40
50
60
70
(b) Feret-box
0 10 20 30 40 50 60 70 80
10
20
30
40
50
60
70
(c) Best-t rectangle0 10 20 30 40 50 60 70 80
10
20
30
40
50
60
70
(d) Equivalent area diameter
0 10 20 30 40 50 60 70 80
10
20
30
40
50
60
70
(e) Equivalent area ellipse0 10 20 30 40 50 60 70 80
10
20
30
40
50
60
70
(f) Non-perpendicular axes
Figure 2: Figures that show the different size and shape measurement methods. The pellet region is depicted by white color. The different measurement methods are depicted with grey color.

7/31/2019 Analysis of 3D Surface Data for on-line Determination of the Size Distribution of Iron Ore Pellet Piles on Conveyor …
http://slidepdf.com/reader/full/analysis-of-3d-surface-data-for-on-line-determination-of-the-size-distribution 95/130
Paper C 81
3.5 Non-perpendicular axesThe non-perpendicular axes is dened to be the longest and shortest radius of a particlethat intersects with the center of the particle. The two measures; longest (major) andshortest (minor) are used to describe the size and shape of the particle of interest.
4 Sieve Size ClassicationGenerally all classiers try to predict a response , here denoted y, from a set of feature values , here denoted x . The response is the predicted size of a pellet given a selectedset of the above mentioned measures of pellet’s size and shape. Detailed description of classication can be found in the books [19] and [20].
The distribution of feature values in a data set is important to investigate in order tochoose the right classication method. Inspection of our data set shows that the featurevalues are not multivariate normally distributed. The type of the response value alsoneed to be considered when classication method is chosen. The response variable’s typefor size classication is ordinal as there are 6 size classes of pellets that range from sievesize 6.3 mm to 14 mm.
Johnson [20] suggests to use logistic regression as a classication method when thefeatures values distribution are not multivariate normal. A rigorous description of logisticregression can be found in An Introduction to Generalized Linear Models [21].
In this research, we evaluate different size and shape measurements signicance to
pellet’s size by backward elimination and forward selection of features during the devel-opment of a size classier based on ordinal logistic regression.
4.1 Ordinal Logistic RegressionLogistic regression can be used when the response variable are binary, ordinal or nominal.For response variables that have a natural order, the order can be used to form anexpression for the cumulative probability using ordinal logistic regression.
The form of the ordinal logistic regression model is shown in equation 1 where y isthe response variable, x is a feature vector, β 0i is a parameter that depends on i, and β
is a vector of parameters that is constant for all i. To clarify, y is the response variablethat the classier predicts. In our case the response variable is the size class of the pellet.We have 6 different size classes that the classier tries to predict. The classier predictsa size class based on the feature values in feature vector x , which may be composedby different shape and size measurements of pellets. The classier is trained to classifycorrectly by tting the model, or more specically, the parameters in β 0i and β via theuse of maximum likelihood estimation to a training set with known response values andfeature values.
P (y
≤i
|x) =
eβ 0 i + β x
1 + eβ 0 i + β x
(1)

7/31/2019 Analysis of 3D Surface Data for on-line Determination of the Size Distribution of Iron Ore Pellet Piles on Conveyor …
http://slidepdf.com/reader/full/analysis-of-3d-surface-data-for-on-line-determination-of-the-size-distribution 96/130
82 Paper C
In equation 1 the cumulative probability is shown, where the possible response valuesis i = 1 , 2,...,J −1 and J is the number of possible response values. P (y ≤ i|x) denotes
the probability that y ≤ i given the observed feature vector x . The probability for eachsize class given a feature vector x is easily derived knowing that P (y ≤ J ) = 1. Finally,the predicted response of the classier is the size class with highest probability. That isthe response of the classiers are y = k where P (y = k|x) > P (y = l|x) for all l = k.
4.2 Feature’s signicance to pellet’s sizeAs stated before, 16 features are extracted to describe each visible pellet on the surface of the pile. Some features are strongly correlated and some do not contribute with informa-tion that can be used to discriminate between different size classes. An important stepwhen designing a classier is to select a set of features that can be used to discriminatebetween desired classes efficiently.
4.2.1 Backward elimination
Backward elimination of features that are statistically insignicant for discriminatingbetween different size classes of pellets is suggested by Johnson [20] when the number of features is less than 16. As the number of features is close to this value Johnson suggestswe proceed with this process. Backward elimination of features is an iterative techniquethat includes all features in the model as an initial step. The technique tests whetherthere are features in the model that are statistically insignicant and remove the least
signicant one. It is important to not remove multiple features in each iteration eventhough they are determined to be statistically insignicant. Features may be insignicantin combination with other features but signicant when those features are removed. Theiterative process stops when a set of features is obtained where all features are found tobe statistically signicant.
To test whether a feature is statistically insignicant the parameters β 0 j and β are tto the data using maximum likelihood estimation, then Wald statistics are calculated foreach feature. Wald statistics are calculated by equation 2 where Z is Walds chi-squarevalue, b is the parameter estimated for a feature and σb is the estimated variance of b. Z is then compared against a chi-square distribution to obtain a p-value that will indicatewhether a feature is statistically insignicant. If the p-value for a feature is larger thanthe predetermined signicance level, then the feature is deemed insignicant and may beremoved. In every iteration the feature with the largest p-value above the predeterminedsignicance level is removed.
Z =b2
σb(2)
In table 3.3 corresponding p-value for the Wald statistic of each feature in the back-ward elimination process is shown. Each column is an iteration in the elimination processand the feature with the highest p-value is highlighted with bold fonts. The feature withthe highest p-value is said to be statistically insignicant and this indicates that the size

7/31/2019 Analysis of 3D Surface Data for on-line Determination of the Size Distribution of Iron Ore Pellet Piles on Conveyor …
http://slidepdf.com/reader/full/analysis-of-3d-surface-data-for-on-line-determination-of-the-size-distribution 97/130
Paper C 83
does not depend on the particular feature. Thus, the feature with the highest p-valueis removed from the model. With a signicance level of 0.02 a nal set of 5 features is
composed. The selected features are length, width and diagonal of the Feret-box andmajor and minor axis of the equivalent area ellipse.
4.2.2 Forward Selection
An alternative to backward elimination of statistically insignicant features is forwardselection of features that are statistically signicant. Forward selection is a procedurethat, in contrast to backward elimination, begins with an empty model. The forwardselection procedure begins by testing if any feature is statistically signicant to add to themodel. If some features are statistically signicant, the feature that is most signicant isadded to the model. It is important that only one feature is added to the model at eachstep in the forward selection procedure. In the next iteration all remaining features aretested for inclusion to the model. The procedure stops when no new features meet thecriteria of inclusion in the model.
To test whether a feature is statistical signicant, it is recommended to use the likeli-hood ratio test. The likelihood ratio test is used to compare the goodness-of-t betweennested models. That is, to test a simpler model against a more complex model. Thelikelihood ratio statistic is calculated by equation 3, where L0 and L1 is the maximizedvalue of the log-likelihood function for the full model and the reduced model.
LR = −2(L0 −L1) (3)
The sampling distribution of the likelihood ratio statistic is approximately a chi-squaredistribution. The degrees of freedom of the distribution are equal to the difference inthe number of parameters between the two models. In a forward selection procedure forordinal logistic regression the degrees of freedom of the chi-square distribution is equalto 1 when LR is considered between consecutive steps. The chi-square distribution withone degree of freedom at a signicance level of 0.02 equal to 5.4119. This result in thatthe LR between two models have to be larger than 5.4119 for a feature to be determinedstatistically signicant and included in the model.
The results of the forward selection can be seen in table 3.4. Is is interesting to notethat in the rst step, all features except the angle of the best-t rectangle is statistically
signicant ( LR ≥5.4119). However, the diameter of the equivalent area circle stands outto be most effective for discrimination between size classes of pellets. It is worth notingthat the area of the best-t rectangle is the second best feature. In the second step of theprocedure no further features should be added as any improvement of additional featuresare statistically insignicant ( LR < 5.4119). This result shows that the diameter of theequivalent area circle is the most effective feature for size determination of pellets.
4.2.3 Comments to the two selected feature sets
The two different feature selection procedures result in completely different feature sets.By use of forward selection a feature set is selected that comprises only of the diameter

7/31/2019 Analysis of 3D Surface Data for on-line Determination of the Size Distribution of Iron Ore Pellet Piles on Conveyor …
http://slidepdf.com/reader/full/analysis-of-3d-surface-data-for-on-line-determination-of-the-size-distribution 98/130
84 Paper C
p - v a l u e
f o r e a c h i t e r a t i o n
F e a t u r e
1
2
3
4
5
6
7
8
9
1 0
1 1
1 2
F e r e t l e n g t h
0 . 0 8 3
0 . 0 8 3
0 . 0 0 0
0 . 0 0 0
0 . 0 0 0
0 . 0 0 0
0 . 0 0 0
0 . 0 0 0
0 . 0 0 0
0 . 0 0 0
0 . 0 0 2
0 . 0 1 7
F e r e t w i d t h
0 . 0 7 6
0 . 0 7 6
0 . 0 0 0
0 . 0 0 0
0 . 0 0 0
0 . 0 0 0
0 . 0 0 0
0 . 0 0 0
0 . 0 0 0
0 . 0 0 0
0 . 0 0 2
0 . 0 1 5
F e r e t m a x i m u m l e n g t h
0 . 8 3 0
0 . 0 0 5
0 . 0 0 0
0 . 0 0 0
0 . 0 0 0
0 . 0 0 0
0 . 0 0 0
0 . 0 0 0
0 . 0 0 0
0 . 0 0 0
0 . 0 0 1
0 . 0 1 4
F e r e t a r e a
0 . 0 0 5
0 . 8
2 4
B F R l e n g t h
0 . 3 5 8
0 . 3 5 9
0 . 1 9 0
0 . 2 0 2
0 . 2 0 7
0 . 2 9 0
0 . 2 3 1
0 . 0 9 9
0 . 0
9 8
B F R w i d t h
0 . 4 5 5
0 . 4 5 6
0 . 2 0 4
0 . 2 2 0
0 . 2 2 2
0 . 2 5 0
0 . 1 9 6
0 . 0 6 8
0 . 0 6 8
0 . 0
7 2
B F R m a x i m u m l e n g t h
0 . 1 5 3
0 . 1 5 3
0 . 0 9 4
0 . 1 0 0
0 . 1 0 0
0 . 1 3 2
0 . 1 0 1
0 . 0 5 7
0 . 0 5 9
0 . 0 1 0
0 . 0
3 8
B F R a r e a
0 . 6 1 8
0 . 6 1 3
0 . 3 9 0
0 . 3 6 9
0 . 3 6 6
0 . 3 6 0
0 . 3
9 7
B F R a n g l e
0 . 2 7 6
0 . 2 7 2
0 . 2 7 4
0 . 2 6 4
0 . 2 6 5
0 . 2 5 0
0 . 2 2 3
0 . 2
4 5
B F R e l o n g a t i o n
0 . 4 6 2
0 . 4 6 3
0 . 4 7 5
0 . 4 4 2
0 . 4
6 3
B F R r e c t a n g u l a r i t y
0 . 7 3 9
0 . 7 3 9
0 . 7
3 1
E q u i v a l e n t d i a m e t e r
0 . 6 2 9
0 . 5 9 2
0 . 6 0 5
0 . 4 0 6
0 . 3 4 3
0 . 3
7 2
M a j o r
( e l l i p s e )
0 . 2 3 0
0 . 1 5 5
0 . 1 6 0
0 . 0 8 0
0 . 0 4 2
0 . 0 4 6
0 . 0 0 0
0 . 0 0 1
0 . 0 0 1
0 . 0 0 2
0 . 0 0 0
0 . 0 0 0
M i n o r ( e l l i p s e )
0 . 1 0 6
0 . 0 7 7
0 . 0 7 9
0 . 0 4 0
0 . 0 3 0
0 . 0 3 2
0 . 0 0 0
0 . 0 0 0
0 . 0 0 0
0 . 0 0 0
0 . 0 0 0
0 . 0 0 0
M a j o r
0 . 6 5 2
0 . 6 5 5
0 . 6 3 8 0
. 6 4 8
M i n o r
0 . 9
4 3
Table 3.3: Backward elimination of features to remove statistically insignicant features. p -values are shown for features in each iteration. A signicance level of 0.02 is used.

7/31/2019 Analysis of 3D Surface Data for on-line Determination of the Size Distribution of Iron Ore Pellet Piles on Conveyor …
http://slidepdf.com/reader/full/analysis-of-3d-surface-data-for-on-line-determination-of-the-size-distribution 99/130
Paper C 85
Feature Step 1 Step 2LR p∗ LR p∗Feret length 247.124 0 0.456 0.4995
Feret width 249.746 0 0.004 0.9496Feret maximum length 341.726 0 0.964 0.3262
Feret area 347.392 0 0.352 0.5530BFR length 286.624 0 0.224 0.6360BFR width 342.642 0 0.322 0.5704
BFR maximum length 375.940 0 0.034 0.8537BFR area 378.200 0 0.026 0.8719BFR angle 0.332 0.5645 0.952 0.3292
BFR elongation 5.494 0.0191 0.184 0.6680BFR rectangularity 8.5260 0.0035 2.178 0.1400Equivalent diameter 408.748 0
Major (ellipse) 302.516 0 0.160 0.3460
Minor (ellipse) 349.806 0 1.340 0.2470Major 292.478 0 1.064 0.3023Minor 306.776 0 0 1
∗Features signicance
Table 3.4: Forward selection of features. A signicance level of 0.02 is used for inclusion of new features to the model.
of the equivalent area circle. An unexpected feature set is selected using the backwardelimination procedure where 5 features from the two size and shape measurement methods
Feret-box and equivalent area ellipse.It is surprising that the 3 measures length, width and diagonal of the Feret-box areselected. Wang [3] argue that the best-t rectangle is a more useful than the Feret-box.Intuitively, this makes sense because the Feret-box has xed orientation and particles inimages cannot be expected to orientated in a certain direction. However, the imaginingsystem use a projected laser line with camera triangulation to capture 3D surface data,which results in some occlusion at a xed orientation for all imaged pellets. In ourapplication, the occlusion will be present at one side of the pellet along the y-axis. Wehypothesize, that property of the 3D data, provides an orientational bias that favors theFeret-box measurement.
Finally, the diameter of the equivalent area circle stands out as the most effectivefeature and the area of the best-t rectangle is the second best feature when a singlefeature is selected. Our initial belief was that a combination of features would improveclassication accuracy. However, for sizing of pellets no additional features are selectedusing the forward selection strategy.
4.3 ValidationHow well the sizing classier performs is validated using the holdout method. The holdoutmethod is a technique where the classier is developed on a specic training set. A testset, separate from the training set, is used to estimate how the classier performs on new

7/31/2019 Analysis of 3D Surface Data for on-line Determination of the Size Distribution of Iron Ore Pellet Piles on Conveyor …
http://slidepdf.com/reader/full/analysis-of-3d-surface-data-for-on-line-determination-of-the-size-distribution 100/130
86 Paper C
Predicted size class6.3 9 10 11.2 12.5 14
K n o w n s i z e c l a s s
6.3 85.71 (30) 8.57(3) 5.71(2) 0 0 09 10.42(4) 35.42 (17) 54.17(26) 0 0 0
10 2.21(3) 8.09(11) 85.29 (116) 4.41(6) 0 011.2 0 0 22.41(13) 68.97 (40) 8.62(5) 012.5 0 0 0 26.32(5) 31.58 (6) 42.11(8)
14 0 0 0 20(1) 0 80 (4)
Table 3.5: Confusion matrix that show how pellets of each size class is classied with the feature set selected with backward elimination is used. The 5 features are length, width and maximum length of the Feret-box and major and minor axis of the equivalent ellipse. The gures is the percentage of a known size class classied as a specic size class. The gures in brackets is the number of pellets of a known size class classied as a specic size class.
data. This method gives an unbiased estimate of classiers performance. As our dataconsist of two separate piles of pellets collected in the same conditions, we use the rstpile as the training set and the second pile as the test set.
The sizing classication results for the entirely visible pellets is shown by the useof confusion matrices. This is to allow the reader to see the classication accuracy foreach size class. In a confusion matrix the known class is shown in the left column. Thepercentage and the number of correct and misclassied pellets is presented at each row inthe table. For comparison, the confusion matrices of the classiers with the features sets
selected by backward elimination is shown in table 3.5 and by forward selecion in table3.6. The confusion matrices shows that the classication accuracies for the two differentfeature sets are close in performance. Size classes 6.3 mm, 10 mm, 11.2 mm and 14 mmare classied correctly at more then 68 % accuracy. The classication accuracy is lowerfor the two size classes 9 mm and 12.5 mm. However, we note that a majority of pelletsthat are misclassied are classied to a size class close to the known size class.
An estimate of the surface size distribution is achieved for the entirely visible pelletsfor the two selected feature sets. In gure 3 the known and estimated surface size distri-bution are shown for the entirely visible pellets on the surface of the pile. The dashed line,is the estimated surface size distribution, follows the solid line, which is the known sur-face size distribution. It is clear that the estimated size distribution for the two differentfeature sets are similar. The estimated size distribution follow the known size distribu-tion, with the most signicant deviations for size class 9 mm that is underestimated andsize class 10 mm that is overestimated.
5 ConclusionsSize estimation of entirely visible iron ore pellets in a pile has been presented. Pellets werecollected and manually sieved into different sieve size classes. The pellets were mixedin a pile and scanned with a 3D camera system. We use ordinal logistic regression to

7/31/2019 Analysis of 3D Surface Data for on-line Determination of the Size Distribution of Iron Ore Pellet Piles on Conveyor …
http://slidepdf.com/reader/full/analysis-of-3d-surface-data-for-on-line-determination-of-the-size-distribution 101/130
Paper C 87
Predicted size class6.3 9 10 11.2 12.5 14
K n o w n s i z e c l a s s
6.3 85.71 (30) 11.42(4) 2.85(1) 0 0 09 8.33(4) 33.33 (16) 58.22(28) 0 0 0
10 1.47(2) 8.09(11) 85.29 (116) 5.14(7) 0 011.2 0 0 20.69(12) 70.69 (41) 8.62(5) 012.5 0 0 5.26(1) 15.79(3) 36.84 (7) 42.10(8)
14 0 0 0 20(1) 20(1) 60 (3)
Table 3.6: Confusion matrix that show how pellets of each size class is classied with the feature set selected with forward selection is used. The only feature selected is the diameter of the equivalent area circle. The gures is the percentage of a known size class classied as a specic size class. The gures in brackets is the number of pellets of a known size class classied as a specic size class.
6.3 9 10 11.2 12 140
0.1
0.2
0.3
0.4
0.5
0.6
0.7
(a) Backward elimination6.3 9 10 11.2 12 140
0.1
0.2
0.3
0.4
0.5
0.6
0.7
(b) Forward selection
Figure 3: Known and estimated surface size distribution for the entirely visible pellets when different feature selection procedures is used. The solid line is the known and the dashed line is the estimated surface size distribution of entirely visible pellets.
estimate pellet’s size. The advantage by using ordinal logistic regression is that multiplefeatures may be used to achieve a higher classication accuracy when sizing pellets. Also,evaluation of commonly used size and shape measurement methods may be conductedwith feature selection procedures. Backward elimination and forward selection proceduresare used that result in two different feature sets that efficiently discriminate betweenthe size classes of pellets. An unexpected feature set composing 3 measures from thesimple Feret-box and 2 measures of the equivalent area ellipse is selected using backwardelimination. The feature set determined using forward selection is comprised only of thediameter of the equivalent area circle. Best-t rectangle is shown to be the second bestfeature if used alone. Both feature sets give similar results, where the estimated sieve

7/31/2019 Analysis of 3D Surface Data for on-line Determination of the Size Distribution of Iron Ore Pellet Piles on Conveyor …
http://slidepdf.com/reader/full/analysis-of-3d-surface-data-for-on-line-determination-of-the-size-distribution 102/130
88 Paper C
size distribution follow the known sieve size distribution.The approach of combining features that are efficient to discriminate between different
size classes of pellets may be useful to improve size determination of rocks. We expectto apply these techniques to rocks in the near future.
6 AcknowledgmentWe wish to thank the staff at ProcessIT Innovations for all their time and effort in makingthis research possible. We thank John Erik Larsson at MBV-systems for adjustmentsand development of the 3D surface imaging system. We thank Kjell-Ove Mickelssonat LKAB and Robert Johannson at SSAB for their invaluable industry knowledge andadvice. Finally, we thank Kerstin V¨annman at the department of Mathematics for her
knowledge in statistics and generous assistance.
7/31/2019 Analysis of 3D Surface Data for on-line Determination of the Size Distribution of Iron Ore Pellet Piles on Conveyor …
http://slidepdf.com/reader/full/analysis-of-3d-surface-data-for-on-line-determination-of-the-size-distribution 103/130
References
[1] L. S. Okvist, A. Dahlstedt, and M. Hallin, “The effect on blast furnace process of changed pellet size as a result of segregation in raw material handling,” Ironmaking Conference Proceedings , pp. 167–178, 2001.
[2] M. J. Thurley and T. Andersson, “An industrial 3d vision system for size measure-ment of iron ore green pellets using morphological image segmentation,” Minerals Engineering Journal , 2007.
[3] W. Wang, F. Bergholm, and O. Stephansson, “Image analysis of fragment size andshape,” in Franklin and Katsabanis [22], pp. 233–243.
[4] A. Rosato, K. J. Strandburg, F. Prinz, and R. H. Swendsen, “Why the brazil nutsare on top: Size segregation of particulate matter by shaking,” Physical Review Letter , vol. 58, pp. 1038 – 1040, 1987.
[5] R. Chavez, N. Cheimanoff, and J. Schleifer, “Sampling problems during grain sizedistribution measurements,” Proceedings of the Fifth International Symposium on Rock Fragmentation by Blasting - FRAGBLAST 5 , pp. 245–252, Aug 1996.
[6] M. J. Thurley and K. C. Ng, “Modelling the relationship between the surface frag-ments and the pile size distribution in laboratory rock piles,” In submission .
[7] T. Andersson, M. Thurley, and O. Marklund, “Visibility classication of pellets inpiles for sizing without overlapped particle error,” In submission .
[8] M. Blomquist and A. Wernerson, “Range camera on conveyor belts: estimating sizedistribution and systematic errors due to occlusion,” Proceedings of the SPIE - The International Society for Optical Engineering , vol. 3835, pp. 118–126, Sept 1999.
[9] A. Bouajila, M. Bourassa, J.-A. Boivin, G. Ouellet, and T. I. Martinovic, “On-line non-intrusive measurement of greeen pellet diameter,” Ironmaking Conference Proceedings , pp. 1009–1020, 1998.
[10] T. Andersson, M. Thurley, and O. Marklund, “Pellet size estimation using spheri-cal tting,” Proceedings of the IEEE Instrumentation and Measurement Technology Conference , pp. 1–5, May 2007.
89
7/31/2019 Analysis of 3D Surface Data for on-line Determination of the Size Distribution of Iron Ore Pellet Piles on Conveyor …
http://slidepdf.com/reader/full/analysis-of-3d-surface-data-for-on-line-determination-of-the-size-distribution 104/130
90
[11] S. Al-Thyabat and N. Miles, “An improved estimation of size distribution fromparticle prole measurements,” Powder Technolgy , vol. 166, pp. 152–160, Jun 2006.
[12] S. Al-Thyabat, N. Miles, and T. Koh, “Estimation of the size distribution of particlesmoving on a conveyor belt,” Minerals Engineering , vol. 20, pp. 72–83, Jan 2007.
[13] J. Fernlund, “The effect of particle form on sieve analysis: a test by image analysis,”Engineering Geology , vol. 50, pp. 111–124, 1998.
[14] W. Wang and O. Stephansson, “Comparison between sieving and image analysis of aggregates,” in Franklin and Katsabanis [22], pp. 141–148.
[15] H. Kim, A. Rauch, and C. Haas, “Automated quality assessment of stone aggre-gates based on laser imaging and a neural network,” Journal of Computing in Civil Engineering , pp. 58–64, January 2004.
[16] J. Lee, M. Smith, L. Smith, and P. Midha, “A mathematical morphology approachto image based 3d particle shape analysis,” in Machine Vision and Applications ,vol. 16(5), pp. 282–288, Springer–Verlag, 2005.
[17] M. J. Thurley, Three Dimensional Data Analysis for the Separation and Sizing of Rock Piles in Mining . PhD thesis, Monash University, December 2002.
[18] M. Thurley and K. Ng, “Identifying, visualizing, and comparing regions in irregu-larly spaced 3d surface data,” Computer Vision and Image Understanding , vol. 98,
pp. 239–270, February 2005.[19] R. O. Duda, P. E. Hart, and D. G. Stork, Pattern Classication . Wiley, second ed.,
2001. ISBN 0-471-05669-3.
[20] D. E. Johnson, Applied Multivariate Methods for Data Analysts . Duxbury Press,1998. ISBN: 0-534-23796-7.
[21] A. J. Dobson, An introduction to generalized linear models . Chapman & Hall/CRC,2nd ed. ed., 2002. ISBN: 1-58488-165-8.
[22] J. Franklin and T. Katsabanis, eds., Measurement of Blast Fragmentation – Pro-ceedings of the FRAGBLAST 5 Workshop , Balkema, 1996.
7/31/2019 Analysis of 3D Surface Data for on-line Determination of the Size Distribution of Iron Ore Pellet Piles on Conveyor …
http://slidepdf.com/reader/full/analysis-of-3d-surface-data-for-on-line-determination-of-the-size-distribution 105/130
Paper D
An industrial 3D vision system forsize measurement of iron ore green
pellets using morphological imagesegmentation
Authors:Matthew J. Thurley, Tobias Andersson
Reformatted version of paper accepted for publication in:Minerals Engineering Journal, 2007
c 2007, Elsevier, Reprinted with permission.
91

7/31/2019 Analysis of 3D Surface Data for on-line Determination of the Size Distribution of Iron Ore Pellet Piles on Conveyor …
http://slidepdf.com/reader/full/analysis-of-3d-surface-data-for-on-line-determination-of-the-size-distribution 106/130
92 Paper D

7/31/2019 Analysis of 3D Surface Data for on-line Determination of the Size Distribution of Iron Ore Pellet Piles on Conveyor …
http://slidepdf.com/reader/full/analysis-of-3d-surface-data-for-on-line-determination-of-the-size-distribution 107/130
An industrial 3D vision system for size measurementof iron ore green pellets using morphological image
segmentation
Matthew J. Thurley and Tobias Andersson
Abstract
An industrial prototype 3D imaging and analysis system has been developed thatmeasures the pellet sieve size distribution into 9 sieve size classes between 5 mm and16+ mm. The system is installed and operational at a pellet production plant capturingand analysing 3D surface data of piled pellets on the conveyor belt. It provides fast,frequent, non-contact, consistent measurement of the pellet sieve size distribution andopens the door to autonomous closed loop control of the pellet balling disk or drum inthe future. Segmentation methods based on mathematical morphology are applied tothe 3D surface data to identify individual pellets. Determination of the entirely visiblepellets is made using a new two feature classication, the advantage being that thissystem eliminates the resulting bias due to sizing partially visible (overlapped) particlesbased on their limited visible prole. Literature review highlights that in the area of sizemeasurement of pellets and rocks, no other researchers make this distinction betweenentirely and partially visible particles. Sizing is performed based on best-t-rectangle,classied into size classes based on one quarter of the measured sieving samples, and thencompared against the remaining sieve samples.
1 IntroductionIron ore mining companies often further rene the extracted ore to produce iron ore pelletswhich have a uniformly high grade of iron oxide. Iron ore pellets are particularly useful tosteel manufacturers as they provide a consistent and high quality iron input to the blastfurnace. Variations in pellet size distributions affect the blast furnace process negativelybut this affect can be minimised by operating the furnace with different parameters [1]if the variation in pellet size distribution can be detected.
For iron ore pellet producers adherence to the target pellet size range is one of themajor measures of quality. Green pellets are produced primarily from crushed iron orein a rotating pelletising disk or tumbling drum after which they are baked in a furnaceto produce hardened black pellets.
Existing measurement of green pellet size is a manual sampling and sieving processwhich is invasive, infrequent, and overly time consuming preventing rapid response tosize variation.
93

7/31/2019 Analysis of 3D Surface Data for on-line Determination of the Size Distribution of Iron Ore Pellet Piles on Conveyor …
http://slidepdf.com/reader/full/analysis-of-3d-surface-data-for-on-line-determination-of-the-size-distribution 108/130
94 Paper D
The development of an industrial prototype 3D imaging and analysis system is pre-sented for non-contact measurement of the size of green pellets on the conveyor belt.
The advantages are frequent sampling and fast generation of sizing results providingrapid feedback to the manufacturing process.An imaging system that captures 3D surface data has been implemented based on
a projected laser line and camera triangulation [2]. It has a high speed digital cameracapable of 4000 frames per second and a continuous wave diode laser with line generatingoptics. The angle between the camera line of sight and the laser is approximately 24degrees. The imaging system is installed and operational at a local pellet plant above aconveyor belt moving at two metres per second and collects 3D surface coordinate dataat an irregular density of approximately 0.5mm 2.
We note however, that there are a number of sources of error relevant to techniquesthat measure only what is visible on the surface of a pile;
• Segregation and grouping error, more generally known as the brazil nut effect [3, 4],describes the tendency of the pile to separate into groups of similarly sized particles.It is caused by vibration or motion (for example as rocks are transported by truckor conveyor) with large particles being moved to the surface. Interestingly, iron oregreen pellets appear not to be susceptible to this error. Green pellets are wet andrelatively sticky and as they travel along they conveyor belt they remain almostentirely xed in place, with no observable segregation taking place.
• Capturing error [5], describes the varying probability based on size, that a particle
will appear on the surface of the pile, [6] has explored capturing error in laboratoryrock piles but it remains a source of error in this application. Further research isnecessary to understand the effect of capturing error for green pellets.
• Prole error, describes the fact that only one side (a prole) of an entirely visibleparticle can be seen making if difficult to estimate the particles size. However,best-t-rectangle has been demonstrated as a suitable feature for size classicationbased on the visible prole [7, 8] that correlates to sieve size.
• Overlapped particle error, describes the fact that many particles are only partiallyvisible and a large bias to the smaller size classes results if they are treated as small
entirely visible particles and sized using only their visible prole. This error canbe overcome in piles of particulate material using visibility classication [6] and anextended two feature classication strategy is presented here.
Literature review indicates numerous publications relating to sizing of particulatematerial (typically crushed or blasted rock) using imaging. These are predominantly2D photographic based systems with some of the more prominent being; [9, 10, 11, 12].There are a few publications relating to 3D size measurement; [13, 14, iron ore pellets],[15, sugar beets], and [16, river rock]. However, with the exception of [15], none of thesesystems (2D or 3D) removes the bias resulting from overlapped particle error, with [16]and [17] recommending a mechanical vibration system to separate rocks and prevent

7/31/2019 Analysis of 3D Surface Data for on-line Determination of the Size Distribution of Iron Ore Pellet Piles on Conveyor …
http://slidepdf.com/reader/full/analysis-of-3d-surface-data-for-on-line-determination-of-the-size-distribution 109/130
Paper D 95
particle overlap. [15] used graph theory and average region height to determine theentirely visible sugar beets but this approach is insufficient for application to rock piles
[6, 5.5.12] or pellet piles. For pellet sizing, both [13] and [14] assume that pellets arespherical in order to estimate pellet diameter from their measured data. However, wehave previously shown that pellets deviate in shape from a sphere such that sphericaltting produces a poor measure of pellet size [18].
In the presented work we apply 3D surface data analysis based on the work of [19]to the segmentation and sizing of the data, two feature classication to isolate non-overlapped pellets, sizing based on best-t-rectangle [7, 8] to generate a size measurethat correlates with sieving, and [20] minimisation to determine decision boundaries forsize classes that correlate to a high resolution sieve analysis encompassing 9 size classesbetween 5 mm and 16+ mm.
2 Segmentation of 3D Surface Data
2.1 BackgroundThe data collected by this system comprises sparse, irregularly spaced 3D coordinatepoints describing the surface of the pellet pile on the conveyor belt. Data coveringapproximately one meter of the belt is collected and then analysed. After analysis iscompleted the process is repeated. Figure 1 shows an enhanced photograph of the laserline on the moving conveyor pellet pile and gure 3 on page 99 shows a portion of the3D surface of a pellet pile.
There are some inherent complications when it comes to processing 3D surface datacollected by laser triangulation, as follows;
• There are numerous locations where the laser line is not visible from the point of view of the camera. This results in sparse areas in the 3D surface where there are
Figure 1: Laser line across green pellets (enhanced image)
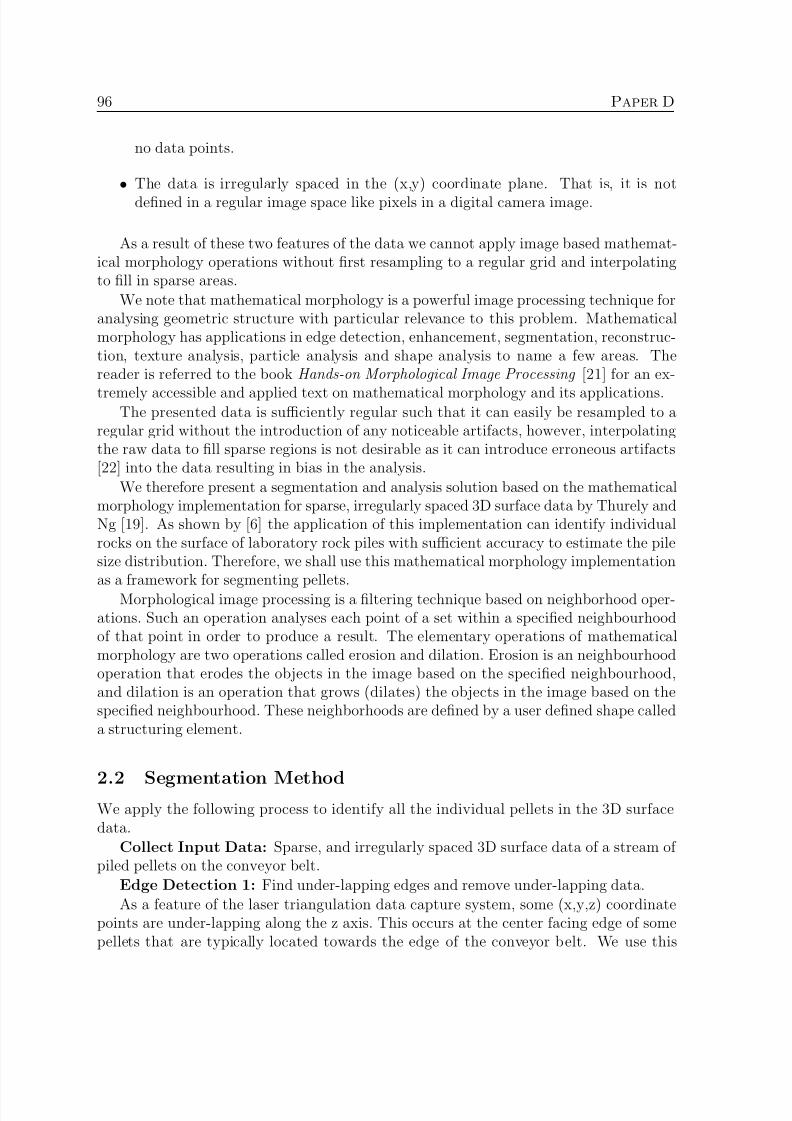
7/31/2019 Analysis of 3D Surface Data for on-line Determination of the Size Distribution of Iron Ore Pellet Piles on Conveyor …
http://slidepdf.com/reader/full/analysis-of-3d-surface-data-for-on-line-determination-of-the-size-distribution 110/130
96 Paper D
no data points.
• The data is irregularly spaced in the (x,y) coordinate plane. That is, it is notdened in a regular image space like pixels in a digital camera image.
As a result of these two features of the data we cannot apply image based mathemat-ical morphology operations without rst resampling to a regular grid and interpolatingto ll in sparse areas.
We note that mathematical morphology is a powerful image processing technique foranalysing geometric structure with particular relevance to this problem. Mathematicalmorphology has applications in edge detection, enhancement, segmentation, reconstruc-tion, texture analysis, particle analysis and shape analysis to name a few areas. The
reader is referred to the bookHands-on Morphological Image Processing
[21] for an ex-tremely accessible and applied text on mathematical morphology and its applications.The presented data is sufficiently regular such that it can easily be resampled to a
regular grid without the introduction of any noticeable artifacts, however, interpolatingthe raw data to ll sparse regions is not desirable as it can introduce erroneous artifacts[22] into the data resulting in bias in the analysis.
We therefore present a segmentation and analysis solution based on the mathematicalmorphology implementation for sparse, irregularly spaced 3D surface data by Thurely andNg [19]. As shown by [6] the application of this implementation can identify individualrocks on the surface of laboratory rock piles with sufficient accuracy to estimate the pilesize distribution. Therefore, we shall use this mathematical morphology implementationas a framework for segmenting pellets.
Morphological image processing is a ltering technique based on neighborhood oper-ations. Such an operation analyses each point of a set within a specied neighbourhoodof that point in order to produce a result. The elementary operations of mathematicalmorphology are two operations called erosion and dilation. Erosion is an neighbourhoodoperation that erodes the objects in the image based on the specied neighbourhood,and dilation is an operation that grows (dilates) the objects in the image based on thespecied neighbourhood. These neighborhoods are dened by a user dened shape calleda structuring element.
2.2 Segmentation MethodWe apply the following process to identify all the individual pellets in the 3D surfacedata.
Collect Input Data: Sparse, and irregularly spaced 3D surface data of a stream of piled pellets on the conveyor belt.
Edge Detection 1: Find under-lapping edges and remove under-lapping data.As a feature of the laser triangulation data capture system, some (x,y,z) coordinate
points are under-lapping along the z axis. This occurs at the center facing edge of somepellets that are typically located towards the edge of the conveyor belt. We use this

7/31/2019 Analysis of 3D Surface Data for on-line Determination of the Size Distribution of Iron Ore Pellet Piles on Conveyor …
http://slidepdf.com/reader/full/analysis-of-3d-surface-data-for-on-line-determination-of-the-size-distribution 111/130
Paper D 97
under-lapping information to nd a few pellet edges and then we remove the under-lapping data as it is not suitable for the greyscale-based mathematical morphology [19]
that we apply here.Edge Detection 2: Edges of occluded areasSparse or occluded areas where there are no data points occur at the edges of pellets.
By detecting discontinuities in the column pixel count from the camera we detect someedges of occluded areas.
Resample existing data sets to a regular grid.After exploiting the raw data structure to remove under-lapping edges and identify
occluded areas, we resample the data to a regular grid to improve computational efficiencyin the subsequent processes.
Crop the width of the data to reduce bias due to increasing occlusion and diminishing
data per pellet at the extremities of the laser line.Edge Detection 3: Morphological laplacianTo dene the morphological laplacian we rst provide the mathematical functional
notation of erosion of an image A by structuring element B by B (A) [21, pp. 5] anddilation by δ B (A) [21, pp. 8].
We dene the morphological laplacian as ( δ B (A) −A) −(A − B (A)) where the edgesare dened by zero crossings. We incorporate this method as it performs well for detect-ing edges between overlapping pellets. We performed a morphological laplacian usinga 0.8mm radius spherical structuring element, took the absolute z value, performed amorphological closing [21, pp. 27] using a 0.8mm spherical closing to ll gaps, and thena 10% threshold on z depth.
Edge Detection 4: Closing top hatThe morphological closing top hat is a good general edge detector for particles. We
performed the closing top hat [21, pp. 27] operation using a 1.6mm radius sphericalstructuring element, followed by a 1.5% threshold on z depth.
Edge Detection 5: Neighbourhood countWe detect edges of sparse areas in the data by calculating the neighbour count for
all data points using a 0.8mm radius. Points with a low number of neighbours in thespecied radius are likely edges of sparse areas in the data. We applied a threshold toretain only the smallest 40% of values from the neighbour count operation.
Combine Edges: Add all 5 edge detection methods together. Figure 2 shows aportion of the results of this operation.
Distance Transform on the edge set.Using the combined edge set shown in gure 2 we calculate, for each 3d point, the
distance to the nearest edge point.Find Local Maxima in the Distance TransformWe process the result of the distance transform and nd local maxima using the
morphological operation, opening by reconstruction [21, pp. 136] with a 1.6mm radiusspherical structuring element for the opening, and a 0.8mm radius at circular disk forthe reconstruction.
Seed Growing from Local Maxima

7/31/2019 Analysis of 3D Surface Data for on-line Determination of the Size Distribution of Iron Ore Pellet Piles on Conveyor …
http://slidepdf.com/reader/full/analysis-of-3d-surface-data-for-on-line-determination-of-the-size-distribution 112/130
98 Paper D
Figure 2: A portion of the detected pellet edges combining 5 techniques
We use a seed growing [19] technique that expands the local maxima based on theirheight in the distance transform, merging spatially close maxima and creating seed re-gions for the watershed segmentation.
Watershed SegmentationA seeded watershed [21, ch. 7] segmentation is performed to identify the individual
pellet regions. This is a well established segmentation technique which is typically per-formed on the gradient representation of the input data. In this case we use the closingtop hat edge set as the detected region boundaries are more accurate for this data thanwhen the morphological gradient [21, pp. 48] edge set is used.
Post-ltering to remove tiny regions.A sample segmentation is presented in gure 4 for the 3D data shown in gure 3. The
segmentation is of a pile of baked pellets collected in the laboratory as green pellets areprohibitively fragile for laboratory experimentation.
Segmentation ResultsThe segmentation identies 1092 regions and after a region by region 3D visual anal-
ysis of the segmentation, 3d data, and overlapping photograph of the pile, we providethe following qualitative assessment.
• Over-segmentation occurred in 5 pellets that were reported as 10 regions.
• Under-segmentation occurred in 34 pellets that were reported as 17 regions.
• A segmentation shift occurred in 4 pellets that were reported as 4 regions butthe region was shifted signicantly off the pellet. These regions corresponded topartially visible (overlapped) pellets.
•The 1092 detected regions represented 1104 pellets.
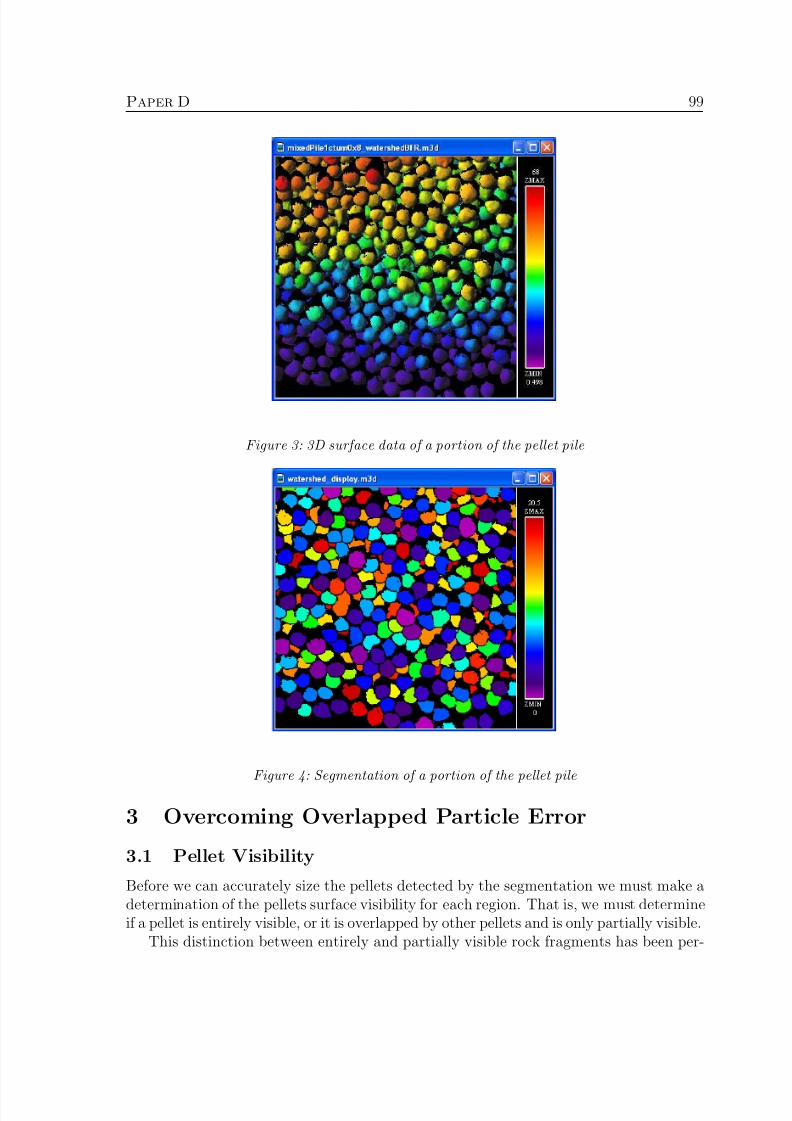
7/31/2019 Analysis of 3D Surface Data for on-line Determination of the Size Distribution of Iron Ore Pellet Piles on Conveyor …
http://slidepdf.com/reader/full/analysis-of-3d-surface-data-for-on-line-determination-of-the-size-distribution 113/130
Paper D 99
Figure 3: 3D surface data of a portion of the pellet pile
Figure 4: Segmentation of a portion of the pellet pile
3 Overcoming Overlapped Particle Error
3.1 Pellet VisibilityBefore we can accurately size the pellets detected by the segmentation we must make adetermination of the pellets surface visibility for each region. That is, we must determineif a pellet is entirely visible, or it is overlapped by other pellets and is only partially visible.
This distinction between entirely and partially visible rock fragments has been per-

7/31/2019 Analysis of 3D Surface Data for on-line Determination of the Size Distribution of Iron Ore Pellet Piles on Conveyor …
http://slidepdf.com/reader/full/analysis-of-3d-surface-data-for-on-line-determination-of-the-size-distribution 114/130
100 Paper D
formed for laboratory rock piles by [6]. This distinction is very powerful as it allowsaccurate size determination of entirely visible particles for which the entire prole is vis-
ible, and for partially visible particles to be ignored as their prole indicates little aboutthe size of the entire rock, analogous to the tip of an iceberg. As a result we can overcomebias due to overlapped particle error.
By manually interrogating the 3D surface data of the laboratory pellet pile we deneeach region as either entirely or partially visible so as to dene the “ground truth” forthe purposes of creating an automatic classication algorithm.
We note that as pellets are consistently blob like in shape, we expect that 2D shapefactors will offer additional features for classication of pellet visibility. Entirely visiblepellets will typically appear approximately circular in shape when projected into the x-yplane, whereas partially visible pellets should have regions with odd, convex, crescent-like
and/or angular 2D shapes.For the developed industrial system we used a combination of visibility ratio [6]and a 2D non-perpendicular aspect ratio for pellet visibility classication. The non-perpendicular aspect ratio is equal to the major axis divided by the minor axis wherethe major and minor axes do not have to be perpendicular. A subsequent more rigorousinvestigation of visibility classication using a range of features is presented by [23].
Using box-plots [24, 25] we depict the spread of the visibility ratio and aspect ratiodistributions and consider their capacity for discriminating between entirely and partiallyvisible pellets (gures 5 and 6).
A boxplot is a useful way of depicting a population of data without any assumptionsof the statistical distribution. The central portion of a box-plot contains a rectangularbox. In the center of this box is a short thick vertical black line which marks the medianvalue (or 50 percentile) of the data. The left edge of the rectangular box marks the 25percentile, and the right edge of the box marks the 75 percentile. The circular dots tothe left and right of each box-plot indicate values that are statistically determined to beoutliers. The graphs and determination of outliers were calculated using the R statisticalanalysis package [26].
P a r t i a l l y
E n t i r e l y
0.0 0.2 0.4 0.6 0.8 1.0
Region Visibility Ratio by Manual Visibility Classification
Visibility Ratio
M a n u a l V
i s i b i l i t y C l a s s i f i c a t i o n
Figure 5: Visibility ratio as a feature for discriminating between entirely and partially visible pellets.

7/31/2019 Analysis of 3D Surface Data for on-line Determination of the Size Distribution of Iron Ore Pellet Piles on Conveyor …
http://slidepdf.com/reader/full/analysis-of-3d-surface-data-for-on-line-determination-of-the-size-distribution 115/130
Paper D 101
P a r t i a l l y
E n t i r e
l y
1.0 1.5 2.0 2.5 3.0
Region Aspect Ratio by Manual Visibility Classification
Aspect Ratio
M a n u a l V
i s i b i l i t y C l a s s i f i c a t i o n
Figure 6: Aspect ratio (non-perpendicular) as a feature for discriminating between entirely and partially visible pellets.
3.2 Visibility Classication
Both the visibility ratio (gure 5) and aspect ratio (gure 6) demonstrate a clear sepa-ration in the central box portion of the distributions for the entirely and partially visiblepellets which suggests they are promising features for classication. We now plot bothof these features in a 2D scatter plot (gure 7) and dene a linear discriminant functionto separate partially and entirely visible pellets.
The sher linear discriminant [27, pp. 117] is one method for determining a lineardiscriminant function between two classes. We can use Fisher linear discriminant if “oneis willing to sacrice some of the theoretically attainable performance for the advantagesof working in one dimension” [27, pp. 120]. It projects a high dimension problem ontoa line, reducing it to one dimension. In a two class problem, the projection maximisesthe distance between the mean of the two classes, while minimising the class variances.The resultant classication is a matter of selecting a threshold between the two classes inthe one dimensional projection space. The resultant linear discriminant, is the line per-pendicular to the one dimensional projection intersecting this threshold. Furthermore,we apply a weighted cost function to the determination of the threshold such that mis-classication of partially visible pellets is 3 times more costly than misclassication of entirely visible pellets. We apply this weighted cost as it has little impact on our resultsto misclassify some entirely visible pellets for the benet of preventing partially visiblepellets being mistakenly classied and sized as entirely visible pellets. The resultant lin-ear discriminant has a gradient of 0.4286, a vertical axis intercept of 0.1844 and is showngure 7.
You will note in gure 7 that very few points corresponding to partially visible pelletsare placed above the linear discriminant. When we come to sizing pellets, we will sizeonly those pellets above the discriminant line, as we can be highly condent that regionsabove this line will correspond to entirely visible pellets for which we can condentlyestimate size without bias due to overlapped particle error.

7/31/2019 Analysis of 3D Surface Data for on-line Determination of the Size Distribution of Iron Ore Pellet Piles on Conveyor …
http://slidepdf.com/reader/full/analysis-of-3d-surface-data-for-on-line-determination-of-the-size-distribution 116/130
102 Paper D
1.0 1.5 2.0 2.5 3.0
0.0
0.2
0.4
0.6
0.8
1.0
Region Visibility vs Aspect Ratio for Manual Visibility classifications
Aspect Ratio
V i s i b i l i t y R a t i o
entirely visiblepartially visible
Figure 7: Aspect ratio (non-perpendicular) vs Visibility ratio as a 2D feature space for discrim-inating between entirely and partially visible pellets.
3.3 Visibility ValidationThree validation techniques are typically considered when estimating the performance of
classiers;
• Re-substitution method is a simple method where a classier is tested on thesame data upon which it was developed. This gives better results than if the clas-sier was tested on new data and provides an overestimate (sometimes an extremeoverestimate) of the performance of the classier.
• Holdout method is a method where a set of data is held out when developingthe classier. The classier is developed on a separate set and may be tested on anew set of data to produce an unbiased estimate of classiers performance. This isthe most robust method but it is also requires the most data.
• Cross-validation is especially useful for providing a ”nearly unbiased estimate of the true probabilities of correct and incorrect classications” [28, pg. 221 pa. 2]when the data available is limited.
As we did not have a second data set, we used 10-fold cross-validation to get anestimate of how well the the visibility and sizing classication works. The method is aniterative process of developing a classier and estimating the classier’s performance. Ateach iteration one part of the data set is held out to be a test set and the rest of thedata is used to train the classier. A 10-fold cross-validation performs the train-and-testiteration process 10 times. In each iteration, 10% of the data is is held out to be a

7/31/2019 Analysis of 3D Surface Data for on-line Determination of the Size Distribution of Iron Ore Pellet Piles on Conveyor …
http://slidepdf.com/reader/full/analysis-of-3d-surface-data-for-on-line-determination-of-the-size-distribution 117/130
Paper D 103
testing set. An average of the classier accuracy is then calculated for the 10 differentclassication results.
As shown in table 4.1 the expected performance of the classication strategy ensuresthat 98.57% of partially visible pellets are excluded, and 69.04% of entirely visible pelletsare included. Using this classication strategy we will identify the entirely visible pelletsthat we will size in the absence in overlapped particle error.
“Ground truth” Predicted classicationclassication Entirely vis. Partially vis.
Entirely visible 69.04 30.96Partially visible 1.43 98.57
Table 4.1: Confusion matrix generated with 10-fold cross validation for classication with a sher linear discriminant based on a weighted cost function
3.4 SizingWe dene region size by using a measure of area calculated from the encompassingbest-t-rectangle [7, 8] of a region. The best-t-rectangle is calculated in the x-y planeprojection of each region and is the rectangle of minimum area that can completelyencompass the region. We show the distributions of best-t-rectangle area by size classfor the surface pellets in our laboratory pile in gure 8. We note that best-t-rectangleprovides a reasonable separation in the central portion of each boxplot with the signicantexception being the close size classes 9 mm and 10 mm which show a stronger overlap. Inall cases, the median value is clearly separable and the nal results will demonstrate thatbest-t-rectangle is a sufficient sizing feature. Further research work into complimentarysize measurement features is ongoing.
4 Industrial System
4.1 TrainingUsing the described segmentation, visibility classication, and sizing methods developedon the laboratory pellet pile we process data from the industrial system and determinethe best-t-rectangle area for the pellets we consider to be entirely visible. What remainsin order to produce a pellet size distribution is to determine a series of decision boundariesthat classify best-t-rectangle area into the various sieve size classes.
To obtain the necessary data our industry partner collected a frequent and highresolution sieving, obtaining 23 samples over a 5 1
2 hour period, of a portion of the pelletstream feeding onto the conveyor belt (table 4.2).

7/31/2019 Analysis of 3D Surface Data for on-line Determination of the Size Distribution of Iron Ore Pellet Piles on Conveyor …
http://slidepdf.com/reader/full/analysis-of-3d-surface-data-for-on-line-determination-of-the-size-distribution 118/130
104 Paper D
6.3
9
10
11.2
12.5
14−16
50 100 150 200 250
Region Best−Fit−Rectangle of Entirely Visible Pellets
Best−Fit−Rectangle Area (mm²)
E n t i r e l y
V i s i b l e P e l l e t S
i z e C l a s s ( m m
)
Figure 8: Distributions of best-t-rectangle area by size class for the “ground truth” manually dened entirely visible pellets.
The sieving results used 10 size classes with lower bounds at 0, 5, 8, 9, 10, 11, 12.5,13, 14 and 16+ mm. The material collected at size class 0–5mm comprised only of smallfragments of broken pellets and is not signicant for the pellet size measurement system.Therefore we leave this size class out of the nal results. This is convenient for the visionsystem as one of the limitations of vision systems is the lower limit on resolution. In this
case we have data points at approximately a 0.5 mm spacing and a smallest sieve size at5 mm is at a size where we are completely condent we can detect pellets.The measurements in table 4.2 are percentage by weight and it is necessary for us to
convert this distribution to percentage by number to correspond with the pellet countsfrom our analysis. Once we have trained our decision boundaries on the percentageby number sieve distribution, we will convert our analysis result back to percentage byweight for the nal presentation of results. In order to convert to percentage by numberour industry partner measured some average weights per pellet using some of the sievingsamples. We use weights for green pellets by size class as shown in table 4.3.
Once we have converted the sieve size class distributions to percentage by number we
train our decision boundaries to these size classes. For a single sieving result it is a simplecounting process to select decision boundaries that convert the distribution of best-t-rectangle area values at that time into a near perfect result with the correct number of pellets in each size class. Calculating these decision boundaries for each of the rst 6sets of sieving data produces the results shown in table 4.4. The purpose of presentingthese decision boundaries is to show that decision boundaries that produce near perfectresults at one time interval, are not necessarily similar as at another time interval.
In order to produce generic decision boundaries we need a method that can select theboundaries such that the resultant error is minimised. To achieve this we use the [20]iterative error minimisation process. This optimisation method is available in the popularnumerical computing package Matlab using function fminsearch , or in the statistical

7/31/2019 Analysis of 3D Surface Data for on-line Determination of the Size Distribution of Iron Ore Pellet Piles on Conveyor …
http://slidepdf.com/reader/full/analysis-of-3d-surface-data-for-on-line-determination-of-the-size-distribution 119/130
Paper D 105
Time Sieve Size Class Lower Bound (mm)0 5 8 9 10 11 12.5 13 14 16+
9:01 0.51 0.63 0.74 3.93 24.75 45.06 12.24 8.31 3.60 0.249:10 0.00 0.55 1.53 6.66 39.52 30.81 11.07 7.67 2.18 0.009:25 0.21 0.32 0.74 3.81 26.02 40.68 10.57 13.50 3.79 0.369:35 0.45 0.90 1.88 10.60 36.21 36.56 5.28 4.94 2.75 0.439:45 0.55 0.84 0.79 5.21 34.04 39.75 8.35 7.57 2.58 0.329:55 0.41 0.99 1.61 5.94 34.86 37.85 7.50 6.58 4.27 0.00
11:24 0.29 0.42 1.38 4.86 29.51 40.68 8.73 10.86 3.27 0.0011:34 1.10 1.71 2.08 9.44 34.61 36.90 5.34 6.00 2.83 0.0011:44 0.58 1.77 3.62 12.11 40.54 29.92 7.21 3.58 0.68 0.0011:55 0.34 0.73 2.17 8.66 39.32 34.35 6.69 5.62 2.12 0.0012:05 0.51 0.97 1.18 7.76 34.88 35.95 9.12 8.57 1.06 0.0012:15 0.47 0.47 0.94 3.89 32.61 41.12 10.65 6.65 2.92 0.2912:34 0.38 0.67 0.78 3.61 25.80 34.85 15.95 13.59 3.57 0.7912:51 0.53 0.92 0.71 3.77 25.83 35.05 12.40 13.21 6.20 1.3813:01 0.58 0.42 0.11 2.10 16.85 44.25 13.64 15.19 6.11 0.7613:11 0.29 0.33 0.33 2.00 21.65 43.07 16.35 11.92 2.70 1.3613:21 0.67 0.55 0.33 1.59 16.39 41.06 15.92 14.93 7.93 0.6513:31 0.48 0.42 0.19 1.49 16.81 34.75 19.98 18.77 5.94 1.1713:43 0.80 1.45 3.19 9.87 38.28 32.34 7.41 5.36 1.31 0.0013:53 0.33 0.24 0.91 6.60 33.08 40.93 10.92 4.98 1.99 0.0014:03 0.95 0.73 0.75 4.70 30.29 40.19 12.39 9.29 0.71 0.00
14:13 0.69 0.61 1.38 6.93 27.98 42.98 8.96 7.51 2.97 0.0014:23 0.36 0.93 1.41 5.54 29.98 39.51 10.33 9.07 2.86 0.00
Table 4.2: Sieving results (% by weight) of iron ore green pellets during production
Sieve Size Class Lower Bound (mm)0 5 8 9 10 11 12.5 13 14 16+
0.26 0.71 1.7 2.35 2.98 3.83 5.19 6.35 7.33 9.5
Table 4.3: Average weight (g) for iron ore green pellets
package R [26] using function optim which we use here. Given an initial estimate of thedecision boundaries we use Nelder-Mead minimisation to produce a nal set of boundariesthat has minimum error. We note however, that the Nelder-Mead algorithm is sensitiveto the initial estimate and can lead to inappropriate termination at non-optimal points”[29]. However, given a sufficient initial estimate we achieve suitable decision boundaries.
The Nelder-Mead optimisation takes an estimate of the decision boundaries and calcu-lates the error at that estimate. It then modies the decision boundaries slightly followinga range of internal rules before repeating the process. Changes that reduce the error are

7/31/2019 Analysis of 3D Surface Data for on-line Determination of the Size Distribution of Iron Ore Pellet Piles on Conveyor …
http://slidepdf.com/reader/full/analysis-of-3d-surface-data-for-on-line-determination-of-the-size-distribution 120/130
106 Paper D
Time Sieve Size Class Lower Bound (mm)5 8 9 10 11 12.5 13 14 16+
9:01 74.00 79.13 80.75 87.50 109.92 146.98 167.90 195.64 278.729:10 15.75 59.50 67.83 83.82 117.76 146.32 165.07 195.16 –9:25 59.38 69.07 72.00 82.31 108.66 143.00 156.00 190.56 248.699:35 56.13 68.00 72.25 86.90 115.00 154.34 168.25 188.47 224.869:45 70.44 76.50 78.39 85.53 110.35 148.55 162.00 185.02 239.309:55 59.89 71.03 75.87 83.87 112.62 147.73 160.99 181.69 –
Median 59.64 70.05 74.06 84.70 111.48 147.36 163.54 189.52 244.00Nelder 60.17 68.66 74.03 84.55 111.91 147.94 164.73 197.17 255.16
Table 4.4: Decision boundaries (mm 2) for best-t-rectangle that generate near-perfect sieving results at each time interval, the Median values, and the optimised result from Nelder-Mead
minimisation
kept, while changes that increase the error are typically discarded. We use the medianof the decision boundaries in table 4.4 as the initial estimates for the Nelder-Mead andgenerate the optimised result, also shown at the bottom of table 4.4.
One of the complications with the error minimisation is that it is being performed onthe percentage by number distributions, but what we actually want to minimise is theerror in the nal results, which will be percentage by weight distributions. As a resultwe scale the error calculations during the Nelder-Mead minimisation by the size classweights from table 4.3. We express the error function as a sum of squares as shown inequation 1.
=t
N
i=1
[(C i,t −S i,t ) W i ]2 (1)
t Time of dayi Sieve size class
N Number of sieve size classesC i,t Calculated value of the size class i at time tS i,t Sieving result for size class i at time tW i Average pellet weight of size class i
Using the optimised Nelder-Mead decision boundaries from table 4.4 we produceestimates of the sieve size distributions across the 5 1
2 hour period for which we havemeasured sieve data. The results are presented in gure 9. The left block of the graph isshaded gray to show the portion of the sieving data that was used to train the decisionboundaries, with the remaining 17 sieve results illustrating the capacity of the system to

7/31/2019 Analysis of 3D Surface Data for on-line Determination of the Size Distribution of Iron Ore Pellet Piles on Conveyor …
http://slidepdf.com/reader/full/analysis-of-3d-surface-data-for-on-line-determination-of-the-size-distribution 121/130
Paper D 107
0
5
10
15
20
25
P e r c e n t a g e
b y W e i g h t TRAINING DATA
5%
Imaging16mm14mm13mm
Sieving16mm14mm13mm
Sieving16mm14mm13mm
0
10
20
30
40
50
P e r c e n t a g e
b y W e i g h t
10%
Imaging12.5mm11mm10mm
Sieving12.5mm11mm10mm
Sieving12.5mm11mm10mm
0
5
10
15
20
25
P e r c e n t a g e
b y W e i g h t
5%
9 : 0 1 9 : 2 1
9 : 4 1
1 0 : 0 1
1 0 : 2 1
1 0 : 4 1
1 1 : 0 1
1 1 : 2 1
1 1 : 4 1
1 2 : 0 1
1 2 : 2 1
1 2 : 4 1
1 3 : 0 1
1 3 : 2 1
1 3 : 4 1
1 4 : 0 1
1 4 : 2 1
Imaging9mm8mm5mm
Sieving9mm8mm5mm
Sieving9mm8mm5mm
Iron Ore Green Pellet Size Distribution
Figure 9: Imaging and sieving results for 5 12 hours of production where the speed of the pelletising
disk was being changed.
estimate the sieve size.The results show a strong capacity to estimate sieve size (with some error) even at the
presented high resolution sieve analysis where 5 size classes have a spacing of only 1 mmand the 12.5–13 mm size class only a 0.5 mm spacing. The imaging results are calculatedfor every minute between 9:00 and 14:30 and total 331 calculations. The plots of the

7/31/2019 Analysis of 3D Surface Data for on-line Determination of the Size Distribution of Iron Ore Pellet Piles on Conveyor …
http://slidepdf.com/reader/full/analysis-of-3d-surface-data-for-on-line-determination-of-the-size-distribution 122/130
108 Paper D
imaging results are running averages across a 3 minute interval.We note also that the image processing results show interesting variation between
each sieving measurement across the day which is one of the advantages of a continuousonline measurement system. In the future this will allow for a previously unattainablehigh resolution examination of pellet size variation during production and lead to a muchbetter understanding and control of the pellet balling disk/drum.
5 Future researchThe presented research provides fast feedback to the pelletising process with high resolu-tion sieving results. This opens the door to autonomous closed loop control of the pelletballing disk/drum and we expect advances in this area in the near future.
Application of the presented system to measurement of baked pellets prior to chargingthe blast furnace in steel production is an immediately applicable application. Someadditional research may be necessary to investigate the varying conditions produced bybaked pellets specically due to segregation error / brazil nut effect [3, 4].
Extending the presented system to rocks on conveyor belt is also planned based onthe existing research of [6] on laboratory rock piles.
Further research into features for size measurement and classication is also of interest,specically to establish sizing features that can complement best-t-rectangle [8].
6 CommentsThe high speed camera ensures that we have a high density of 3D points at approximatelya spacing of 0.5mm in the plane of the conveyor belt. Having a data density at this highresolution has at least two advantages. Firstly it allows us to detect small sliver orcrescent like regions of overlapped particles and ensure that they are not merged intoother regions. And secondly it ensured that we had a high resolution when it came tomeasuring the size of each pellet, and allowed us to produce a size distribution with veryne spacing, specically, 5, 8, 9, 10, 11, 12.5, 13, 14 and 16 mm size classes. Notablythere are 4 size classes that are only 1mm wide, and one size class (12.5 – 13 mm) that is
only 0.5mm wide. Without the high speed camera generating this high resolution datait is the authors opinion that we could not have identied these size classes so effectively.Furthermore, we can say that the system achieves what a number of commercial
2D fragmentation measurement systems could not satisfactorily achieve for the pelletproducer, that is, accurate sizing of the green pellets.
Equivalent vision hardware can now be purchased off-the-shelf for about 15,000 Euros,and the current system has been running for 14 months without the need for maintenance.
The product is now in a commercialisation phase and commercial enquiries can bedirected to the primary author 1 for forwarding to our commercial partner.
1Matthew J. Thurley. E-mail: matthew. [email protected]

7/31/2019 Analysis of 3D Surface Data for on-line Determination of the Size Distribution of Iron Ore Pellet Piles on Conveyor …
http://slidepdf.com/reader/full/analysis-of-3d-surface-data-for-on-line-determination-of-the-size-distribution 123/130
Paper D 109
7 ConclusionAn industrial prototype 3D imaging system for sizing of iron ore green pellets on conveyorbelt has been developed with the pellet sieve size distribution determined into 9 sieve sizeclasses between 5 mm and 16+ mm. The advantages for the pellet production plant arefast, frequent, non-contact, consistent, high resolution measurement, and the potentialfor closed loop control of the pellet balling disk/drum. Pellet identication in the 3Dsurface data has been performed using morphological segmentation and a new two featureclassication applied to identify entirely visible and partially visible (overlapped) pellets.Visibility classication is an important distinction of this work as it allows entirely visiblepellets to be sized accurately, partially visible (overlapped) pellets to be ignored, andprevents bias due to the sizing of partially visible pellets based on their limited visibleprole. Literature review indicates that no other researchers in particle size measurementfor pellets or rocks make this distinction between entirely and partially visible particles.Sizing of the entirely visible pellets is performed using best-t-rectangle which is classiedinto 9 sieve size classes from 5 mm up to and including 16+ mm. This classication istrained on approximately one quarter of the sieving data using [20] error minimisationwith the resulting graphs of pellet size class illustrating a strong correlation between theimaging results and the sieving samples.
8 AcknowledgmentsThanks go to the Swedish research funding body VINNOVA, our industry partners,LKAB, Boliden Mining, and SSAB Steel, and to the staff at ProcessIT Innovations forall their efforts in arranging and facilitating the 3D measurement project. Thanks also toJohn Erik Larsson at MBV-systems for his efforts on the 3D surface imaging system andin particular our demands for additional hardware capabilities in the laboratory system,and to Kjell-Ove Mickelsson at LKAB and Robert Johansson at SSAB for their generousprovisions of time, energy and invaluable industry advice.

7/31/2019 Analysis of 3D Surface Data for on-line Determination of the Size Distribution of Iron Ore Pellet Piles on Conveyor …
http://slidepdf.com/reader/full/analysis-of-3d-surface-data-for-on-line-determination-of-the-size-distribution 124/130
110 Paper D

7/31/2019 Analysis of 3D Surface Data for on-line Determination of the Size Distribution of Iron Ore Pellet Piles on Conveyor …
http://slidepdf.com/reader/full/analysis-of-3d-surface-data-for-on-line-determination-of-the-size-distribution 125/130
References
[1] L. S. Okvist, A. Dahlstedt, and M. Hallin, “The effect on blast furnace process of changed pellet size as a result of segregation in raw material handling,” Ironmaking Conference Proceedings , pp. 167–178, 2001.
[2] Wikipedia, “3d scanner,” July 2007.
[3] A. Rosato, K. J. Strandburg, F. Prinz, and R. H. Swendsen, “Why the brazil nutsare on top: Size segregation of particulate matter by shaking,” Physical Review Letter , vol. 58, pp. 1038 – 1040, 1987.
[4] Wikipedia, “Brazil nut effect,” June 2007.
[5] R. Chavez, N. Cheimanoff, and J. Schleifer, “Sampling problems during grain sizedistribution measurements,” Proceedings of the Fifth International Symposium on Rock Fragmentation by Blasting - FRAGBLAST 5 , pp. 245–252, Aug 1996.
[6] M. J. Thurley, Three Dimensional Data Analysis for the Separation and Sizing of Rock Piles in Mining . PhD thesis, Monash University, December 2002.
[7] W. Wang, F. Bergholm, and O. Stephansson, “Image analysis of fragment size andshape,” in Franklin and Katsabanis [30], pp. 233–243.
[8] W. Wang, “Image analysis of particles by modied ferret method – best-fit rectan-gle,” Power Technology , pp. 1–10, 2006.
[9] N. Maerz, T. Palangio, and J. Franklin, “Wipfrag image based granulometry sys-
tem,” in Franklin and Katsabanis [30], pp. 91–99.[10] J. Schleifer and B. Tessier, “Fragmentation assessment using the Fragscan system:
Quality of a blast,” in Explosives in Mining Conference [31], pp. 365–372.
[11] J. Kemeny, E. Mofya, R. Kaunda, and P. Lever, “Improvements in blast fragmen-tation models using digital image processing,” in Explosives in Mining Conference [31], pp. 357–363.
[12] R. A. Salinas, U. Raff, and C. Farfan, “Automated estimation of rock fragment dis-tributions using computer vision and its applcation in mining,” in IEE Proceedings:Vision, Image and Signal Processing , vol. 152(1), pp. 1–8, February 2005.
111

7/31/2019 Analysis of 3D Surface Data for on-line Determination of the Size Distribution of Iron Ore Pellet Piles on Conveyor …
http://slidepdf.com/reader/full/analysis-of-3d-surface-data-for-on-line-determination-of-the-size-distribution 126/130
112 References
[13] M. Blomquist and A. Wernerson, “Range camera on conveyor belts: estimating sizedistribution and systematic errors due to occlusion,” Proceedings of the SPIE - The
International Society for Optical Engineering , vol. 3835, pp. 118–126, Sept 1999.[14] A. Bouajila, M. Bourassa, J.-A. Boivin, G. Ouellet, and T. I. Martinovic, “On-
line non-intrusive measurement of greeen pellet diameter,” Ironmaking Conference Proceedings , pp. 1009–1020, 1998.
[15] I. Frydendal and R. Jones, “Segmentation of sugar beets using image and graphprocessing,” in ICPR 98 Proceedings – 14th International Conference on Pattern Recognition , vol. II, (Brisbane, Australia), pp. 16–20, August 1998.
[16] H. Kim, C. Haas, A. Rauch, and C. Browne, “3d image segmentation of aggregates
from laser proling,” Computer Aided Civil and Infrastructure Engineering , pp. 254–263, 2003.
[17] J. Lee, M. Smith, L. Smith, and P. Midha, “A mathematical morphology approachto image based 3d particle shape analysis,” in Machine Vision and Applications ,vol. 16(5), pp. 282–288, Springer–Verlag, 2005.
[18] T. Andersson, M. Thurley, and O. Marklund, “Pellet size estimation using sphericaltting,” in Proceedings of the IEEE Instrumentation and Measurement Technology Conference , pp. 1–5, IEEE, May 2007.
[19] M. Thurley and K. Ng, “Identifying, visualizing, and comparing regions in irregu-larly spaced 3d surface data,” Computer Vision and Image Understanding , vol. 98,pp. 239–270, February 2005.
[20] J. Nelder and R. Mead, “A simplex method for function minimisation,” The Com-puter Journal , vol. 7, pp. 308–313, 1965.
[21] E. R. Dougherty and R. A. Lotufo, Hands-On Morphological Image Processing ,vol. TT59. SPIE – The International Society for Optical Engineering, 2003.
[22] M. Thurley, K. Ng, and J. Minack, “Mathematical morphology implemented for
discrete, irregular 3d surface data,” in DICTA 99, Digital Image Computing: Tech-niques and Applications Conference Proceedings , Fifth Biennial Conference, (CurtinUniversity, Perth, Western Australia), pp. 16–20, Australian Pattern RecognitionSociety, December 1999.
[23] T. Andersson, M. Thurley, and O. Marklund, “Visibility classication of pelletsin piles for sizing without overlapped particle error,” in Digital Image Computing:Techniques and Applications Conference Proceedings, DICTA 2007 , Australian Pat-tern Recognition Society, December 2007. Accepted.
[24] Wikipedia, “Boxplot,” March 2007.

7/31/2019 Analysis of 3D Surface Data for on-line Determination of the Size Distribution of Iron Ore Pellet Piles on Conveyor …
http://slidepdf.com/reader/full/analysis-of-3d-surface-data-for-on-line-determination-of-the-size-distribution 127/130
References 113
[25] J. W. Tukey, Exploratory Data Analysis , ch. ”Box-and-Whisker Plots” 2C, pp. 39–43. Addison-Wesley, 1977. ISBN 0-201-07616-0.
[26] R. Ihaka and R. Gentleman, “R: A language for data analysis and graphics,” Jour-nal of Computational and Graphical Statistics , vol. 5, no. 3, pp. 299–314, 1996.http://www.r-project.org/.
[27] R. O. Duda, P. E. Hart, and D. G. Stork, Pattern Classication . Wiley, second ed.,2001. ISBN 0-471-05669-3.
[28] D. E. Johnson, Applied Multivariate Methods for Data Analysts . Duxbury Press,1998. ISBN: 0-534-23796-7.
[29] J. Tomick, S. Arnold, and R. Barton, “Sample size selection for improved nelder-mead performance,” in Proceedings of the Winter Simulation Conference , pp. 341–345, 1995.
[30] J. Franklin and T. Katsabanis, eds., Measurement of Blast Fragmentation – Pro-ceedings of the FRAGBLAST 5 Workshop , Balkema, 1996.
[31] AusIMM, Explosives in Mining Conference , (Hunter Valley, NSW, Australia), Oc-tober 2001.

7/31/2019 Analysis of 3D Surface Data for on-line Determination of the Size Distribution of Iron Ore Pellet Piles on Conveyor …
http://slidepdf.com/reader/full/analysis-of-3d-surface-data-for-on-line-determination-of-the-size-distribution 128/130

7/31/2019 Analysis of 3D Surface Data for on-line Determination of the Size Distribution of Iron Ore Pellet Piles on Conveyor …
http://slidepdf.com/reader/full/analysis-of-3d-surface-data-for-on-line-determination-of-the-size-distribution 129/130

7/31/2019 Analysis of 3D Surface Data for on-line Determination of the Size Distribution of Iron Ore Pellet Piles on Conveyor …
http://slidepdf.com/reader/full/analysis-of-3d-surface-data-for-on-line-determination-of-the-size-distribution 130/130