Embed Size (px)
Citation preview

ANALYSIS OF 2009 ENR BEST PROJECTS IN TEXAS TO DETERMINE THE
IMPACT OF PROJECT DELIVERY SYSTEM USED
A Thesis
by
NAVANEETHAN RAJAN
Submitted to the Office of Graduate Studies of Texas A&M University
in partial fulfillment of the requirements for the degree of
MASTER OF SCIENCE
December 2010
Major Subject: Construction Management

Analysis of 2009 ENR Best Projects in Texas to Determine the Impact of Project
Delivery System Used
Copyright 2010 Navaneethan Rajan

ANALYSIS OF 2009 ENR BEST PROJECTS IN TEXAS TO DETERMINE THE
IMPACT OF PROJECT DELIVERY SYSTEM USED
A Thesis
by
NAVANEETHAN RAJAN
Submitted to the Office of Graduate Studies of Texas A&M University
in partial fulfillment of the requirements for the degree of
MASTER OF SCIENCE
Approved by:
Chair of Committee, James Smith
Committee Members, Boong Yeol Ryoo Michael O‟Brien Head of Department, Joe Horlen
December 2010
Major Subject: Construction Management

iii
ABSTRACT
Analysis of 2009 ENR Best Projects in Texas to Determine the Impact of Project
Delivery System Used. (December 2010)
Navaneethan Rajan, B.Arch., Maulana Azad National Institute of Technology
Chair of Advisory Committee: Dr. James Smith
Competitive Bidding, Competitive Sealed Proposal, construction management agency,
construction management at risk, Design-Build, Design-Build-Bridging, and job order
contracting are seven project delivery methods that are commonly used in the state of
Texas today. This paper empirically compares the cost, schedule, and change order
management performance of these project delivery methods in 2009 Engineering News
Record (ENR) Best Construction Projects in Texas, using the data collected from the
projects representative of the population. Also information is collected on lessons
learned from these projects. The thesis included development of survey instrument,
getting approval from Institutional Review Board (IRB), data collection from the
industry, statistical analysis and inferences. Based on the data collected, project
performances were measured in terms of five identified variables and then plotted in the
form of probability distribution curves to understand the characteristics of the target
population. Then, the results were grouped into six categories based on project delivery
methods used and compared to understand their impacts on these projects. Findings
revealed predominant usage of CM at Risk PDM, and better cost and schedule
performance of CM at Risk, Design-Build, and Owner customized PDM. Detailed
performance metrics, results, interpretations and conclusions are presented.

iv
DEDICATION
I dedicate this work to my parents Rajan P and Santhana Lakshmi R.

v
ACKNOWLEDGEMENTS
I would like to thank my committee chair, Dr. James Smith, for his excellent academic
guidance and help in data collection. Without his help, this thesis would not have been in
its current shape. The support offered by my committee members, Dr. Boong Yeol
Ryoo, and Prof. Michael O‟Brien, is also appreciated. I also acknowledge the help and
advice provided by Prof. Eustace, Dr. Solis, and other faculty members of the
Construction Science Department, TAMU.
I offer special thanks to my friends, Anindya, Ashwin, Payal, Trupti, Sruti and Kumar,
for making my time at Texas A&M University a great experience. I also want to extend
my gratitude to McGraw-Hill Construction for providing the required information and
permission for conducting this research and to all the construction companies that
participated in this thesis.
Finally, thanks to my mother and father for their love and support, and to my brothers,
Saravanan and Vignesh, for their encouragement.

vi
TABLE OF CONTENTS
Page
ABSTRACT .......................................................................................................... iii
DEDICATION....................................................................................................... iv
ACKNOWLEDGEMENTS ................................................................................... v
TABLE OF CONTENTS ....................................................................................... vi
LIST OF FIGURES ............................................................................................... viii
LIST OF TABLES ................................................................................................. x
CHAPTER
I INTRODUCTION AND OBJECTIVES ............................................ 1 Research Background .................................................................. 1 Research Objectives ..................................................................... 3 II LITERATURE REVIEW .................................................................. 5
Project Delivery Systems – CMR, DBB and D-B ......................... 5 Predicting the Performances of Project Delivery Systems: D-B, and DBB ...................................................................................... 7 III ENR BEST PROJECTS ..................................................................... 11
Submission Process...................................................................... 12 Appraisal and Award ................................................................... 13 IV RESEARCH METHODOLOGY ....................................................... 14 Data Collection ............................................................................ 14 Data Analysis............................................................................... 17
vii
CHAPTER Page V RESULTS AND DISCUSSIONS ...................................................... 22
Data Limitations ......................................................................... 22 Inference on 2009 ENR Best Projects - Texas .............................. 22 Trends of Usage of Project Delivery Methods (PDM) .................. 28 Comparison of Projects with Different PDM ................................ 29 Lessons Learned .......................................................................... 34
VI CONCLUSIONS, LESSONS LEARNED, AND RECOMMENDATIONS .................................................................. 36
Summary ..................................................................................... 36
Conclusions ................................................................................. 37 Recommendations ........................................................................ 37
REFERENCES ...................................................................................................... 39
APPENDIX A ....................................................................................................... 41
APPENDIX B ........................................................................................................ 47
APPENDIX C ........................................................................................................ 58
APPENDIX D ....................................................................................................... 64
VITA ..................................................................................................................... 67

viii
LIST OF FIGURES
Page Figure 1 Probability Distribution and Cumulative Probability of Unit Cost. ...... 23 Figure 2 Interval Estimate for Unit Cost Mean μ with a Significance Level of 95% .................................................................................................... 23 Figure 3 Probability Distribution and Cumulative Probability of Cost Growth... 24 Figure 4 Interval Estimate for Cost Growth Mean μ with a Significance Level of 95% ................................................................................................ 24 Figure 5 Probability Distribution and Cumulative Probability of Delivery Speed .................................................................................... 25 Figure 6 Interval Estimate for Delivery Speed Mean μ with a Significance Level of 95%. ................................................................................................... 25 Figure 7 Probability Distribution and Cumulative Probability of Schedule Growth ................................................................................................ 26 Figure 8 Interval Estimate for Cost Growth Mean μ with a Significance Level of 95% .................................................................................................... 26 Figure 9 Probability Distribution and Cumulative Probability of Builder Satisfaction ......................................................................................... 27 Figure 10 Interval Estimate for Builder Satisfaction Mean μ with 95% Significance Level............................................................................... . 27 Figure 11 Percentage Distribution of Usage of Different PDM ............................ 28 Figure 12 Comparison of Unit Costs of Projects with Different PDM.................. 29 Figure 13 Comparison of Cost Growth of Projects with Different PDM .............. 30 Figure 14 Comparison of Delivery Speed of Projects with Different PDM .......... 31 Figure 15 Comparison of Schedule Growth of Projects with Different PDM ....... 31

ix
Page Figure 16 Comparison of Builder Satisfaction with Different PDM ..................... 32 Figure 17 Comparison of Realization of X for Different PDM ............................ 33 Figure 18 Comparison of Realization Y for Different PDM ................................ 33 Figure 19 Comparison of Realizations of Z for Different PDM ........................... 34

x
LIST OF TABLES
Page
Table 1 Summary of Mean Values of Principal Metrics ................................... 36
Table B-1 List of 2009 Engineering News Record Best Projects in Texas and
Their Builders ..................................................................................... 47
Table C-1 Summary of Survey Responses ........................................................... 58
Table C-2 Calculated Values of Five Variables .................................................... 60
Table C-3 Values of Realization of X, Y, and Z ................................................... 62

1
CHAPTER I
INTRODUCTION AND OBJECTIVES
Research Background
The use of project delivery systems in the construction industry has changed driven by
changes in owner expectations and government policies. Traditionally, Design-Bid-
Build was the project delivery method (PDM) used by most of the private owners and all
public owners. As more and more research findings demonstrated the improved
performance of construction projects using alternative project delivery methods like
Design-Build and Construction Management at Risk, the government opened many
options for the public owners in selecting Project Delivery Methods. Since the Senate
Bill 1 (SB1) and Senate Bill (SB583) in 1996/1998 passed, most public owners in Texas
can use any of the following seven project delivery methods (Beville, Smith & Peterson,
2007),
1) Competitive Bidding (DBB): In this PDM, the owner has separate contracts with
designer and builder. The only criterion for builder selection is “lowest
construction cost”. Procurement of the builder happens after completion of
design documents (Konchar, M. & Sanvido, V. 1998)..
2) Competitive Sealed Proposals (CSP): This PDM is same as Competitive Bidding
(DBB), except the criteria for builder selection. Procurement of builder is done
on the basis of “Best Value”.
____________ This thesis follows the style of International Journal of Construction Education and
Research.

2
Best value is a procurement method in which qualifications, design (where
applicable) and price or cost are weighed to select designer or constructor that
brings greatest value to the owner (AGC, 2004).
3) Construction Management, Agency (CMA): CMA helps the owner in
designer/builder selection process; administration; and management services
(Beville, Smith & Peterson, 2007). CM Agents represents the owner during the
project and the CMA does not take any construction risk.
4) Construction Management at Risk (CMR): In this PDM, the owner has separate
contracts with constructor and designer. Typically CMR provides pre-
construction services including evaluation of costs, schedule, materials and
alternative design implications. CMR guarantees construction cost and schedule.
Selection of constructor is done on the basis of “Best Value” (AGC, 2004).
5) Design-Build (D-B): In D-B, the owner has a single contract with the Design-
Builder for both design and construction services. Selection is based on
Qualifications or “Best Value”.
6) Design-Build-Bridging (D-B-B): This method is same as Design-Build, but a
bridging architect or consultant helps the owner in developing its requirements or
program and to help communicate those requirements to the Design-Builder.
7) Job Order Contracting (JOB): This PDM is used for the works of recurring nature
with indefinite delivery times, type and quantities. Pricing is done on the basis of
Unit Price Book specified by Government entities; and the bidding occurs on the
basis of contractor specified “coefficient” or “multiplier”. Contractor selection is
based on “Best Value” (Beville, Smith & Peterson, 2007).
With this wide range of options, it is crucial for an owner (both public and private) to
select an appropriate project delivery method for his project, to yield maximum benefits.
But, selecting the appropriate project delivery method for a project is a challenging task
for an owner, as it requires extensive data about performance of similar projects, in the

3
same geographical location and in the recent past. This data could be obtained from the
owner‟s own database or may depend upon studies conducted by research
scholars/organizations. So, continuous research studies on efficiency of different project
delivery methods are critical to help owners make educated decisions. This thesis is an
attempt to contribute towards this need.
In this thesis, the ENR best projects under different categories in the State of Texas, for
the year 2009, were analyzed for their performance under different variables and
compared with the project delivery methods used. Though ENR best projects are not
representative of all the construction projects in Texas, they represent successful projects
in the industry. The lessons learned from these projects would provide valuable data for
all owners and service professionals in the construction industry. Further, the statistical
results derived through this thesis would be helpful in identifying general patterns on all
identified variables and preferred project delivery systems in the industry. These
statistical results could then be used by owners for understanding how each project
delivery method performs, and their pros and cons. It will help in selecting appropriate
project delivery methods for new projects that could provide substantial quantitative and
qualitative benefits.
Research Objectives
The primary objective of this thesis is to measure the performance of 2009 ENR Best
Construction Projects in Texas and determine the impact of Project Delivery Systems
used. Achieving this involved two important steps. First, the performance of all the
projects was measured based on five key variables including unit cost, cost growth,
delivery speed, schedule growth, and builder satisfaction. Then the performance
measures were linked to the Project Delivery Systems used in respective projects to
understand their efficiency. These two steps helped to establish a relationship between
4
Performance and Delivery Methods of these projects. But, to achieve the first objective
completely, the effects of Change Orders on these projects needed to be analyzed and
presented along with the results.
“A Change Order is a written agreement between the owner, contractor and architect
upon a change in the work and any appropriate adjustment in the contract sum or the
contract time”, (Butler & Cushman, 1994). Change Orders may affect the performance
of projects considerably. In this thesis, efforts were made to measure effects of change
orders on the performance of 2009 ENR Best Projects in Texas and plot them on graphs
against Project Delivery Methods used. This help in understanding how effectively the
Change Orders had been managed through respective project delivery methods.
The second objective is to find out the preferred project delivery method(s) in the target
population. To achieve this, projects were categorized into different groups based on
project delivery methods used. Then pie charts were created reflecting the percentage
distribution of usage of different Project Delivery Systems. This help understanding
current trends in the selection of project delivery methods in Texas.
The third and final objective is to identify lessons learned from the inputs provided by
the builders of 2009 ENR Best Construction Projects in Texas. The data required to
accomplish this objective, were collected through online surveys from the contractors of
those projects.

5
CHAPTER II
LITERATURE REVIEW
Various research is being conducted in the fields of performance analysis of construction
projects and project delivery methods. A background study on related research studies
was conducted to understand common practices in the similar fields of research. Further,
information was collected on current trends, data collection strategies, survey instrument
design, data analysis methods, and inference mechanics. It provided an overall idea of
what to expect from the research. Some of the most relevant literature is discussed in
brief below.
Project Delivery Systems: CMR, D-B, and DBB
Introduction
This study was conducted by a group of researchers in the Construction Industry
Institute (CII) in the year 1997 in United States of America. It was published in research
summary 133-1 by the Bureau of Engineering Research, University of Texas, Austin.
(Champagne, 1997).
Objectives
The primary objective of this research was to aid industry in selecting proper delivery
methods for the construction projects based on extensive quantitative statistical analysis.

6
Research Methodology
To represent all the construction projects that were completed between the years 1990
and 1997 in the United States of America, data had been collected from a sample set of
351 randomly selected projects. The size of the projects studied range between 50,000SF
and 2,500,000 SF. Also to understand the project performance in the proper context,
projects were categorized into six divisions based on the type of facility; 1) Light
industrial buildings; 2) Multi-storey dwellings; 3) Simple general buildings; 4) Complex
general buildings; 5) Process/heavy manufacturing facilities; and 6) Technology
projects.
Five variables were identified for measuring the performance of projects and all data that
were required to determine the value of those variables were collected through surveys.
Those variables are, Cost growth, Schedule growth; Construction speed; Intensity, and
5) Quality of the Project. After data collection, initial analysis for central tendency was
conducted to confirm the existence of differences between the mean, median and mode
values. Then, hypothesis testing was used to measure the strength of evidence in the data
for or against precise statements about population characteristics. Two sample t-tests and
Mood‟s median tests allowed the researcher to test significance between numbers of
critical metrics at a significance level of 95 percent.
Findings
Following are the findings of this research study,
1) D-B had the least cost-growth (2.17%) in comparison to DBB (4.83%) and CMR
(3.37%).
2) D-B and CMR had 0% schedule growth while the DBB had 4.4%.

7
3) The median construction speed of the D-B projects was 10.9% faster than the
CMR projects and 77% faster than DBB projects.
4) The intensity [($/SF.)/month] of D-B projects were 1.12% greater than CMR
projects and 2.12% greater than DBB projects.
5) D-B scored higher than CMR and DBB in all categories of quality analysis.
Conclusions
With the above findings, researchers concluded that there was a significant difference in
the performance of the construction projects based on the project delivery methods used.
Also they suggested the industry could utilize the findings of this research to choose the
appropriate project delivery method for their projects based on the specific project
requirements.
Relevance to My Thesis
This study helped in understanding the data collection strategies and data analysis
methods. Also it gave an idea on how to compare different project delivery methods and
what to expect from the analysis.
Predicting the Performances of Project Delivery Systems: D-B, and DBB
Introduction
This study was conducted by researchers Florence Yean Yng Ling, Swee Lean Chan,
Edwin Chong, and Lee Ping Ee in Singapore. The study was completed in the year 2004
in Singapore (Ling,F., Chan, S.L., Chong, E. & Ee,L., 2002)

8
Objectives
The primary objectives of this research were to find explanatory variables that
significantly affect project performance and to construct models to predict the
performance of Design-Build (D-B) and Design-Bid-Build (DBB) Projects.
Research Methodology
The target population of the study was all construction projects that were completed
between 1992 and 2002 in Singapore with project cost exceeding $5 million. To
represent the whole population, data was collected from 400 sample projects that were
selected randomly.
In the list of the 400 projects, many consultants and contractors had undertaken multiple
projects. So, a decision was made to request each firm to provide information on a
maximum of three projects, to avoid fatigue. Sixty contractors were therefore selected to
provide information of 180 projects, 57 consultants to provide information of 171
projects, and the balance 49 projects were requested from 40 owners. 35 owners were
asked to provide information on one project each, one owner to provide information of
two projects, and four owners to provide information of three projects each. Fewer
questionnaires were sent to owners because past research experience showed that very
few of them respond to surveys in Singapore. Data was received from the respondents
through interviews/self-administered questionnaires. After the completed questionnaires
were received, multiple linear regression modeling was undertaken to construct models
to predict each of the 11 project performance measures identified. Further validation was
done with data collected subsequently.
The eleven identified variables to measure project performance were: 1) Unit cost
(dollars/m2); 2) Cost Growth (%); 3) Intensity (dollars/m2/month); 4) Construction

9
Speed (m2/month); 5) Delivery Speed (m2/month); 6) Schedule Growth (%); 7)
Turnover Quality (in scale of 1 to 5); 8) System Quality (in scale of 1 to 5); 9)
Equipment Quality (in scale of 1 to 5); 10) Owner‟s Satisfaction (in scale of 1 to 5); and
11) Owner‟s Administrative burden (in scale of 1 to 5).
Findings
Below provided are the findings of this research study,
1) The delivery speed of DBB projects can be predicted using just two variables:
gross floor area and the contractor‟s design capability.
2) The delivery speed of D-B projects can be predicted using four variables: gross
floor area, level of project scope completion when bids are invited, extent to
which contract period is allowed to vary during bid evaluation and level of
design completion when budget is fixed.
3) The construction speed of DBB projects can be predicted using two variables:
gross floor area and adequacy of the contractor‟s plant and equipment.
4) The construction speed of D-B projects can be predicted using two variables:
gross floor area and extent to which contract period is allowed to vary during bid
evaluation.
Conclusions
The regression models developed using this study can be utilized to predict certain
performance aspects of DBB and D-B projects and hence can be used to decide upon
Design-Build and Design-Bid-Build project delivery system in terms of all eleven
variables identified in the study.

10
Relevance to My Thesis
One of the primary objectives of this study was to find explanatory variables that
significantly affect performance of construction projects. The eleven variables identified
in this study provided an understanding of what parameters need to be measured in
analyzing the performance of projects.
Further, the process of constructing a regression model in this research involved detailed
performance analysis of projects that were being studied. The data collection strategies
and analysis methods used here were helpful in setting a model for my thesis on 2009
ENR Best Construction projects.
11
CHAPTER III
ENR BEST PROJECTS
Engineering News Record is a weekly magazine that provides news, analysis, data and
opinion for the construction industry worldwide. It is owned by The McGraw-Hill
Companies. The magazine covers business management, design, construction methods,
technology, safety, law, environment, legislation and labor issues (Engineering News
Record, 2010).
Engineering News-Record ranks and publishes the largest construction and engineering
firms annually, based on their gross revenues. The rankings are carried out for U.S and
international firms separately. Its „Construction Economics‟ section covers the cost
fluctuations of a wide range of building materials. It also provides various annual awards
for individuals and newsmakers who best serve the interests of the construction industry
and the public (Engineering News Record, 2010).
Every year Engineering News Record selects a group of projects as best projects from
multiple regions of the country. The selections are made from wide categories of
projects that got completed in that particular year and in that particular region. The
selection process involves submission of projects by companies operating in those
regions, appraisal of those projects, and announcement/award. In Texas region, the list
of selected projects gets published in Texas Construction Magazine (Texas Construction,
2010).

12
Submission Process
In the submission stage, Engineering News Record accepts projects under each of the
following nineteen categories,
1) Civil/Public Works,
2) Cultural ,
3) Government/Public,
4) Green Building,
5) Health Care,
6) Higher Education / Research,.
7) Industrial ,
8) Interior Design/Tenant Improvement,
9) K-12 Education,
10) Landscape/Urban Design,
11) Multi-Family Residential/Hospitality,
12) Office ,
13) Renovation/Restoration,.
14) Retail,
15) Small Project,
16) Specialty Contracting,
17) Sports/Recreation ,
18) Transportation ,
19) Worship.
Construction companies that are practicing in that particular region are encouraged to
submit the best of their projects in that particular year with a brief about the project‟s
uniqueness and specialties in a specified format. The companies are usually encouraged
to submit multiple entries and to compete under multiple categories. Once the submittals
are received, they are compiled and formatted for the appraisal stage. List of names of all

13
151 projects that got submitted in 2009 ENR Best Projects in Texas and their builders
can be found in Appendix B (Table B-1).
Appraisal and Award
The projects received are evaluated by a panel of judges that are recruited by
Engineering News Record. The criteria for evaluation includes the following seven
topics,
1) Teamwork and Project Management
2) Safety
3) Innovation
4) Contribution to the Community or Industry
5) Overcoming Unique or Difficult Challenges
6) Construction Quality and Craftsmanship
7) Function and Aesthetic Quality of the Design
The percentage of points allotted to each of the above topics is only known to the judges.
So, the companies submitting the projects have to give equal importance to all the seven
topics or have to make an educated guess based on the category in which it is competing.
Then based on the data submitted by the companies, every judge in the panel evaluates
the projects individually and assigns a score to them. Once that process is over, the
individual scores of the judges are averaged to arrive at a final score for each of the
projects. Based on this final score, best projects are then selected under each of the
nineteen categories mentioned above.

14
CHAPTER IV
RESEARCH METHODOLOGY
Data Collection
Analyzing the performance of 2009 ENR Best Projects in Texas required a large
quantity of reliable data; and collecting that data was one of the major challenges of this
thesis. The literature reviews suggested three ways to collect data essential for the
performance analysis of projects; 1) online surveys, 2) phone interviews, and 3) paper
based surveys. Considering the large amount of data required, online survey was chosen
for this thesis due to its ease of distribution, faster response rate, lower cost, and
effectiveness ( 2004, Granello & Wheaton).
Survey Instrument Design
A copy of the survey instrument used for this thesis can be found at Appendix A.
The complete survey instrument and the research proposal was evaluated and approved
by Institutional Review Board (IRB), before sending to the project participants of 2009
ENR Best Projects in Texas. The design of this survey instrument had three main
intentions:
1) The survey should take minimum effort and time from the participants,
2) The data collected has to be accurate and reliable, and
3) The data collected should be sufficient to achieve all the three objectives of the
research.

15
To satisfy these intentions, sufficient care was taken to make the survey self-
explanatory. Most of the questions were set in the format of multiple choice or single
word answers, to make the responding process easier. Explanations were provided
wherever it was necessary. Once the participant completed the on-line survey form,
he/she were able to submit the response with just a click of a tab at the end of the survey.
The survey was built with three sections. The first section collected general information
about the project participant, organization and the project. The details received from first
section were not necessary to achieve any of the three research objectives, but helped to
establish reliability factor to the entire data set. In case of confusions or shortage of
details, the particular person who completed the survey could be contacted for more
explanation and details.
The second section had questions designed to receive project specific information which
covered the following five topics,
1) Project Delivery Method,
2) Project Size,
3) Project Start/ Completion Dates,
4) Change Orders, and
5) Project Cost.
The questions were focused on collecting information that was necessary to understand
the trends of usage of project delivery methods and to measure the value of the five
identified variables; and hence analyzing the performance of the projects.
The third and final section of the survey was centered on “Lessons Learned” from these
projects. This section enabled the project participants to share important information that
were difficult to explain merely through numbers or single text answers. The inputs

16
received from this section were compiled and presented in this thesis, which provides an
opportunity to learn from some of the most successful projects in the industry.
Data Collection Process
The next step after survey instrument design was to get the surveys completed by
appropriate persons, which involved the following steps:
1) Collecting the list of names of all 151 projects that were submitted for the 2009
ENR Best Projects in Texas and the builders of those projects. With the
permission of McGraw-Hill Construction, these two data were obtained from a
document containing information of all projects that were submitted for
appraisal.
2) Reorganizing the above details in a database that lists the name of all
construction companies and links it with the projects submitted by them.
3) Establishing key contacts with the construction companies who then helped
identifying persons in their organizations who were participants of the best
project(s) built by their companies.
4) Contacting prime participants of best projects with the details of the research and
a request to complete the online survey.
5) Providing more information and clarification if required by the participants
through online survey response.
After receiving the responses, emails were sent to all respondents thanking them for their
participation in the thesis. Also, once the research was completed, a copy of the final
report was sent to the participants who opted to receive it.
17
Data Analysis
A copy of survey results and the calculated values of variables are provided in Appendix
C (Table C-1 and Table C-2).The data received from the companies were used to
measure the mean values of five identified variables and efficiency of change order
management in these projects. A spreadsheet was programmed with built-in formulas to
carry out these tasks.
Measurement of Sample Set
Five variables had been identified in this research which significantly affects the
performance of the projects that are being studied. To measure the performance of these
projects, values of these variables need to be quantified. Below are the formulas that
were used to calculate those values:
1) Unit Cost ($/SF): Construction cost in US Dollars that was required to build one
square foot of the facility. It was calculated by using the formula
a. Unit Cost = As-Built Construction Cost / Size of the Facility in SF
2) Cost Growth (%): A percentage value that signifies the increased cost of the
project as compared to the contracted cost. It was computed by using the
formula,
a. Cost Growth = (Contracted construction cost - As-built construction cost) /
Contracted construction cost
3) Delivery Speed (SF/month): This is the average SF area of the facility was built
in thirty days increments of the project. This was calculated by utilizing the
below given formula,
a. Delivery Speed = Size of the Facility in SF / (As-built duration in days/30)
18
4) Schedule Growth (%): A percentage value that denotes the increased duration of
the projects in comparison with the as-planned duration. This was computed by
using the following formula,
a. Schedule Growth = (As-planned duration in days - As-built duration in days)
/ As-planned duration in days
5) Builder‟s Satisfaction: This is a scaled measure (1 to 5) of satisfaction of the
project participants with the project delivery methods used. The inputs were
given by participant itself through survey responses.
Projects with a value for each of the above five variables can be compared with other
such projects in the industry for its overall performance. But, it is important to
understand that there also exist some other factors that can possibly affect performance
of any projects. One of those factors is “Change Orders”. “A Change Order is a written
agreement between the owner, contractor and architect upon a change in the work and
any appropriate adjustment in the contract sum or the contract time.” (Cushman &
Butler, 1994).
A project‟s performance can be affected by both “cost of change orders” and “number of
change orders issued”. Even if one of these two is less and other is high, there could be a
considerable impact on the cost and schedule of the project. So, in this thesis an effort
has been made to measure, how efficiently each of these projects had handled the
Change Orders. Following are some formulas that has been used to achieve this task,
X = (Estimated Cost + Cost of Change Order - Final Cost)/1000
Function X is formulated to measure the impact of “Cost of Change Orders”
on the final cost of these projects. The higher the value of realization of X,
the better the project performed in terms of cost and change order
management.
Y = X * [1+ (no. of Change Orders)]

19
Function Y is formulated to measure the impact of “Number of Change
Orders” on the final cost of these projects. The higher the value of realization
of Y, the better the project performed in terms of cost and change order
control/management.
Z = [(As Built Duration - As Planned Duration) / (1+no. of Change Orders)] * 10
Function Z is devised to measure the impact of “Number of Change Orders”
on the duration of these projects. The lower the value of realization of Z, the
better the project performed in terms of schedule and change order
management.
The values of realization of functions X, Y, and Z for the sample set can be found in
Appendix C (Table C-3). The impact of other factors was considered negligible and not
measured for the purpose of this thesis.
Inference on Population of Interest
The values achieved through above measurements depict the performance of individual
projects for which the data had been received (i.e., the sample set). To understand the
central tendencies about the whole 2009 ENR Best Projects (i.e., the target population),
inference needed to be made with appropriate statistical methods. Below provided are
the statistical methods used in this thesis.
Probability Distribution
Probability distribution is defined as “a graph that describes the range of possible values
that a random variable can attain and the probability that the value of the random
variable is within any measurable subset of that range” (Ott & Longnecker, 2001).
Plotting this graph required estimated values of population mean “μ” and standard
deviation “σ” which were calculated approximately with the sample mean “x̄ ” and

20
standard deviation of the sample set “s” respectively. It is used to estimate the mean
values and the distribution of all variables of the 2009 ENR Best Projects. This method
allowed to estimate the required values with significant level of confidence. Following
are some of the formulas that were utilized in this thesis,
z = Standard Score or Normal Score
= ( x- μ) / σ
μ = Population Mean
Interval Estimate of μ = {[ x̄ - (zα/2 *σx̄ )], [ x̄ + (zα/2 *σx̄ ) ]}
Where,
x = Random Variable
x̄ = Mean of the Sample Set
= (x1+ x2+ x3…+ xn) / n
s = Standard Deviation of the Sample Set
(in this case used as a substitute for σ)
= {Σni=1 [ (xi - x̄ )2 / (n-1)] } ^1/2
σx̄ = σ / n
zα/2 = Upper α/2 point of standard normal distribution
α = Significance level (in this case it is 0.05)
In the above formulas, “n” represents the size of sample set and xi, x1, x2, x3 etc.,
represents the values of random samples.
The normal distribution curves and the interval estimate curves presented in this thesis
were plotted using “Graphing Normal Distribution Excel File” downloaded from
“vertex42.com” (Witter, J.W. 2004).

21
Bar Charts and Pie Charts
Bar charts are used to compare the mean and median values of variables of projects with
different project delivery systems. Also it is used to compare the effectiveness of project
delivery systems in change order management. Pie charts are used to demonstrate the
trends of usage of project delivery systems in the industry and its percentage
distributions.

22
CHAPTER V
RESULTS AND DISCUSSIONS
Data Limitations
The data collected on thirty two projects through online survey instrument were
sufficient to make inference on the characteristics of target population with 95% level of
confidence. However, for comparisons of performances of different project delivery
methods (PDM), significance testing was not performed due to limited availability of
projects under each PDM. The comparisons presented in this thesis are done with the
mean and median values of the variables calculated from the projects in the sample set.
Other limitations include the possible effects of external factors on the unit cost
calculations. These effects might be caused by variations in the scale of the projects, or
type of the projects. Suggestions for minimizing these effects in future studies are
presented in the recommendations section of this thesis.
Inference on 2009 ENR Best Projects-Texas
Probability distribution curves and interval estimate curves were used to infer the
characteristics of the population from the mean and median values obtained from the
sample set data. Errors were minimized by carefully detecting and omitting the outliers
in the sample set. The significance level of the inferences made on population
characteristics is 95%; which means that “in repeated sampling, 95% of the time the
intervals computed with the same function will contain mean μ, although the intervals
themselves are changing” (Ott & Longnecker, 2001).

23
Unit Cost ($/SF)
The cumulative probability curve (Figure 1) explains the probability of getting a unit
cost less than or equal to any randomly selected value. For example the probability of
getting a unit cost value of $118/SF or less is 13.57%.The calculated mean cost of the
population is $182.03/SF and is predicted with a confidence of 95% to lie between
$156.23/SF and $207.83/SF (Figure 2). With a standard deviation of 57.68, the
probability distribution curve of unit cost predicts the probability of a randomly selected
variable to lie between $108/SF and 256 $/SF as 80%.
9.68%0
0.1
0.2
0.3
0.4
0.5
0.6
0.7
0.8
0.9
1
1.1
0
0.001
0.002
0.003
0.004
0.005
0.006
0.007
0.008
-200 0 200 400 600
Cum
ula
tive P
robability
Pro
bability D
ensi
ty
Unit Cost in Dollars Per SF
Figure 1: Probability distribution and cumulative probability of unit cost.
0
0.005
0.01
0.015
0.02
0.025
0.03
0.035
0 50 100 150 200 250 300
Unit Cost Mean in Dollars per SF
Figure 2: Interval estimate for unit cost mean μ with a significance level of 95%.

24
Cost Growth (%)
The cost growth percentage of the 2009 ENR Best Projects was less with a mean value
of 2.12 and standard deviation of 4.62. The distribution curve predicted the probability
for getting a randomly selected project to have a cost growth value lie between -3.8%
and 8.04% as 80% (Figure 3). The portion of distribution curve with negative values
signifies the probability of a randomly selected project to get completed with a cost less
than or equal to the contracted construction cost; which is 32.3%. Interval estimate for
the mean cost growth is shown in Figure 4.
10.03%0
0.1
0.2
0.3
0.4
0.5
0.6
0.7
0.8
0.9
1
1.1
0
0.01
0.02
0.03
0.04
0.05
0.06
0.07
0.08
0.09
0.1
-20 -10 0 10 20 30
Cum
ula
tive P
robability
Pro
bability D
ensi
ty
Cost Growth in Percentage
Figure 3: Probability distribution and cumulative probability of cost growth.
00.050.1
0.150.2
0.250.3
0.350.4
0.45
-4 -2 0 2 4 6 8
Mean Cost Growth in Percentage
Figure 4: Interval estimate for cost growth mean μ with a significance level of 95%.

25
Delivery Speed (SF/month)
The delivery speed of the target population has a mean of 8379SF/month with a high
variance of 5,338 (Figure 5). The 80% of the probability curve is spread between the
values of 1,550 and 15,208 square foot per month of delivery speed. The interval
estimate for the mean is calculated as 6,200-10,558 square foot per month, with a
confidence of 95% (Figure 6).
10.03%0
0.1
0.2
0.3
0.4
0.5
0.6
0.7
0.8
0.9
1
1.1
0
0.00001
0.00002
0.00003
0.00004
0.00005
0.00006
0.00007
0.00008
-20000 -10000 0 10000 20000 30000 40000
Cum
ula
tive P
robability
Pro
bability D
ensi
ty
Delivery Speed in SF per Month
Figure 5: Probability distribution and cumulative probability of delivery speed.
0
0.00005
0.0001
0.00015
0.0002
0.00025
0.0003
0.00035
0.0004
0 2000 4000 6000 8000 10000 12000 14000
Delivery Speed Mean in SF per Month
Figure 6: Interval estimate for delivery speed mean μ with a significance level of 95%.

26
Schedule Growth (%)
Majority portion of the probability distribution for schedule growth is located in the
negative side of the graph signifying the earlier completion date of majority of projects
(Figure 7). The probability distribution curve has a mean of -0.86 with a variance of
4.97. Based on the inferences made, the probability of a randomly selected project to get
completed on or before schedule is 56.87%. Interval estimate for the mean schedule
growth is presented in Figure 8.
10.03%0
0.1
0.2
0.3
0.4
0.5
0.6
0.7
0.8
0.9
1
1.1
0
0.01
0.02
0.03
0.04
0.05
0.06
0.07
0.08
0.09
-30 -20 -10 0 10 20 30
Cum
ula
tive P
robability
Pro
bability D
ensi
ty
Schedule Growth in Percentage
Figure 7: Probability distribution and cumulative probability of schedule growth.
00.050.1
0.150.2
0.250.3
0.350.4
0.45
-6 -4 -2 0 2 4
Schedule Growth Mean in Percentage
Figure 8: Interval estimate for schedule growth mean μ with a significance level of 95%.
27
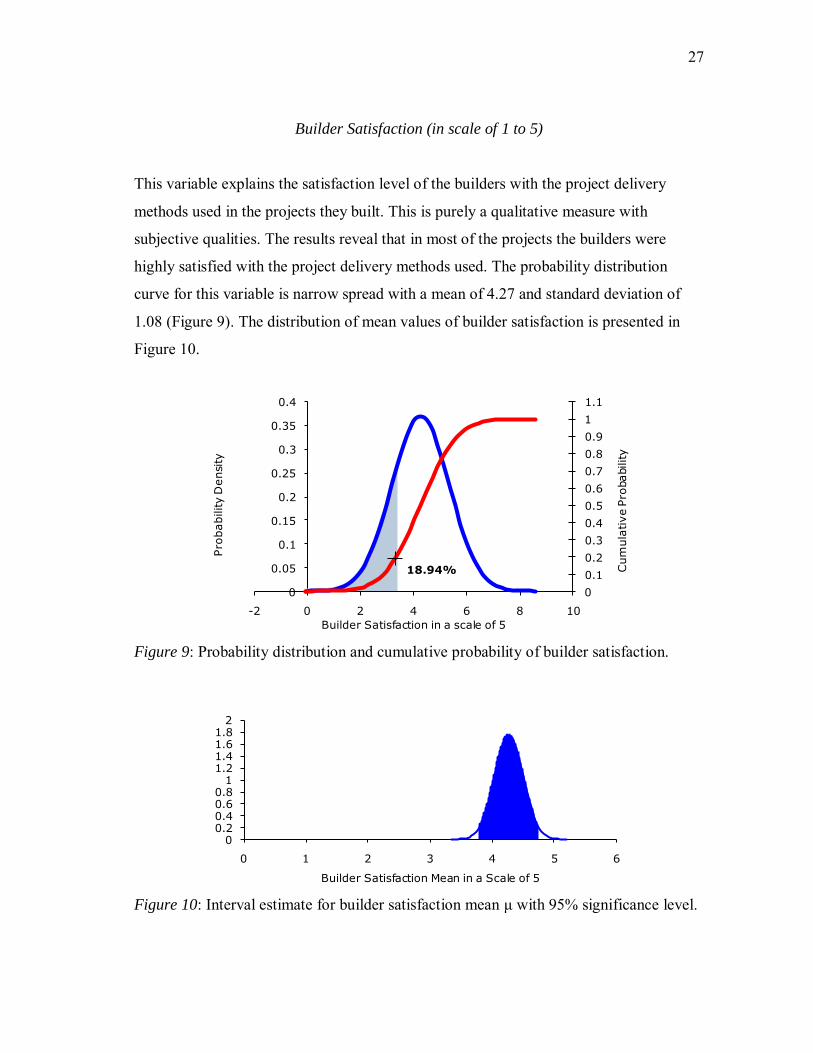
Builder Satisfaction (in scale of 1 to 5)
This variable explains the satisfaction level of the builders with the project delivery
methods used in the projects they built. This is purely a qualitative measure with
subjective qualities. The results reveal that in most of the projects the builders were
highly satisfied with the project delivery methods used. The probability distribution
curve for this variable is narrow spread with a mean of 4.27 and standard deviation of
1.08 (Figure 9). The distribution of mean values of builder satisfaction is presented in
Figure 10.
18.94%
0
0.1
0.2
0.3
0.4
0.5
0.6
0.7
0.8
0.9
1
1.1
0
0.05
0.1
0.15
0.2
0.25
0.3
0.35
0.4
-2 0 2 4 6 8 10C
um
ula
tive P
robability
Pro
bability D
ensi
ty
Builder Satisfaction in a scale of 5
Figure 9: Probability distribution and cumulative probability of builder satisfaction.
00.20.40.60.8
11.21.41.61.8
2
0 1 2 3 4 5 6
Builder Satisfaction Mean in a Scale of 5
Figure 10: Interval estimate for builder satisfaction mean μ with 95% significance level.

28
Trends of Usage of Project Delivery Methods (PDM)
The percentage distribution of usage of different project delivery methods (PDM) in the
target population is provided in the below given pie chart (Figure 11). Excluding CM at
Risk which was used in 62% of projects, the usage of other project delivery methods
were evenly distributed with values less than or equal to 10%. These findings clearly
imply the shift of trend towards CM at Risk PDM in Texas State.
10%
62%
7%
10%
4%7%
PERCENTAGE DISTRIBUTION
DBB
CMR
CSP
D-B
D-B-B
O
Figure 11: Percentage distribution of usage of different PDM.
Similarly, the study conducted by Kevin Beville in 2007 for his research project on
“Preferences for project delivery systems utilized by Texas public universities” find out
that, approximately 70-80% of the projects constructed in Texas public universities used
CM at Risk project delivery method for two consecutive years 2006 and 2007 (Beville,
Smith & Peterson, 2007).
These findings contradict the predictions made by Design-Build Institute of America
(DBIA) in 2005, which claimed the shifting of trend towards design-build PDM in
United States of America (Design Build Institute of America, 2005); which indicate the

29
need of further research studies in this field for finding the actual trend in the usage of
PDM in Texas and other States of America.
Comparison of Projects with Different PDM
For comparison purposes, the measured values of variables were grouped under six
categories based on the project delivery methods (PDM) used. Then the mean and
median values under each PDM were plotted in the form of column charts to compare
their effectiveness. Below provided are the graphs and discussions on the results of these
comparisons.
Unit Cost ($/SF)
0.00
50.00
100.00
150.00
200.00
250.00
300.00
350.00
400.00
450.00
DBB CMR CSP D-B D-B-B O
Project Delivery Method
Mean
Median
Figure 12: Comparison of unit costs of projects with different PDM.
The unit cost values ranged from approximately $100/SF for Competitive Sealed
Proposal projects to $400/SF for Competitive Bidding projects. Design-Build and CM at
Risk delivery methods were able to deliver projects with a median unit cost of
approximately $210/SF of building. Majority of Competitive Sealed Proposal projects

30
were renovations, which was the cause for the considerably low unit cost for that
category (Figure 12).
Cost Growth (%)
0.00
1.00
2.00
3.00
4.00
5.00
6.00
7.00
8.00
9.00
10.00
DBB CMR CSP D-B D-B-B O
Project Delivery Method
Mean
Median
Figure 13: Comparison of cost growth of projects with different PDM.
Competitive Bidding had the highest cost growth of around 9%; CM at Risk and Design-
Build had a median cost growth of approximately 4%; and the other project delivery
methods division had the lowest cost growth percentage with value close to 0.8%
(Figure 13).
Delivery Speed (SF/month):
Competitive Sealed Proposal delivered buildings at a pace three fold faster than the
Competitive Bidding, which delivered at the slowest rate. Design-Build and CM at Risk
were able to deliver projects at approximately same rate of speed and are second to the
Competitive Sealed Proposal which is the fastest in the group (Figure 14).

31
0
2000
4000
6000
8000
10000
12000
14000
16000
18000
20000
DBB CMR CSP D-B D-B-B O
Project Delivery Method
Mean
Median
Figure 14: Comparison of delivery speed of projects with different PDM.
Schedule Growth (%)
-10.00
0.00
10.00
20.00
30.00
40.00
50.00
60.00
DBB CMR CSP D-B D-B-B O
Project Delivery Method
Mean
Median
Figure 15: Comparison of schedule growth of projects with different PDM.
In general, most of the project delivery methods delivered the projects on or before the
as-planned project completion date. Design-Build-Bridging and Competitive Bidding
projects had more schedule delays than other project delivery methods used. Design-
Build was able to deliver projects in duration 4% less than planned (Figure 15). The

32
excessive schedule growth of D-B-B was due to major change orders in the specific
project from which the data had been collected. Since, it is the only project available in
that PDM, care should be taken before making major decisions about D-B-B based on
the results generated in figure 15.
Builder Satisfaction (in a scale of 1 to 5)
Except Competitive Bidding, builders that used other project delivery methods were
highly satisfied with their performance and effectiveness (Figure 16).
0.00
1.00
2.00
3.00
4.00
5.00
6.00
DBB CMR CSP D-B D-B-B O
Project Delivery Method
Mean
Median
Figure 16: Comparison of builder satisfaction with different PDM.
Change Order Management
Performance of projects depends on how effectively change orders were managed during
the project execution phase. Following are the results of the analysis of change order
management in 2009 ENR Best Projects-Texas organized according to the project
delivery methods used. The formulas used for the calculation of parameters x, y, and z
can be found in Chapter IV.

33
Functions “x” and “y” measure how effectively the final project cost was managed when
change orders were introduced. The higher the value of these parameters, the better the
project performed. In both cases projects under Design-Build, CM at Risk and other
project delivery methods performed better than the rest (Figure 17 & Figure 18).
0.00
50.00
100.00
150.00
200.00
250.00
300.00
350.00
400.00
DBB CMR CSP D-B O
Project Delivery Method
Mean
Median
Figure 17: Comparison of realizations of X for different PDM.
0.00
5000.00
10000.00
15000.00
20000.00
25000.00
30000.00
DBB CMR CSP D-B O
Project Delivery Method
Mean
Median
Figure 18: Comparison of realizations of Y for different PDM.

34
The effectiveness of the projects in controlling the schedule of the project when change
orders were introduced was measured with the function “z”. The lower the value, the
better the project performed. CM at Risk, Design-Build and other project delivery
method project performed better than the rest. Relatively less performed projects were
under Competitive Sealed Proposal category and better performed projects were under
CM at Risk category (Figure 19).
-100.00
-50.00
0.00
50.00
100.00
150.00
200.00
250.00
300.00
DBB CMR CSP D-B O
Project Delivery Method
Mean
Median
Figure 19: Comparison of realizations of Z for different PDM.
Lessons Learned
Construction Industry Institute (CII) defines Lessons Learned as “knowledge gained
from experience, successful or otherwise, for the purpose of improving future
performance” (CII, 2008). In this thesis, efforts were made to identify lessons learned
from the 2009 ENR Best Projects in Texas by getting inputs from the builders of these
projects. Based on their experience with the project delivery methods (PDM) used in
these projects, the builders were asked to provide suggestions for the future users of
these PDM to improve the project performance. The inputs / suggestions provided by the
builders of 2009 ENR Best Projects in Texas can be found in Appendix D. Following is

35
the summary of Lessons Learned from the 2009 ENR Best Projects in Texas based on
the inputs provided by the builders of these projects:
Construction Management at Risk (CMR): For CMR projects, having a good
contingency plan is essential to avoid adversarial situations in the course of the
projects; a good working relationship need to be maintained between architects,
builders and owners, involved in the projects for successful completion of
projects; and is important to thoroughly verify the contract terms and agreements
before the establishment of guaranteed maximum price (GMP) and execution of
contract, to achieve profitable venture for the builders.
Design-Build (D-B): D-B project delivery method is suitable for projects with
time constraints since it allows the start of construction while the design is still in
process without adding risk to the owner.
Design-Build-Bridging (D-B-B): For D-B-B projects the design related issues
must be resolved in the early phases of projects to finish the projects on time.
Other PDM (O): Prior relationship with the owners is critical for builders to win
projects that use owner customized project delivery methods like Sole Source.
Sole Source is a non-competitive purchase or procurement process that is accomplished
after soliciting and negotiating with only one source (RFP Templates, 2008).

36
CHAPTER VI
CONCLUSIONS, LESSONS LEARNED, AND RECOMMENDATIONS
Summary
The main objective of this thesis was to measure the performance of 2009 ENR Best
Projects in Texas and determine the impact of project delivery systems used. Other
minor objectives include finding the preferences of project delivery methods (PDM) in
the target population and to identify the lessons learned from the inputs provided by the
builders of these projects. The required data for the thesis were collected from the
builders of these projects through online surveys. Total survey responses summed to
thirty two, which were enough to statistically represent the target population of one
hundred and fifty one projects. A summary of findings of this research is provided in the
table below (Table 1).
Table 1
Summary of mean values of principle metrics
PDM
Unit
Cost
($/SF)
Cost
Growth
(%)
Delivery
Speed
(SF/month)
Schedule
Growth
(%)
Builder
Satisfaction
(1-5 Scale)
Change Order
Management
X (No Unit) Z (No
Unit)
DBB 392 8.95 5623 9.27 2.67 0.33 33.06
CMR 231 4.30 13238 0.17 4.25 360.02 -67.72
CSP 96 2.51 18185 3.69 4.00 0.00 270.00
D-B 212 3.46 13317 -3.53 4.67 335.10 -4.44
D-B-B 134 7.69 9984 48.87 4.00 - -
O 212 0.67 8499 -2.79 5.00 321.85 -2.68

37
Conclusions
The findings of the thesis obtained through statistical calculations, probability
distribution curves, bar charts, and lessons learned lead to the following conclusions on
the performance of 2009 ENR Best Construction Projects in Texas and the effect of
project delivery systems used:
1) CM at Risk was predominantly used as the preferred project delivery method in
2009 ENR Best Projects in Texas.
2) CM at Risk and Design-Build performed consistently better than other project
delivery methods in change order management. In most of the projects, these two
PDM were able to keep the cost and schedule under control when change orders
were introduced.
3) Projects that used Design-Build and owner customized project delivery methods
were able to be constructed in considerably less duration than the as-planned
durations.
4) The overall performance of projects that used Competitive Bidding (DBB) as
their project delivery method was considerably lower than other projects.
Recommendations
The conclusions achieved through this thesis on the performance of 2009 ENR Best
Projects in Texas can be utilized to understand how well some of the most successful
construction projects of the Texas State are performing and how their performance is
influenced by the project delivery methods used. However, to make inference on a larger
population, or other target population, more research studies are required. For future
studies, researchers are encouraged to use the survey instrument and research
methodology developed in this thesis.
38
Following are the recommendations for the future research studies in this field based on
the findings of this thesis:
1) More research studies are required to find out the actual trend in the preference
of project delivery methods (PDM) in Texas State and other States of America.
This will help the builders and designers in getting prepared for the changing
market needs and demands.
2) More studies are required to eliminate the possible effects of external factors
including, scale of projects, and type of projects, on their performance. To
achieve this, the study could be repeated by carefully selecting the target
population that contains projects from the specific type, or scale that need to be
studied.
3) More research studies are required to establish the mean and median performance
metrics for all seven project delivery methods used in Texas. For achieving this,
the study could be repeated for target populations that contain projects from the
specific project delivery method (PDM) that need to be studied.

39
REFERENCES
Associated General Contractors of America (AGC, 2004). Project Delivery Systems for
Construction (2nd edition). Arlington, Virginia: AGC.
Beville, K., Smith, J. & Peterson, J. (2007). Preferences for specific project delivery
systems utilized by Texas public universities. Retrieved October 10 from
http://ascpro0.ascweb.org/archives/cd/2009/paper/CPRT73002009.pdf
Champagne, A. (1997). Project delivery systems: CM at risk, design-build, design-bid-
build. Construction Industry Institute, 133 (1).
Construction Industry Institute (CII) (2008, July 18). Lessons Learned is Newest CII
Best Practise. Retrieved October 2010 from https://www.construction-
institute.org/news/ks_story.cfm?section=orders
Cushman, F. R. & Butler, S. D. (1994). Construction Change Order Claims. New York:
John Wiley & Sons, Inc.
Engineering News Record. About Us. Retrieved October 2010 from
http://enr.construction.com/aboutUs/contact/aboutus.asp
Granello, D.H., & Wheaton, J.E. (2004). Online data collection: Strategies for research.
Journal of Counseling & Development, 82, 387-393.
Konchar, M. & Sanvido, V. (1998). Comparison of U.S. project delivery systems.
Journal of Construction Engineering and Management, 124 (6), 435 – 444.

40
Ling,F., Chan, S.L., Chong, E. & Ee,L. (2002). Predicting performance of Design-Build
and design-bid-build projects. Journal of Construction Engineering and Management,
130 (1), 75 – 83.
Ott, R.L. & Longnecker, M. (2001). An Introduction to Statistical Methods and Data
Analysis (5th edition). Pacific Grove, California: Duxbury.
RFP Templates (2008, June 11). What is Sole Source? Retrieved October 2010 from
http://www.rfp-templates.com/What-is-Sole-Source.html
Texas Construction. Best of 2009 Texas. Retrieved October 2010 from
http://texas.construction.com/features/2009/1201_Bestof2009.asp
Witter, J.W. (2004, November 1). Graphing a Normal Distribution in Excel. Retrieved
October 2010 from http://vertex42.com/ExcelArticles/mc/NormalDistribution-
Excel.html

41
APPENDIX A
SURVEY INSTRUMENT
Analysis of 2009-ENR Best Projects, Texas
Introduction
This research is being conducted by Navaneethan Rajan, a graduate student from
Construction Science Department, Texas A&M University. Your participation in this
survey is critical for the successful completion of this thesis. For this thesis, three
different survey instruments have been designed for the purpose of collecting
information from each of the three primary project participants (Owner / Designer /
Constructor) of 2009 ENR Best Construction Projects. This particular survey is designed
for Constructors.
Research Objectives
This research has multiple objectives that can aid the construction industry. They are, 1)
To analyze the 2009 ENR Best Construction Projects in Texas and determine the impact
of project delivery systems used; 2) To understand the trends in the industry in selecting
project delivery methods for projects under each identified family of buildings in the
target data; 3) To collect, study and publish the lessons learned from the designers,
builders and owners of the 2009 ENR Best Construction Projects in Texas; and 4) To aid
Texas owners in selecting appropriate project delivery methods for new construction
projects, based on quantitative and statistical analysis of performance of similar projects
in the target data.

42
About This Survey
This survey has been designed carefully to minimize the effort and time required from
the participants. It has three sections and will take approximately 15 minutes to
complete. Below is a synopsis of contents of this survey: Section-I will collect general
information about the project and project participants; Section-II will collect project
specific details such as project delivery methods, project size, schedule, change orders
and project costs; Section-III will collect information on lessons learned from the
project.
I - General Information
Name of the Project *
Name of the Survey Participant *
Name of the Company / Organization *
Role Played in the Project *
II - Project Specific Information
This section will collect project specific details such as, 1) Project Delivery Method 2)
Project Size 3) Project Start/Completion Dates 4) Change Orders and 5) Project Costs
1) Project Delivery Method Used
For answering the question below, please refer the following narrative description of
different project delivery methods.

43
Competitive Bidding: Owner has two separate contracts with Designer and
Builder. Criterion for builder selection is lowest construction cost. Procurement
of builder happens after completion of design documents.
Competitive Sealed Proposal: Same as Competitive Bidding, except the criteria
for builder selection. Procurement of builder was done on the basis of Best value.
Construction Management Agency (CMA): CM agency help the owner in the
selection of designer and builder for the project. CM agency represent owner
during the project and does not take any risk.
Construction Management at Risk (CMR): Owner has separate contracts with
constructor and designer. Typically constructor provides pre-construction
services and guarantees construction cost and schedule. Selection of constructor
was done on the basis of Best Value.
Design-Build: Owner has single contract with the Design-Builder for both design
and construction service. Selection based on Qualification and Best Value.
Design-Build Bridging: Same as Design-Build. But, a bridging architect or
consultant helps the owner in developing its requirements or program and to help
communicate those requirements to the Design-Builder.
Others: Any other project delivery method different from the above mentioned
project delivery methods.
Project Delivery Method used in this Project *
Competitive Bidding
Competitive Sealed Proposals
Construction Management Agency (CMA)
Construction Management at Risk (CMR)
Design-Build
Design-Build Bridging

44
Other
If other, please specify.
2) Project Size
Area of New Construction *In Square Feet
Area of Renovation / Restoration In Square Feet
3) Project Start / Competition Dates
Procurement of Designer Start Date (MM/DD/YY)
Procurement of Constructor Start Date(MM/DD/YY)
Construction Start Date (Notice to Proceed) *(MM/DD/YY)
Construction Completion Date - As Planned (Substantial Completion) *(MM/DD/YY)
Construction Completion Date - As Built (Substantial completion) *(MM/DD/YY)
4) Change Orders
In case there were no change orders in one of the following divisions, please enter
"Zero" as the value.
Number of Owner-Caused Change Orders
Cost of Owner-Caused Change Orders In USD
Number of Designer-Caused Change Orders

45
Cost of Designer-Caused Change Orders In USD
Number of Builder-Caused Change Orders - Including Differing Site Conditions
Cost of Builder-Caused Change Orders In USD
5) Project Costs
Design Cost(In USD)
Contracted Construction Cost *(In USD)
As-Built Construction Cost *(In USD )
Other Owner Costs Includes, cost of supervision, real estate and owner-furnished
equipments and furnishings (In USD)
III - Lessons Learned
Please rate your overall satisfaction with the project delivery method utilized *
1 2 3 4 5
Not Satisfied Most Satisfied
Any suggestions that you would like to give for the future owners on this project
delivery method, based on your experience in this project?
Any other Lessons Learned through this project that you would like to share with the
industry?
_______________________________________________________________________

46
Will you use this project delivery method again for future projects? *
Yes
No
Maybe
If not, why? __________________________________________________
If not, what project delivery method will you use in the future?
Competitive Bidding
Competitive Sealed Proposals
Construction Management Agency (CMA)
Construction Management at Risk (CMR)
Design-Build (DB)
Design-Build Bridging
other
Depends on Project Parameters
To complete this survey, please check one of the boxes below and press "Submit"
button. Thank you for your participation.
I would like to receive a copy of this research study.
No thanks.
Submit

47
APPENDIX B
Table B-1
List of 2009 engineering news record best projects in Texas and their builders
Name of Builders Project Names
Adolfson & Peterson Construction Forest Park Medical Center
Eastfield Colleges Pleasant Grove Campus
Aguirre Roden Building Systems WinStar World Casino
American Constructors John F. and Nancy Anderson House Residence Hall
Andres Construction So.7 Shops and Lofts
Mosaic
Old Parkland
Anslow Bryant Construction, Ltd. Cemex Center
Austin Commercial Methodist Hospital Sugar Land (Bed Tower and D/T
expansion)
Omni Hotel Fort Worth
Palisades West
Balfour Beatty Construction (CM Agent) La Valencia at Starwood
Barbed Cross Construction LLC Dr. Manuel Carrasco
Bob Moore Construction Pioneer 360 Business Center
First Park Dalport Distribution Center
Trammell Crow Company’s I-30 Distribution Centers
I & II

48
Table B-1
Continued
Name of Builders Project Names
Bovis Lend Lease WinStar World Casino Hotel
Cadence McShane Construction DEA McAllen District Office
CF Jordan LP Foster - Stevens Basketball Center
Charter Builders, Ltd. Addition & Renovation of the Historic Cotton Bowl
Phase II
Chasco Constructors Dell Diamond Renovation and Expansion
Chicago Bridge & Iron (CB&I) Golden Pass Liquefied Natural Gas Terminal
Construction Enterprises, Inc. The Lofts at Wolf Pen Creek
Constructors & Associates Dallas Center for Architecture
Thompson & Knight
David E. Harvey Builders, Inc. One Park Place
Houston Pavilions
Hubbell & Hudson Market and Bistro
1254 Enclave Parkway
DDC Construction The Millennium Greenway
DE Harvey Builders 1254 Enclave Parkway

49
Table B-1
Continued
Name of Builders Project Names
DL Bandy La Vernia Intermediate School
EBCO General Contractor, Ltd. Remington Medical Resort of San Antonio
S&W Cancer Center @ Scott & White Memorial
Hospital
River Village - Courtyard by Marriott
EE Reed Texas Steel Processing
Flintco Inc Embassy Suites San Marcos Hotel and Spa
OSU Boone Pickens Stadium Phase III
Texas State University Baseball/Softball Complex
Enhancements Phase 1
Flynn Construction Inc. Center for Child Protection
Fretz Construction Company Memorial Lutheran Church Education Buildings
Christ the Redeemer Catholic Church
First Colony Church of Christ
Cynthia Woods Mitchell Pavilion
Gamma Construction Office Pavilion
Gilbane Building Company Humble ISD - Summer Creek High School
Discovery Tower
City of Houston Fire Station 37

50
Table B-1
Continued
Name of Builders Project Names
Harrison, Walker & Harper McLennan Community College New Science Building
Brookshire's Food Store #46 Addition and
Renovation
Hensel Phelps Construction Co. Dell Pediatric Research Institute
The Element
Fort Bliss UEPH
Darrell K Royal Texas Memorial Stadium, North End
Zone Expansion
Hoar Construction, LLC Petrobras America Interior Buildout
Hunt Construction Group, Inc. Central Park Campus Learning Resource Center
Frisco Lone Star High School
JE Dunn Construction St. Luke's Episcopal Healthcare System's Kirby Glen
Cyberknife Radiation Therapy
Montage @ Hermann Park (Formerly Mosaic @
Hermann Park II)
Jerdon Construction Company; Florida Traffic Control Devices
IH 10 Managed Lanes
Joeris General Contractors, Ltd.
Concordia Lutheran Church New Sanctuary

51
Table B-1
Continued
Name of Builders Project Names
Jordan Construction 2818 Place
Forum at Denton Station
Newport on the Lake
The Vidorra
The Vistana
Watervue at North Beach
Journeyman Construction, Inc. Del Valle 9th Grade Campus & Opportunity Center -
Del Vale, Austin, Tx
Bexar County Adult Probation Facility - San Antonio
Bexar County Juvenile Detention Center- San
Antonio
KDW Advance Polybag Inc.
Key Construction Texas, LLC NYLO Hotel
The Beat Condominiums
CIGNA Pointe Regional Headquarters
Key Construction Texas, LLC Border Fence K
Lee Lewis Construction-Dallas Heritage High School
Legacy Partners Residential Development
Legacy on the Lake

52
Table B-1
Continued
Name of Builders Project Names
Linbeck Medical Clinic of Houston
St. Lukes Sugar Land Hospital
The ProCure Proton Therapy Center- Oklahama City
Lippert Brothers, Inc. United Way of Central Oklahoma
Lyda Swinerton Builders, LLC Aloft Hotel
Maccini Construction Company HSEarchitect's Office
Manhattan Construction Company Energy Center Office Building - Phase II - Houston
Energy Center Office Building - Phase II - Houston
MAPP Construction, LLC The Aveda Institute of Dallas
Confidential Financial Services Firm-Dallas
Mazanec Construction Company McLennan Community College Dennis F. Michaelis
Academic Center
McCarthy Building Companies, Inc.
United Regional Hospital South Tower Addition -
Witchita Falls, Tx
Dallas County Institute of Forensic Science
Dallas Center for the Performing Arts Dee & Charles
Wyly Theatre
Dallas County Detention Center South Tower

53
Table B-1
Continued
Name of Builders Project Names
MEDCO Construction Baylor Regional Medical Center at Grapevine 5th &
6th Floor Tower Shell
Baylor Regional Medical Center at Grapevine Central
Utility Plant
Baylor University Medical Center 3rd Floor Truett
Universal ICU Expansion
Baylor University Medical Center 7th Floor Truett
Hospital
Baylor University Medical Center Parking Garage 4
Baylor Administrative Office Building
Metzger Construction Company Casimir Sawdust
MW Builders of Texas, Inc High View Place Apartments - San Antonio
Horny Toad Harley-Davidson – Temple
Oscar Renda Contracting North MacGregor Drive Storm Sewer Relief Project
PBS&J (bridge contractor: HNTB Corporation)
Lewisville Lake Toll Bridge (LLTB)-Dallas
Ratcliff Constructors Jack Hatchell Administration Building
Robins & Morton Hillcrest Baptist Medical Center / Womens &
Childrens Hospital – Waco

54
Table B-1
Continued
Name of Builders Project Names
Rogers-O'Brien Construction Billingsley International Business Park 15-Plano
(near Dallas)
Rosenberger Construction Seismic Exchange-Houston
Satterfield & Pontikes North Lake College General Purpose Building G -
Irving
Glenda Dawson High School, Pearland ISD
SEDALCO Construction Services 2200 on West 7th Street
Caceria Building
Fischer Dining Pavilion
Trinity River Audubon Center
Skanska USA Building University of Houston System at Sugar Land Brazos
Hall-Houston
La Joya ISD Palmview High School -
Smith & Pickel Construction Donald W. Reynolds Center - Infant Crisis Services

55
Table B-1
Continued
Name of Builders Project Names
SpawGlass Construction Corp Sam Houston State University College of Humanities
and Social Sciences Building
Citation Oil & Gas Corporate Headquarters
H-E-B Buffalo Speedway
Texas A&M University McFerrin Athletic Center
Union Pacific Railroad San Antonio Intermodal
Facility
Texas A&M University Cox-McFerrin Center for
Aggie Basketball
SpawGlass Contractors, Inc. McKenna Village at Sundance
SpawMaxwell Enclave Administrative Campus-houston
Lance Armstrong Foundation -Austin
Speed Fab-Crete Dale Keeling Field House
Steele & Freeman, Inc. Caprock Elementary School
Tellepsen Builder's Houstons First Baptist Church Sanctuary Renovation
Texas BBL, L.P.
Eastside

56
Table B-1
Continued
Name of Builders Project Names
The Beck Group St. Mark's School of Texas Campus Expansion
Allaso Ranch
Texas Capital Bank
Renion Tower Renovation
Union Station Renovation
The Hanover Company Cirque Apartment Tower
The Neenan Company CentroMed Health and Wellness Center
The Whiting-Turner Contracting Company
JCPenney Store #2982 at The Village at Fairview
Thos. S. Byrne, Ltd. Booker T. Washington High School for the
Performing and Visual Arts
Trimbuilt Construction, Inc Austin Immediate Care
Turner Construction
Cedar Valley College-Science, Vet Tech & Allied
Health Building
Dallas County Community College District
Enterprise Plaza Fountain
City of La Porte Municipal Court Building
Fort Bend County Jail Expansion
Westin at the Galleria Dallas

57
Table B-1
Continued
Name of Builders Project Names
VCC Irving, TX
W. S. Bellows Construction Corp Texas Children's Hospital Feigin Research Center
W.G. Yates & Sons Construction Company
Birdville Center of Technology and Advanced
Learning
Port Isabel Spool Base Dock Facility
Mitchell Historic Properties
Waldrop Construction Brownwood High School
Zachry NRG Cedar Bayou
Zenith Construction Holy Family Parish Hall
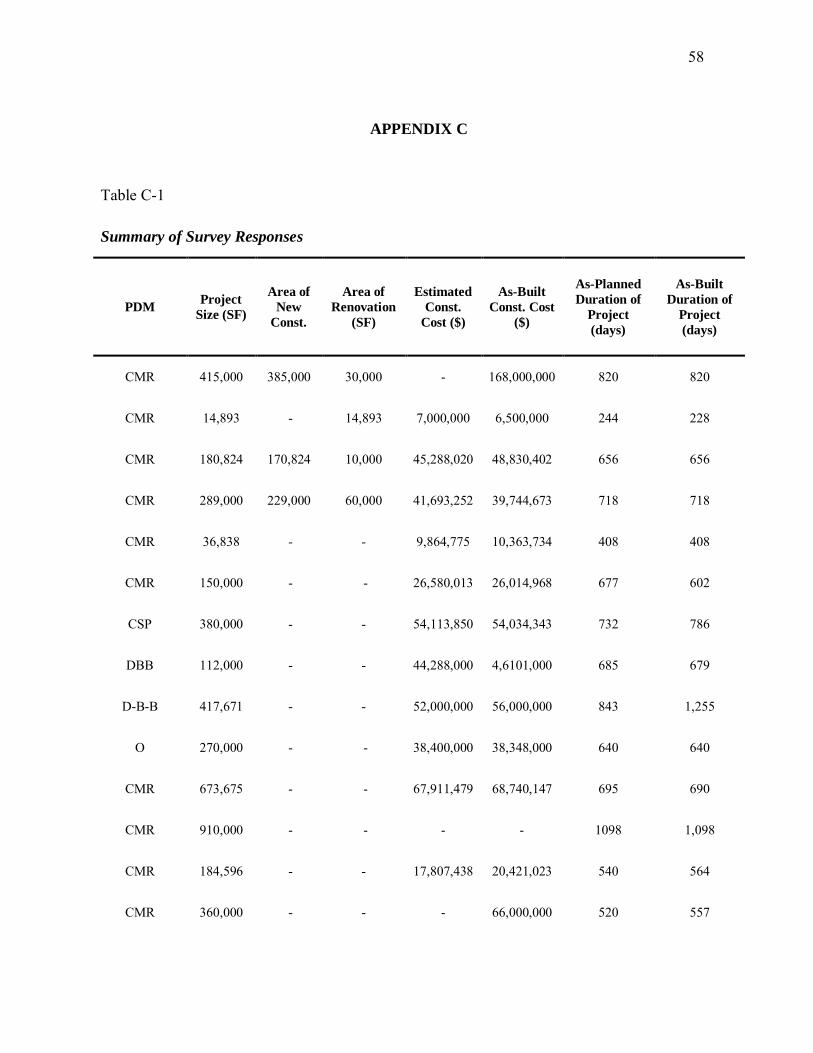
58
APPENDIX C
Table C-1
Summary of Survey Responses
PDM Project
Size (SF)
Area of
New
Const.
Area of
Renovation
(SF)
Estimated
Const.
Cost ($)
As-Built
Const. Cost
($)
As-Planned
Duration of
Project
(days)
As-Built
Duration of
Project
(days)
CMR 415,000 385,000 30,000 - 168,000,000 820 820
CMR 14,893 - 14,893 7,000,000 6,500,000 244 228
CMR 180,824 170,824 10,000 45,288,020 48,830,402 656 656
CMR 289,000 229,000 60,000 41,693,252 39,744,673 718 718
CMR 36,838 - - 9,864,775 10,363,734 408 408
CMR 150,000 - - 26,580,013 26,014,968 677 602
CSP 380,000 - - 54,113,850 54,034,343 732 786
DBB 112,000 - - 44,288,000 4,6101,000 685 679
D-B-B 417,671 - - 52,000,000 56,000,000 843 1,255
O 270,000 - - 38,400,000 38,348,000 640 640
CMR 673,675 - - 67,911,479 68,740,147 695 690
CMR 910,000 - - - - 1098 1,098
CMR 184,596 - - 17,807,438 20,421,023 540 564
CMR 360,000 - - - 66,000,000 520 557

59
Table C-1
Continued
PDM Project
Size (SF)
Area of
New
Const.
Area of
Renovation
(SF)
Estimated
Const.
Cost ($)
As-Built
Const. Cost
($)
As-Planned
Duration of
Project
(days)
As-Built
Duration of
Project
(days)
O 73,372 - - 20,456,500 20,757,040 537 507
CMR 320,000 - - 37,000,000 39,000,000 513 561
CMR 88,000 - - 48,000,000 63,000,000 870 1,008
DBB 330,000 - - 61,731,000 66,259,000 923 923
D-B 517,000 - - 31,000,000 97,000,000 794 710
CMR 191,076 - - 31,668,072 31,665,656 911 863
CMR 68,000 - - 16,797,312 17,284,491 633 574
D-B 200,000 - - 53,000,000 53,000,000 614 614
CMR 176,000 160,000 16000 7,600,000 7,400,000 139 138
CMR - 1 - 11,997,660 13,527,680 287 287
D-B 45,000 30,000 15000 7,843,000 8,386,000 162 162
CMR 59,800 - 59800 10,459,600 10,459,600 252 252
CMR 501,500 28,000 473500 62,500,000 62,500,000 804 804
DBB 22,000 - - 10,789,400 12,454,669 429 552
CSP 150,878 - 7,423,894 7,808,106 207 207
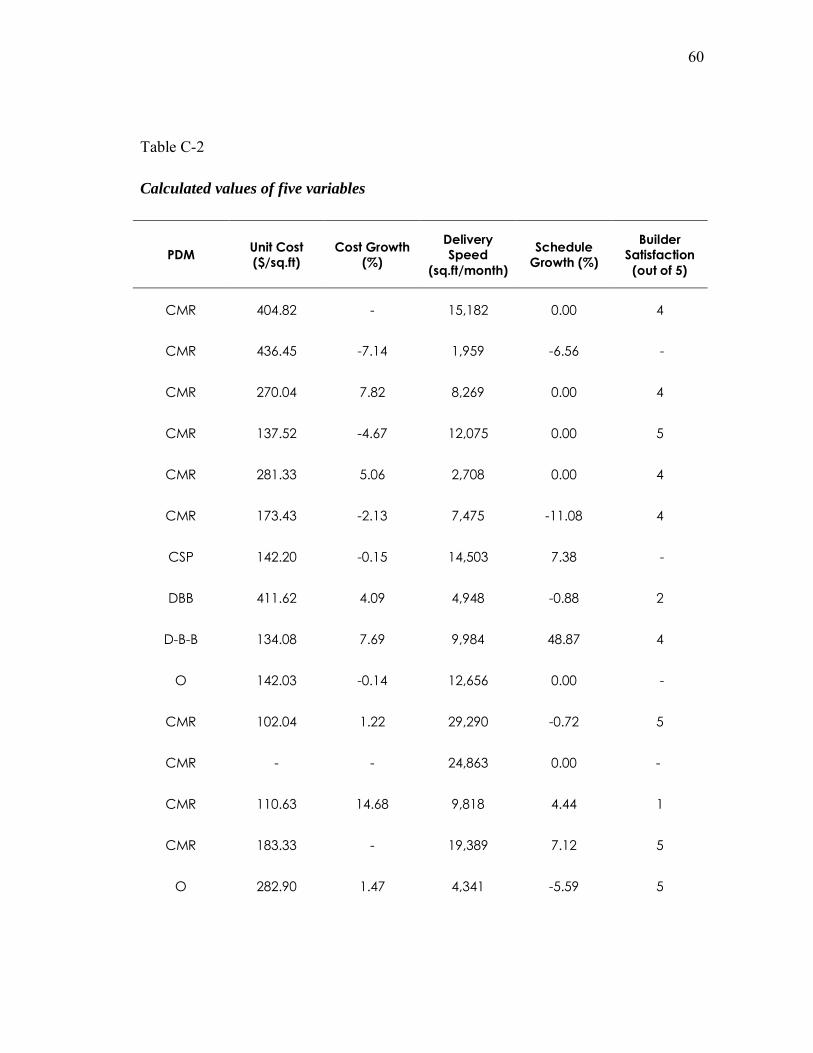
60
Table C-2
Calculated values of five variables
PDM Unit Cost
($/sq.ft)
Cost Growth
(%)
Delivery
Speed
(sq.ft/month)
Schedule
Growth (%)
Builder
Satisfaction
(out of 5)
CMR 404.82 - 15,182 0.00 4
CMR 436.45 -7.14 1,959 -6.56 -
CMR 270.04 7.82 8,269 0.00 4
CMR 137.52 -4.67 12,075 0.00 5
CMR 281.33 5.06 2,708 0.00 4
CMR 173.43 -2.13 7,475 -11.08 4
CSP 142.20 -0.15 14,503 7.38 -
DBB 411.62 4.09 4,948 -0.88 2
D-B-B 134.08 7.69 9,984 48.87 4
O 142.03 -0.14 12,656 0.00 -
CMR 102.04 1.22 29,290 -0.72 5
CMR - - 24,863 0.00 -
CMR 110.63 14.68 9,818 4.44 1
CMR 183.33 - 19,389 7.12 5
O 282.90 1.47 4,341 -5.59 5

61
Table C-2
Continued
PDM Unit Cost
($/sq.ft)
Cost Growth
(%)
Delivery
Speed
(sq.ft/month)
Schedule
Growth (%)
Builder
Satisfaction
(out of 5)
CMR 121.88 5.41 17,112 9.36 4
CMR 715.91 31.25 2,619 15.86 5
DBB 200.78 7.34 10,725 0.00 2
D-B 187.62 212.90 21,845 -10.58 5
CMR 165.72 -0.01 6,642 -5.27 4
CMR 254.18 2.90 3,554 -9.32 5
D-B 265.00 0.00 9,771 0.00 5
CMR 42.05 -2.63 38,260 -0.72 5
CMR - 12.75 - 0.00 4
D-B 186.36 6.92 8,333 0.00 4
CMR 174.91 0.00 7,119 0.00 4
CMR 124.63 0.00 18,712 0.00 5
DBB 566.12 15.43 1,195 28.67 4
CSP 51.75 5.18 21,866 0.00 4

62
Table C-3
Values of realization of x, y, and z
PDM
No. of
Change
Orders
Cost of
Change
Orders ($)
X (Unit Less) Y (Unit Less) Z (Unit Less)
CMR - - - - -
CMR - - - - -
CMR 27 3,629,103 86.72 2,428.19 0.00
CMR 0 0 1,948.58 1,948.58 0.00
CMR 6 498,959 0.00 0.00 0.00
CMR 0 0 565.05 565.05 -750.00
CSP 1 -79,505 0.00 0.00 270.00
DBB 17 1,813,000 0.00 0.00 -3.33
D-B-B - 4,000,000 0.00 - -
O 97 231,700 283.70 27,802.60 0.00
CMR 14 878,668 50.00 750.00 -3.33
CMR 21 3,200,000 - - 0.00
CMR 29 2,613,585 0.00 0.00 8.00
CMR - - - - -
O 55 660,540 360.00 20,160.00 -5.36
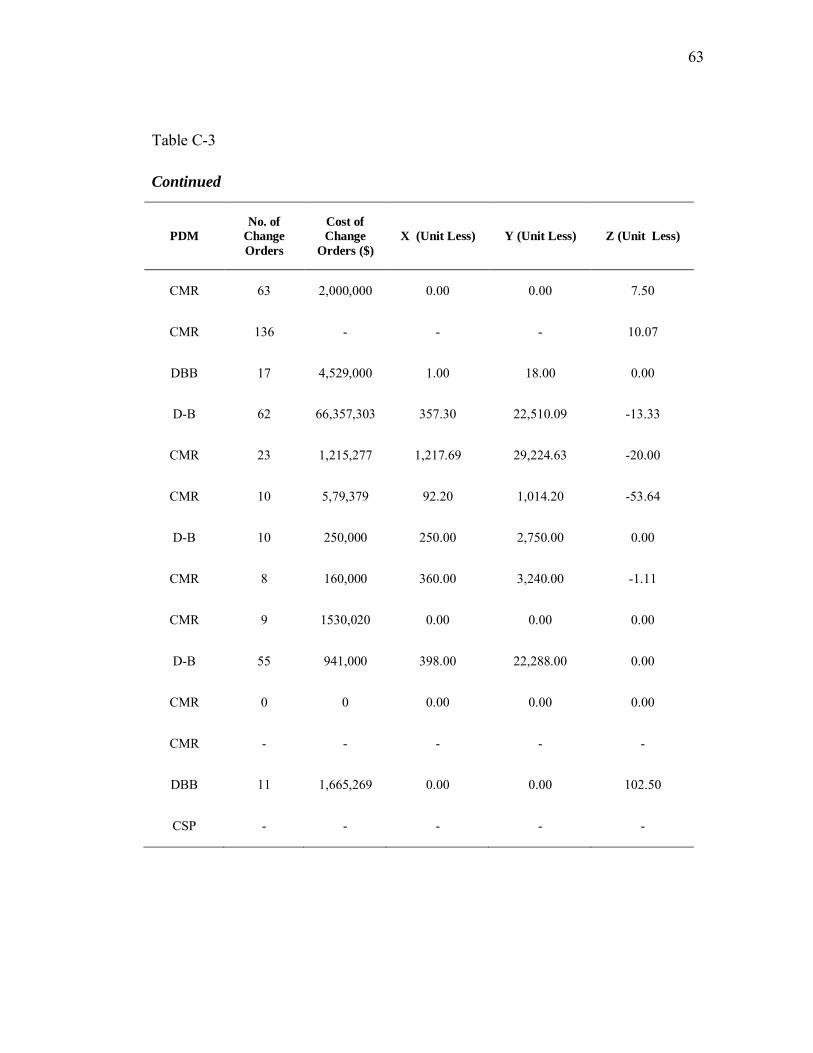
63
Table C-3
Continued
PDM
No. of
Change
Orders
Cost of
Change
Orders ($)
X (Unit Less) Y (Unit Less) Z (Unit Less)
CMR 63 2,000,000 0.00 0.00 7.50
CMR 136 - - - 10.07
DBB 17 4,529,000 1.00 18.00 0.00
D-B 62 66,357,303 357.30 22,510.09 -13.33
CMR 23 1,215,277 1,217.69 29,224.63 -20.00
CMR 10 5,79,379 92.20 1,014.20 -53.64
D-B 10 250,000 250.00 2,750.00 0.00
CMR 8 160,000 360.00 3,240.00 -1.11
CMR 9 1530,020 0.00 0.00 0.00
D-B 55 941,000 398.00 22,288.00 0.00
CMR 0 0 0.00 0.00 0.00
CMR - - - - -
DBB 11 1,665,269 0.00 0.00 102.50
CSP - - - - -
64
APPENDIX D
Following are the direct quotes of some of the inputs / suggestions provided by the
builders of the 2009 ENR Best Projects in Texas. Due to privacy and confidentiality
issues, names of the companies and persons who shared this information are not
provided.
Construction Management at Risk
“Prior to the start of construction, contingencies should be developed. There will
always be changes in the project either due to owner requests, drawing conflicts
or design considerations which were not identified during the contract document
preparation. The establishment of a contingency fund removes much of the
adversarial or defensive postures that often develop throughout the course of the
project.”
“Hiring the contractor on a CMR basis will generate the best partnership and
allow the most input by the owner. CMR method allows the owner to proceed
without design completion and save financing costs. Partnership between all
parties is paramount to the success of a complicated project.”
“Prior to establishment of the Guaranteed Maximum Price (GMP) and execution
of the contract between the developer and contractor/construction manager, the
documents must be revised to reflect all agreements and terms of the contract.
Any procedure to the contrary will result in an unprofitable venture for the
contractor/construction manager.”
“CMR is a great delivery method when everyone works together as a team. Use
Building Information Modeling (BIM) to help coordinate the project. BIM is a
great communication tool, and it makes conflict detection much easier.”
“Do not start construction until construction documents are complete. Success of
the project depends on careful selection of the designer and contractor.”

65
“The relationship of the Owner, Designer and Contractor working as a team, is
beneficial in overcoming many obstacles. Whether it is unknown existing
conditions resulting in design changes, or value engineering to maintain the
budget and keep the design with varying materials and/or methods.”
Design-Build
“Texas State chose the delivery method based on the time frame to get the
project built between baseball/softball seasons. The design time was a little
short, but based on the cost of the project, with teamwork between Texas State
and the Design Build team, we produced a project that all parties were happy
with.”
“Design-Build had a definite advantage with a project that has time
constraints. We were able to start construction while the design was still in
process.”
Design-Build-Bridging
“Make sure design related issued are resolved, agreed to early in project and
executed timely.”
Other Project Delivery Methods
“Sole Source is one of our favorite delivery methods. There is nothing better
than getting a call from an owner and then saying, „We have a $40M hotel we
want you to build.‟ The team worked well together as we have worked with
the owner organization previously.”
“This delivery method allowed the general contractor to be selected early in
the project and monitor the budget and schedule as the project progressed

66
through the design phase of the project. During the design material cost
escalations were consistently coming in and our company priced several
iterations of the design to maximize the owner‟s budget in keeping with the
architects design.”
“Carrying a contingency that directly correlates to the complexity of the
project is very important. In addition, utilizing a guaranteed maximum price
(GMP) contract with a savings split which allowed us to return a large
savings at the end of the project that helped temper the cost of the additional
work added by the owner. Finally, the selection of the team that has a good
working relationship cannot be emphasized enough. Working through
difficult details is made that much easier if everyone is working to the same
goal.”

67
VITA
Navaneethan Rajan received his Bachelor of Architecture degree from Maulana Azad
National Institute of Technology at Bhopal, India in 2007. He entered the Construction
Management program at Texas A&M University in August 2008 and received his
Master of Science degree in December 2010. His research interests include project
delivery methods, and project controls and management.
Mr. Rajan may be reached at College of Architecture, Construction Science, 3137-
TAMU, College Station, Texas. His email is [email protected].