Embed Size (px)
Citation preview

8/3/2019 Analysis King 2
http://slidepdf.com/reader/full/analysis-king-2 1/36
profile of respondent
Demographic variables Categories frequency Percentage
Gender Male 68 34
Female 132 66
Age 18-24 194 97.0
25-31 5 2.5
32-38 - -
39 and above 1 0.5
Ethnic Malay 50 25
Indian 22 11
Chinese 43 21.5
Sabah/Sarawak 85 42.5
Material status Single 198 99
Marriage 1 0.5
Widowed 1 0.5
Divorce/Separated - -
Educational level STPM 80 40
Matriculation 29 14.5
Diploma 6 3
Degree 84 42
Master 1 0.5
PHD - -
Program HE19 53 26.5
HE20 22 11
HE21 18 9
HE22 33 16.5
HE23 32 16
HC12 28 14
HC13 14 7
200 100%

8/3/2019 Analysis King 2
http://slidepdf.com/reader/full/analysis-king-2 2/36
Chapter 4: Data Analysis and Findings
4.1 Profile of respondent
4.2 Dependent and independent variables:
independent variables
Trust
Involvement
Influence
Dependent variables Satisfaction
Note: T= Trust, I= involvement, U= Influence, S= Satisfaction
4.3 Factor Analysis
Factor analysis is to summarize patterns of correlations among observed
variables, to reduce a large number of observed variables to a smaller
numbers of factors, and to provide an operational definition for an
underlying process. In order to ensure the appropriateness of factor
analysis, six assumptions need to be met:
1) Kaiser-Meyer-Olkin measure of sampling adequacy (KMO) values
must exceed .50.
2) The result of the Bartlett’s test of sphericity should be at least
significant at .05.
3) Anti-image correlation matrix of items should be at least above .
50.

8/3/2019 Analysis King 2
http://slidepdf.com/reader/full/analysis-king-2 3/36
4) Communalities of the variables must be greater than .50.
5) The factor loadings of .30 or above for each item are considered
practical and statistically significant for sample sizes of 350 or
greater.6) Factors with eigenvalues greater than 1 are considered
significant
From the data that has been analysis, the KMO in dependent and
independent variables is more than 0.5. The Bartlett’s test of sphericity
also show the positive result because all of it is more than 0.05. The anti
image for the independent variables show that all the highlight data is
above 0.50. The independent and dependent variables shows that
communalities is greater than .50, but that is after there are variables that
been deleted after the test been run. Next is the eigenvalues. Both
dependent and independent variables are significant because all is more
than 1.
4.2.1 independent variables (INVOLVEMENT, TRUST, INFLUENCE)
First run

8/3/2019 Analysis King 2
http://slidepdf.com/reader/full/analysis-king-2 4/36
Rotated Component Matrixa
Component
1 2 3
T2 .884
T1 .831
T5 .806
T4 .761
T3 .709
U2 .453 .446
I1 .813
I4 .774
I2 .755
I3 .742
U1 .823
U3 .788
Extraction Method: Principal Component
Analysis.
Rotation Method: Varimax with Kaiser
Normalization.
a. Rotation converged in 4 iterations.
Second run (Removed U2)

8/3/2019 Analysis King 2
http://slidepdf.com/reader/full/analysis-king-2 5/36
Rotated Component Matrixa
Component
1 2 3
T2 .884
T1 .835
T5 .812
T4 .770
T3 .730
I1 .816
I4 .776
I2 .757
I3 .740
U1 .852
U3 .797
Extraction Method: Principal Component
Analysis.
Rotation Method: Varimax with Kaiser
Normalization.
a. Rotation converged in 4 iterations.
Final run

8/3/2019 Analysis King 2
http://slidepdf.com/reader/full/analysis-king-2 6/36
KMO and Bartlett's Test
Kaiser-Meyer-Olkin Measure of
Sampling Adequacy..823
Bartlett's Test of
Sphericity
Approx. Chi-Square 909.53
9
df 55
Sig. .000

8/3/2019 Analysis King 2
http://slidepdf.com/reader/full/analysis-king-2 7/36
Anti-image Matrices
I1 I2 I3 I4 T1 T2 T3 T4 T5 U1 U3
Anti-image
Covariance
I1 .496 -.214 -.122 -.126 -.081 .048 .018 -.043 -.011 .043 .005
I2 -.214 .559 -.036 -.123 .025 -.042 -.074 -.049 .061 .063 -.039
I3 -.122 -.036 .627 -.191 -.091 .080 -.002 .027 -.056 -.006 .038
I4 -.126 -.123 -.191 .582 .071 -.032 .003 .029 -.014 -.088 -.086
T1 -.081 .025 -.091 .071 .344 -.174 -.063 -.011 -.065 -.059 -.017
T2 .048 -.042 .080 -.032 -.174 .331 -.082 -.105 -.061 .074 -.004
T3 .018 -.074 -.002 .003 -.063 -.082 .555 -.003 -.100 -.033 -.061
T4 -.043 -.049 .027 .029 -.011 -.105 -.003 .463 -.154 -.078 -.051
T5 -.011 .061 -.056 -.014 -.065 -.061 -.100 -.154 .436 -.035 .023
U1 .043 .063 -.006 -.088 -.059 .074 -.033 -.078 -.035 .707 -.273
U3 .005 -.039 .038 -.086 -.017 -.004 -.061 -.051 .023 -.273 .706
Anti-image
Correlation
I1 .790a -.406 -.219 -.235 -.195 .119 .034 -.090 -.024 .073 .008
I2 -.406 .791a -.062 -.216 .056 -.098 -.133 -.096 .124 .100 -.062
I3 -.219 -.062 .780a -.316 -.197 .176 -.004 .050 -.107 -.009 .057
I4 -.235 -.216 -.316 .775a .158 -.073 .005 .056 -.027 -.137 -.134
T1 -.195 .056 -.197 .158 .823a -.514 -.144 -.028 -.168 -.119 -.034
T2 .119 -.098 .176 -.073 -.514 .797a -.192 -.267 -.161 .153 -.008
T3 .034 -.133 -.004 .005 -.144 -.192 .922a -.005 -.204 -.052 -.098
T4 -.090 -.096 .050 .056 -.028 -.267 -.005 .879a -.344 -.136 -.089
T5 -.024 .124 -.107 -.027 -.168 -.161 -.204 -.344 .879a -.063 .042
U1 .073 .100 -.009 -.137 -.119 .153 -.052 -.136 -.063 .704a -.386
U3 .008 -.062 .057 -.134 -.034 -.008 -.098 -.089 .042 -.386 .790a

8/3/2019 Analysis King 2
http://slidepdf.com/reader/full/analysis-king-2 8/36

8/3/2019 Analysis King 2
http://slidepdf.com/reader/full/analysis-king-2 9/36
Communalities
Initial Extraction
I1 1.000 .713
I2 1.000 .617
I3 1.000 .559
I4 1.000 .675
T1 1.000 .740
T2 1.000 .785
T3 1.000 .580
T4 1.000 .651
T5 1.000 .691
U1 1.000 .754
U3 1.000 .695
Extraction Method: Principal Component
Analysis.

8/3/2019 Analysis King 2
http://slidepdf.com/reader/full/analysis-king-2 10/36
Total Variance Explained
Com
pon
ent
Initial Eigenvalues
Extraction Sums of
Squared Loadings
Rotation Sums of Squared
Loadings
Total
% of
Variance
Cumulati
ve % Total
% of
Variance
Cumulati
ve % Total
% of
Variance
Cumulati
ve %
1 4.294 39.035 39.035 4.294 39.035 39.035 3.426 31.146 31.146
2 1.928 17.532 56.567 1.928 17.532 56.567 2.499 22.716 53.862
3 1.238 11.254 67.820 1.238 11.254 67.820 1.535 13.958 67.820
4 .716 6.505 74.325
5 .549 4.992 79.317
6 .489 4.442 83.759
7 .481 4.372 88.131
8 .420 3.814 91.945
9 .374 3.396 95.341
10 .310 2.817 98.158
11 .203 1.842 100.000
Extraction Method: Principal
Component Analysis.

8/3/2019 Analysis King 2
http://slidepdf.com/reader/full/analysis-king-2 11/36
Rotated Component Matrixa
Component
1 2 3
T2 .884
T1 .835
T5 .812
T4 .770
T3 .730
I1 .816
I4 .776
I2 .757
I3 .740
U1 .852
U3 .797
Extraction Method: Principal Component
Analysis.
Rotation Method: Varimax with Kaiser
Normalization.
a. Rotation converged in 4 iterations.
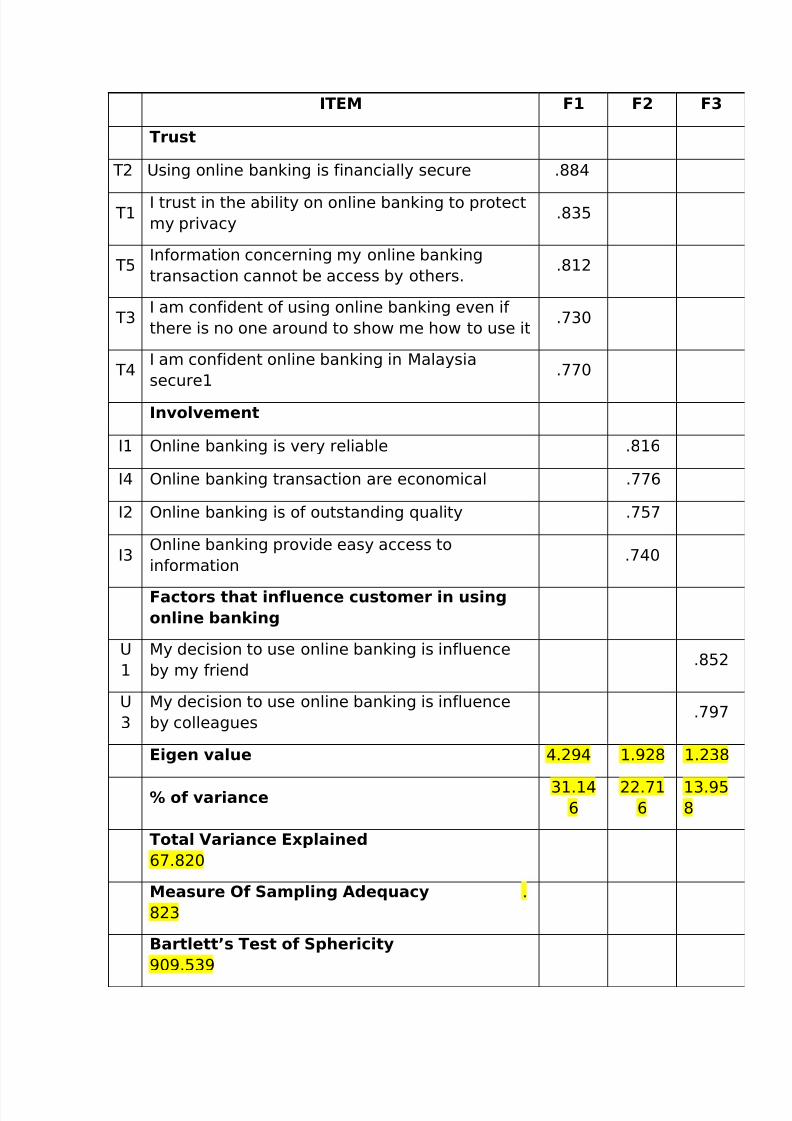
Measurement: Acceptance of Online Banking
8/3/2019 Analysis King 2
http://slidepdf.com/reader/full/analysis-king-2 12/36
ITEM F1 F2 F3
Trust
T2 Using online banking is financially secure .884
T1I trust in the ability on online banking to protect
my privacy.835
T5Information concerning my online banking
transaction cannot be access by others..812
T3I am confident of using online banking even if
there is no one around to show me how to use it.730
T4I am confident online banking in Malaysia
secure1
.770
Involvement
I1 Online banking is very reliable .816
I4 Online banking transaction are economical .776
I2 Online banking is of outstanding quality .757
I3Online banking provide easy access to
information.740
Factors that influence customer in using
online banking
U
1
My decision to use online banking is influence
by my friend.852
U
3
My decision to use online banking is influence
by colleagues.797
Eigen value 4.294 1.928 1.238
% of variance31.14
6
22.71
6
13.95
8
Total Variance Explained
67.820
Measure Of Sampling Adequacy .
823
Bartlett’s Test of Sphericity
909.539

8/3/2019 Analysis King 2
http://slidepdf.com/reader/full/analysis-king-2 13/36
Significant
0.00
4. 2.2 Dependent variable (SATISFACTION)
KMO and Bartlett's Test
Kaiser-Meyer-Olkin Measure of
Sampling Adequacy..868
Bartlett's Test of
Sphericity
Approx. Chi-Square 493.87
9
df 15
Sig. .000

8/3/2019 Analysis King 2
http://slidepdf.com/reader/full/analysis-king-2 14/36
Communalities
Initial Extraction
S1 1.000 .679
S2 1.000 .534
S3 1.000 .586
S5 1.000 .635
S6 1.000 .610
S7 1.000 .524
Extraction Method: Principal Component
Analysis.
Total Variance Explained
Com
pone
nt
Initial Eigenvalues
Extraction Sums of Squared
Loadings
Total
% of
Variance
Cumulativ
e % Total
% of
Variance
Cumulativ
e %
1 3.569 59.479 59.479 3.569 59.479 59.479
2 .728 12.133 71.613
3 .514 8.575 80.187
4 .475 7.914 88.101
5 .376 6.262 94.364
6 .338 5.636 100.000

8/3/2019 Analysis King 2
http://slidepdf.com/reader/full/analysis-king-2 15/36
Total Variance Explained
Com
pone
nt
Initial Eigenvalues
Extraction Sums of Squared
Loadings
Total
% of
Variance
Cumulativ
e % Total
% of
Variance
Cumulativ
e %
1 3.569 59.479 59.479 3.569 59.479 59.479
2 .728 12.133 71.613
3 .514 8.575 80.187
4 .475 7.914 88.101
5 .376 6.262 94.364
Extraction Method: Principal
Component Analysis.

8/3/2019 Analysis King 2
http://slidepdf.com/reader/full/analysis-king-2 16/36
Component Matrixa
Component
1
S1 .824
S5 .797
S6 .781
S3 .766
S2 .731
S7 .724
Extraction Method: Principal Component Analysis.
SatisfactionFactor
Loading
S1Online banking allowed me to manage my finance more
efficiently.824
S2 Online banking gives me greater control over my finance. .731
S3 Online banking is compatible with my lifestyle .766
S5 Online banking is a convenient way to manage my finance. .797
S6Online banking is useful for managing my financial
resource..781
S7
Online banking makes it easier for me to conduct my
banking transaction. .724
Eigen value 3.569
Total Variance Explain 59.479
Measure of Sampling Adequacy .868
Bartlett’s test of Sphericity 493.879
Significant .000

8/3/2019 Analysis King 2
http://slidepdf.com/reader/full/analysis-king-2 17/36
4.4 Reliability test
4.3.1 Independent variables
Trust:
Case Processing Summary
N %
Cases Valid 200 100.0
Exclude
da0 .0
Total 200 100.0
a. Listwise deletion based on all
variables in the procedure.
Reliability
Statistics
Cronbach's
Alpha
N of
Items
.883 5
Item Statistics
Mean
Std.
Deviation N
T1 3.0900 1.00346 200
T2 3.0650 .89711 200
T3 3.1500 .93910 200
T4 3.0050 .93237 200
T5 3.1800 1.02118 200

8/3/2019 Analysis King 2
http://slidepdf.com/reader/full/analysis-king-2 18/36
Item-Total Statistics
Scale Mean
if ItemDeleted
Scale
Variance if
ItemDeleted
Corrected
Item-TotalCorrelation
Cronbach's
Alpha if
ItemDeleted
T1 12.4000 9.920 .757 .850
T2 12.4250 10.376 .783 .845
T3 12.3400 10.859 .641 .876
T4 12.4850 10.643 .690 .865
T5 12.3100 9.934 .735 .855
Involvement:
Case Processing Summary
N %
Cases Valid 200 100.0
Exclude
da0 .0
Total 200 100.0
a. Listwise deletion based on all
variables in the procedure.
Reliability Statistics
Cronbach's
Alpha
N of
Items
.795 4
Item Statistics
Mean
Std.
Deviation N

8/3/2019 Analysis King 2
http://slidepdf.com/reader/full/analysis-king-2 19/36
Case Processing Summary
N %
Cases Valid 200 100.0
Exclude
da0 .0
Total 200 100.0
I1 3.5700 .79262 200
I2 3.3900 .76867 200
I3 3.8700 .77206 200
I4 3.7250 .77614 200
Item-Total Statistics
Scale Mean
if ItemDeleted
Scale
Variance if
ItemDeleted
Corrected
Item-TotalCorrelation
Cronbach's
Alpha if
ItemDeleted
I1 10.9850 3.392 .674 .709
I2 11.1650 3.656 .592 .751
I3 10.6850 3.744 .551 .770
I4 10.8300 3.599 .606 .743

8/3/2019 Analysis King 2
http://slidepdf.com/reader/full/analysis-king-2 20/36
Influence:
Case Processing Summary
N %
Cases Valid 200 100.0
Exclude
da0 .0
Total 200 100.0
a. Listwise deletion based on all
variables in the procedure.
Reliability Statistics
Cronbach's
Alpha
N of
Items
.639 2
Item Statistics
Mean
Std.
Deviation N
U1 3.2800 1.02805 200
U3 3.2250 1.03427 200

8/3/2019 Analysis King 2
http://slidepdf.com/reader/full/analysis-king-2 21/36
Item-Total Statistics
Scale Mean
if Item
Deleted
Scale
Variance if
Item
Deleted
Corrected
Item-Total
Correlation
Cronbach's
Alpha if
Item
Deleted
U1 3.2250 1.070 .470 .a
U3 3.2800 1.057 .470 .a
a. The value is negative due to a negative average
covariance among items. This violates reliability
model assumptions. You may want to check item
codings.
4.3.2 Dependent variables
Satisfaction:
Case Processing Summary
N %
Cases Valid 200 100.0
Exclude
da0 .0
Total 200 100.0
a. Listwise deletion based on allvariables in the procedure.
Reliability Statistics
Cronbach's
Alpha
N of
Items
.863 6

8/3/2019 Analysis King 2
http://slidepdf.com/reader/full/analysis-king-2 22/36
Item Statistics
Mean
Std.
Deviation N
S1 3.4700 .82004 200
S2 3.3650 .84578 200
S3 3.5000 .76349 200
S5 3.4550 .80074 200
S6 3.4050 .77717 200
S7 3.8500 .78778 200
Item-Total Statistics
Scale Mean
if Item
Deleted
Scale
Variance if
Item
Deleted
Corrected
Item-Total
Correlation
Cronbach's
Alpha if
Item
Deleted
S1 17.5750 9.351 .723 .827
S2 17.6800 9.726 .608 .849
S3 17.5450 9.928 .653 .840
S5 17.5900 9.610 .685 .834
S6 17.6400 9.789 .670 .837
S7 17.1950 10.037 .600 .850
From the table: summary of reliability analysis
Reliability analysis on variables in the study

8/3/2019 Analysis King 2
http://slidepdf.com/reader/full/analysis-king-2 23/36
Variables No of item Cronbach’s alpha
Involvement 4 .795
Trust 5 .883
Influence 2 .639
satisfaction 6 .863
Reliability analysis is to establish by testing for both consistency and
stability of the set of item that positively correlated to one another.
Cronbach’s alpha was calculated. Generally, an alpha value close to 1.0
indicates high internal consistency reliability, an alpha value less than 0.6
is considered to be poor, values of 0.7 are considered acceptable and
values above 0.8 are deemed to be good (Sekaran & Bougie, 2009). From
the table above, after the data been analyse and reduce, all the
Cronbach’s alpha is more than 0.6 and it shows that the variables have a
high internal consistency reliability. Even though the variables of influence
is only 0.639, it still consider acceptable.
4.5 Descriptive analysis

8/3/2019 Analysis King 2
http://slidepdf.com/reader/full/analysis-king-2 24/36
Descriptive Statistics
NMinimu
m
Maximu
mMean
Std.
Deviati
on
Skewness Kurtosis
Statisti
c
Statisti
c
Statisti
c
Statisti
c
Statisti
c
Statisti
c
Std.
Error
Statisti
c
Std.
Error
involvem
ent200 2.00 5.00 3.6388 .61170 .163 .172 .007 .342
trust 200 1.00 5.00 3.0980 .79268 -.061 .172 -.167 .342
influence 200 1.00 5.00 3.2525 .88397 -.383 .172 .013 .342
satisfacti
on200 1.83 5.00 3.5075 .61579 .033 .172 .195 .342
Valid N
(listwise)200
From the Table: summary of Descriptive analysis
Mean and Standard Deviation for variables in the study
Variables Mean Standard Deviation
Involvement3.6388 .61170
Trust3.0980 .79268
Influence3.2525 .88397
Satisfaction 3.5075 .61579
Descriptive Analysis measure the value of the mean and the standard
Deviation of the variables. Based on the scale 1 to 5, the mean score less
than 2 is rated as low, 2 to 4 as average and mean score more than 4,

8/3/2019 Analysis King 2
http://slidepdf.com/reader/full/analysis-king-2 25/36
rated as high. From the summary of the variables, all the mean show
more than 3.0 and this can be rated as average.
4.6 Correlation analysis
involvemen
t trust influence
satisfactio
n
involvemen
t
Pearson
Correlation1 .321** .225** .641**
Sig. (2-tailed) .000 .001 .000
N 200 200 200
trust Pearson
Correlation1 .358** .493**
Sig. (2-tailed) .000 .000
N 200 200
influence Pearson
Correlation1 .315**
Sig. (2-tailed) .000
N 200
satisfaction Pearson
Correlation1
Sig. (2-tailed)
N
**. Correlation is significant at the 0.01 level (2-
tailed).
The Pearson correlation coefficient values can vary from -1.00 to
+1.00.the number of +1.00 represent perfect positive correlation, while
-1.00 represent perfect negative correlation. This means, the highest the
number to the positive, the better or the stronger the correlation between
variables. From the table above, we can see that the relation betweeninvolvement and satisfaction is the highest and the lowest is relation

8/3/2019 Analysis King 2
http://slidepdf.com/reader/full/analysis-king-2 26/36
between influence and involvement. From this data, we can see that
maybe involvement or influence have the impact of the correlation
between variables. This question can be answer when we look at the next
data analysis that is regression analysis.
4.7 Regression analysis
Variables Entered/Removedb
Mode
l
Variables
Entered
Variables
Removed Method
1 influence,
involveme
nt, trusta
. Enter
a. All requested variables
entered.
b. Dependent Variable:
satisfaction
Model Summary
Mode
l R
R
Square
Adjusted R
Square
Std. Error
of the
Estimate
1 .714a .510 .502 .43436
a. Predictors: (Constant), influence,
involvement, trust

8/3/2019 Analysis King 2
http://slidepdf.com/reader/full/analysis-king-2 27/36
ANOVAb
Model
Sum of
Squares df
Mean
Square F Sig.
1 Regressio
n38.482 3 12.827 67.990 .000a
Residual 36.979 196 .189
Total 75.461 199
a. Predictors: (Constant), influence,
involvement, trust
b. Dependent Variable: satisfaction

8/3/2019 Analysis King 2
http://slidepdf.com/reader/full/analysis-king-2 28/36
Coefficientsa
Model
UnstandardizedCoefficients
Standardiz
ed
Coefficients
t Sig.B Std. Error Beta
1 (Constant) .669 .205 3.267 .001
involvemen
t.530 .054 .527 9.904 .000
trust .226 .043 .291 5.236 .000
influence .064 .038 .092 1.707 .089
a. Dependent Variable: satisfaction
From the table: Summary of Regression Analysis
Regression analysis of all independent variables with satisfaction
Dependent Variables independent Variables std. Coefficient
Satisfaction Involvement 0.527**
Trust 0.291**
Influence 0.092
R2 0.510
Adjust R2 0.502
Sig. F 67.990
Note: significant Levels: ** p < 0.01, * p < 0.05

8/3/2019 Analysis King 2
http://slidepdf.com/reader/full/analysis-king-2 29/36
From the regression analysis, we can make a conclusion that the
independent variables (influence), is not significant compare to the other
variables. That why in the correlation analysis, the relation between
influence and involvement is very low because influence variable is notsignificant.
Chapter 5: Discussion and conclusion
5.1 Introduction
The purposes of this chapter are to summarize and discuss the relevantfindings of this study. First, this chapter present brief view purpose and
then result of this study. Then, continue with discussion. Next, is
theoretical and methodological, contribution as well as managerial
implications. Finally, the limitation and recommendation part of this study
for future research.
5.2 Discussion of Findings

8/3/2019 Analysis King 2
http://slidepdf.com/reader/full/analysis-king-2 30/36
Factor analysis is to summarize patterns of correlations among observed
variables, to reduce a large number of observed variables to a smaller
numbers of factors, and to provide an operational definition for an
underlying process. The dependent variable in this study is satisfactionwhile independent variable is trust, involvement and influence. Both
dependent and independent variables are significant because all is more
than 1 (refer to discussion, chapter 4). Reliability analysis is to establish
by testing for both consistency and stability of the set of item that
positively correlated to one another. Cronbach’s alpha was calculated. In
this study, the Cronbach’s alpha value is more than 0.6 and it shows that
the variables have high internal consistency reliability. Descriptive
Analysis measure the value of the mean and the standard Deviation of the
variables. The mean in this study was 3.00 and it consider as average. The
Pearson correlation coefficient values can vary from -1.00 to +1.00.the
number of +1.00 represent perfect positive correlation, while -1.00
represent perfect negative correlation. Relation between involvement and
satisfaction is the highest and the lowest is relation between influence and
involvement (refer to discussion, chapter 4). Finally, in regression
analysis, in this study can conclude that the independent variables
(influence), is not significant compare to the other variables (refer to
discussion, chapter 4).
5.3 Contribution of research
This study offers theoretical ramification. This study also contributes of
student involvement, satisfaction, trust and factor that influence customer
in using online banking. In today’s business environment, students are
aware of the importance of online banking especially among
undergraduate students. Through this study, it provides the main factor
which attracted students to use online banking in daily transaction. The
findings which derived from this research may be useful to students

8/3/2019 Analysis King 2
http://slidepdf.com/reader/full/analysis-king-2 31/36
insofar as alerting them to the factor of attracted in using online banking.
Finally, this also study provide some useful guidelines for academician or
policy makers, to increase the usage of online banking among students.
5.4 Managerial Implication
The findings of this study provide several managerial implications for
manager and practitioner, especially those who are involve with online
banking. This study provide strong evidence that it could help managers
to gain better knowledge on the usage of online banking among students ,
based on the result that we can conclude that in chapter 4 we achieved
our objective which is (1) to investigate the involvement of students in
using online banking, (2) to determine the satisfaction of existing student
that offer by online banking, (3) to determine the trustable level of the
students towards online banking and (4) to identify the factor that
influence student in using online banking.
In term of the involvement, online banking become students choice
because online banking is very reliable. It provide easy access information
to student, and the transaction are economical as well as it outstanding
quality. Nowadays, involvement of customers especially students are
more like to use online banking for every single transaction even to do
reload transaction.
To determine the satisfaction of existing student that offer by online
banking can help students to manager and control their finance
efficiently, easier to conduct banking transaction. Online banking is
convenient for students because it does not require a lot of mental effort.
Students will feel satisfied with online banking because online banking is
compatible with their lifestyle.
Based on the result, student feel more trusted when using online banking.
It because they find out their privacy risk protected by bank. Students feel
confident when using online banking because the information concerning
by them in online banking transaction cannot be access by other throughtransaction access code (TAC).

8/3/2019 Analysis King 2
http://slidepdf.com/reader/full/analysis-king-2 32/36
Lastly, the objective which stated in this study that already achieved is
factor that influence student in using online banking. Influence from friend
one of factor as well influence from family member. Due to online banking
service is available for 24 hours for seven day nonstop it is veryconvenient for student to manage their account effectively.
5.5 Limitations of the study
This study is constrained by limitation as well. Specific limitation of the
methodology and methods are discussed on Chapter 4 in regards to
limitation of data collection and data analysis along the stages of the
development cycle. The limitations of the research are first addressed by
discussion the objective of the research, discussion the limitation of the
data, data analysis and the validity of analysis.
• Objective of research
The main objective of this research is to determine the usage of
online banking in Malaysia among student especially in UMSKAL.
The limitation which this study found are restricted by the limited
number of questionnaire may affect the accuracy of research. Totalcandidate for this research are 200 students out of 2550 students.
Therefore, it will be problematic to generalize the findings to other
part as well. Besides that, the accuracy of the research is full
depended on the respondent. It based on their cooperation and how
they fill the questionnaire. Some of the person which fill up this
questionnaire just fill and not answering according to question. The
“trustworthiness” of research depend on “what counts as
knowledge?” (Lincoln & Guba,1985). The limitations of this study are
the respondent may not fully understand about the certain meaning
in the questionnaire that will lead to different meaning. This
research also only focus student in UMSKAL, and this questionnaire
also not distributed to the lectures as well.
• Limitation of data
Data management involves the procedure used for a systematic,
process of data collection, storage and retrieval for the high quality,

8/3/2019 Analysis King 2
http://slidepdf.com/reader/full/analysis-king-2 33/36
accessible data, the documentation of analysis and retention of data
( Huberman & Miles,1998 ). Data source for this questionnaire are
based on questionnaire which is the limitation. The targets for this
study are student who are among 18-24 years. However the datawhich used for this research are fully completed.
• Data analysis
All the data collected will be analyzed through Statistical Program
for Social Science (SPSS). This software will help to identify the
association and relationship between variables. Cronbach’s alpha is
used to measure the reliability of data collected. Coefficient alpha
between 70% to 80% are acceptable and more than 80% are good
(Sekaran & Bougie,2009) .The limitation which gain through this
data are some of the variables are fall below 70% which have to
reject the variable.
However, within the limitations of the study the study provide some
interesting result and spend avenues for further result.
5.6 Recommendation for Future Research
Due to the limitation of the study on online banking, this has shown that
the future study on similar research should be refined and making
improvement in order to create more conciseness and more sufficient
data to make easier to understand on the related study. Therefore,
through the limitation of the study, objective of the research, limitation of
the data as well as the data analysis, this study has stated clearly thatsome recommendation are needed to improve on future research.
From the first limitation of the study which is the main objective of the
research. UMSKAL has around 2550 local and foreign students, instead of
taking all students; the study enquires only 200 students out of 2550 that
will be almost only 8% students from UMSKAL. Therefore, this limited
number of respondent on our questionnaire may be affecting the accuracy
of the research. Besides that, when doing some research we need a lot of
8/3/2019 Analysis King 2
http://slidepdf.com/reader/full/analysis-king-2 34/36
information from a large group instead of asking question towards a small
amount of people. This study suggests that for the future research, the
number of the respondent on our questionnaire need to be exceeding the
amount than this study. That will be 2000 respondent of questionnaire inorder to avoid inaccuracy of research and provide sufficient data to the
future study. Since in UMSKAL there have around 2550 students, so the
more respondent on our questionnaire, the more accuracy of the study.
In additional, besides the amount of respondent on the questionnaire, this
study also suggests that for the future research, researchers should focus
on the attitude from the respondents. This situation depends on their
cooperative and the way they answering the question from the
questionnaire. Sometimes, when asking respondent to answer the
questionnaire, for the one whom asking for help should be patient and
they need to explain how to answer or what the meaning of the question
is. If we fulfil the requirements, the respondent will help us finish the
tasks. In addition, this study also needs more cooperative from the
respondent. If the respondent more cooperative, the questionnaire will be
easily to solve. But in the other hand, if the respondents don’t want to
cooperative with us, these will interference the result. Therefore, we must
be polite and asking for some time for us to answer our questionnaire at
first. If the respondent really in hurry, we shouldn’t block him instead we
need to thank them because they willing to hear your favour. After the
respondents finished the questionnaire, we should thank them with
sincerely then they will feel more comfortable.
Besides the two limitations above, in sometimes the respondents may not
fully understand about the certain meaning in the questionnaire. In fact,
this will make them misunderstand the question and lead them to a
different meaning and different answer. Therefore, researchers should
lend a hand to each responder. So, the researchers need to be at
respondents’ side to help them understanding the questionnaire. Besides
that, we can also help respondents finished the questionnaire by orally.
This will make easily to the respondents to understand the questionnaire

8/3/2019 Analysis King 2
http://slidepdf.com/reader/full/analysis-king-2 35/36
faster and answering the question smoother. In result, the accuracy for
the research will be more accurate and having sufficient result data.
This study also suggest that to avoid some of the variable reject due to
the cronbach’s alpha fall below 70%, other variable should be over 70%as
well as exceeding 80%. This is because reliabilities less than 60% is
consider as poor, 70% is range, acceptable and over 80% is good. Based
on the table summary of reliabilities analysis although the variable of
influence is 0.639 which is 63.90%, is still consider acceptable, as long as
there are not below 0.50 which is 50%. If the cronbach’s alpha is below
0.50, the variable should be reject.
5.7 Conclusion
As a conclusion, the current study is carried out to a gain better
understanding for the relationship between involvement, satisfaction,
trust and factors that influence students in using online banking. This
study also incorporates both reliable and quality as conduct of
involvement in order to gain more insight into how students perceive the
benefit of online banking as well as satisfaction when using online banking
services.
A review of the satisfaction showed mixed findings concerning the
relationship between involvement, trust and influence in using online
banking services of university students. Nevertheless, the finding of the
study shows that students trust and involvement has a substantial
influence of satisfaction on online banking services with the bank
performance. Security and privacy of the online banking system is one of
the important things for students when using online banking services.
Online banking in fact is indeed a very good use of service offer by the
banks. Nowadays, mostly all the banks in Malaysia are offering online
banking service such as the Maybank had launch their online banking
system – “Maybank2u” which have been launched 11 years until now.
The following successful of online banking system “Maybank2u”, thebanks in Malaysia have launched their own online banking system one by

8/3/2019 Analysis King 2
http://slidepdf.com/reader/full/analysis-king-2 36/36
another. This shown that online banking is not only easy-to-use for access
information, very reliable but also reducing the time of complicated
procedures during bank in.
Therefore, present study suggests that in order to increase users of online
banking, online banking managers should be more concentrate on the
involvement, trust, influences and satisfaction as the part of strategy. By
maintaining and strengthening the satisfaction, it will position the quality
of online banking, security and privacy in mind of consumers. Besides
that, online banking managers can also make decision regarding market
expansion and be more concentrate on the security and privacy of this
online banking service. If the security and privacy are officially recognized
as safety, ordinary people will use more on online banking than travel to
the bank to bank in, pay or take out their money. Therefore, there is a
need to understand the important roles of online banking services.