Embed Size (px)
Citation preview

Survey of Faculty Practices
Page 1 of 41
Analysis by School
School of Business
Contents
• Description of Respondents o Departments o Number of Sections o Level of Course o Class Section Enrollment o Faculty Rank o Transformed Course
• Culminating Experiences o No Final o Comprehensive Final Type o Targeted Final Type o Final Assignment Type o Final Assignment Due Date o Length of Final Exam Period o Weight of Final o Reading Period
• Out of Class Assignments o Number of Short Papers Assigned o Number of Hours per Short Paper o Number of Long Papers Assigned o Number of Hours per Long Paper o Number of Problem Solving Activities Assigned o Number of Hours per Problem Solving Activity o Number of Other Activities Assigned o Number of Hours per Other Activity o Weight of Out of Class Assignments
• Activities and Scheduling o Lab, Studio, or Practicum o Out of Class Meetings o Use of Fourth Hour o Colloquia Period Overlap

SFP – School of Business
Page 2 of 41
Description of Respondents Department
Frequency Percent Valid Percent Cumulative
Percent Valid School of Business
Departments 56 100.0 100.0 100.0

SFP – School of Business
Page 3 of 41
Number of Sections Summarized
Valid 56 N Missing 0
Mean 2.07 Median 2.00 Mode 1 Std. Deviation 1.059 Minimum 1 Maximum 4
Number of Sections Summarized
Frequency Percent Valid Percent Cumulative
Percent 1 21 37.5 37.5 37.52 18 32.1 32.1 69.63 9 16.1 16.1 85.74 8 14.3 14.3 100.0
Valid
Total 56 100.0 100.0
4321
Number of Sections Summarized
25
20
15
10
5
0
Freq
uenc
y
Cases weighted by Number of Sections Summarized
School: School of Business
Number of Sections Summarized
SFP – School of Business
Page 4 of 41
Level of Course
Frequency Percent Valid Percent Cumulative
Percent 100 8 14.3 14.3 14.3200 26 46.4 46.4 60.7300 14 25.0 25.0 85.7400 8 14.3 14.3 100.0
Valid
Total 56 100.0 100.0
400300200100
Level of Course
30
25
20
15
10
5
0
Freq
uenc
y
Cases weighted by Number of Sections Summarized
School: School of Business
Level of Course

SFP – School of Business
Page 5 of 41
Class Section Enrollment
Frequency Percent Valid Percent Cumulative
Percent <10 1 1.8 2.2 2.211-18 2 3.6 4.3 6.519-29 20 35.7 43.5 50.030-40 12 21.4 26.1 76.1>41 11 19.6 23.9 100.0
Valid
Total 46 82.1 100.0 Missing System 10 17.9 Total 56 100.0
>4130-4019-2911-18<10
Class Section Enrollment
20
15
10
5
0
Freq
uenc
y
Cases weighted by Number of Sections Summarized
School: School of Business
Class Section Enrollment

SFP – School of Business
Page 6 of 41
Faculty Rank
Frequency Percent Valid Percent Cumulative
Percent Full-time 44 78.6 86.3 86.3Adjunct 7 12.5 13.7 100.0
Valid
Total 51 91.1 100.0 Missing System 5 8.9 Total 56 100.0
AdjunctFull-time
Faculty Rank
50
40
30
20
10
0
Freq
uenc
y
Cases weighted by Number of Sections Summarized
School: School of Business
Faculty Rank
Transformed Course
Frequency Percent Valid Percent Cumulative
Percent Valid Is transformed 56 100.0 100.0 100.0

SFP – School of Business
Page 7 of 41
Culminating Experiences No Final
Frequency Percent Valid Percent Cumulative
Percent Valid There is a final 56 100.0 100.0 100.0
Comprehensive Final Type
Frequency Percent Valid Percent Cumulative
Percent final comprehensive exam 41 73.2 85.4 85.4
final comprehensive project 7 12.5 14.6 100.0
Valid
Total 48 85.7 100.0 Missing System 8 14.3 Total 56 100.0
final comprehensive projectfinal comprehensive exam
Comprehensive Final Type
50
40
30
20
10
0
Freq
uenc
y
Cases weighted by Number of Sections Summarized
School: School of Business
Comprehensive Final Type

SFP – School of Business
Page 8 of 41
Targeted Final Type
Frequency Percent Valid Percent Cumulative
Percent final targeted exam 9 16.1 60.0 60.0final targeted paper 4 7.1 26.7 86.7final targeted project 2 3.6 13.3 100.0
Valid
Total 15 26.8 100.0 Missing System 41 73.2 Total 56 100.0
final targeted projectfinal targeted paperfinal targeted exam
Targeted Final Type
10
8
6
4
2
0
Freq
uenc
y
Cases weighted by Number of Sections Summarized
School: School of Business
Targeted Final Type

SFP – School of Business
Page 9 of 41
Final Assignment Type
Frequency Percent Valid Percent Cumulative
Percent Comprehensive exam 35 62.5 62.5 62.5Comprehensive project 6 10.7 10.7 73.2Targeted exam 8 14.3 14.3 87.5Comprehensive exam & targeted paper 4 7.1 7.1 94.6
Comprehensive exam & targeted project 2 3.6 3.6 98.2
Comprehensive project & targeted exam 1 1.8 1.8 100.0
Valid
Total 56 100.0 100.0
Comprehensiveproject &
targeted exam
Comprehensiveexam &
targeted project
Comprehensiveexam &
targeted paper
Targeted examComprehensiveproject
Comprehensiveexam
Final Assignment Type
40
30
20
10
0
Freq
uenc
y
Cases weighted by Number of Sections Summarized
School: School of Business
Final Assignment Type

SFP – School of Business
Page 10 of 41
Final Assignment Due Date
Frequency Percent Valid Percent Cumulative
Percent last week of classes 23 41.1 41.8 41.8scheduled final exam period 27 48.2 49.1 90.9
scheduled mass exam period 4 7.1 7.3 98.2
not applicable (no final assignment) 1 1.8 1.8 100.0
Valid
Total 55 98.2 100.0 Missing System 1 1.8 Total 56 100.0
not applicable (no finalassignment)
scheduled mass examperiod
scheduled final examperiod
last week of classes
Final Assignment Due Date
30
25
20
15
10
5
0
Freq
uenc
y
Cases weighted by Number of Sections Summarized
School: School of Business
Final Assignment Due Date

SFP – School of Business
Page 11 of 41
Length of Final Exam Period Needed
Valid 51 N Missing 5
Mean 2.2941 Median 2.0000 Mode 2.00 Std. Deviation .43791 Minimum 2.00 Maximum 3.00
Length of Final Exam Period Needed
Frequency Percent Valid Percent Cumulative
Percent 2.00 34 60.7 66.7 66.72.50 4 7.1 7.8 74.53.00 13 23.2 25.5 100.0
Valid
Total 51 91.1 100.0 Missing System 5 8.9 Total 56 100.0
3.002.502.00
Length of Final Exam Period Needed
40
30
20
10
0
Freq
uenc
y
Cases weighted by Number of Sections Summarized
School: School of Business
Length of Final Exam Period Needed
SFP – School of Business
Page 12 of 41
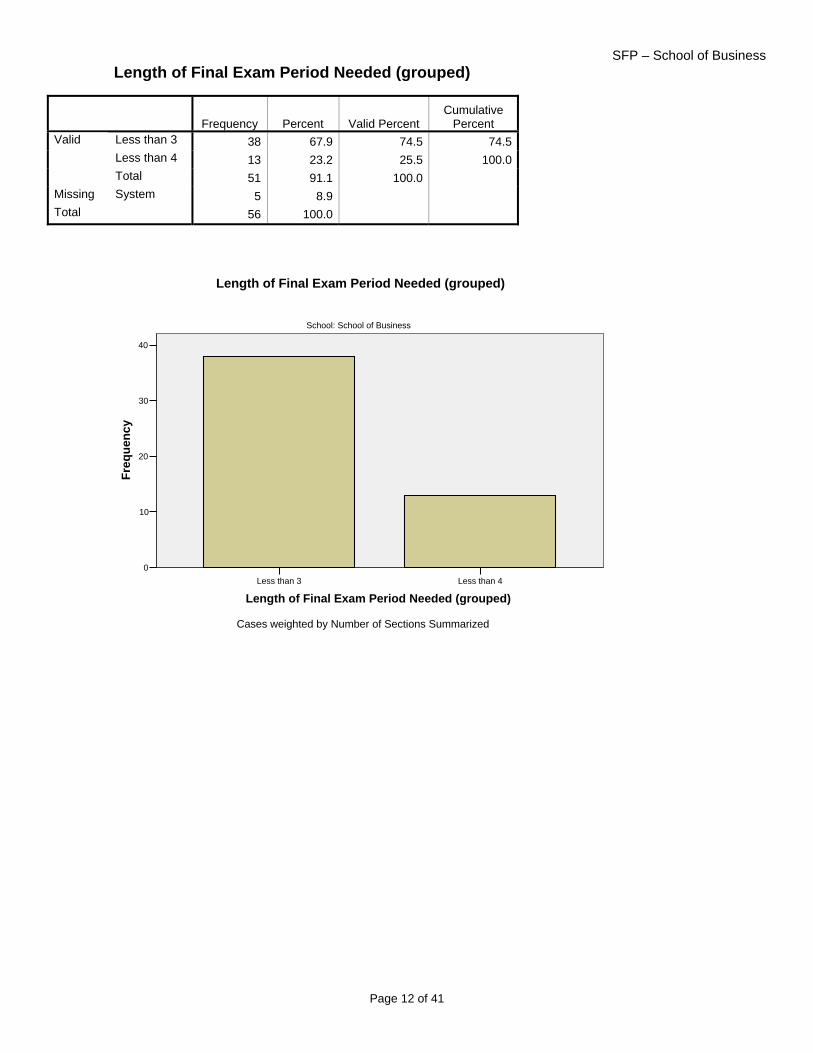
Length of Final Exam Period Needed (grouped)
Frequency Percent Valid Percent Cumulative
Percent Less than 3 38 67.9 74.5 74.5Less than 4 13 23.2 25.5 100.0
Valid
Total 51 91.1 100.0 Missing System 5 8.9 Total 56 100.0
Less than 4Less than 3
Length of Final Exam Period Needed (grouped)
40
30
20
10
0
Freq
uenc
y
Cases weighted by Number of Sections Summarized
School: School of Business
Length of Final Exam Period Needed (grouped)

SFP – School of Business
Page 13 of 41
Weight of Final as a Percent of Final Grade
Valid 56 N Missing 0
Mean 26.4464 Median 30.0000 Mode 30.00 Std. Deviation 10.09396 Minimum 2.00 Maximum 60.00
a School = School of Business Weight of Final as a Percent of Final Grade
Frequency Percent Valid Percent Cumulative
Percent 2.00 1 1.8 1.8 1.85.00 1 1.8 1.8 3.610.00 2 3.6 3.6 7.115.00 5 8.9 8.9 16.120.00 11 19.6 19.6 35.725.00 6 10.7 10.7 46.430.00 18 32.1 32.1 78.633.00 3 5.4 5.4 83.935.00 4 7.1 7.1 91.140.00 3 5.4 5.4 96.450.00 1 1.8 1.8 98.260.00 1 1.8 1.8 100.0
Valid
Total 56 100.0 100.0

SFP – School of Business
Page 14 of 41
60.0050.0040.0035.0033.0030.0025.0020.0015.0010.005.002.00
Weight of Final as a Percent of Final Grade
20
15
10
5
0
Freq
uenc
y
Cases weighted by Number of Sections Summarized
School: School of Business
Weight of Final as a Percent of Final Grade

SFP – School of Business
Page 15 of 41
Weight of Final as a Percent of Final Grade (grouped)
Frequency Percent Valid Percent Cumulative
Percent Less than 10% 2 3.6 3.6 3.610 -19% 7 12.5 12.5 16.120 - 29% 17 30.4 30.4 46.430- 39% 25 44.6 44.6 91.140 - 49% 3 5.4 5.4 96.450 - 59% 1 1.8 1.8 98.260 - 69% 1 1.8 1.8 100.0
Valid
Total 56 100.0 100.0
60 - 69%50 - 59%40 - 49%30- 39%20 - 29%10 -19%Less than10%
Weight of Final as a Percent of Final Grade (grouped)
25
20
15
10
5
0
Freq
uenc
y
Cases weighted by Number of Sections Summarized
School: School of Business
Weight of Final as a Percent of Final Grade (grouped)
SFP – School of Business
Page 16 of 41
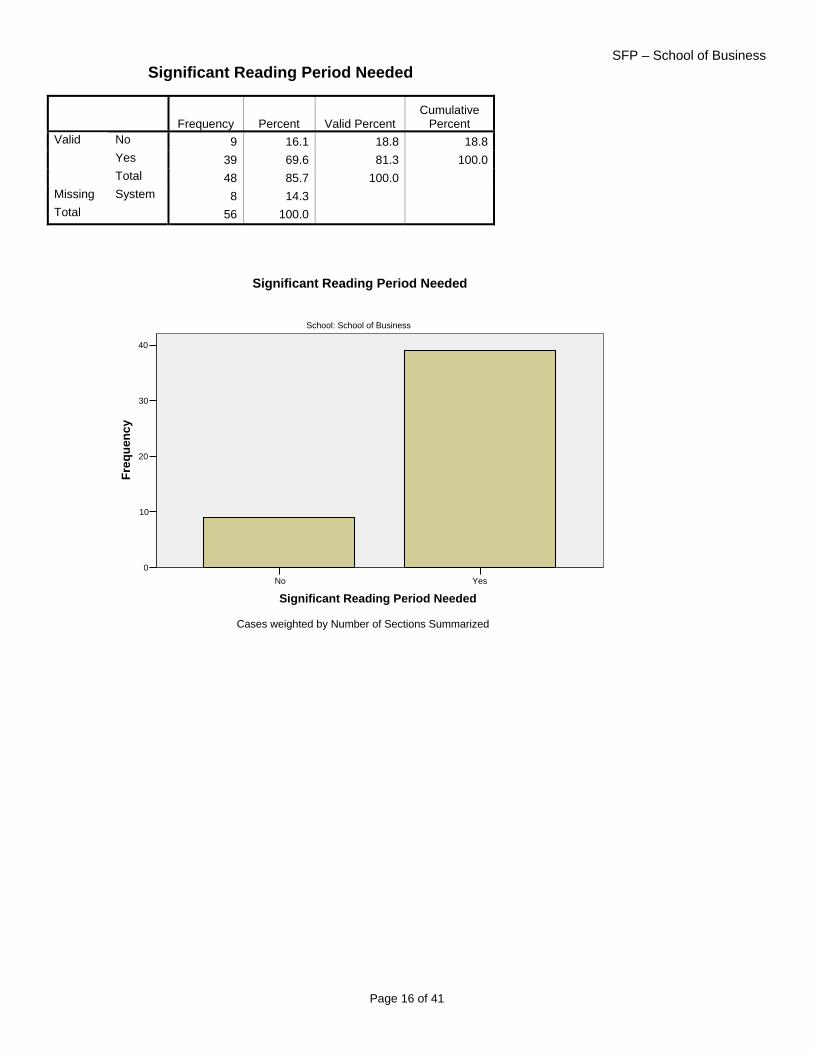
Significant Reading Period Needed
Frequency Percent Valid Percent Cumulative
Percent No 9 16.1 18.8 18.8Yes 39 69.6 81.3 100.0
Valid
Total 48 85.7 100.0 Missing System 8 14.3 Total 56 100.0
YesNo
Significant Reading Period Needed
40
30
20
10
0
Freq
uenc
y
Cases weighted by Number of Sections Summarized
School: School of Business
Significant Reading Period Needed

SFP – School of Business
Page 17 of 41
Out of Class Assignments Number of Short Papers Assigned
Valid 23 N Missing 33
Mean 3.4348 Median 3.0000 Mode 2.00 Std. Deviation 2.10683 Minimum 1.00 Maximum 8.00
Number of Short Papers Assigned
Frequency Percent Valid Percent Cumulative
Percent 1.00 4 7.1 17.4 17.42.00 7 12.5 30.4 47.83.00 1 1.8 4.3 52.24.00 4 7.1 17.4 69.65.00 4 7.1 17.4 87.06.00 1 1.8 4.3 91.38.00 2 3.6 8.7 100.0
Valid
Total 23 41.1 100.0 Missing System 33 58.9 Total 56 100.0
8.006.005.004.003.002.001.00
Number of Short Papers Assigned
7
6
5
4
3
2
1
0
Cases weighted by Number of Sections Summarized
School: School of Business
Number of Short Papers Assigned
Freq
uenc
y
SFP – School of Business
Page 18 of 41
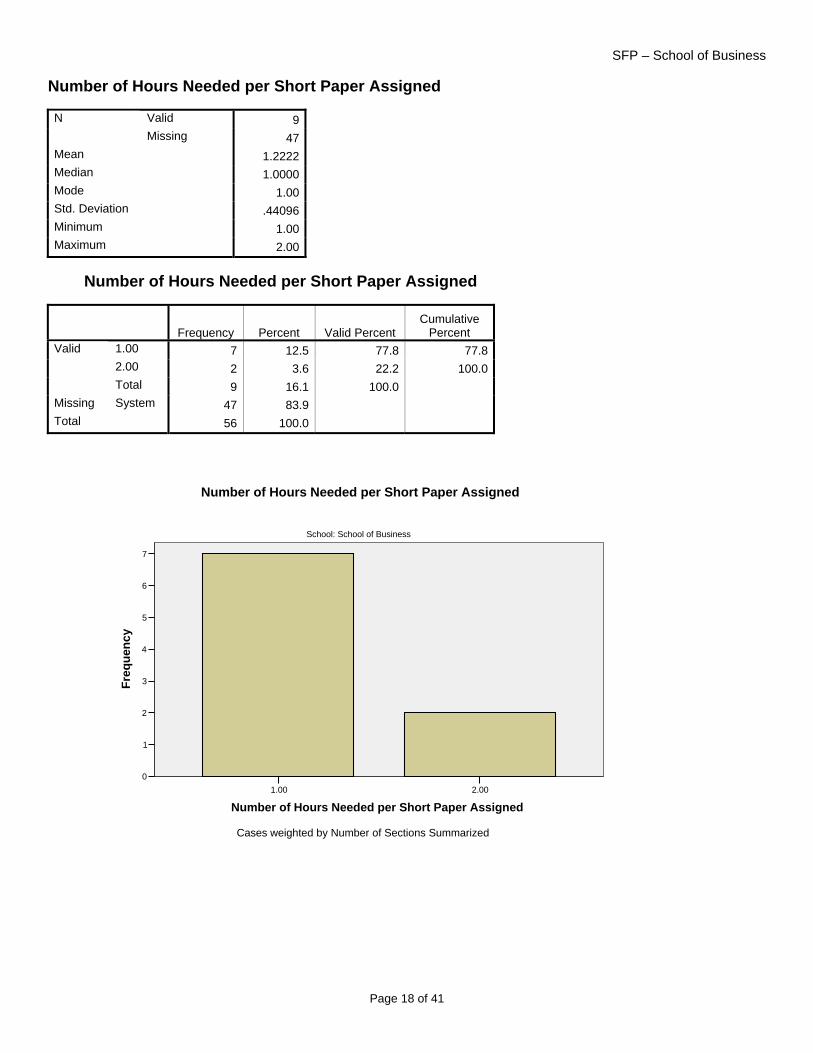
Number of Hours Needed per Short Paper Assigned
Valid 9 N Missing 47
Mean 1.2222 Median 1.0000 Mode 1.00 Std. Deviation .44096 Minimum 1.00 Maximum 2.00
Number of Hours Needed per Short Paper Assigned
Frequency Percent Valid Percent Cumulative
Percent 1.00 7 12.5 77.8 77.82.00 2 3.6 22.2 100.0
Valid
Total 9 16.1 100.0 Missing System 47 83.9 Total 56 100.0
2.001.00
Number of Hours Needed per Short Paper Assigned
7
6
5
4
3
2
1
0
Freq
uenc
y
Cases weighted by Number of Sections Summarized
School: School of Business
Number of Hours Needed per Short Paper Assigned
SFP – School of Business
Page 19 of 41
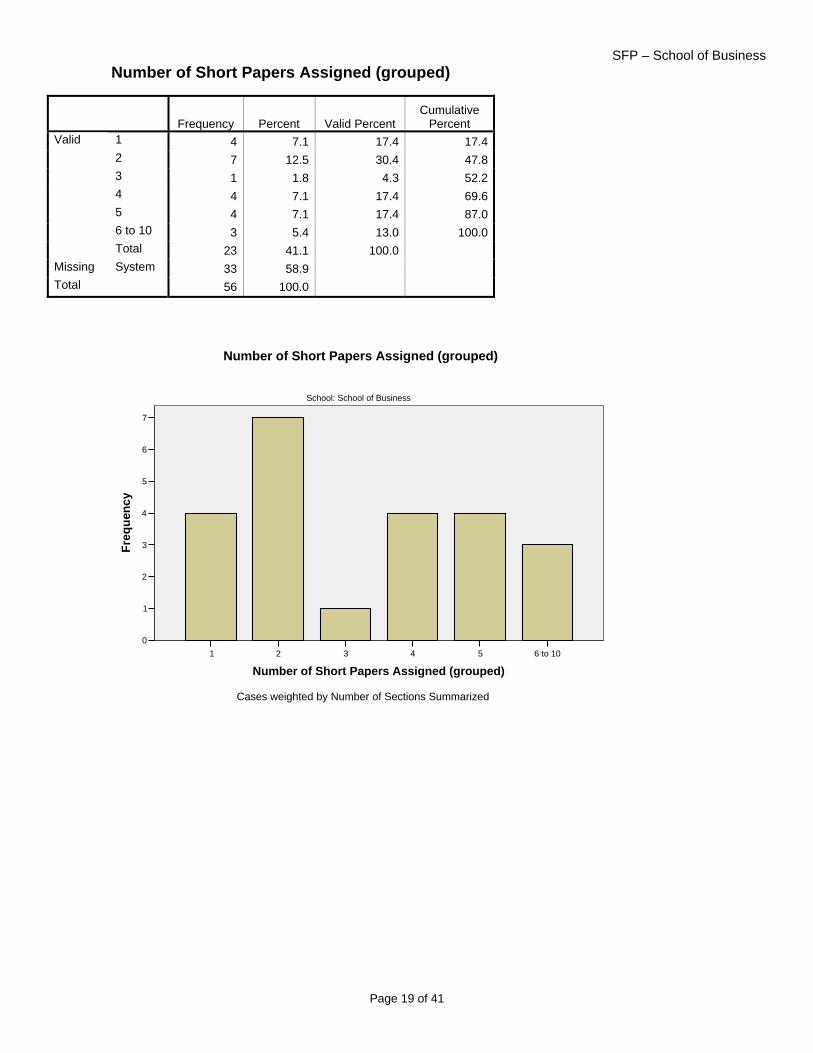
Number of Short Papers Assigned (grouped)
Frequency Percent Valid Percent Cumulative
Percent 1 4 7.1 17.4 17.42 7 12.5 30.4 47.83 1 1.8 4.3 52.24 4 7.1 17.4 69.65 4 7.1 17.4 87.06 to 10 3 5.4 13.0 100.0
Valid
Total 23 41.1 100.0 Missing System 33 58.9 Total 56 100.0
6 to 1054321
Number of Short Papers Assigned (grouped)
7
6
5
4
3
2
1
0
Freq
uenc
y
Cases weighted by Number of Sections Summarized
School: School of Business
Number of Short Papers Assigned (grouped)

SFP – School of Business
Page 20 of 41
Number of Hours Needed per Short Paper Assigned (grouped)
Frequency Percent Valid Percent Cumulative
Percent 1 7 12.5 77.8 77.82 2 3.6 22.2 100.0
Valid
Total 9 16.1 100.0 Missing System 47 83.9 Total 56 100.0
21
Number of Hours Needed per Short Paper Assigned (grouped)
7
6
5
4
3
2
1
0
Freq
uenc
y
Cases weighted by Number of Sections Summarized
School: School of Business
Number of Hours Needed per Short Paper Assigned (grouped)

SFP – School of Business
Page 21 of 41
Number of Long Papers Assigned
Valid 29 N Missing 27
Mean 11.1379 Median 10.0000 Mode 20.00 Std. Deviation 8.36115 Minimum 1.00 Maximum 30.00
Number of Long Papers Assigned
Frequency Percent Valid Percent Cumulative
Percent 1.00 2 3.6 6.9 6.93.00 3 5.4 10.3 17.24.00 5 8.9 17.2 34.55.00 2 3.6 6.9 41.48.00 2 3.6 6.9 48.310.00 1 1.8 3.4 51.712.00 4 7.1 13.8 65.514.00 2 3.6 6.9 72.420.00 6 10.7 20.7 93.130.00 2 3.6 6.9 100.0
Valid
Total 29 51.8 100.0 Missing System 27 48.2 Total 56 100.0

SFP – School of Business
Page 22 of 41
30.0020.0014.0012.0010.008.005.004.003.001.00
Number of Long Papers Assigned
6
5
4
3
2
1
0
Freq
uenc
y
Cases weighted by Number of Sections Summarized
School: School of Business
Number of Long Papers Assigned
SFP – School of Business
Page 23 of 41
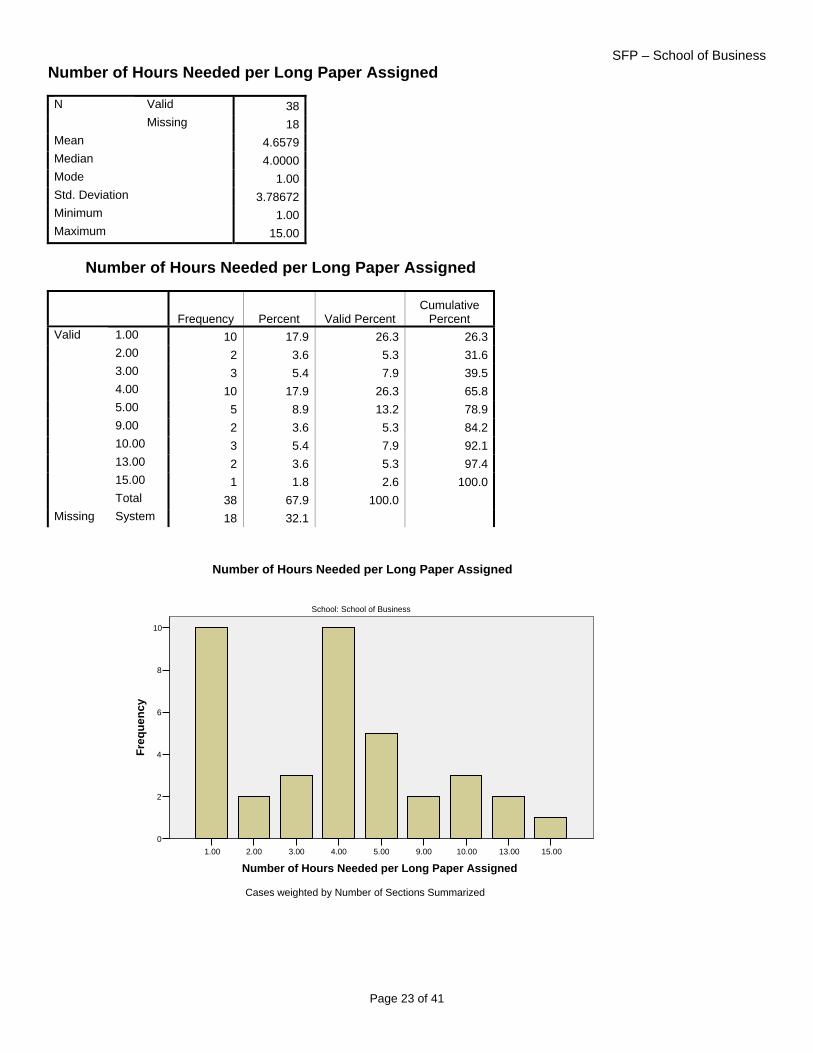
Number of Hours Needed per Long Paper Assigned
Valid 38 N Missing 18
Mean 4.6579 Median 4.0000 Mode 1.00 Std. Deviation 3.78672 Minimum 1.00 Maximum 15.00
Number of Hours Needed per Long Paper Assigned
Frequency Percent Valid Percent Cumulative
Percent 1.00 10 17.9 26.3 26.32.00 2 3.6 5.3 31.63.00 3 5.4 7.9 39.54.00 10 17.9 26.3 65.85.00 5 8.9 13.2 78.99.00 2 3.6 5.3 84.210.00 3 5.4 7.9 92.113.00 2 3.6 5.3 97.415.00 1 1.8 2.6 100.0
Valid
Total 38 67.9 100.0 Missing System 18 32.1
15.0013.0010.009.005.004.003.002.001.00
Number of Hours Needed per Long Paper Assigned
10
8
6
4
2
0
Cases weighted by Number of Sections Summarized
School: School of Business
Number of Hours Needed per Long Paper Assigned
Freq
uenc
y

SFP – School of Business
Page 24 of 41
Number of Long Papers Assigned (grouped)
Frequency Percent Valid Percent Cumulative
Percent 1 2 3.6 6.9 6.93 3 5.4 10.3 17.24 5 8.9 17.2 34.55 2 3.6 6.9 41.46 to 10 3 5.4 10.3 51.711 to 15 6 10.7 20.7 72.416 or more 8 14.3 27.6 100.0
Valid
Total 29 51.8 100.0 Missing System 27 48.2 Total 56 100.0
16 or more11 to 156 to 105431
Number of Long Papers Assigned (grouped)
8
6
4
2
0
Freq
uenc
y
Cases weighted by Number of Sections Summarized
School: School of Business
Number of Long Papers Assigned (grouped)

SFP – School of Business
Page 25 of 41
Number of Hours Needed per Long Paper Assigned (grouped)
Frequency Percent Valid Percent Cumulative
Percent 1 10 17.9 26.3 26.32 2 3.6 5.3 31.63 3 5.4 7.9 39.54 10 17.9 26.3 65.85 5 8.9 13.2 78.96 to 10 5 8.9 13.2 92.111 to 15 3 5.4 7.9 100.0
Valid
Total 38 67.9 100.0 Missing System 18 32.1 Total 56 100.0
11 to 156 to 1054321
Number of Hours Needed per Long Paper Assigned (grouped)
10
8
6
4
2
0
Freq
uenc
y
Cases weighted by Number of Sections Summarized
School: School of Business
Number of Hours Needed per Long Paper Assigned (grouped)
SFP – School of Business
Page 26 of 41
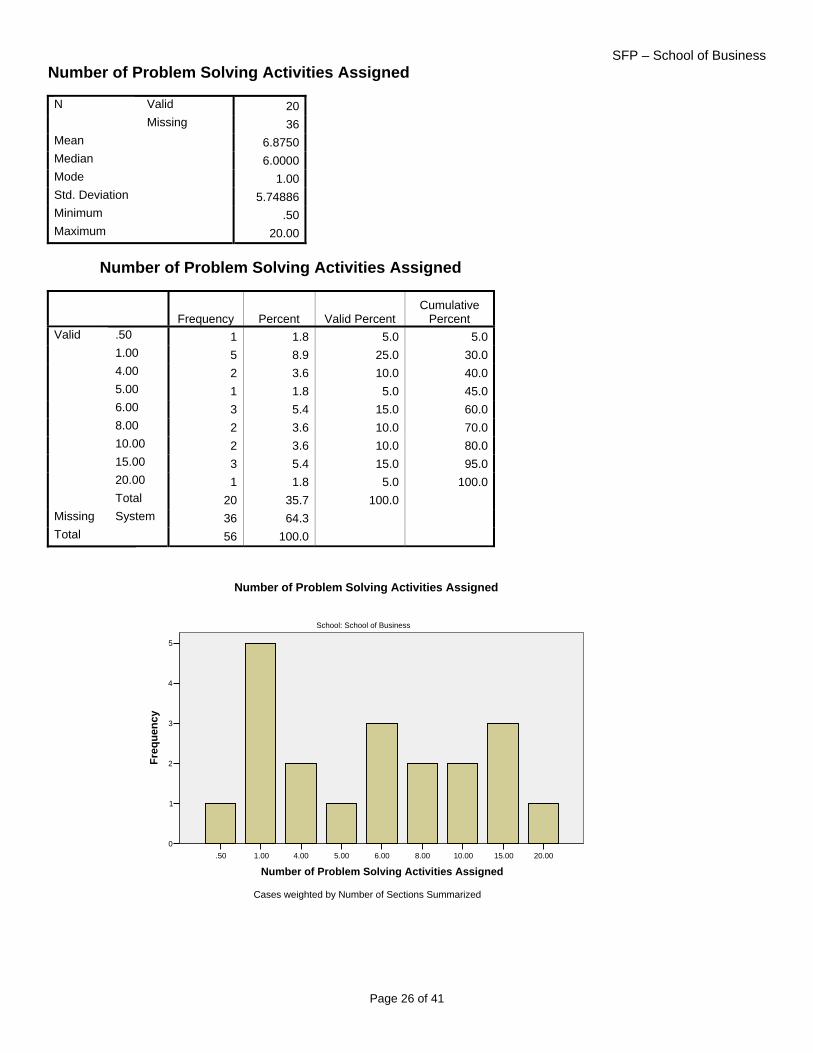
Number of Problem Solving Activities Assigned
Valid 20 N Missing 36
Mean 6.8750 Median 6.0000 Mode 1.00 Std. Deviation 5.74886 Minimum .50 Maximum 20.00
Number of Problem Solving Activities Assigned
Frequency Percent Valid Percent Cumulative
Percent .50 1 1.8 5.0 5.01.00 5 8.9 25.0 30.04.00 2 3.6 10.0 40.05.00 1 1.8 5.0 45.06.00 3 5.4 15.0 60.08.00 2 3.6 10.0 70.010.00 2 3.6 10.0 80.015.00 3 5.4 15.0 95.020.00 1 1.8 5.0 100.0
Valid
Total 20 35.7 100.0 Missing System 36 64.3 Total 56 100.0
20.0015.0010.008.006.005.004.001.00.50
Number of Problem Solving Activities Assigned
5
4
3
2
1
0
Cases weighted by Number of Sections Summarized
School: School of Business
Number of Problem Solving Activities Assigned
Freq
uenc
y

SFP – School of Business
Page 27 of 41
Number of Hours Needed per Problem Solving Activity Assigned
Valid 6 N Missing 50
Mean 12.5000 Median 10.0000 Mode 10.00 Std. Deviation 4.18330 Minimum 10.00 Maximum 20.00
Number of Hours Needed per Problem Solving Activity Assigned
Frequency Percent Valid Percent Cumulative
Percent 10.00 4 7.1 66.7 66.715.00 1 1.8 16.7 83.320.00 1 1.8 16.7 100.0
Valid
Total 6 10.7 100.0 Missing System 50 89.3 Total 56 100.0
20.0015.0010.00
Number of Hours Needed per Problem Solving Activity Assigned
4
3
2
1
0
Freq
uenc
y
Cases weighted by Number of Sections Summarized
School: School of Business
Number of Hours Needed per Problem Solving Activity Assigned

SFP – School of Business
Page 28 of 41
Number of Problem Solving Activities Assigned (grouped)
Frequency Percent Valid Percent Cumulative
Percent 1 6 10.7 30.0 30.04 2 3.6 10.0 40.05 1 1.8 5.0 45.06 to 10 7 12.5 35.0 80.011 to 15 3 5.4 15.0 95.016 or more 1 1.8 5.0 100.0
Valid
Total 20 35.7 100.0 Missing System 36 64.3 Total 56 100.0
16 or more11 to 156 to 10541
Number of Problem Solving Activities Assigned (grouped)
7
6
5
4
3
2
1
0
Freq
uenc
y
Cases weighted by Number of Sections Summarized
School: School of Business
Number of Problem Solving Activities Assigned (grouped)

SFP – School of Business
Page 29 of 41
Number of Hours Needed per Problem Solving Activity Assigned (grouped)
Frequency Percent Valid Percent Cumulative
Percent 6 to 10 4 7.1 66.7 66.711 to 15 1 1.8 16.7 83.316 to 20 1 1.8 16.7 100.0
Valid
Total 6 10.7 100.0 Missing System 50 89.3 Total 56 100.0
16 to 2011 to 156 to 10
Number of Hours Needed per Problem Solving Activity Assigned (grouped)
4
3
2
1
0
Freq
uenc
y
Cases weighted by Number of Sections Summarized
School: School of Business
Number of Hours Needed per Problem Solving Activity Assigned (grouped)
SFP – School of Business
Page 30 of 41
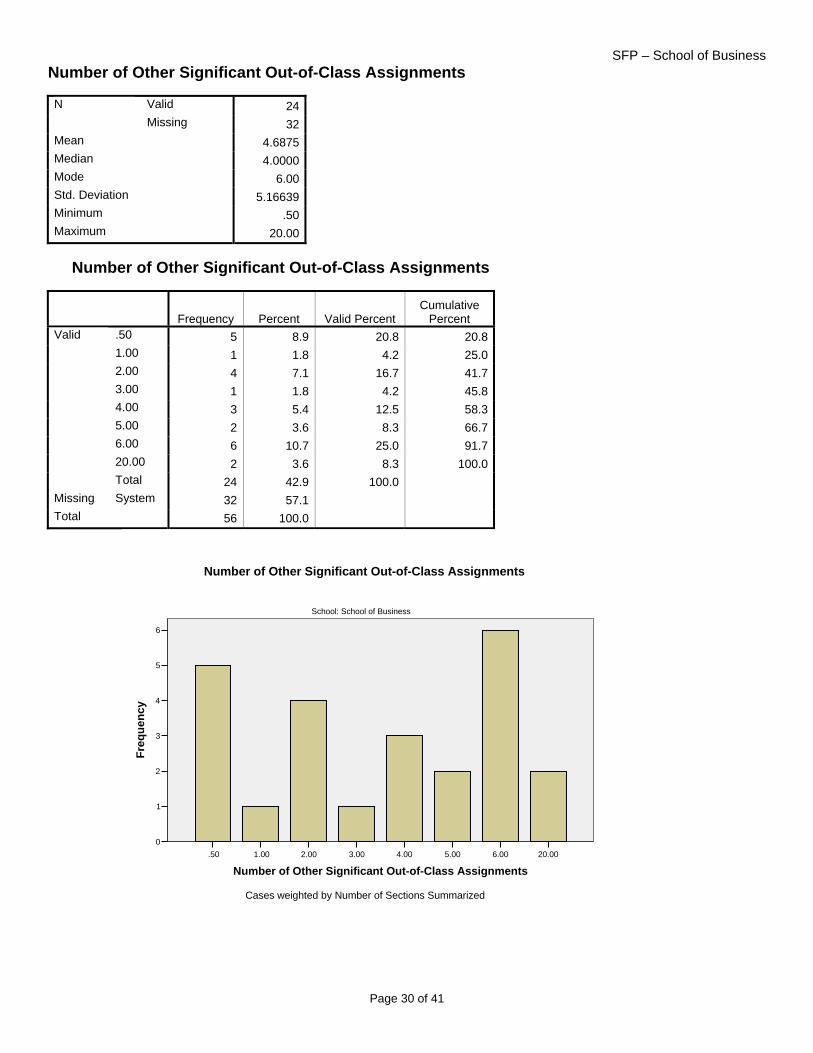
Number of Other Significant Out-of-Class Assignments
Valid 24 N Missing 32
Mean 4.6875 Median 4.0000 Mode 6.00 Std. Deviation 5.16639 Minimum .50 Maximum 20.00
Number of Other Significant Out-of-Class Assignments
Frequency Percent Valid Percent Cumulative
Percent .50 5 8.9 20.8 20.81.00 1 1.8 4.2 25.02.00 4 7.1 16.7 41.73.00 1 1.8 4.2 45.84.00 3 5.4 12.5 58.35.00 2 3.6 8.3 66.76.00 6 10.7 25.0 91.720.00 2 3.6 8.3 100.0
Valid
Total 24 42.9 100.0 Missing System 32 57.1 Total 56 100.0
20.006.005.004.003.002.001.00.50
Number of Other Significant Out-of-Class Assignments
6
5
4
3
2
1
0
Cases weighted by Number of Sections Summarized
School: School of Business
Number of Other Significant Out-of-Class Assignments
Freq
uenc
y

SFP – School of Business
Page 31 of 41
Number of Hours Needed per Other Significant Assignments
Valid 35 N Missing 21
Mean 14.0286 Median 4.0000 Mode 2.00 Std. Deviation 28.25617 Minimum .50 Maximum 100.00
Number of Hours Needed per Other Significant Assignments
Frequency Percent Valid Percent Cumulative
Percent .50 4 7.1 11.4 11.41.00 5 8.9 14.3 25.72.00 8 14.3 22.9 48.64.00 6 10.7 17.1 65.75.00 2 3.6 5.7 71.46.00 1 1.8 2.9 74.38.00 1 1.8 2.9 77.110.00 1 1.8 2.9 80.015.00 2 3.6 5.7 85.740.00 2 3.6 5.7 91.4100.00 3 5.4 8.6 100.0
Valid
Total 35 62.5 100.0 Missing System 21 37.5 Total 56 100.0

SFP – School of Business
Page 32 of 41
100.0040.0015.0010.008.006.005.004.002.001.00.50
Number of Hourse Needed per Other Significant Assignments
8
6
4
2
0
Freq
uenc
y
Cases weighted by Number of Sections Summarized
School: School of Business
Number of Hourse Needed per Other Significant Assignments

SFP – School of Business
Page 33 of 41
Number of Other Significant Out-of-Class Assignments (grouped)
Frequency Percent Valid Percent Cumulative
Percent 1 6 10.7 25.0 25.02 4 7.1 16.7 41.73 1 1.8 4.2 45.84 3 5.4 12.5 58.35 2 3.6 8.3 66.76 to 10 6 10.7 25.0 91.716 or more 2 3.6 8.3 100.0
Valid
Total 24 42.9 100.0 Missing System 32 57.1 Total 56 100.0
16 or more6 to 1054321
Number of Other Significant Out-of-Class Assignments (grouped)
6
5
4
3
2
1
0
Freq
uenc
y
Cases weighted by Number of Sections Summarized
School: School of Business
Number of Other Significant Out-of-Class Assignments (grouped)

SFP – School of Business
Page 34 of 41
Number of Hours Needed per Other Significant Assignments (grouped)
Frequency Percent Valid Percent Cumulative
Percent 1 9 16.1 25.7 25.72 8 14.3 22.9 48.64 6 10.7 17.1 65.75 2 3.6 5.7 71.46 to 10 3 5.4 8.6 80.011 to 15 2 3.6 5.7 85.7more than 20 5 8.9 14.3 100.0
Valid
Total 35 62.5 100.0 Missing System 21 37.5
more than 2011 to 156 to 105421
Number of Hourse Needed per Other Significant Assignments (grouped)
10
8
6
4
2
0
Freq
uenc
y
Cases weighted by Number of Sections Summarized
School: School of Business
Number of Hourse Needed per Other Significant Assignments (grouped)

SFP – School of Business
Page 35 of 41
Weight of Out-of-Class Assignments as a Percent of Final Grade
Valid 52 N Missing 4
Mean 30.0962 Median 30.0000 Mode 20.00 Std. Deviation 15.16609 Minimum 5.00 Maximum 66.00
Weight of Out-of-Class Assignments as a Percent of Final Grade
Frequency Percent Valid Percent Cumulative
Percent 5.00 1 1.8 1.9 1.98.00 2 3.6 3.8 5.810.00 1 1.8 1.9 7.713.00 3 5.4 5.8 13.515.00 4 7.1 7.7 21.220.00 9 16.1 17.3 38.525.00 4 7.1 7.7 46.228.00 1 1.8 1.9 48.130.00 9 16.1 17.3 65.435.00 4 7.1 7.7 73.145.00 3 5.4 5.8 78.850.00 9 16.1 17.3 96.266.00 2 3.6 3.8 100.0
Valid
Total 52 92.9 100.0 Missing System 4 7.1 Total 56 100.0

SFP – School of Business
Page 36 of 41
66.0050.0045.0035.0030.0028.0025.0020.0015.0013.0010.008.005.00
Weight of Out-of-Class Assignments as a Percent of Final Grade
10
8
6
4
2
0
Freq
uenc
y
Cases weighted by Number of Sections Summarized
School: School of Business
Weight of Out-of-Class Assignments as a Percent of Final Grade
SFP – School of Business
Page 37 of 41
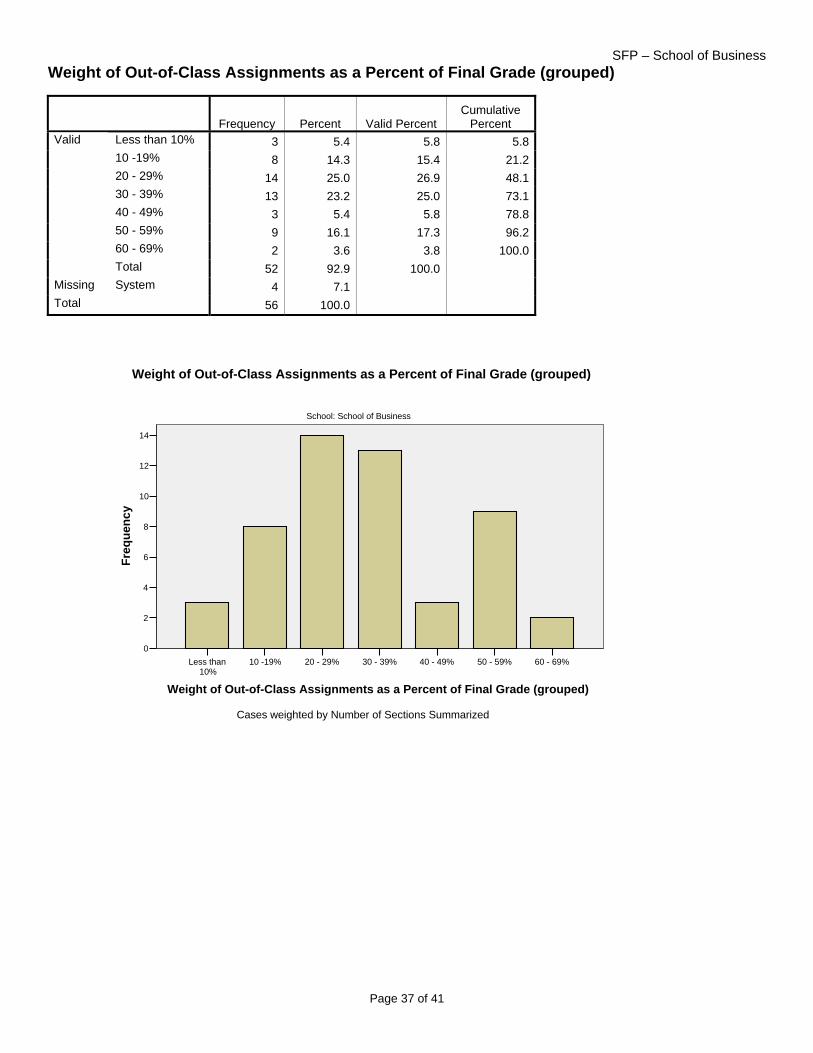
Weight of Out-of-Class Assignments as a Percent of Final Grade (grouped)
Frequency Percent Valid Percent Cumulative
Percent Less than 10% 3 5.4 5.8 5.810 -19% 8 14.3 15.4 21.220 - 29% 14 25.0 26.9 48.130 - 39% 13 23.2 25.0 73.140 - 49% 3 5.4 5.8 78.850 - 59% 9 16.1 17.3 96.260 - 69% 2 3.6 3.8 100.0
Valid
Total 52 92.9 100.0 Missing System 4 7.1 Total 56 100.0
60 - 69%50 - 59%40 - 49%30 - 39%20 - 29%10 -19%Less than10%
Weight of Out-of-Class Assignments as a Percent of Final Grade (grouped)
14
12
10
8
6
4
2
0
Freq
uenc
y
Cases weighted by Number of Sections Summarized
School: School of Business
Weight of Out-of-Class Assignments as a Percent of Final Grade (grouped)

SFP – School of Business
Page 38 of 41
Activities and Scheduling Scheduled Laboratory, Studio or Practicum
Frequency Percent Valid Percent Cumulative
Percent No 41 73.2 87.2 87.2Yes 6 10.7 12.8 100.0
Valid
Total 47 83.9 100.0 Missing System 9 16.1 Total 56 100.0
YesNo
Scheduled Laboratory, Studio or Practicum
50
40
30
20
10
0
Freq
uenc
y
Cases weighted by Number of Sections Summarized
School: School of Business
Scheduled Laboratory, Studio or Practicum

SFP – School of Business
Page 39 of 41
Students Required to Meet out of Class
Frequency Percent Valid Percent Cumulative
Percent Yes, in groups 35 62.5 62.5 62.5No 21 37.5 37.5 100.0
Valid
Total 56 100.0 100.0
NoYes, in groups
Students Required to Meet out of Class
40
30
20
10
0
Freq
uenc
y
Cases weighted by Number of Sections Summarized
School: School of Business
Students Required to Meet out of Class

SFP – School of Business
Page 40 of 41
Use of "Fourth Hour"
Frequency Percent Valid Percent Cumulative
Percent Yes, I have scheduled a formal time using the College's grid
23 41.1 41.8 41.8
No, because I allow my students to find a suitable period
21 37.5 38.2 80.0
No, I don't use structured out-of-class meeting times
11 19.6 20.0 100.0
Valid
Total 55 98.2 100.0 Missing System 1 1.8 Total 56 100.0
No, I don't use structured out-of-class meeting times
No, because I allow my studentsto find a suitable period
Yes, I have scheduled a formaltime using the College's grid
Use of "Fourth Hour"
25
20
15
10
5
0
Freq
uenc
y
Cases weighted by Number of Sections Summarized
School: School of Business
Use of "Fourth Hour"
SFP – School of Business
Page 41 of 41
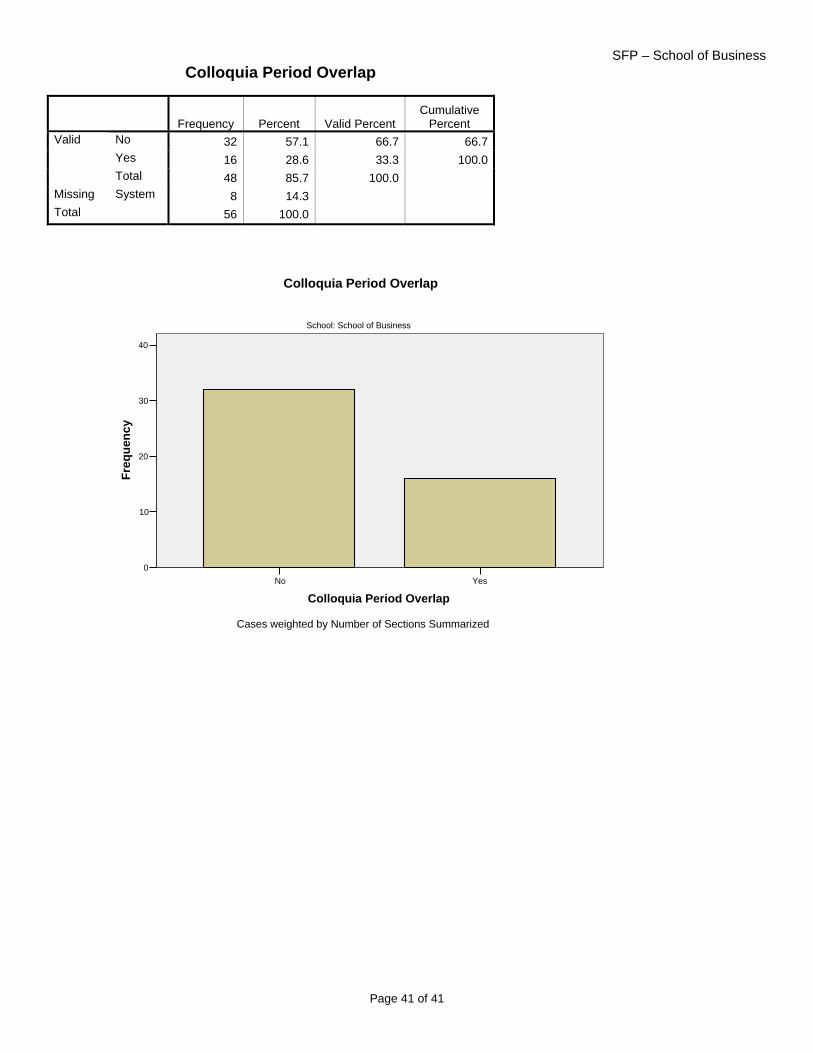
Colloquia Period Overlap
Frequency Percent Valid Percent Cumulative
Percent No 32 57.1 66.7 66.7Yes 16 28.6 33.3 100.0
Valid
Total 48 85.7 100.0 Missing System 8 14.3 Total 56 100.0
YesNo
Colloquia Period Overlap
40
30
20
10
0
Freq
uenc
y
Cases weighted by Number of Sections Summarized
School: School of Business
Colloquia Period Overlap