Embed Size (px)
Citation preview
ANALYSIS AND VISUALIZATION OF SPACE-TIME VARIANT PARAMETERS INENDURANCE SPORT TRAINING
Dietmar Saupe, Dietmar Lüchtenberg, Martin Röder, Christian Federolf
Universität Konstanz, Konstanz, Germany
Abstract
We develop methods for data acquisition, analysis, and visualization of performance parameters in endurance sportswith emphasis on competitive cycling. The goal of our work is to provide methods to improve the performance ofathletes in training and in competition. Measurements from a palette of devices, including common bike computers,GPS-recorders, power meters, and spiroergometric devices are combined requiring data fusion and synchronization.In addition, we consider integration of maps with elevation information and areal photographs together with recordedvideo footage of training courses. We also apply biofeedback methods that require complex data processing.Appropriate ways to jointly present such diverse data need to be developed for their analysis and visualization. Aparticular challenge is the information visualization of complex multi-dimensional signals of traveling sensors. Forthe simultaneous visualization of large information quantities we use the �Powerwall� at the University of Konstanz,i.e., a large high resolution display (dimensions 5.20 m x 2.15 m, pixel resolution 4640 x 1920) which offers thedisplay of high resolution terrain data and maps together with static and dynamic parameter sequences frommeasured training rides or a running biofeedback simulation. The following topics are addressed among others: (1)adaptation of training course profile for laboratory biofeedback simulation, (2) learning of tactic approaches for agiven training course profile, (3) evaluation of efficiency of different feedback parameters. The paper surveys someof the initial approaches, in cooperation with the Heart Institute Lahr/Baden, Germany.
Keywords: performance parameters, endurance sports, visualization, data processing, data fusion, biofeedbacktraining
Introduction
In professional training for competitive cycling measurements are taken that capture physical parameters of theathlete and mechanical parameters of the bike in the field or of an ergometer in a laboratory environment. Such dataseries are usually transferred to a computer for display and analysis by special purpose software. Such systems focuson monitoring and analysing those performance parameters that are characteristic for the specific motions in biking.The goal is an improvement of cycling performance in training and eventually in competition. There is a rapidlygrowing palette of commercial measuring devices, ranging from common "bike computers" capturing speed,cadence, heart rate, temperature, and barometric pressure to more complex ones for GPS localization. Moreover,there are (expensive) power meters and spiroergometric devices that measure ventilation and gas exchange. Forscientific research it is desirable to combine several such devices, thus, creating the need for methods for data fusionand synchronization. Commercial metering devices come with specific software that does not readily support thedesired joint representation and analysis. In our work we strive to combine all types of data with high-resolutionmaps of training regions and corresponding video recordings synchronized by software to individual training rides.The amount of data collected can get very large requiring methods for appropriate analysis and visualization. For thesimultaneous visualization of large information quantities we apply the Powerwall at the University of Konstanz, i.e.,a large high resolution display (dimensions 5.20 m x 2.15 m, pixel resolution 4640 x 1920) which offers static ordynamic display of high resolution terrain data and maps together with parameter sequences from measured trainingrides. From the computer science side the challenge is
• to custom tailor tools for the acquisition, synchronization, fusion, and management of large numbers of timeseries, and
• to devise solution strategies for the combination of terrain data, video, simultaneous time sequences of manyparameters on the Powerwall and on regular size computer screens
• to organize the visualization of past training sessions and online biofeedback training sessions suitable for thedomain experts, i.e., for training science, resp. the athlete.
The research project is ongoing and we describe in this paper our approach and some implementation details.
Previous Work
Large display devices(Ni et al, 2006) provide a detailed survey of current large display technologies. The authors consider hardware setups(caves, multi-monitor desktop systems, tiled LCD panels, projector arrays (like our powerwall), stereoscopic andvolumetric displays), rendering techniques, network setups, streaming techniques, software toolkits. A number ofsoftware toolkits for display streaming and distributed rendering is briefly introduced. The paper then considersapplications for large displays, including vehicle design, geospatial imagery and video, scientific visualization,collaboration and tele-immersion, education and training. The paper closes with considerations on user interfacedesign and interaction techniques and gives a top ten hitlist of research challenges with large displays.
Time series visualization and synchronization(Müller & Schumann, 2003) gives a broad overview of existing visualization techniques for time-dependent data.(Aris et al, 2005) discusses the challenges of visualizing unevenly spaced time series and proposes fourrepresentation methods. The methods are evaluated with respect to their advantages and disadvantages for differentapplications. (Marwan, Thiel, & Nowaczyk, 2002) presents a method for synchronizing two time series. The methodexploits a recurrence plot, from which it isolates a so called line of synchronization (LOS). The LOS yields a non-parametric rescaling function with which one can synchronize the time series. (Liu, 2004) presents a method tomeasure the degree of synchronization of two time series.
Studies on data acquisition in biking and applications(Balmaer et al, 2000) assessed the validity of power output recorded using an air-braked cycle ergometer(Kingcycle�) when compared with a power measuring crankset (SRM�). (Belli & Hintsy, 2002) evaluates a studywith 22 male subjects on the question of optimal pedalling rate selection for cycling in field conditions. (Stapelfeldt& Mornieux, 2007) study and evaluate biofeedback methods for training of the continuous power exertion on thepedals over the entire turn of the crank. Satellite GPS navigation has already been successfully used in sportstraining, e.g., for rowing and skiing (Blumenbach & Henke, 2005).
Methods
Visualization on the University Konstanz PowerwallKonstanz Powerwall is a large back projection screen lit by eight self-aligned beamers each of which controlled byone computer over which a master machine resides, see (Keim et al, 2006). The machines are connected by GigabitEthernet. In order to display interactive visualizations, in contrast to static images, we employ a distributed renderingsystem that uses the processing power of all machines. A review of common software toolkits for distributedrendering on PC clusters is given in (Raffin & Soares, 2006). Because of its flexibility, we chose the Chromiumstream processing framework (Humphreys et al, 2002), a framework for processing streams of OpenGL commands.Chromium can be considered as a kind of OpenGL proxy in our environment. To a software application that runs onthe master machine, Chromium presents just one large OpenGL display. To the individual machines that drive thebeamers, Chromium acts as a normal software application, displaying their respective part of the screen. However,while Chromium gives us the benefit of flexible distributed rendering with OpenGL, it also presents some challengesto the development of our visualization software. Many OpenGL applications use OpenGL only for displaying 3Dmodels or scenes, but not for the user interface. The user interface is usually shown in a windowing environment,such as Microsoft Windows or the X-Window-System, because OpenGL has only very limited support for userinterface design. As Chromium can only process and distribute OpenGL commands, we need to do everything inOpenGL, including the user interface. Another challenge is the limited network bandwidth between the machines thatdrive the Powerwall. A bandwidth of one gigabit per second may seem a lot, but given the display dimensions of4640 x 1920 pixels, it would only allow to transfer 4.6 frames per second, assuming 24 bits per pixel. Fortunately,Chromium does not transfer raw pixel data, but encoded OpenGL commands to be executed by the machines drivingthe beamers. As an OpenGL command can affect many pixels, the OpenGL description of an image to be rendered isusually much smaller than the raw pixel data. Nevertheless we must design our application carefully in order tominimize the amount of data to be transmitted for a frame. A third challenge is presented by Chromium itself. In itscurrent version, it is not capable of multicasting. That means that OpenGL commands that must be sent to more thanone machine, such as texture definitions for polygons that span multiple tiles of the display, must be sent multipletimes, wasting network bandwidth. Multicasting would allow several machines to receive such data simultaneously,improving network efficiency.
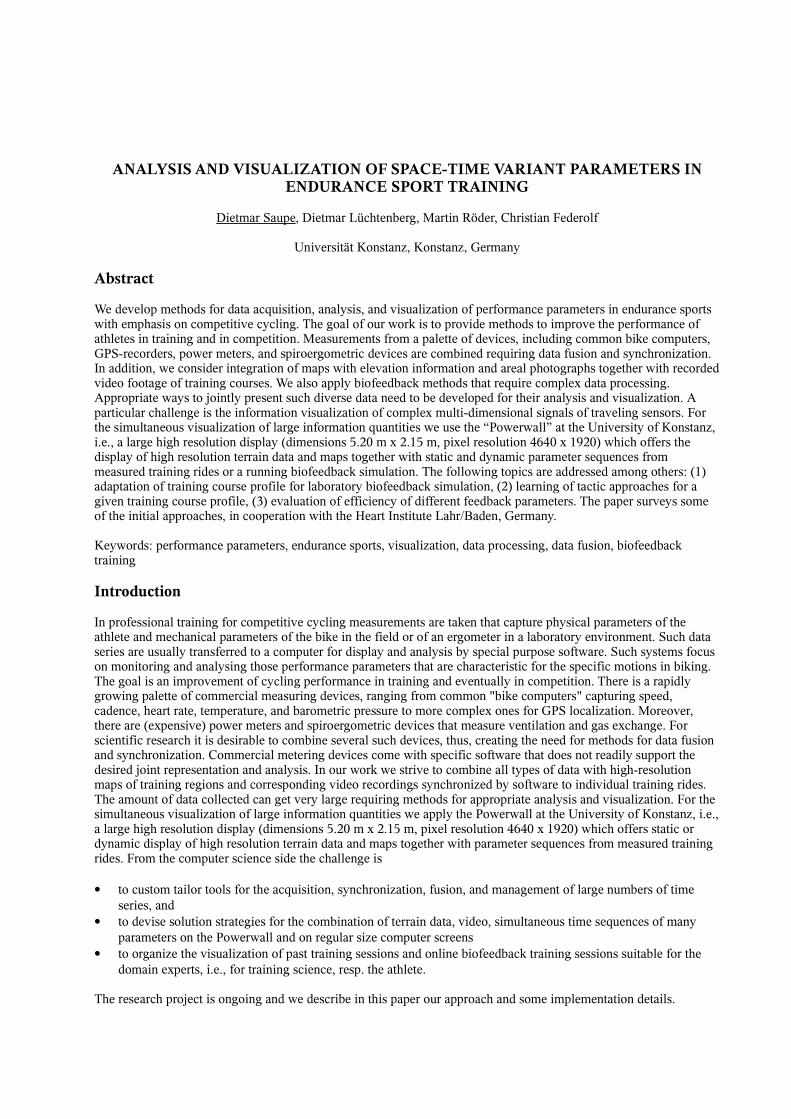
The following screenshot on the right shows a first example of simultaneous display of a video sequence togetherwith 2.5D terrain data and a couple of time series.
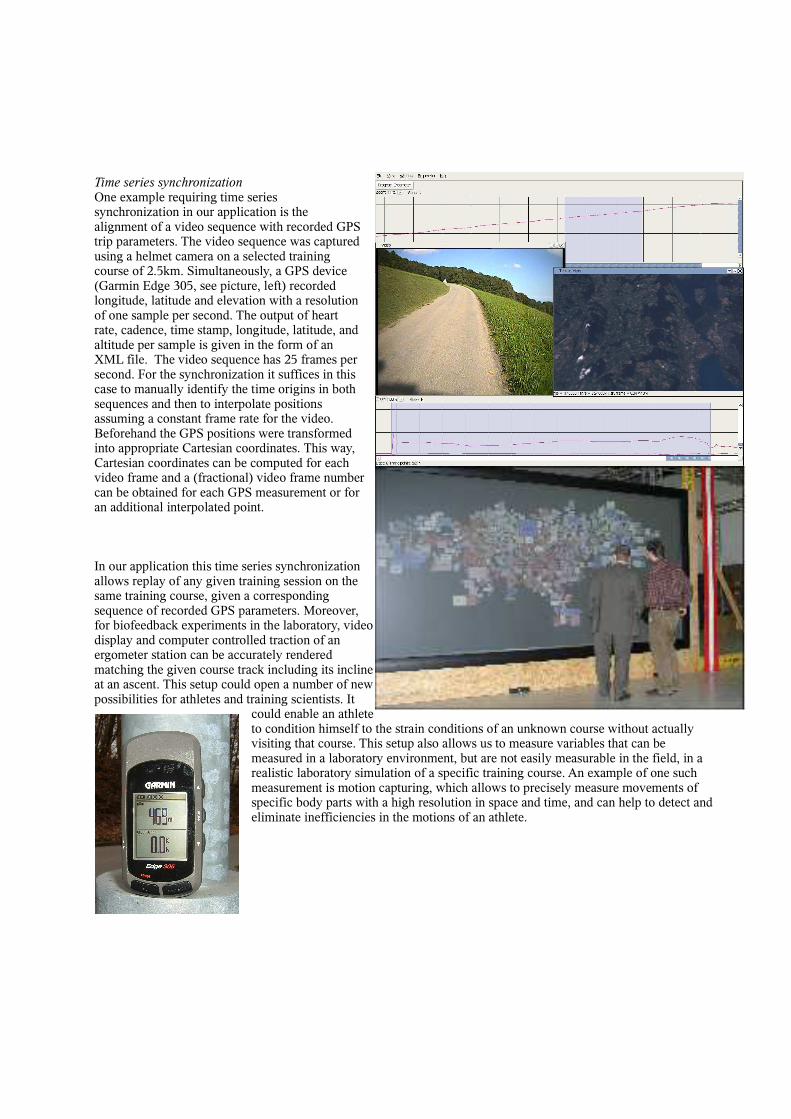
Time series synchronizationOne example requiring time seriessynchronization in our application is thealignment of a video sequence with recorded GPStrip parameters. The video sequence was capturedusing a helmet camera on a selected trainingcourse of 2.5km. Simultaneously, a GPS device(Garmin Edge 305, see picture, left) recordedlongitude, latitude and elevation with a resolutionof one sample per second. The output of heartrate, cadence, time stamp, longitude, latitude, andaltitude per sample is given in the form of anXML file. The video sequence has 25 frames persecond. For the synchronization it suffices in thiscase to manually identify the time origins in bothsequences and then to interpolate positionsassuming a constant frame rate for the video.Beforehand the GPS positions were transformedinto appropriate Cartesian coordinates. This way,Cartesian coordinates can be computed for eachvideo frame and a (fractional) video frame numbercan be obtained for each GPS measurement or foran additional interpolated point.
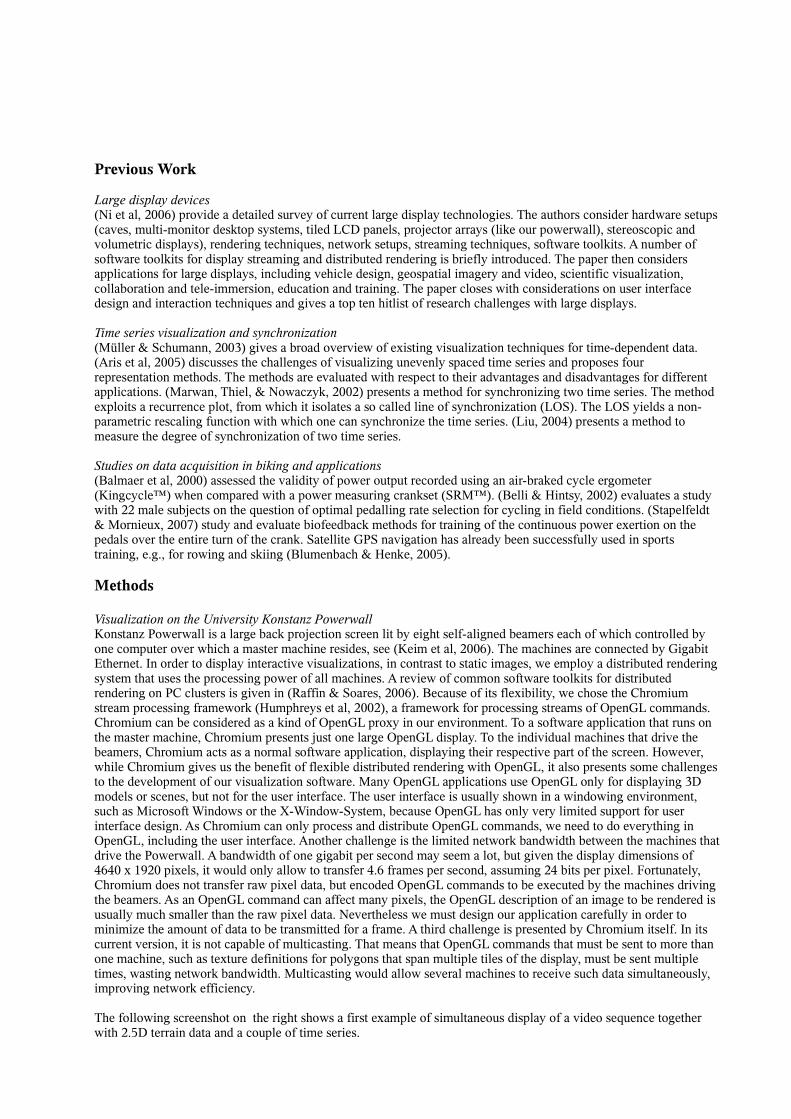
In our application this time series synchronizationallows replay of any given training session on thesame training course, given a correspondingsequence of recorded GPS parameters. Moreover,for biofeedback experiments in the laboratory, videodisplay and computer controlled traction of anergometer station can be accurately renderedmatching the given course track including its inclineat an ascent. This setup could open a number of newpossibilities for athletes and training scientists. It
could enable an athleteto condition himself to the strain conditions of an unknown course without actuallyvisiting that course. This setup also allows us to measure variables that can bemeasured in a laboratory environment, but are not easily measurable in the field, in arealistic laboratory simulation of a specific training course. An example of one suchmeasurement is motion capturing, which allows to precisely measure movements ofspecific body parts with a high resolution in space and time, and can help to detect andeliminate inefficiencies in the motions of an athlete.
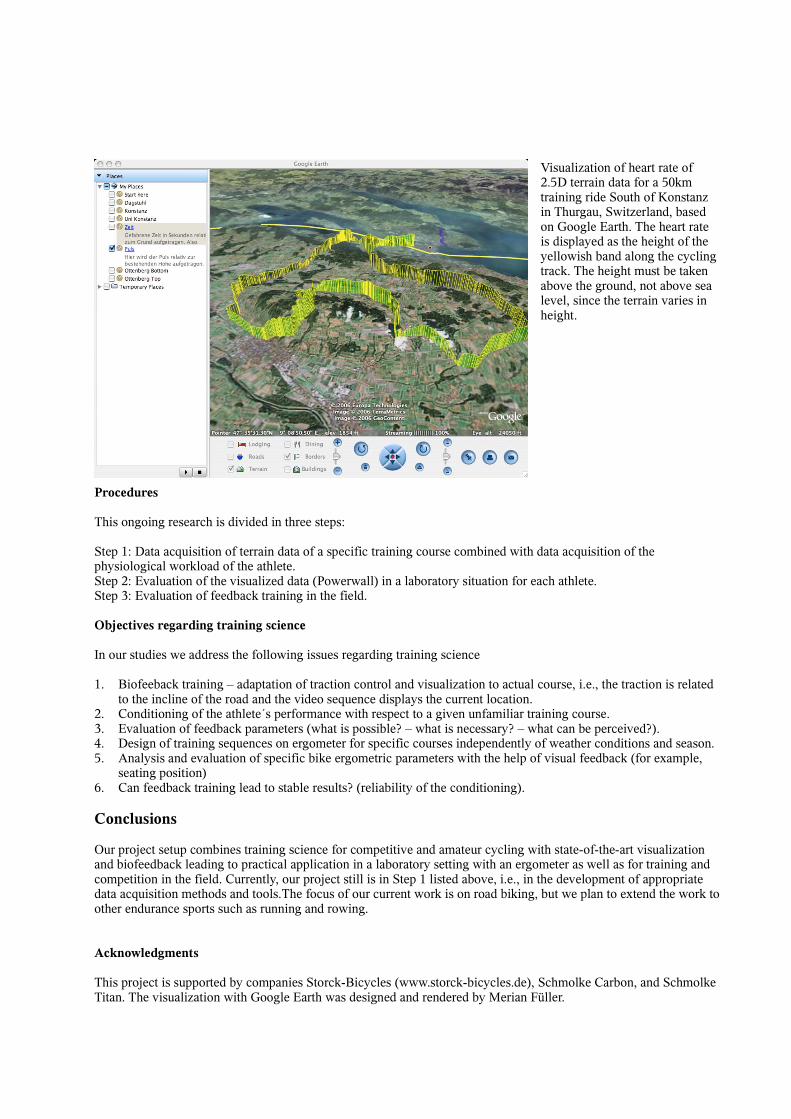
Visualization of heart rate of2.5D terrain data for a 50kmtraining ride South of Konstanzin Thurgau, Switzerland, basedon Google Earth. The heart rateis displayed as the height of theyellowish band along the cyclingtrack. The height must be takenabove the ground, not above sealevel, since the terrain varies inheight.
Procedures
This ongoing research is divided in three steps:
Step 1: Data acquisition of terrain data of a specific training course combined with data acquisition of thephysiological workload of the athlete.Step 2: Evaluation of the visualized data (Powerwall) in a laboratory situation for each athlete.Step 3: Evaluation of feedback training in the field.
Objectives regarding training science
In our studies we address the following issues regarding training science
1. Biofeeback training � adaptation of traction control and visualization to actual course, i.e., the traction is relatedto the incline of the road and the video sequence displays the current location.
2. Conditioning of the athlete´s performance with respect to a given unfamiliar training course.3. Evaluation of feedback parameters (what is possible? � what is necessary? � what can be perceived?).4. Design of training sequences on ergometer for specific courses independently of weather conditions and season.5. Analysis and evaluation of specific bike ergometric parameters with the help of visual feedback (for example,
seating position)6. Can feedback training lead to stable results? (reliability of the conditioning).
Conclusions
Our project setup combines training science for competitive and amateur cycling with state-of-the-art visualizationand biofeedback leading to practical application in a laboratory setting with an ergometer as well as for training andcompetition in the field. Currently, our project still is in Step 1 listed above, i.e., in the development of appropriatedata acquisition methods and tools.The focus of our current work is on road biking, but we plan to extend the work toother endurance sports such as running and rowing.
Acknowledgments
This project is supported by companies Storck-Bicycles (www.storck-bicycles.de), Schmolke Carbon, and SchmolkeTitan. The visualization with Google Earth was designed and rendered by Merian Füller.

References
Aris, A., & Shneiderman, B., & Plaisant, C, et al. (2005). Representing Unevenly-Spaced Time Series Data forVisualization and Interactive Exploration. In: Proc. of INTERACT 2005, pp. 835-846, Springer, February 2005.
Balmaer, J., & Davison, C.R., & Coleman, D.A., & Bird, S.R. (2000). The validity of power output recorded duringexercise performance tests using a Kingcycle air-braked cycle ergometer when compared with an SRMPowermeter. Int. J. Sports Med. 21.
Belli, A., & Hintzy, F. (2002). Influence of pedalling rate on the energy cost of cycling in humans. European Journalof Applied Physiology, vol. 88, no. 1-2, pp. 158-162.
Blumenbach, Th., & Henke, Th. (2005) Satellitennavigation - Anwendungen in der Sportwissenschaft.Wissenschaftliche Berichte und Materialien des Bundesinstituts für Sportwissenschaft. Band 12, Verlag SPORT& BUCH Strauß, Köln.
Humphreys, G., & Houston, M., & Ng, Y., et al. (2002). Chromium: A stream processing framework for interactiverendering on clusters, ACM Transactions on Graphics, vol. 21, no. 3, pp. 693-702.
Keim, D., et al (2006). The University of Konstanz Powerwall. URL: http://infovis.uni-konstanz.de/index.php?region=powerwall, retrieved on March 5, 2007.
Liu, Z. (2004). Measuring the degree of synchronization from time series data. Europhysics Letters, vol. 68, no. 1,pp. 19-25.
Marwan, N., & Thiel, M., & Nowaczyk, N.R. (2002). Cross recurrence plot based synchronization of time series.Nonlinear Processes in Geophysics, vol. 9, pp. 325-331.
Müller, W., & Schumann, H. (2003). Visualization methods for time-dependent data - an overview. In: Proceedingsof the 2003 Winter Simulation Conference, New Orleans.
Ni, T., & Schmidt, G.S., & Staadt, O.G., et al. (2006). A survey of large high-resolution display technologies,techniques, and applications". In: Proc. IEEE Virtual Reality 2006, pp. 223-234, Alexandria, VA.
Raffin, B., & Soares. L. (2006). PC clusters for virtual reality. In: Proc. IEEE Virtual Reality 2006, Alexandria, VA.
Stapelfeldt, B.; & Mornieux, G. (2003). Feedbacktraining im Radsport. Presentation, retrieved at URLhttp://www.radlabor.de/Downloads/Feedbacktraining%20im%20Radsport.pdf on March 6, 2007