Embed Size (px)
Citation preview
International Research Journal of Engineering and Technology (IRJET) e-ISSN: 2395-0056
Volume: 08 Issue: 07 | July 2021 www.irjet.net p-ISSN: 2395-0072
© 2021, IRJET | Impact Factor value: 7.529 | ISO 9001:2008 Certified Journal | Page 1114
ANALYSIS AND SPATIAL DISTRIBUTION OF DIFFERENT WATER
QUALITY PARAMETER IN THE BUFFER ZONE OF KALI RIVER USING
FIELD METHODOLOGY AND GIS
Somendra Singh1, Ram Chandra2, Sudhakar Shukla3
¹M. Tech Student, Remote Sensing Applications Centre Uttar Pradesh, India
²Head &Scientist-E, Geospatial Data Division, Remote Sensing Applications Centre Uttar Pradesh, India
³Head &Scientist-E, School of Geoinformatics, Remote Sensing Applications Centre Uttar Pradesh, India ---------------------------------------------------------------------***---------------------------------------------------------------------
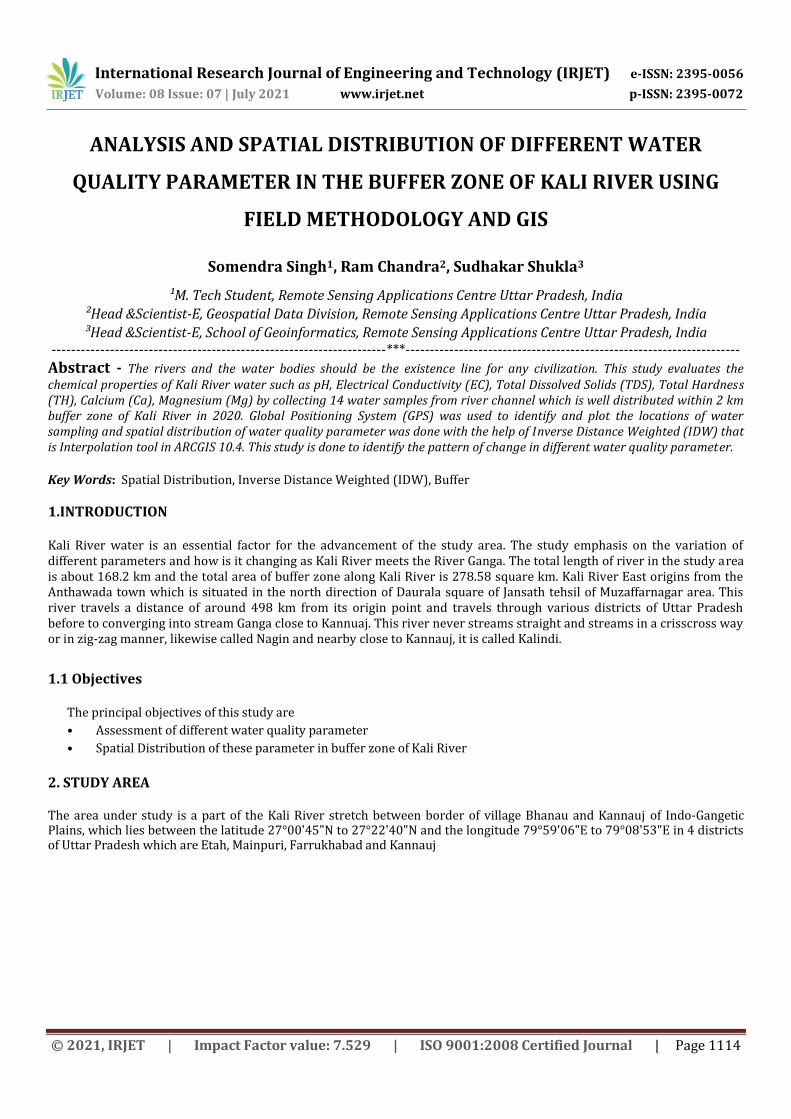
Abstract - The rivers and the water bodies should be the existence line for any civilization. This study evaluates the chemical properties of Kali River water such as pH, Electrical Conductivity (EC), Total Dissolved Solids (TDS), Total Hardness (TH), Calcium (Ca), Magnesium (Mg) by collecting 14 water samples from river channel which is well distributed within 2 km buffer zone of Kali River in 2020. Global Positioning System (GPS) was used to identify and plot the locations of water sampling and spatial distribution of water quality parameter was done with the help of Inverse Distance Weighted (IDW) that is Interpolation tool in ARCGIS 10.4. This study is done to identify the pattern of change in different water quality parameter.
Key Words: Spatial Distribution, Inverse Distance Weighted (IDW), Buffer
1.INTRODUCTION Kali River water is an essential factor for the advancement of the study area. The study emphasis on the variation of different parameters and how is it changing as Kali River meets the River Ganga. The total length of river in the study area is about 168.2 km and the total area of buffer zone along Kali River is 278.58 square km. Kali River East origins from the Anthawada town which is situated in the north direction of Daurala square of Jansath tehsil of Muzaffarnagar area. This river travels a distance of around 498 km from its origin point and travels through various districts of Uttar Pradesh before to converging into stream Ganga close to Kannuaj. This river never streams straight and streams in a crisscross way or in zig-zag manner, likewise called Nagin and nearby close to Kannauj, it is called Kalindi.
1.1 Objectives
The principal objectives of this study are
• Assessment of different water quality parameter
• Spatial Distribution of these parameter in buffer zone of Kali River
2. STUDY AREA The area under study is a part of the Kali River stretch between border of village Bhanau and Kannauj of Indo-Gangetic Plains, which lies between the latitude 27°00'45"N to 27°22'40"N and the longitude 79°59'06"E to 79°08'53"E in 4 districts of Uttar Pradesh which are Etah, Mainpuri, Farrukhabad and Kannauj
International Research Journal of Engineering and Technology (IRJET) e-ISSN: 2395-0056
Volume: 08 Issue: 05 | May 2021 www.irjet.net p-ISSN: 2395-0072
© 2021, IRJET | Impact Factor value: 7.529 | ISO 9001:2008 Certified Journal | Page 1115
3. MATERIAL AND DATA USED
3.1 Data Used
Survey of India Topographical Sheets: 54M/2, 54M/3, 54M/6, 54M/7, 54M/8, 54M/11, 54M/12)
3.2 Instruments used for water quality assessment
Global Positioning System
Water quality field kit
Digital pH-meter
Digital conductivity meter
Titrimetric method (with EDTA)
4. METHODOLOGY
For the analysis of water quality parameters total 14 sample were collected in the buffer zone of Kali River. All these
samples were analysed in the water testing laboratory. GPS (Global Positioning System) used for the identification of
the coordinate of the locations at which water sample has been collected. ArcGIS 10.4 is used for the spatial
IDENTIFICATION OF CHANGING PATTERN OF WATER QUALITY
PARAMETER
FIELD SURVEY AND COLLECTION OF RIVER WATER SAMPLE
ANALYSIS OF COLLECTED WATER SAMPLE
GEREARTION OF WATER QUALITY DATA
SPATIAL DISTRIBUTION OF WATER QUALITY PARAMETER
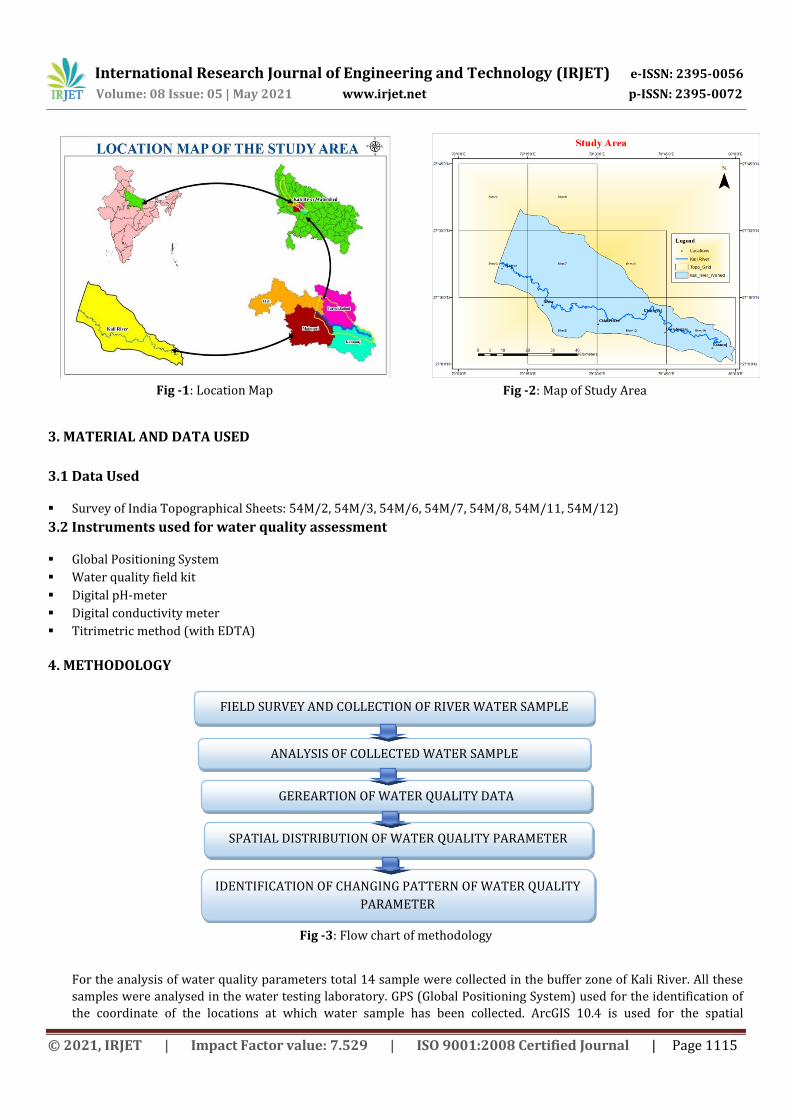
Fig -1: Location Map
Fig -2: Map of Study Area
Fig -3: Flow chart of methodology
International Research Journal of Engineering and Technology (IRJET) e-ISSN: 2395-0056
Volume: 08 Issue: 05 | May 2021 www.irjet.net p-ISSN: 2395-0072
© 2021, IRJET | Impact Factor value: 7.529 | ISO 9001:2008 Certified Journal | Page 1116
distribution of various parameter of water quality with the help of IDW (Inverse Distance Weighted) tool. Drainage
map is generated with the help of Survey of India topographical sheets. Which helps in identifying the cause of change
in distribution of various parameters.
5. RESULT AND DISSCUSSION
Sample No.
Ph EC (uS/cm)
HCO3 (mg/l)
CI (mg/l) Ca (mg/l)
T.H. (mg/l)
Mg (mg/l)
TDS (mg/l)
1 8.00 671 350.82 104.22 89.51 409.42 45.25 402.6
2 7.71 687 259.30 104.22 82.05 409.42 49.77 412.2
3 7.75 680 274.56 97.84 89.51 362.90 33.94 408
4 7.82 885 396.58 127.61 89.51 437.34 52.03 531
5 7.87 828 396.58 114.85 93.24 446.64 52.03 496.8
6 7.90 822 320.32 157.39 93.24 428.03 47.51 493.2
7 7.97 820 350.82 136.12 89.51 428.03 49.77 492
8 7.92 818 305.06 144.63 89.51 465.25 58.82 490.8
9 7.93 793 335.57 116.98 85.78 325.68 27.15 475.8
10 8.26 287 167.79 42.54 48.48 167.49 11.31 172.2
11 7.99 292 167.79 14.89 52.21 223.32 22.62 175.2
12 8.11 293 152.53 25.52 48.48 223.32 24.89 175.8
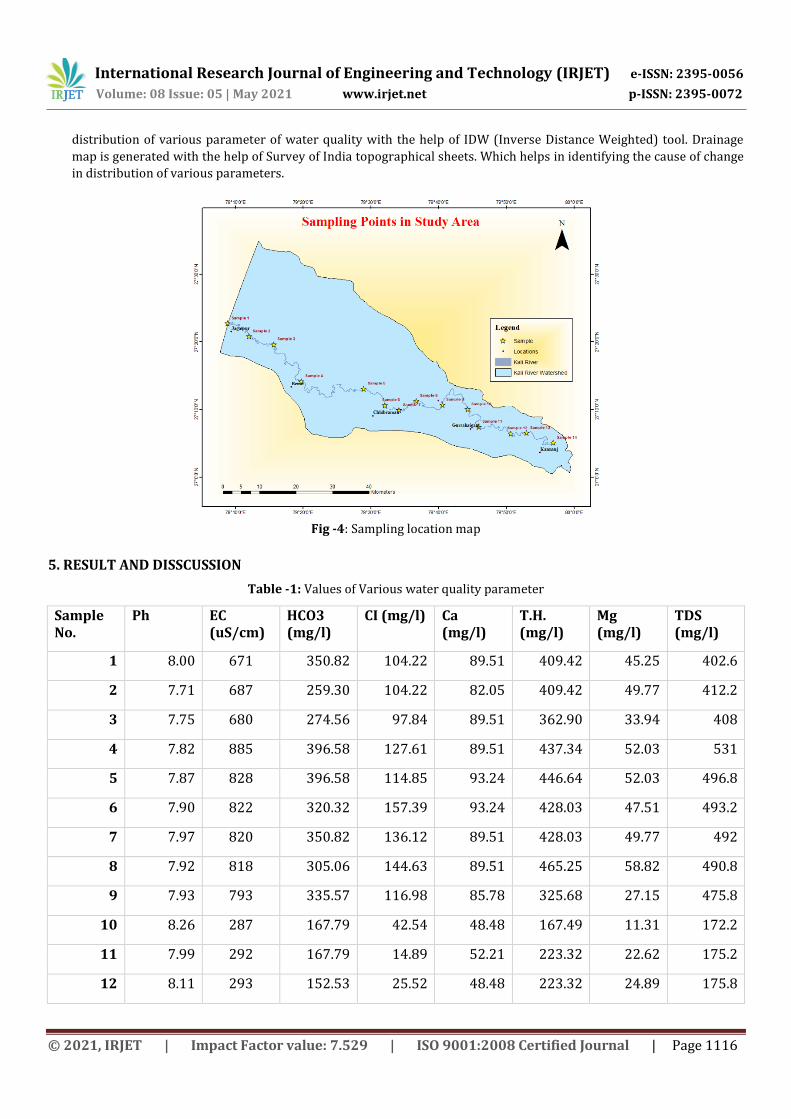
Table -1: Values of Various water quality parameter
Fig -4: Sampling location map
International Research Journal of Engineering and Technology (IRJET) e-ISSN: 2395-0056
Volume: 08 Issue: 05 | May 2021 www.irjet.net p-ISSN: 2395-0072
© 2021, IRJET | Impact Factor value: 7.529 | ISO 9001:2008 Certified Journal | Page 1117
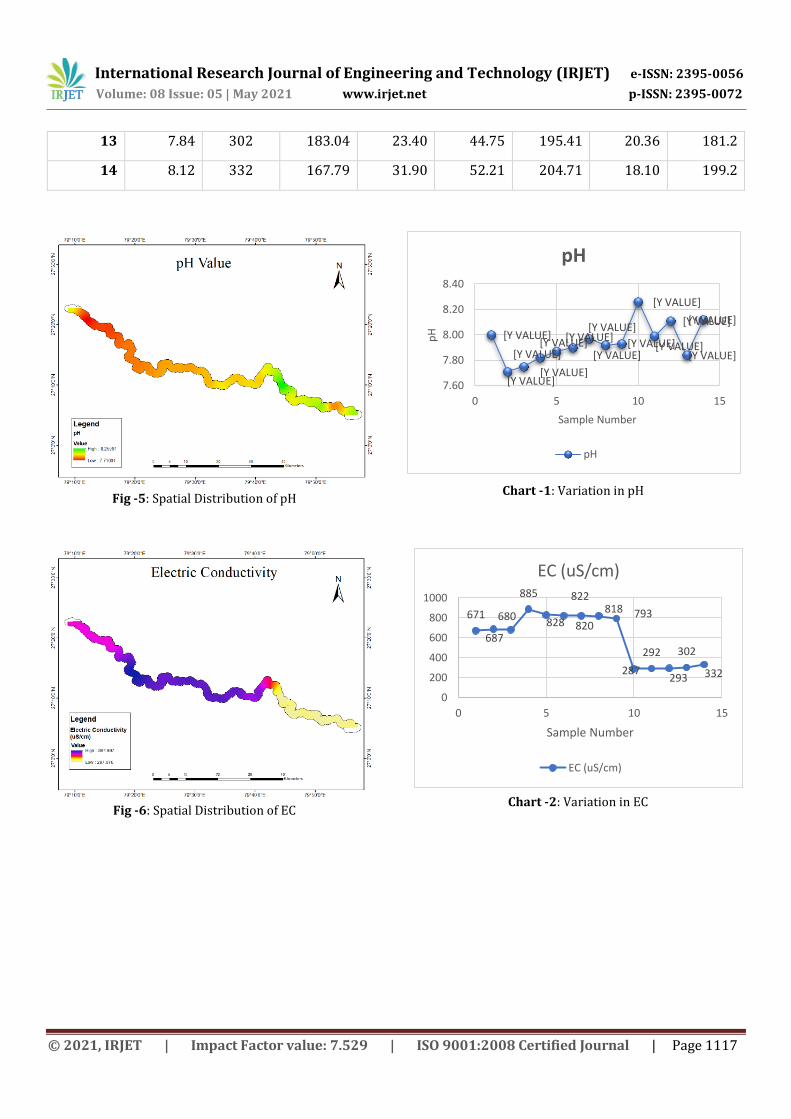
13 7.84 302 183.04 23.40 44.75 195.41 20.36 181.2
14 8.12 332 167.79 31.90 52.21 204.71 18.10 199.2
[Y VALUE]
[Y VALUE]
[Y VALUE]
[Y VALUE]
[Y VALUE] [Y VALUE] [Y VALUE]
[Y VALUE] [Y VALUE]
[Y VALUE]
[Y VALUE]
[Y VALUE]
[Y VALUE]
[Y VALUE]
7.60
7.80
8.00
8.20
8.40
0 5 10 15
pH
Sample Number
pH
pH
671
687
680
885
828
822
820
818 793
287
292
293
302
332
0
200
400
600
800
1000
0 5 10 15
Sample Number
EC (uS/cm)
EC (uS/cm)
Fig -5: Spatial Distribution of pH
Fig -6: Spatial Distribution of EC
Chart -1: Variation in pH
Chart -2: Variation in EC
International Research Journal of Engineering and Technology (IRJET) e-ISSN: 2395-0056
Volume: 08 Issue: 05 | May 2021 www.irjet.net p-ISSN: 2395-0072
© 2021, IRJET | Impact Factor value: 7.529 | ISO 9001:2008 Certified Journal | Page 1118
350.82
259.30
274.56
396.58
396.58
320.32
350.82
305.06
335.57
167.79
167.79
152.53
183.04
167.79
0.00
50.00
100.00
150.00
200.00
250.00
300.00
350.00
400.00
450.00
1 2 3 4 5 6 7 8 9 1 0 1 1 1 2 1 3 1 4
SAMPLE NUMER
HCO3 (MG/L)
104.22
104.22
97.84
127.61
114.85
157.39
136.12
144.63
116.98
42.54 14.89
25.52
23.40
31.90 0.00
50.00
100.00
150.00
200.00
1 2 3 4 5 6 7 8 9 1 0 1 1 1 2 1 3 1 4
SAMPLE NUMBER
CHLORIDE (MG/L)
89.51
82.05
89.51
89.51
93.24
93.24
89.51
89.51
85.78
48.48
52.21
48.48
44.75
52.21
0.00
10.00
20.00
30.00
40.00
50.00
60.00
70.00
80.00
90.00
100.00
1 2 3 4 5 6 7 8 9 1 0 1 1 1 2 1 3 1 4
SAMPLR NUMBER
CA (MG/L)
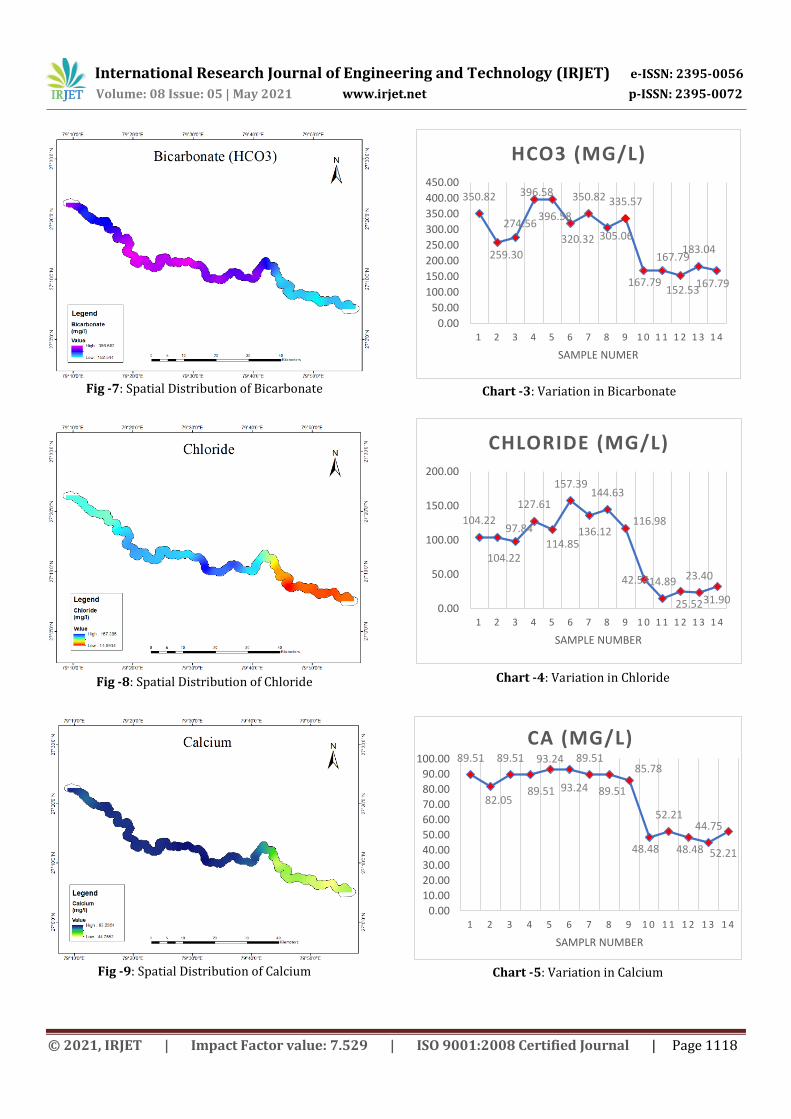
Fig -7: Spatial Distribution of Bicarbonate
Fig -8: Spatial Distribution of Chloride
Chart -3: Variation in Bicarbonate
Chart -4: Variation in Chloride
Fig -9: Spatial Distribution of Calcium
Chart -5: Variation in Calcium
International Research Journal of Engineering and Technology (IRJET) e-ISSN: 2395-0056
Volume: 08 Issue: 05 | May 2021 www.irjet.net p-ISSN: 2395-0072
© 2021, IRJET | Impact Factor value: 7.529 | ISO 9001:2008 Certified Journal | Page 1119
45.25 49.77
33.94
52.03 52.03
47.51
49.77 58.82
27.15
11.31
22.62
24.89
20.36
18.10
0.00
10.00
20.00
30.00
40.00
50.00
60.00
70.00
1 2 3 4 5 6 7 8 9 1 0 1 1 1 2 1 3 1 4
SAMPLE NUMBER
MG (MG/L)
409.42 409.42
362.90
437.34
446.64
428.03
428.03 465.25
325.68
167.49
223.32
223.32
195.41
204.71
0.00
100.00
200.00
300.00
400.00
500.00
1 2 3 4 5 6 7 8 9 1 0 1 1 1 2 1 3 1 4
SAMPLE NUMBER
T.H. (MG/L)
402.6
412.2
408
531
496.8
493.2
492
490.8 475.8
172.2
175.2
175.8
181.2
199.2
0
100
200
300
400
500
600
1 2 3 4 5 6 7 8 9 1 0 1 1 1 2 1 3 1 4
SAMPLE NUMBER
TDS (MG/L)
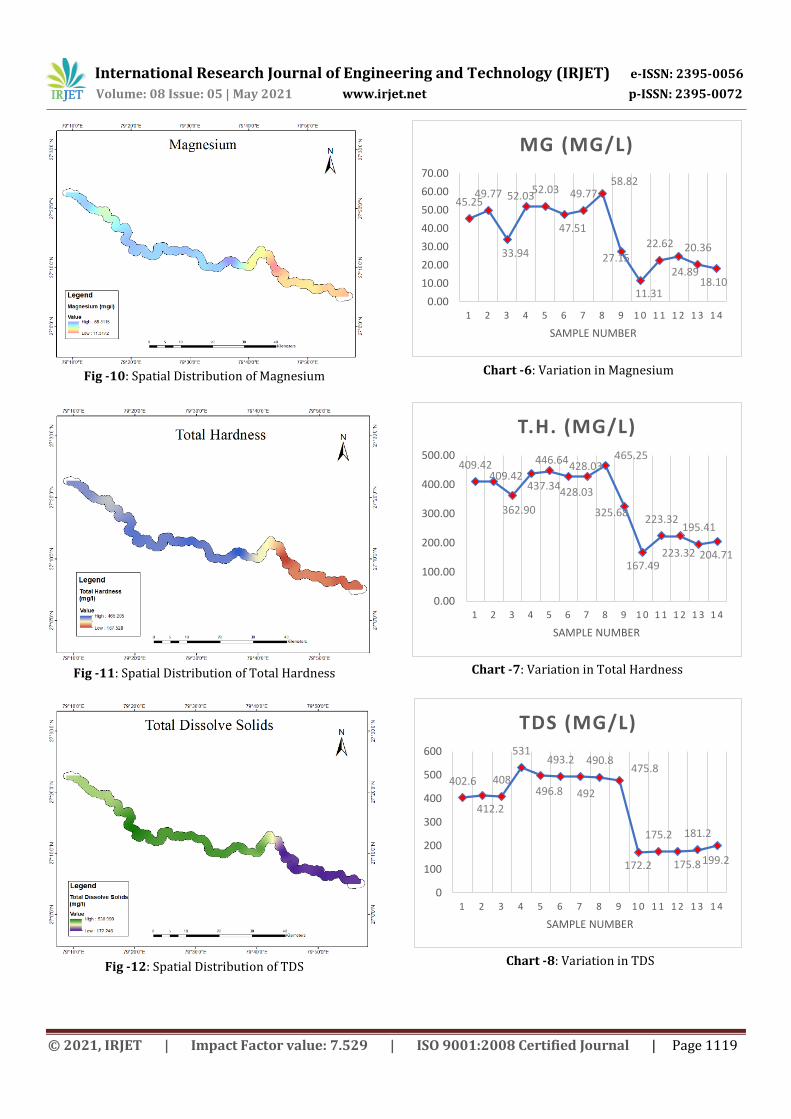
Fig -10: Spatial Distribution of Magnesium
Fig -11: Spatial Distribution of Total Hardness
Fig -12: Spatial Distribution of TDS
Chart -6: Variation in Magnesium
Chart -7: Variation in Total Hardness
Chart -8: Variation in TDS
International Research Journal of Engineering and Technology (IRJET) e-ISSN: 2395-0056
Volume: 08 Issue: 05 | May 2021 www.irjet.net p-ISSN: 2395-0072
© 2021, IRJET | Impact Factor value: 7.529 | ISO 9001:2008 Certified Journal | Page 1120
6. CONCLUSION As indicated by BIS (Bureau of Indian Standard) pH of surface water body ought to be least 6.5 and maximum 8.5 which
are under the admissible limit that is 6.5-8.5. At first electric conductivity at Border of village Ramnagar and Bhanau is 671
uS/cm, most elevated is 885 uS/cm at Village Gazianpur and finally EC of the river water is 332 uS/cm at the endpoint. In
the river at first, the value of bicarbonate was 350 mg/l at the boundary of Ramnagar and Bhanau village, most extreme is
396.5 mg/l and before merging is 167.7 mg/l. In the beginning calcium hardness is 89.05 mg/l, most elevated at village
Abhaypur is 93.24 mg/l and finally, at merging point is 52.21 mg/l. Chloride concentration in the river water is 104.22
mg/l, most elevated is close to town Harballabh which is 157.39 mg/l and prior to depleting into Ganga River chloride
concentration is 31.90 mg/l. Magnesium concentration is 45.25 mg/l at the beginning stage, most elevated is found close
to village Darora which is 58.82 mg/l and before intersection point magnesium concentration is 18.10 mg/l. At first Total
hardness is 409.42 mg/l, most extreme is at close to town Darora which is 465.25 mg/l and finally at the confluence point,
total hardness is 204.71 mg/l. The most elevated value of TDS is seen close to town Gazianpur which is 531 mg/l and
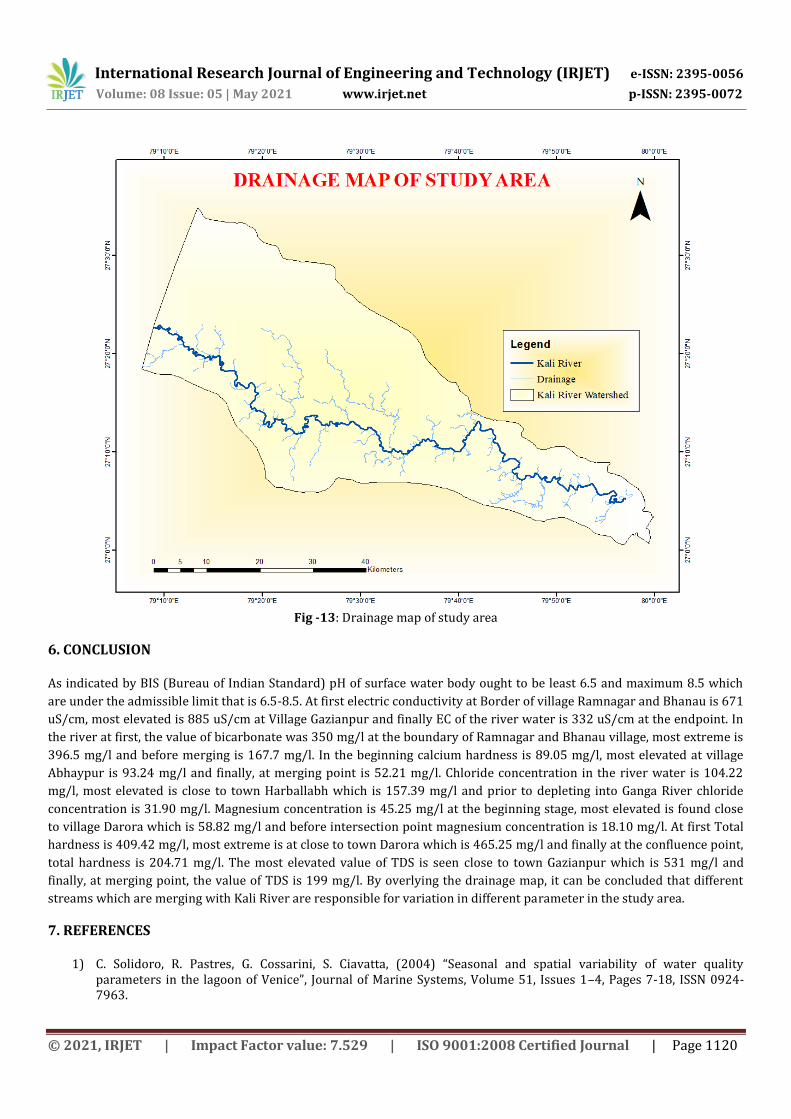
finally, at merging point, the value of TDS is 199 mg/l. By overlying the drainage map, it can be concluded that different
streams which are merging with Kali River are responsible for variation in different parameter in the study area.
7. REFERENCES
1) C. Solidoro, R. Pastres, G. Cossarini, S. Ciavatta, (2004) “Seasonal and spatial variability of water quality parameters in the lagoon of Venice”, Journal of Marine Systems, Volume 51, Issues 1–4, Pages 7-18, ISSN 0924-7963.
Fig -13: Drainage map of study area
International Research Journal of Engineering and Technology (IRJET) e-ISSN: 2395-0056
Volume: 08 Issue: 05 | May 2021 www.irjet.net p-ISSN: 2395-0072
© 2021, IRJET | Impact Factor value: 7.529 | ISO 9001:2008 Certified Journal | Page 1121
2) Gunarathna, M., Kumari, M., & Nirmanee, K. (March 2016). Evaluation of Interpolation Methods for Mapping pH OF Groundwater. IJLTEMAS, volume v, Issue III. 19.
3) Gupta M. and Srivastava, P.K., Integrating GIS and remote sensing for identification of groundwater potential zones in the hilly terrain of Pavagarh, Gujarat, India,Water Int., 35: 233–245,(2010).
4) Nas B, Berktay A (2010) Groundwater quality mapping in urban groundwater using GIS. Environ Monit Assess 160:215–227
5) Pooja Tomar, D.S. Malik and Pawan Kumar Bharti (2016), “Spatial and temporal variation in water quality of Kali River in Uttar Pradesh, India” International Research Journal of Environmental Science and Studies, Vol. 1, pp: (24-42)
6) Raikar Rajkumar V., Sneha M. K, (2012), “Water quality analysis of Bhadravathi taluk using GIS – a case study”, International Journal of Environmental Sciences, Vol 2, Issue 4, ISSN 0976-4402, pp: 2443-2453
7) Singh, G., Patel, N., Jindal, T. (2020). “Assessment of spatial and temporal variations in water quality by the application of multivariate statistical methods in the Kali River, Uttar Pradesh, India”. Environmental Monitoring and Assessment volume 192, Article number: 394.
8) Singh Priti, Khan I.A. (2011), “Ground water quality assessment of Dhankawadi ward of Pune by using GIS”, International Journal of Geomatics and Geosciences, Volume: 2, Issue: 2, ISSN: 0976-4380, pp: 688-703.
9) Suvarna Tikle, Mohammad Jawid Saboori, Rushikesh Sankpal (2012), “Spatial Distribution of Ground water Quality in Some Selected parts of Pune city, Maharashtra, India using GIS”, Current World Environment, Vol 7(2), pp: 281-286.
10) Tiwari, K., Goyal, R. & Sarkar, (2017), A GIS-Based Spatial Distribution of Groundwater Quality and Regional Suitability Evaluation for Drinking Water. Environ. Process. 4, pp: 645–662.
11) Tiwari AK, Singh PK, Mahato MK (2014) GIS-based evaluation of water quality index of groundwater resources in west Bokaro coalfield, India. Current World Environment 9(3):843–850