Embed Size (px)
Citation preview

CCWI 2017 – Computing and Control for the Water Industry Sheffield 5th - 7th September 2017
Analysis and Simulation of Drainage Capacity of Urban Pipe Network
Gomes, R.1,6, Vellando, P. 2,7, Sousa, J.3,6, Sá Marques, J.4,6, Muranho, J.5,6
1 Polytechnic Institute of Leiria, School of Technology and Management (Portugal)2 University of A Coruna, School of Civil Engineering, (Espanha)
3 Polytechnic Institute of Coimbra, Department of Civil Engineering (Portugal)4 University of Coimbra, Department of Civil Engineering, Coimbra (Portugal)
5 University of Beira Interior, Department of Computer Science, Covilhã (Portugal)6 MARE - Marine and Environmental Sciences Centre, Faculdade de Ciências e Tecnologia,
Coimbra (Portugal)7 CITEEC - Centro de Innovación Tecnolóxica en Edificación e Enxeñería Civil, University of A
Coruna (Espanha)1Corresponding author: [email protected]
ABSTRACT In the last decades the urban area of Leiria (Portugal) has spread quickly and the impervioussurfaces increased significantly, mostly because of the type of pavements used (asphalt andPortuguese cobblestone) and the area occupied by buildings. One of the major problems is related tothe recurrent floods in Leiria’s downtown during periods of higher rainfall intensity, which affectthe economic activities, the environment and the residents’ lives. The urban area benefits from alarge drainage network, but in some zones it has low performance, due to the degradation of theinfrastructure and the successive located interventions occurred in the last decades (for networkexpansion and rehabilitation works). To minimize the flooding impacts in Leiria’s downtown, themunicipality intends to build an underground pipeline (a length of 1.5 kilometres, with a 2.0 metresdiameter and 0.2% slope) to convey the runoff by gravity from Leiria’s downtown to the river. Thispaper presents an integrated study of the urban catchment and the drainage network capacity usingthe Storm Water Management Model (SWMM). This study included the analysis of the solution fordifferent rainfall intensities (corresponding to different return periods) to assess its performanceand, when required, suggest additional recommendations.
Keywords: SWMM, Urban catchment, Urban drainage networks
1 INTRODUCTION
Urban spaces are particularly vulnerable to flooding, because they have a lot of impervious surfaces[1] and [2]. Thus, when high intensity precipitation occurs, instead of infiltrating in the soil, therainwater causes an increase in the surface runoff which rapidly accumulates at the lowest points ofthe urban catchment, causing floods. Obviously, the performance of the drainage networks in theseurban areas plays a very important role in the risk of flooding. It is therefore important to haveadequate knowledge of the hydraulic behaviour of these infrastructures for expected scenarios. Thisway, it is possible to identify the most appropriate strategies to improve the performance over theirlifetime. These systems consist of a set of underground pipes which convey the rainwater, from theinlets (curbs and gutters) to the final destination (receiving water bodies). Along the drainagenetwork there are several manholes for maintenance operations (flow observation and pipecleaning) and, sometimes, in large networks, there are complementary devices to improve theinfiltration of rainwater and/or control the time lag of the peak flow (manhole infiltration, retentionbasins). These drainage systems are commonly designed for relatively short return periods (usuallyless than 10 years), meaning that there is always a risk of flooding, whenever the capacity of the

CCWI 2017 – Computing and Control for the Water Industry Sheffield 5th - 7th September 2017
system is exceeded. It is in the context of the performance of these systems that it is possible to listthe causes of floods in urban areas, which may be related to: 1) Obstruction/degradation of pipes,manholes and inlets; 2) Undersizing of pipes and inlets; 3) Increase of impervious surfaces, notexpected in the design; 4) Connection of new areas to existing systems; and 5) Increased of extremeweather events. However, for each specific system, only an in-depth study will allow to identifywhich cause(s) identified above contribute to the occurrence of such floods.
As it is technically/economically infeasible to design a storm water system which will never causefloods (the cost would be prohibitive), the best practices involves establishing a compromisebetween the cost and an acceptable risk of flooding to be considered in the design. When dealingwith existing systems, first it is necessary to understand the overall performance of the network, inorder to identify the critical parts of the system and the most appropriate strategies which willimprove their performance. EPA's Storm Water Management Model (SWMM) has been used as atool to support the planning, analysis, and design of storm water systems, combining sanitarysewers and other drainage systems in urban areas [3].
The urban area of Leiria benefits from a large drainage network, but in some zones it has lowperformance, due to the degradation of the infrastructure and the successive interventions occurredin the last decades (for network expansion and rehabilitation works). One of the major problems isrelated to the recurrent floods in Leiria’s downtown during periods of higher rainfall intensity,which affect the economic activities, the environment and the residents’ lives. The municipality ofLeiria intends to proceed with the renewal of one of the main arteries of the town. Previous studiesshowed that the drainage network in that area has low performance and is one of the main causesfor occurring floods in the Leiria’s downtown. To prevent these floods from occurring in the future,it was decided to redesign the storm water system. The most important infrastructure in thisredesign is an underground pipeline (a length of 1.5 kilometres, with a diameter of 2.0 metres and aslope of 0.2%) connecting Leiria’s downtown to River Lis. To study the proposed solution and, ifrequired, suggest additional recommendations, a hydrology-hydraulic model was built using theStorm Water Management Model (SWMM), and the final results are presented in the followingsections of this paper.
2 CHARACTERIZATION OF THE STUDY AREA
The town of Leiria (Portugal) has grown around the Castle, which was built by the king D. AfonsoHenriques in the first half of the twelfth century. In the last decades, the urban area of Leiria hasspread quickly, producing a large impact on the impervious surfaces and on the performance of thedrainage infrastructures, with special emphasis on Leiria’s downtown storm water network. Thestudy area has more than 46 hectares and includes Leiria’s downtown (Figure 1). Close to theCastle, Leiria’s downtown is a well-established urban area, where old buildings and narrow streetsare predominant. The ground elevation changes between 28 and 30 metres, and on the hillside of theCastle the ground elevation changes between 30 and 60 metres.
The storm water network is one of the oldest infrastructures in the town and part of the network wasbuilt in the mid-nineteenth century. The urban area benefits from a separate system (independentnetworks for storm water and wastewater), but in some parts there are still unitary and pseudo-separative systems. The wastewater is sent to the treatment plants of Águas do Centro Litoral(before being discharged in the receiving water bodies), while the storm water is conveyed directly

CCWI 2017 – Computing and Control for the Water Industry Sheffield 5th - 7th September 2017
to River Lis and River Lena. The network has been progressively increasing, as a result of the quickgrowth of the urban area, and nowadays the total network length is unknown. The part of thenetwork that is known includes pipes of concrete, polyvinyl chloride and stoneware – diameterbetween 200 and 1000 mm.
Figure 1. Leiria’s downtown, view from the hill of the Castle. (Source: Author)
3 METHODOLOGY
3.1 Software
The Storm Water Management Model (SWMM) was selected for this work and is available at theUnited States Environmental Protection Agency website. SWMM is a dynamic hydrology-hydraulicmodel which has been widely used as a tool to support the planning, analysis, and design of stormwater systems, combining sanitary sewers and other drainage systems in urban areas [3].
3.2 Mathematical simulation models
In order to study the capacity of the urban drainage network, a SWMM model was built (Figure 2).The network information includes the layout of the network, the location of the inlets, the locationand depth of the manholes, the pipe length and the diameter and material of the pipes. Thecatchment has 46 hectares and was divided in sub-catchments considering the network inlets, theground elevation and the rainwater discharge from buildings. Most of the surface is impervious andthe average slope of the sub-catchments is between 0% and 22.5%. Wastewater has not been takeninto account in this study, since during the periods of great rainfall intensities its contribution isinsignificant. Thus, the hydraulic performance of the drainage network is related to the Intensity,Duration and Frequency of the rainfall events (IDF curves), and to the physiographic characteristicsof each sub-catchments. The Alternate Blocks method was used to define the design hyetographs[4].
The flow propagation throughout the drainage network was calculated using the Dynamic Wavemodel and the Green-Ampt method was used for modelling rainfall infiltration in the upper ground.A 5.0 second per time step analysis was used during a 6 hour simulation period, which allowed toobtain the flood hydrograph in the downstream drainage network.
Global position system: 39°44'49.19"N / 8°48'33.94"W

CCWI 2017 – Computing and Control for the Water Industry Sheffield 5th - 7th September 2017
Figure 2. Dynamic hydrology-hydraulic model (including additional information of the study area).
4 SIMULATION RESULTS ANALYSIS
Previous studies showed that the drainage network in the area for renewal has low performance andis one of the main causes for occurring floods in the Leiria’s downtown (Figure 2). Using a SWMMmodel, a dynamic hydrology-hydraulic of the drainage network was built with the aim to study thesolution proposed and, if required, suggest additional recommendations. The results of the analysisof the simulation model are presented in the next sections.
4.1 Influence of intensity, duration and frequency of rainfall in the peak flow
In this section, different design rainfall events were considered to analyse the hydraulic behaviourof the new solution for the drainage network. For a uniform rainfall (critical rainfall) it was possibleto estimate the lag time of the peak flow, which results from the contribution of the entirecatchment. Figure 3 shows the evolution of the network peak flow at the Leiria’s downtown sub-catchment and at the outfall section in River Lis.
Figure 3. Evolution of the drainage network peak flow, for uniform rainfall.
Leiria’s downtown
Urban area forrenewal
Outfall in River Lis
Leiria’s Castle
River Lena
Underground pipeline

CCWI 2017 – Computing and Control for the Water Industry Sheffield 5th - 7th September 2017
A return period (Rp) of 5 years and uniform rainfall, with durations (Δt) of 15, 20 and 30 minutes,were used. Taking as reference the Leiria’s downtown sub-catchment the lag time is about 15minutes and for the entire catchment it is about 30 minutes. Comparing the lag time for differentrainfall intensities, this value decreases with the increasing rainfall intensity and is related to thephysiographic characteristics of each sub-catchment and with the drainage layout of the network –this subject is discussed in section 4.2.
From Table 1, it is possible to compare the network peak flow simulated by SWMM and the samevalues obtained from the Portuguese Norms (Decreto Regulamentar Nº 23/95 – DR 23/95, [5]). Thedifference is higher for high rainfall intensities and is related to the fact that the Portuguese Normsuse a simplified method to estimate the peak flow (Rational Method), while the SWMM uses theone-dimensional Saint Venant flow equations to analyse the flow propagation throughout thedrainage network, and therefore produce theoretically the most accurate results.
Table 1. Network peak flows obtained from Portuguese Norms and simulated by SWMM.Return period
(5 years)IDF Curves Leiria’s Downtown Outfall in the River Lis
I (mm/h) Qmax.,DR 23/95 (L/s) Qmax.,SWMM (L/s) Qmax.,DR 23/95 (L/s) Qmax.,SWMM (L/s)Δt = 15minutes
56.59 4044 2746 6804 3900
Δt = 20minutes
48.15 3441 2454 5788 3409
Δt = 30minutes
38.33 2739 2087 4609 2813
By analysing the observed rainfall events, it is possible to check that rainfall with uniform intensityoccurs over relatively short periods of time. Thus, the discretization of the rainfall events in shortertime intervals allows better assessment of the distribution of the rainfall intensity over the time.Tables 2 and 3 show the influence of the duration of the rainfall (T), the number of rainfallincrements (Δt) and the maximum rainfall intensity (Imax) in the development of the network peakflow at the Leiria’s downtown sub-catchment. Figure 4 shows the evolution of the network peakflow.
Table 2. Effect of the duration and rainfall increments on the Leiria’s downtown peak flow.
RpT = 2 hours T = 1 hour
I (Δt = 10 minutes) I (Δt = 5 minutes) I (Δt = 5 minutes)h (mm) Qmax,SWMM (L/s) h (mm) Qmax,SWMM (L/s) h (mm) Qmax,SWMM (L/s)
5 35.18 586 35.18 296 25.97 27510 41.97 766 41.97 361 30.71 34120 48.36 855 48.36 426 35.11 401
Table 3. Effect of the maximum rainfall intensity on the Leiria’s downtown peak flow.
RpT = 2 hours; I (Δt = 5 minutes)
h (mm)Imax = 30 minutes Imax = 60 minutes Imax = 90 minutes
Qmax,SWMM (L/s) Qmax,SWMM (L/s) Qmax,SWMM (L/s)5 35.18 275 296 301
10 41.97 341 361 36620 48.36 401 426 431
The results showed that for the same return period (Rp), the network peak flow increases with thehigher rainfall duration (T) and/or lower number of rainfall increments (Δt). With respect to themaximum rainfall intensity, it is noted that the network peak flow increases when the maximumrainfall intensity is closer to the end of the rainfall – because the initial losses decrease over thetime. The same conclusion can be obtained for the lag time of the network.

CCWI 2017 – Computing and Control for the Water Industry Sheffield 5th - 7th September 2017
Figure 4. Effect of different design hyetographs on the Leiria’s downtown peak flow.
4.2 Analysis of the drainage network capacity
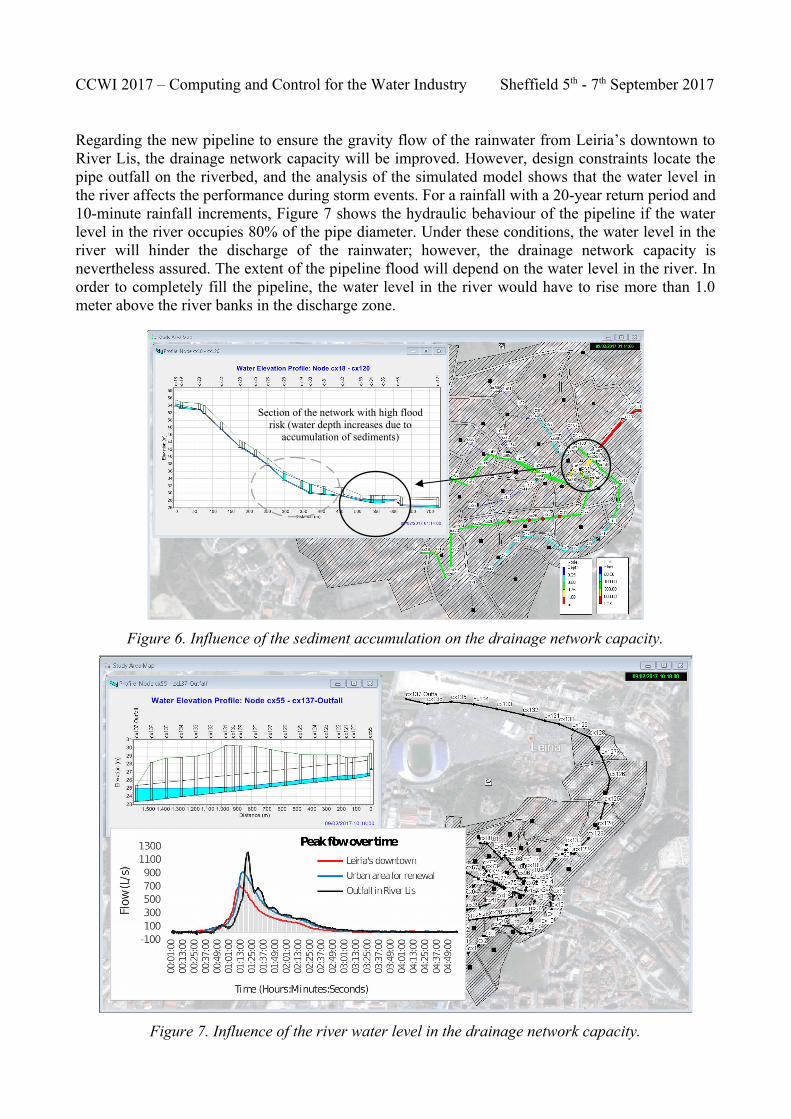
The simulation model showed that the lag time for the Leiria’s downtown sub-catchment isrelatively short (see section 4.1), and the main factors that contribute to this are the impervioussurfaces and the high slopes in the area (> 10%). In this area the flow velocity is high and the runoffaccumulates quickly in the lower parts of Leiria’s downtown, where the network pipes have smallerslopes (< 1%). To handle the reduction of the flow velocity and the lower capacity downstream, thediameters of the pipes in the lower elevations of Leiria’s downtown reach 1000 mm – this part ofthe network works as a small retention basin. Thus, the floods in these areas occur when thecapacity of the network is exceeded and this situation occurs for rainfalls with higher return period– however, these storm events have been occurring more frequently and probably this is one of themain causes for the recurrent floods in Leiria’s downtown. On the other hand, in this part of thenetwork there is always an accumulation of sediments due to the low flow velocity, which reducesthe water retention capacity. If not cleaned frequently, there is the risk of floods caused by rainfallswith low return period. For the different design rainfalls analysed, the high-risk areas identified are:Largo Marechal Gomes da Costa, Rua João de Deus, Praça Rodrigues Lobo, Largo de Santanaand Praça Doutor Correia Mateus. For a rainfall with a 20-year return period and 10-minuterainfall increments, Figures 5 and 6 show one of the critical sections of the network with high floodrisk, due to the reduction of the pipes slope and the influence of the sediment accumulation on thedrainage network capacity.
Figure 5. Influence of the network slope on the drainage network capacity.
Section of the network with high floodrisk (water depth increases due to
reduction of the pipes slope)
CCWI 2017 – Computing and Control for the Water Industry Sheffield 5th - 7th September 2017
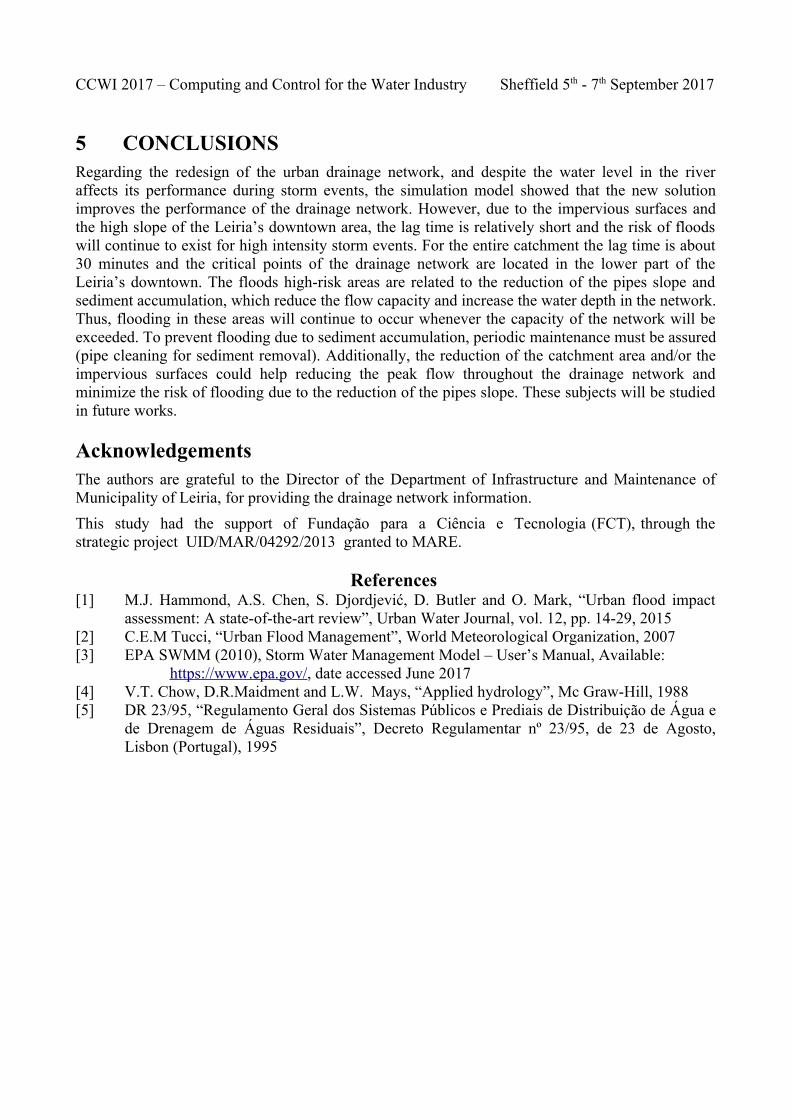
Regarding the new pipeline to ensure the gravity flow of the rainwater from Leiria’s downtown toRiver Lis, the drainage network capacity will be improved. However, design constraints locate thepipe outfall on the riverbed, and the analysis of the simulated model shows that the water level inthe river affects the performance during storm events. For a rainfall with a 20-year return period and10-minute rainfall increments, Figure 7 shows the hydraulic behaviour of the pipeline if the waterlevel in the river occupies 80% of the pipe diameter. Under these conditions, the water level in theriver will hinder the discharge of the rainwater; however, the drainage network capacity isnevertheless assured. The extent of the pipeline flood will depend on the water level in the river. Inorder to completely fill the pipeline, the water level in the river would have to rise more than 1.0meter above the river banks in the discharge zone.
Figure 6. Influence of the sediment accumulation on the drainage network capacity.
Figure 7. Influence of the river water level in the drainage network capacity.
Section of the network with high floodrisk (water depth increases due to
accumulation of sediments)
CCWI 2017 – Computing and Control for the Water Industry Sheffield 5th - 7th September 2017
5 CONCLUSIONS Regarding the redesign of the urban drainage network, and despite the water level in the riveraffects its performance during storm events, the simulation model showed that the new solutionimproves the performance of the drainage network. However, due to the impervious surfaces andthe high slope of the Leiria’s downtown area, the lag time is relatively short and the risk of floodswill continue to exist for high intensity storm events. For the entire catchment the lag time is about30 minutes and the critical points of the drainage network are located in the lower part of theLeiria’s downtown. The floods high-risk areas are related to the reduction of the pipes slope andsediment accumulation, which reduce the flow capacity and increase the water depth in the network.Thus, flooding in these areas will continue to occur whenever the capacity of the network will beexceeded. To prevent flooding due to sediment accumulation, periodic maintenance must be assured(pipe cleaning for sediment removal). Additionally, the reduction of the catchment area and/or theimpervious surfaces could help reducing the peak flow throughout the drainage network andminimize the risk of flooding due to the reduction of the pipes slope. These subjects will be studiedin future works.
AcknowledgementsThe authors are grateful to the Director of the Department of Infrastructure and Maintenance ofMunicipality of Leiria, for providing the drainage network information.
This study had the support of Fundação para a Ciência e Tecnologia (FCT), through thestrategic project UID/MAR/04292/2013 granted to MARE.
References [1] M.J. Hammond, A.S. Chen, S. Djordjević, D. Butler and O. Mark, “Urban flood impact
assessment: A state-of-the-art review”, Urban Water Journal, vol. 12, pp. 14-29, 2015[2] C.E.M Tucci, “Urban Flood Management”, World Meteorological Organization, 2007[3] EPA SWMM (2010), Storm Water Management Model – User’s Manual, Available:
https://www.epa.gov/, date accessed June 2017[4] V.T. Chow, D.R.Maidment and L.W. Mays, “Applied hydrology”, Mc Graw-Hill, 1988[5] DR 23/95, “Regulamento Geral dos Sistemas Públicos e Prediais de Distribuição de Água e
de Drenagem de Águas Residuais”, Decreto Regulamentar nº 23/95, de 23 de Agosto,Lisbon (Portugal), 1995