Embed Size (px)
Citation preview
Analysis and Report of Overvotes and Undervotes
for the 2016 General Election
Pursuant to Section 101595 Florida Statutes
January 31 2017
Florida Department of State Ken Detzner
Secretary of State
Florida Department of State Division of Elections
Room 316 RA Gray Building 500 South Bronough Street
Tallahassee Florida 32399-0250
Introduction Section 101595 Florida Statutes (F S) directs the Department of State (the Department) to
analyze and report on the performance of each type of voting system after every general election and determine whether ballot design or instructions contributed to voter confusion The law requires the report to be based on overvote and undervote data that is provided by each Florida County for either the ldquoPresident and Vice Presidentrdquo contest or ldquoGovernor and Lieutenant Governorrdquo contest or if neither is present the first contest on the ballot The Department of State analyzes this information and reports its findings to the Legislature and the Governor by January 31 of the year following the general election
This report focuses on factors relating to the ldquonon-valid votesrdquo being cast for the contest of the President and Vice President in the 2016 General Election The ldquonon-valid votesrdquo consist of three categories
bull Overvote An overvote occurs when a voter casts more votes than allowed in a contest An overvote is typically attributed to voter error and is the primary reason why ballots other than vote-by-mail (formerly ldquoabsenteerdquo) and provisional ballots are not tabulated at the polling location For ballots cast at the precinct or early voting location the voter is immediately alerted to the overvote when the tabulator rejects the ballot1 The voter is then given the choice to change the overvote before casting the ballot or cast the overvoted ballot as is2 In the case of a vote-by-mail or provisional ballot voter no procedure exists to let the voter know that he or she has overvoted one or more contests and there is no way to provide them an opportunity to change it
bull Undervote An undervote means that the voter did not designate a choice for a contest and the tabulator records no vote for the contest3 Although an undervote may be due to a voting machine issue4 most often it reflects a voterrsquos intent not to vote in a particular contest Voters may choose to undervote for any number of reasons Current voting systems only alert the voter as to a blank ballot (not whether there is one or more undervoted contests)5 As in the case of overvoting no mechanism exists to let a vote-by-mail or provisional ballot voter know that he or she has undervoted one or more contests or to provide an opportunity to correct it
bull Invalid write-in vote An invalid write-in vote may be due to voter error such as unintentionally writing in a valid candidatersquos name from another contest Often a voter intentionally writes in a non-qualified candidatersquos name
The certified voting systems in Floridarsquos 67 counties fall into four vendor-labeled categories Elections Systems and Software Inc (ESampS) Premier Election Solutions (GEMS) Sequoia Voting Systems Inc (Sequoia) and Dominion Voting Systems Inc (Dominion) At this time only two active voting system vendors provide and service certified voting systems in Florida
1 Section 1015606(3) F S 2 Ibid 3 It could also mean that the voter designated fewer than the allowable number of choices eg selecting only two choices in a ldquoVote for 3rdquo contest 4 Typically this issue arises more as a function of the machinersquos design limitation For example a tabulator may drop out the color yellow so that the machine will not be able to read any marks a voter makes in yellow ink Therefore a ballot marked with a yellow highlighter would be read as a blank ballot Tabulators also have settings that help them distinguish between a definite ldquovoterdquo mark vs an accidental hesitation mark 5 As the law is silent in regards to whether tabulators should alert voters of undervotes (other than blank ballot alerts) how the county codes their tabulators for undervotes is at the countyrsquos discretion No Florida county to the Departmentrsquos knowledge codes their tabulators to alert voters of undervotes other than blank ballots
1
ESampS and Dominion6 Sequoia and Premier are Dominion product lines Currently 26 Florida counties use Dominion voting systems and 41 counties use ESampS voting systems7
All voting in Florida must be by papermarksense ballot method in connection with a paper tabulator scanner with the exception of persons with disabilities who still have the option of voting on Direct Recording Electronic (DRE) touchscreen machines8 For disability accessibility compliance9 25 counties currently use the AutoMark ballot marking device as their compliant device ten counties use the Dominion ICE and nine counties use the ESampS ExpressVote all of which satisfy the paper ballot requirement10 By 2020 the remaining counties which currently use DRE touchscreen machines (such as ESampSrsquos iVotronic the Premier TSX and the Sequoia AVC Edge) will need to provide disability accessibility machines that meet the requirements of the Help America Vote Act (HAVA)11 and permit the voter to cast a papermarksense ballot12
Methodology Since 2010 the Department has been analyzing the data at the tabulator level instead of the
voting system level 13 This analytical approach offers more flexibility provides greater details and can be applied even in the event of future changes in voting system configuration For purposes of this report the 2016 General Election data was analyzed on the basis of the eleven types of voting systemsrsquo tabulation devices (tabulators) that have been used by Florida counties in the last four years The eleven types of tabulators were further segregated in Figure 1 below according to their use for early voting Election Day and vote-by-mail voting for the 2016 general election This figure shows how many counties used each tabulator type and for which voting method (early voting Election Day and vote-by-mail) Depending on the voting system and tabulator a county may use a tabulator type for tabulating ballots of one voting method or they may use the tabulator for tabulating ballots of several voting methods Counties using either the Premier GEMS AVOSX or the ESampS M100 switched to other voting systems andor machinery prior to the 2016 general election so those two tabulator types do not show any current usage data in this report
6 In 2009 ESampS acquired Premier Election Solutions from Diebold Election Systems Inc In 2010 the US Department of Justice mandated ESampS to divest elements of the Premier line of voting systems due to monopoly concerns As part of the agreement Dominion Voting Systems Inc (Dominion) then acquired Premierrsquos voting systems In 2010 Dominion also acquired Sequoia Voting Systems Inc 7 Seminole county is alone in being supported by ESampS for its Premier GEMS 1202 voting system with Accuvote OS machines All other counties using Premier voting systems are supported by Dominion Seminole county is included in the Premier countiesrsquo AVOS machine count although they are supported by ESampS 8 Section 10156075(1) F S 9 A voting device with equipment compliant with the Americans with Disabilities Act is known as an ADA device 10 As reported by the counties to the Florida Division of Elections as of October 3 2016 11 HAVA (Title III Section 15481 Public Law 107-252) 12 Section 10156075(3) F S 13 Prior to 2010 the data was analyzed according to voting system
2
Figure 1 Voting Systems Tabulators by Voting Method Usage in Florida
Voting System - Number of Countie s using Tabulator by Voting Me thod Tabulator Early Voting Ele ction Day Vote -by-ma il Sequoia - Insight+
Sequoia - 400-C Democracy Suite - ICE Democracy Suite - ICC
GEMS - AVOS GEMS - AVOSX
GEMS - PCS ESampS - M100
ESampS - DS200 ESampS - M650
ESampS - DS850
2 2 0 0 2 10 4 0 6 15 13 0 0 0 2 0 0 40 12 0 9 0 19
0 10 0 15 0 0 0 40 0 0
Total 67 67 67
Pursuant to Section 101595(1) F S the 67 county supervisors of elections must report their raw overvote and undervote data to the Department Counties submitted their data using the form implemented in 2010 (Form DS-DE 40) During the data verification reconciliation and compilation process counties were contacted for explanations of any discrepancies or unusual entries The aggregate data was then categorized and analyzed according to voting equipment (tabulation device)
Figures presented in this report show not only statewide results but results aggregated by tabulator Data was not compared between the optical scanner tabulator device and DRE touchscreen tabulator device No meaningful analysis can be done on the DRE touchscreen ballots cast because ballots cast via DRE were such a small portion of all ballots cast For the 2016 general election only 572 (0006) of the statersquos total ballots cast were cast via DRE touchscreen Since 2010 the touchscreen votes have been combined with the countiesrsquo optical scan tabulator group data Because the DRE touchscreen votes were so few aggregating them with the marksense totals does not bias the results
Data in this report are presented as rates or percentages of an event rather than as raw data The reason for this is that numbers of ballots cast vary greatly across Florida counties ranging from a few thousand to millions of ballots cast in a county By converting the event raw values to percentage of ballots cast it becomes possible to compare events across Florida counties14
Results for years other than 2016 can be found in earlier reports
Findings
Undervotes The 2016 general election saw an increase in the undervote rate Neither voting method nor
tabulator type appeared to be factors in the increase
14 The raw data reported by the counties is available from the Department 3
Figure 2 shows that the overall undervote rate remained fairly static from 2008 to 2012 presidential races but then more than doubled in 2016 Even so the rate remained below 1 of all ballots cast statewide
Figure 2 Undervote Rate by Voting Method and Overall 2008-2016 Presidential Contests
The overall undervote rate increased from 028 in 2012 to 068 The overall undervote rate or statewide average15 is defined as the total number of optical scan ballots statewide which were undervoted on the presidential race divided by the total number of optical scan ballots statewide
Broken down by voting method (Figure 3) from 2012 to 2016 the statewide average of undervotes increased for each method of casting a ballot The statewide average for early voting increased from 019 to 045 For Election Day voting only the statewide average of undervotes increased from 028 to 071 And for vote-by-mail voting only the statewide average of undervotes increased from 035 to 096 Not only did the rate of undervotes increase in 2016 overall but it increased for every voting method by which voters may cast a ballot
Figure 3 Undervote Rate by Voting Method for 2008-2016 Presidential Contests
Average Undervote Rate
Presidential Contest Voting Method 2008 2012 2016 Early Voting 017 019 045 Election Day 026 028 071 Vote‐by‐mail 035 035 096 Overall 026 028 068
15 ldquoAveragerdquo as used in this document is the statistical mean unless otherwise specified The term ldquoaveragerdquo is used as it is more commonly understood
4
The overall undervote rate per tabulator type also increased regardless of machine type Figure 4 below shows that from 2012 to 2016 undervote rates increased for every machine type for which there was data for both election years16 Undervotes increased not only on those high-speed machines used specifically for vote-by-mail processing such as the DS850 M650 PCS and 400-C but also for machines used for precinct tabulation as well such as the DS200 AVOS and Insight+ Since all machine types experienced an increase in undervotes the increase does not appear to be attributed to any particular type of machine
Figure 4 Undervote Rate by Tabulator 2012 vs 2016
As Figure 5 below shows the undervote rate increased across all voting machine types As stated before the statewide average17 increased from 028 to 068 The county average calculated as the average of all 67 countiesrsquo rates of overvoted optical scan ballots also increased in a similar vein from 035 to 064 Furthermore the standard deviation stayed nearly the same (020 to 018) meaning that the range between the lowest and highest countiesrsquo percentages remained the same In other words the 67 countiesrsquo data clustered around the average in much the same way they did four years ago with similar variability
16 Four machine types the M100 the AVOSX the ICC and ICE have data for either 2012 or 2016 but not both The ICC and ICE machines were not yet certified in 2012 and the counties who used M100s or AVOSXs switched to other machines prior to the 2016 general election 17 Defined as the total number of overvoted optical scan ballots divided by total number optical scan ballots
5
Figure 5 Undervote Rate by Tabulator 2012 vs 2016
Undervote Rate by Tabulator 2012 vs 2016
Voting System ‐ Tabulator 2012 2016
Sequoia Insight+ 027 070
Sequoia 400‐C 058 105
Democracy Suite ICE NA 053
Democracy Suite ICC NA 100
GEMS AVOS 027 061
GEMS AVOSX 017 NA
GEMS PCS 025 094
ESampS M100 043 NA
ESampS DS200 025 056
ESampS M650 032 103
ESampS DS850 062 092
Statewide Average 028 068 County Average 035 064
Standard Deviation 020 018
Overvotes The 2016 general election saw a decrease in the overvote rate Neither the voting method nor
the tabulator type appeared to be factors in the decrease
Figure 6 below demonstrates the decline of overvotes since 2008 with the latest presidential election showing a sharper decline than the almost imperceptible decline in the previous presidential election Even though the decline was more marked in 2016 it is still only about one-tenth of a percent difference in the last two presidential election cycles
6
Figure 6 Overvote Rate by Voting Method and Overall 2008-2016
Figure 7 shows the data behind the chart above
Figure 7 Overvote Rate Data by Voting Method 2008-2016 Presidential Contests
Average Overvote Rate
Presidential Contest Voting Method
Early Voting Election Day Vote‐by‐mail Overall
2008 015 028 043 028
2012 015 027 036 026
2016 008 014 026 015
The overvote rate as a function of tabulator type shows a decrease as well The overvote rate decreased for every tabulator type from 2012 to 2016 as illustrated in Figure 8 below18 For this reason the decrease in overvotes cannot be attributed to a specific tabulator type
18 As with the undervote figures in the previous section four machine types do not have overvote data for both election years due to not being in use during both years Furthermore in 2012 the only county using the DS850 machine reported 0 overvotes
7
Figure 8 Overvote Rate by Voting Machine Type 2012 vs 2016
Figure 9 below shows the percentages for each tabulator type The change in standard deviation on this table shows that the cluster of countiesrsquo overvote rates around the average (an indicator of variability) tightened somewhat from 2012 to 2016 In 2016 there was less variability among all 67 countiesrsquo overvote rates even though the statewide average dropped overall
Figure 9 Overvote Rate by Tabulator 2012 vs 2016
Overvote Rate by Tabulator 2012 vs 2016
Voting System ‐ Tabulator 2012 2016
S equoia Insight+ 022 012
Sequoia 400‐C 059 041
Democracy Suite ICE NA 005
Democracy Suite ICC NA 014
GEMS AVOS 011 008
GEMS AVOS X 008 NA
GEMS PCS 025 007
ESampS M100 023 NA
ESampS DS200 033 012
ESampS M650 044 034
ESampS DS850 000 023
Statewide Average 026 015 County Average 018 011
Standard Deviation 013 008
8
As the Department has reported in the past the vote-by-mail (formerly ldquoabsenteerdquo) voting method continues to generate a disproportionate number of the overvotes and undervotes in the election To illustrate Figure 10 shows the percentage of total ballots that were cast by each voting method Early voting was the most used method for casting a ballot in 2016 followed by Election Day and finally vote-by-mail
Figure 10 Distribution of Total Ballots Cast by Voting Method 2016
Figure 11 however shows that the voting-by-mail method generated the most overvotes as well as the most undervotes Early voting the most used method of casting a ballot produced the fewest overvotes and undervotes Furthermore 2016 is the first general election year in which early voting since its codification in law in 200419 surpassed Election Day in usage20 yet early voting continued to follow the pattern of producing the fewest overvotes and undervotes
19 Section 13 ch 2004-252 Laws of Florida 20 Ballots Cast Reports 2004-2014 (httpdosmyfloridacomelectionsdata-statisticselections-datageneral-election-summaries)
9
Figure 11 Distribution of Undervotes and Overvotes by Voting Method 2016
As mentioned in previous reports and illustrated above the method of casting a vote is a factor in the overvote and undervote rates When compared with early voting and Election Day the vote-by-mail method clearly produces a disproportionate share of overvotes and undervotes Currently there is no mechanism (statutory or procedural) to alert vote-by-mail voters that they have marked an overvote or undervote before their ballot is finally cast in the supervisor of electionsrsquo office The Department theorized in previous reports that overvotes and undervotes are lower during early voting and Election Day because voters there are alerted by the tabulators that they have marked an overvote or are about to cast a blank ballot21 However that same voter in the polling location is not alerted to an undervote still the voters are less likely to undervote in-person than when voting by mail Therefore although the method of casting a vote is a factor in the overvote and undervote rates the presence of a mechanism to alert the voter is not a factor at least in regard to undervotes
The year 2016 is the first general election year since early voting was codified in law in 200422
that early voting surpassed Election Day voting in the number of ballots cast23 The rates of undervotes and overvotes however still held the same pattern as in previous elections Vote-by-mail balloting produces the most undervotes and overvotes followed by Election Day and then early voting which produces the fewest undervotes and overvotes
Nonetheless an inherent bias continues to exist resulting in the underrepresentation of actual overvote rates (or conversely higher than actual undervote rates) The bias is attributable to the current requirement in section 1015614(5) F S for duplicating a ballot that is not otherwise tabulated at the precinct County canvassing boards are required to duplicate a vote-by-mail ballot with an overvoted contest as a ballot that includes only valid votes This process has the unintended effect of changing an overvoted contest into an undervoted contest Since it is
21 In compliance with 1015606(3) F S counties code their tabulators to alert voters of a blank ballot or an overvoted contest However the law is silent in regards to alerting voters of undervotes and counties do not in practice code their tabulators to alert voters of undervotes Indeed setting an alert for undervotes would severely impact the voting process and create long lines at the polls 22 Section 13 ch 2004-252 Laws of Florida 23 Ballots Cast Reports 2004-2014 (httpdosmyfloridacomelectionsdata-statisticselections-datageneral-election-summaries)
10
unknown how significant the bias is in the data set evaluations of the data set can only be approximate
In addition current polling place practices in some counties may also contribute to this bias In counties that use the ESampS DS200 or the Dominion ICE the voter can override the tabulator to cast his or her overvoted ballot without assistance from the poll worker However in counties that use precinct tabulators such as the Sequoia Insight+ or GEMS AVOS the poll worker must conduct the ldquooverriderdquo Some counties do not permit their poll workers to override the tabulator and instead the poll worker places the overvoted ballot in the emergency bin Consequently those ballots are duplicated later without the overvoted contest in the same manner as the vote-by-mail ballots in compliance with section 1015614(5) F S This process results in overvotes being converted to undervotes and thus not accurately represented
Invalid Write-In Votes Invalid write-in votes (those votes for which the voter wrote in a candidatersquos name who had not
qualified for the ballot) increased from 2012 to 2016
Figure 12 below shows the statewide average increased from 021 to 086 a four-fold increase Of all the non-valid vote typesmdashovervote undervote and invalid write-inmdash the invalid write-in shows a significant rate change since the previous presidential election (a change of 065) Furthermore the standard deviation increased from 008 to 025 which means that the 67 countiesrsquo invalid write-in rates were clustered very close to the average in 2012 (a small range between the lowest and highest rates) and then spread out more in 2016 (indicating greater variability)
Figure 12 Invalid Write-In Rate by Tabulator 2012 vs 2016
Invalid Write‐In Rate by Tabulator 2012 vs 2016
Tabulator 2012 2016
Sequoia Insight + 012 057
Sequoia 400‐C 016 073
Democracy Suite ICE NA 089
Democracy Suite ICC NA 115
GEMS AVOS 026 095
GEMS AVOSX 023 NA
GEMS PCS 025 040
ESampS M100 023 NA
ESampS DS200 018 070
ESampS M650 022 090
ESampS DS850 000 144
Statewide Average 021 086
County Average 024 074
Standard Deviation 008 025
11
Figure 13 below illustrates that the invalid write-in votes rates increased considerably across all tabulator types including not only those high-speed machines used only for vote-by-mail processing such as the DS850 M650 PCS and 400-C but also for machines used for precinct tabulation as well such as the DS200 AVOS and Insight+ 24
Figure 13 Invalid Write-In Rate by Tabulator 2012 vs 2016
In 2012 the only county using the DS850 reported no invalid write-ins25 However by 2016 eighteen more counties had adopted the DS850 as their vote-by-mail tabulator which could explain why the rate of invalid write-ins jumped to 144 in 2016 the highest invalid write-in rate (and largest increase as well) for any tabulator (All nineteen counties reported invalid write-ins greater than 0 in 2016) The DS850 is currently the most popular tabulator in Florida for tabulating vote-by-mail ballots (see Figure 1) The Conduct of Elections reports and other information submitted by Florida counties indicates the DS850 is performing as expected and no anomalies are reported
All Non-Valid Votes The 2016 general election saw an increase in the non-valid vote rate from 2012 Neither voting
method nor tabulator type appeared to be factors in the increase
Non-valid votes include all types of votes that do not count such as overvotes undervotes and invalid write-ins Figure 14 below shows that non-valid votes stayed the same between the 2008 and 2012 presidential elections and jumped significantly in 2016 (an increase of 094)
24 In addition to the four machines mentioned earlier which do not have data for both years (M100 AVOSX ICC ICE) the data for the DS850 was 000 25 Cross-reference page 9
12
Figure 14 Non-Valid Vote Rate 2008-2016 Presidential Contests
In the non-presidential general election years of 2010 and 2014 the non-valid vote rate also increased from 091 in 2010 to 136 in 2014 Figure 15 below shows the non-valid vote rate for all general elections since 2008 The non-valid vote rate has been trending upward since 2012
Figure 15 Non-Valid Vote Rate 2008-2016 General Elections
13
The increase in non-valid votes in the presidential contest in Florida is part of a nationwide trend
Ballot Design and Instructions An historical overview of the overvote and undervote data consistently shows no demonstrable
correlation as to whether ballot design andor instructions confused voters and whether the voting system manifested any anomalies
Conclusion The results of analysis of the overvotes and undervotes in the 2016 General Election compared
to the 2012 General Election show that the rate of undervotes increased along with invalid write-ins and all non-valid votes and the rate of overvotes decreased The overall rates changed as follows
bull The undervote rate increased from 028 to 068
bull The invalid write-in rate increased from 021 to 086
bull The non-valid vote rate increased from 065 to 169
bull The overvote rate decreased from 026 to 015
The increases in undervotes invalid write-ins and all non-valid votes appear to be part of a national trend
The method of casting a vote has been found to be a factor affecting the number of overvotes and undervotes This analysis again demonstrates that the vote-by-mail method clearly generates a disproportionate share of overvotes and undervotes This year however as the number of ballots cast during early voting surpassed that of Election Day yet the number of overvotes and undervotes remained the fewest of all voting methods the data suggests that early voting is the voting method still least likely to produce overvotes and undervotes regardless of its increasing level of usage as a method of casting ballots
The Department again recognizes that an inherent reporting bias exists attributable to the requirement in section 1015614(5) F S for duplicating a vote-by-mail ballot County canvassing boards are required to duplicate a vote-by-mail ballot with overvotes as a ballot with valid votes which requires the overvotes to be converted to undervotes Thus overvotes may be under-represented and undervotes may be over-represented Such bias could hinder identification and reporting of an issue with a voting system since actual vote data cannot be reliably verified
Further bias exists because some counties do not allow their poll workers to perform the ldquooverriderdquo function of the tabulator to override the ldquoovervoterdquo alert and accept a voterrsquos overvoted ballot Instead the poll worker places the overvoted ballot in the emergency bin to be duplicated later in the same manner as vote-by-mail ballots are duplicated in accordance with the requirements of section 1015614(5) F S This results in under-representation of the actual overvotes and over-representation of the actual undervotes of precinct results
Nothing in the compiled presidential contest data from the counties indicates that there was voter confusion during the election as a result of ballot design andor ballot instructions issues Likewise neither did the data suggest any anomalies with the voting equipment Furthermore a historical overview of the overvote and undervote data and reports consistently shows no demonstrable correlation as to whether ballot design andor instructions confused voters and whether the voting system manifested any anomalies
14
Recommendations Based on the findings and conclusion the Department makes the following recommendations
1 To more accurately reflect actual overvote and undervote data supervisors of elections who have not otherwise established such procedures must train pollworkers to allow a voter who chooses to vote an overvoted ballot to immediately cast the ballot in a precinct tabulator rather than segregating the ballot in the emergency bin for later duplication This may help to minimize under-represented overvote data
2 To better identify any potential issues and correlate a cause and effect on how voting systems performed and how the voting process including ballot design and instructions might have affected voters the overvote and undervote report and the conduct of elections report should comprise one report due at the same time The combined report would provide a more comprehensive contextual analysis including but not limited to election day post-election and post-election certification activities and other useful data elements
15
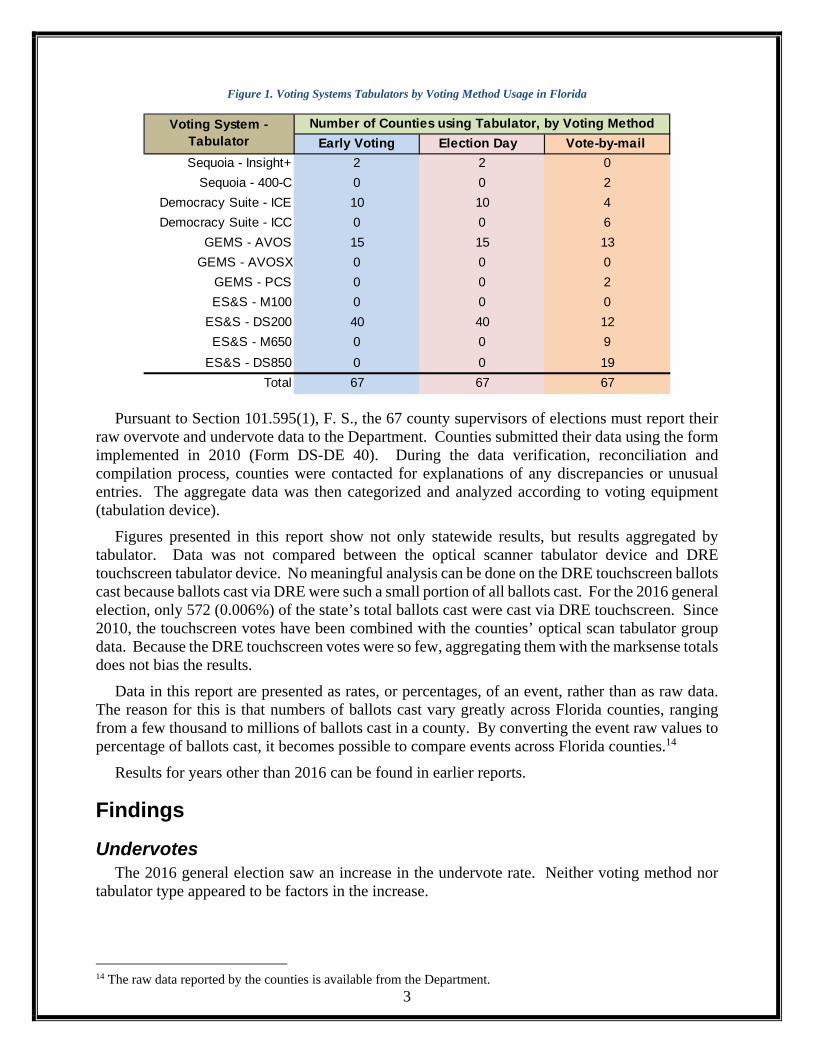
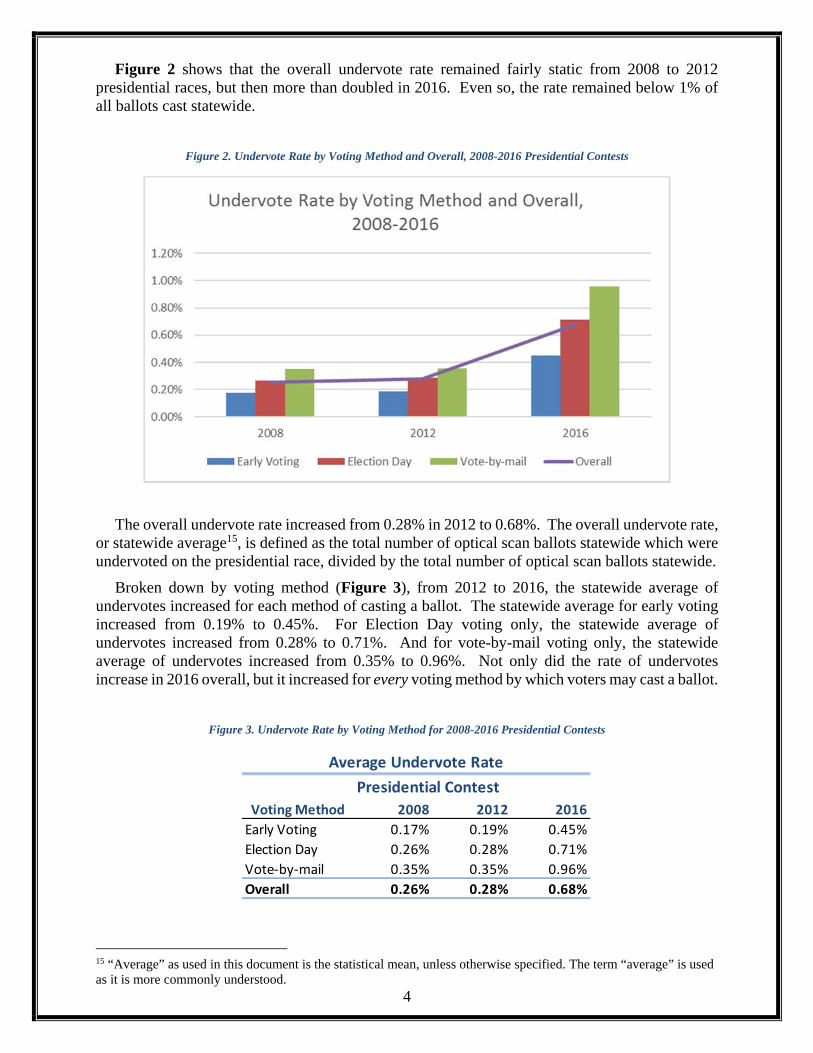
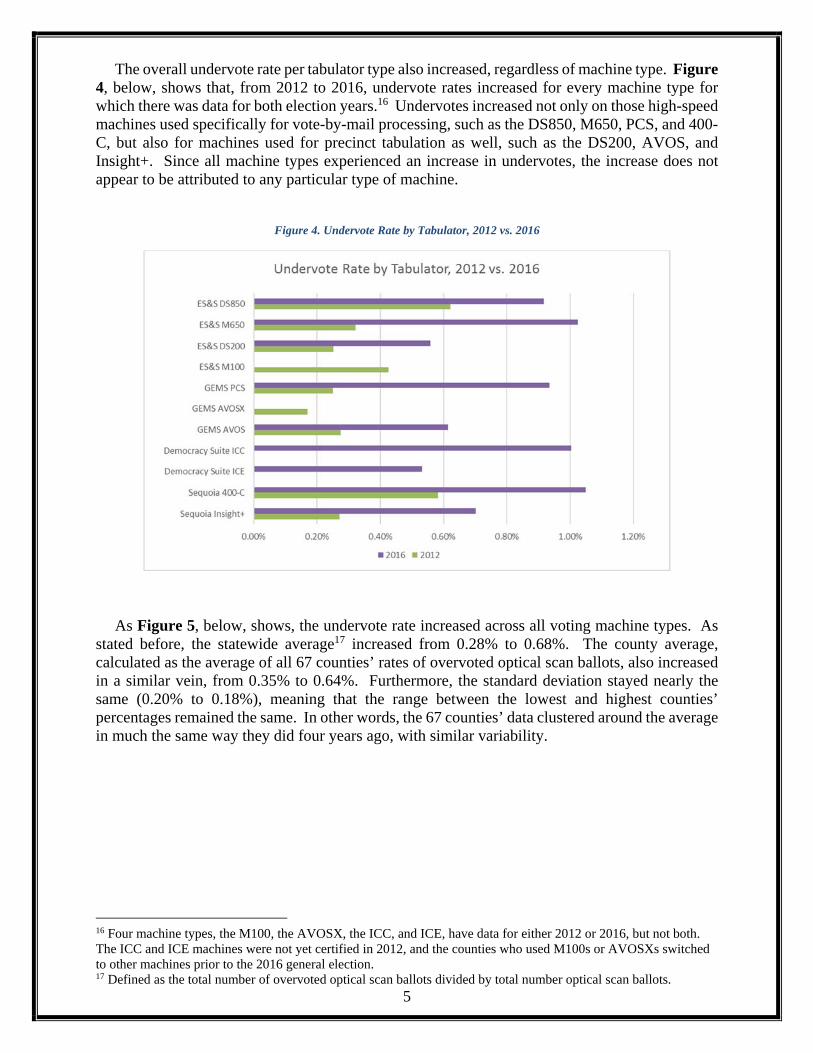
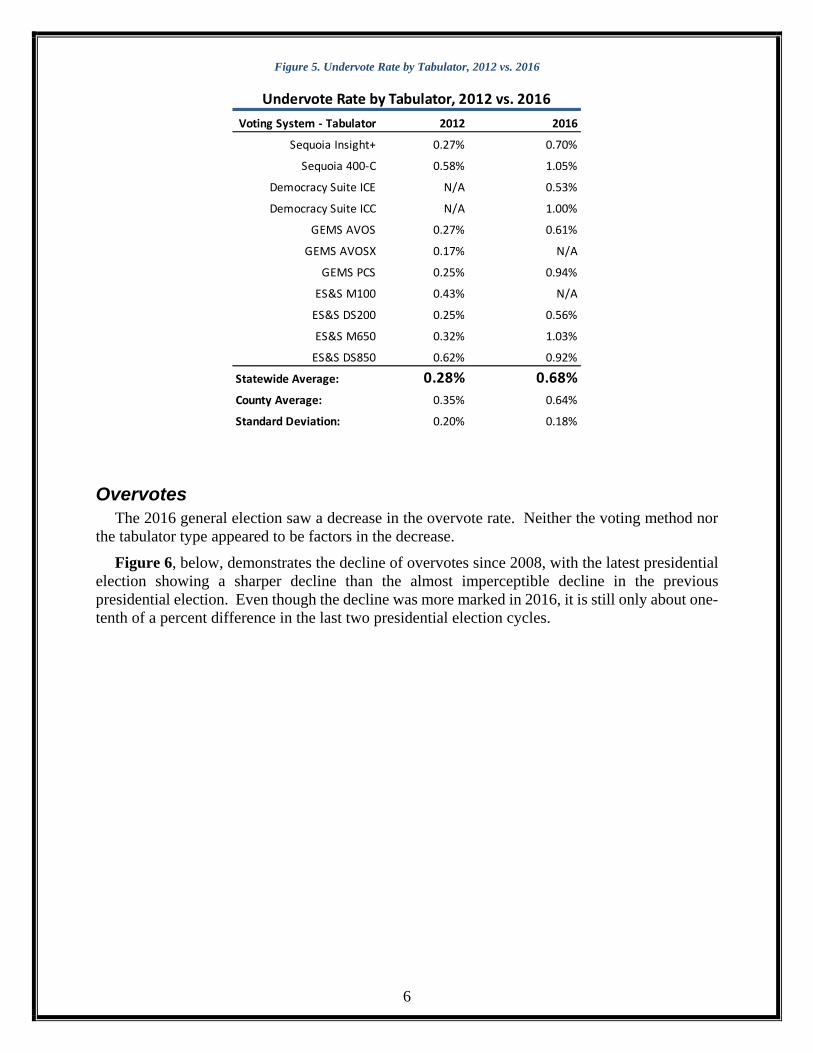
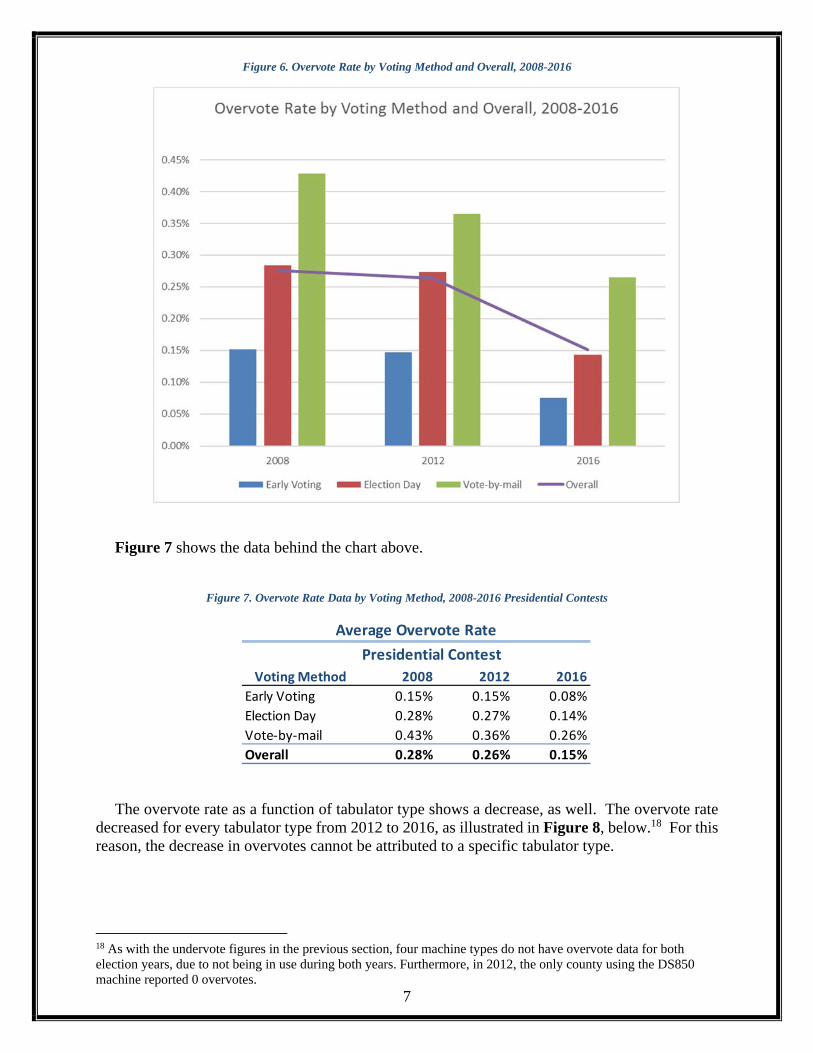
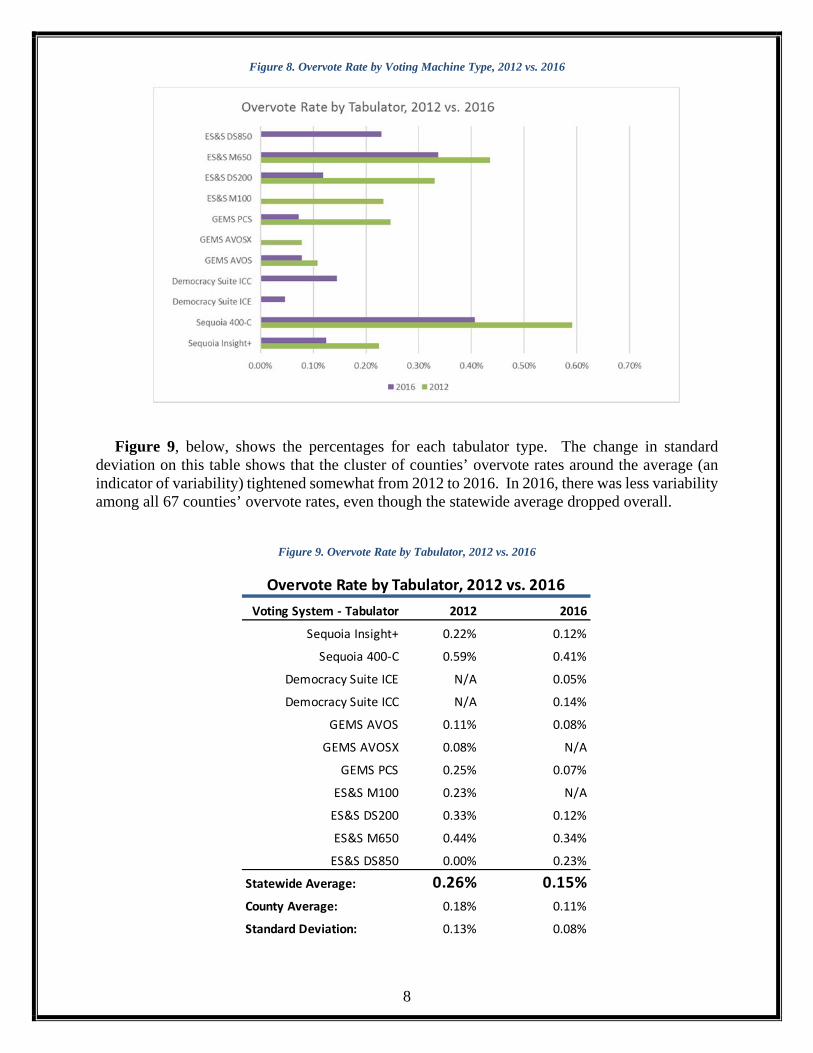
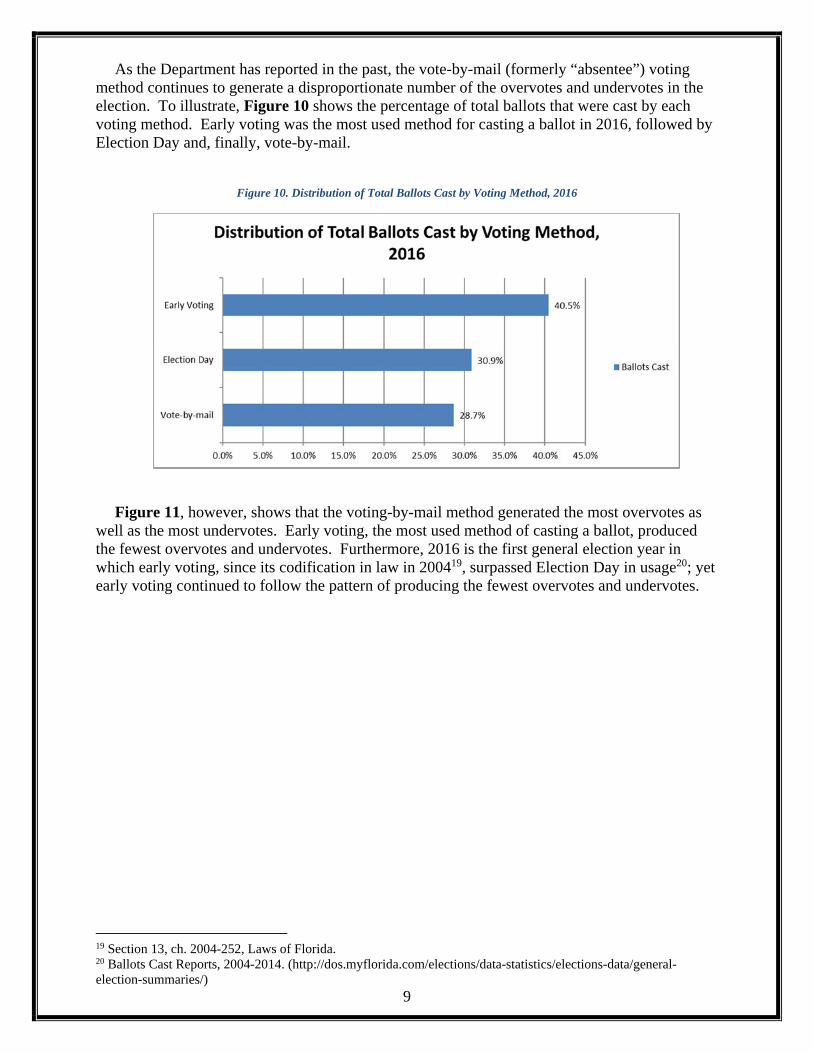
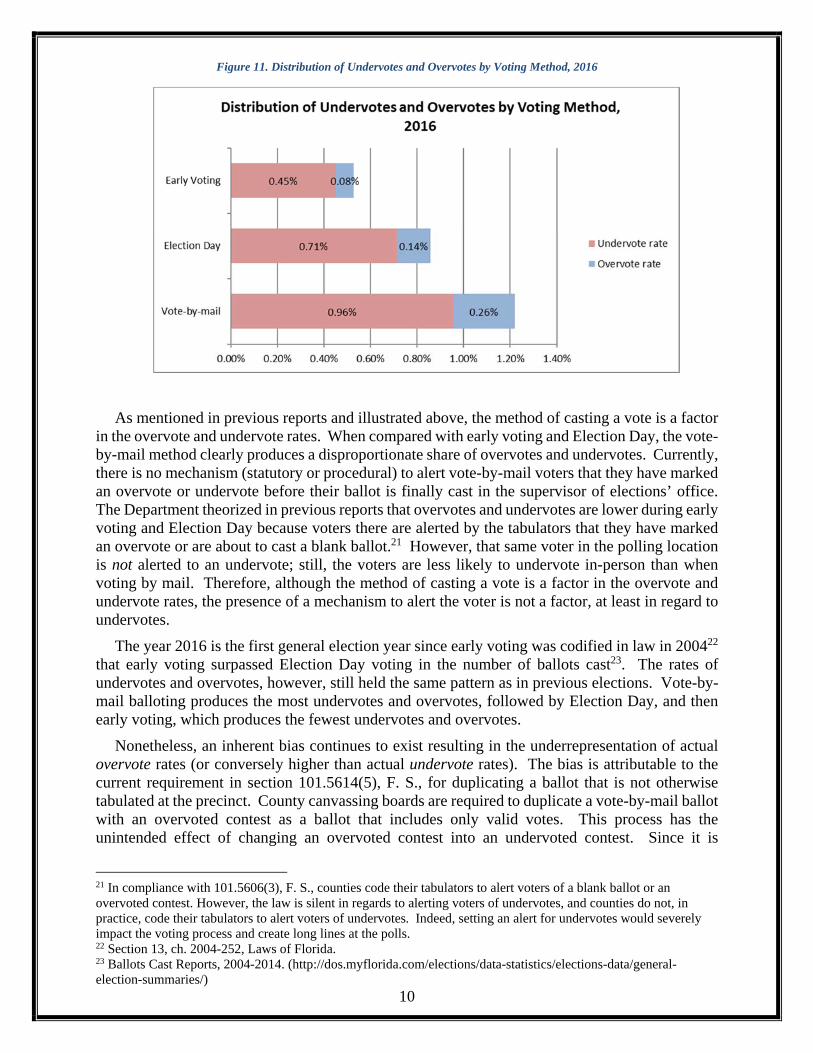
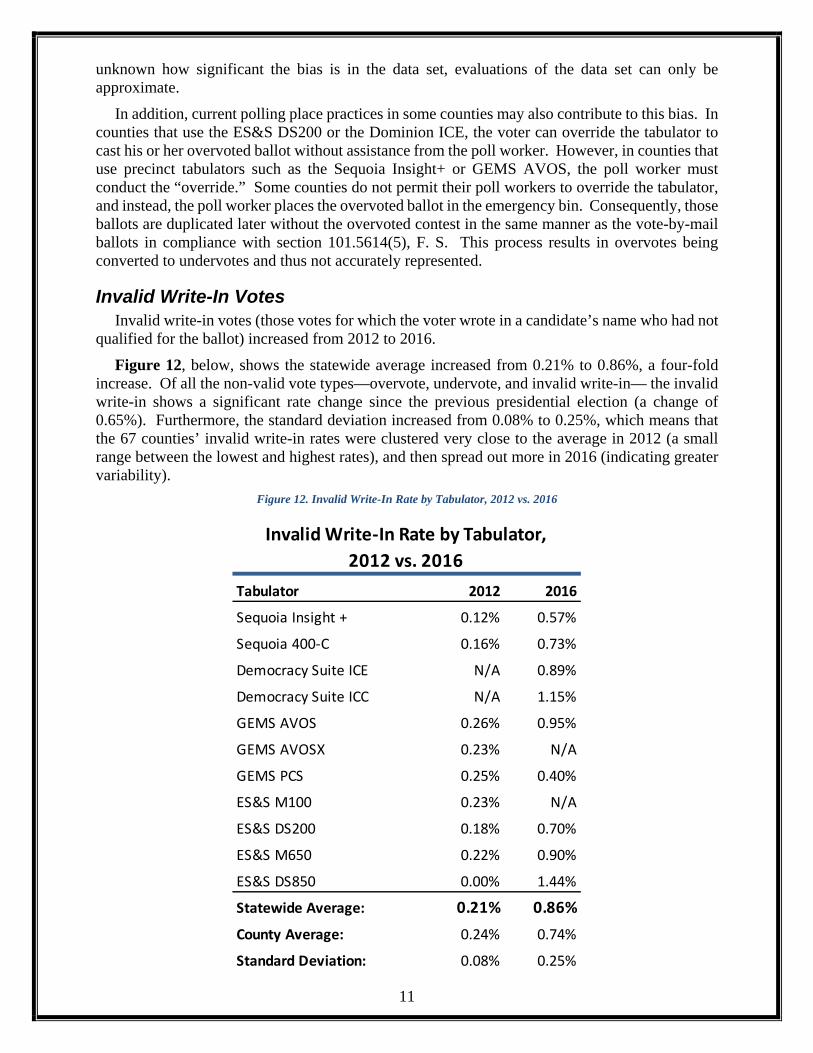
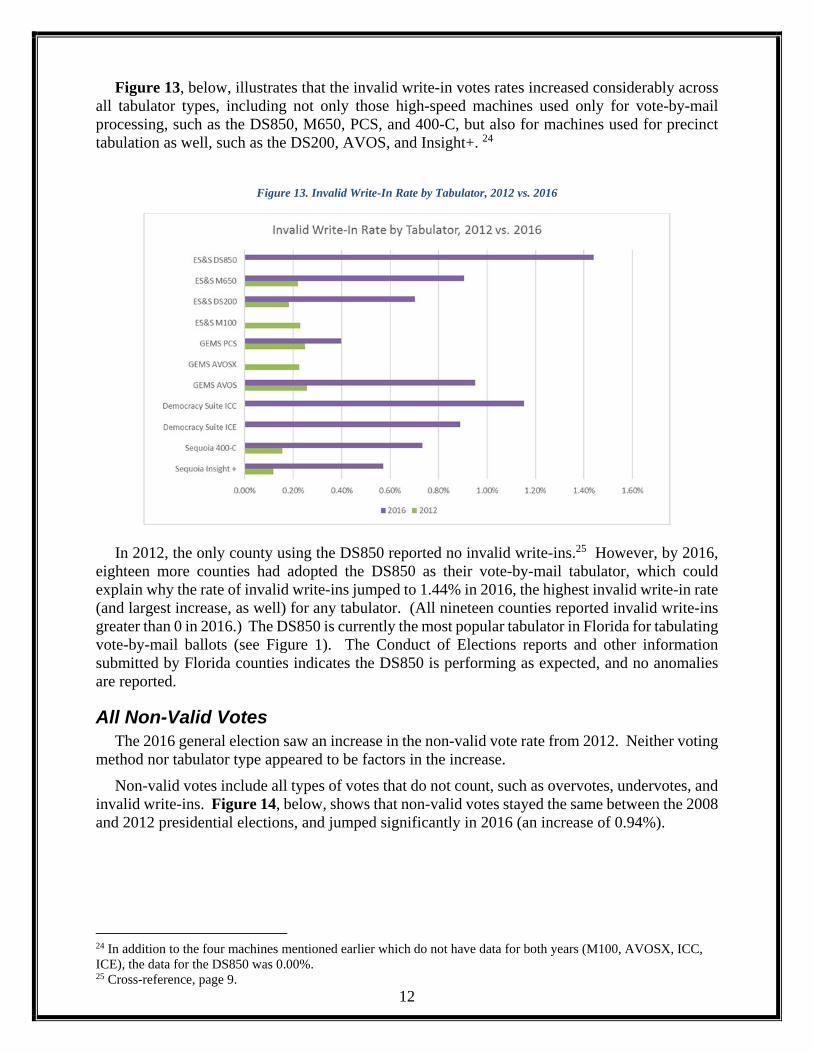
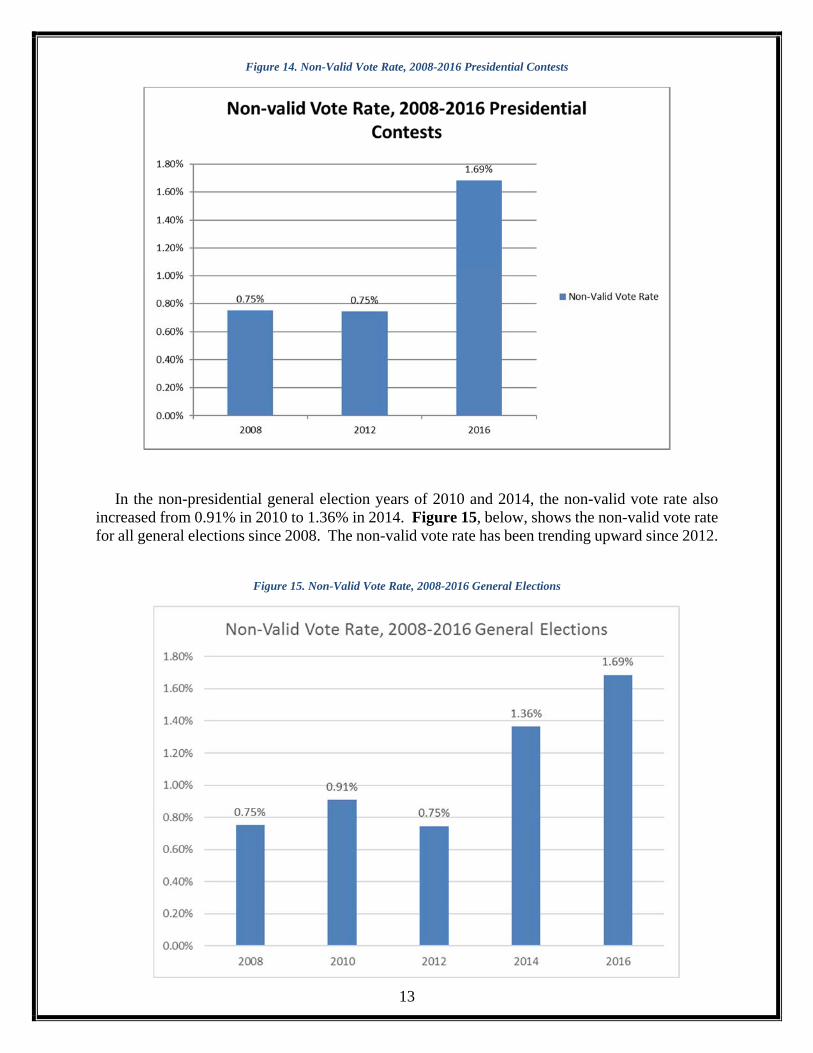
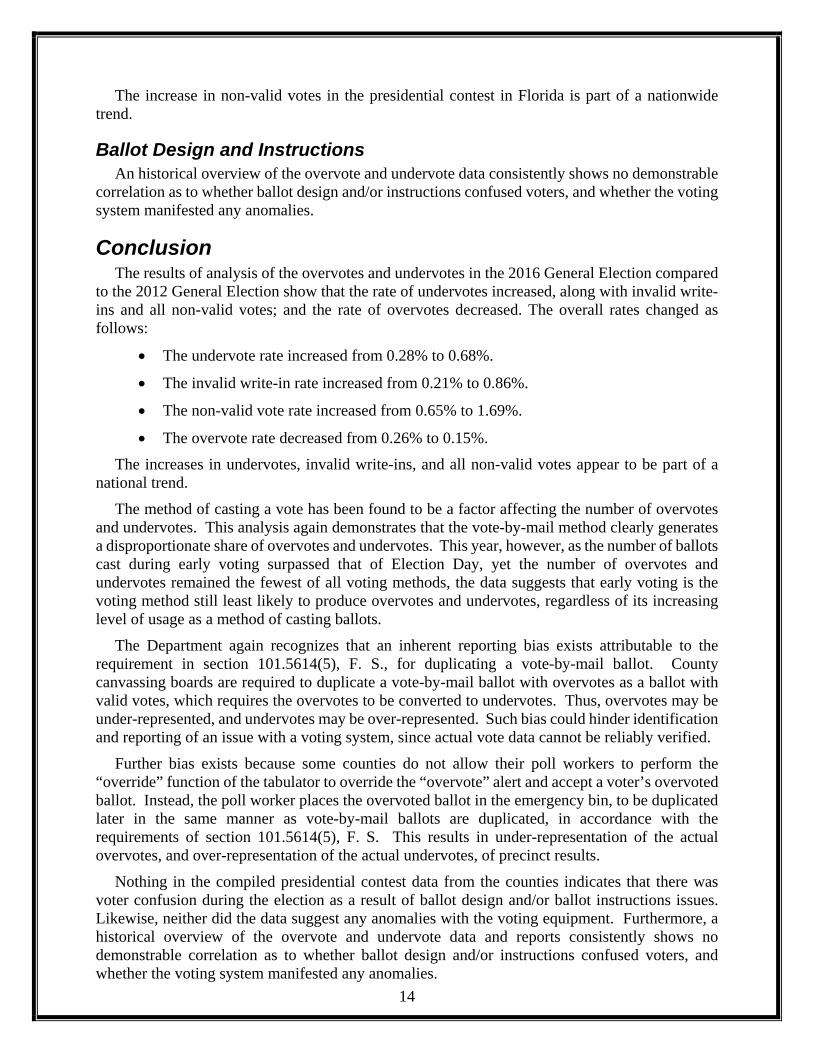


![PROJECT NUMBER [project number] PUBLIC LIBRARY …dos.myflorida.com/media/693528/constructagreement20… · · 2016-09-15completion of Deliverables will be submission and acceptance](https://img.pdfslide.us/doc/110x75/5ac878bc7f8b9a6b578c2627/project-number-project-number-public-library-dos-2016-09-15completion-of.jpg)


![mailto:Timothy.Parsons@dos.myflorida.com] No. 5. Distinctive materials, features, finishes and construction techniques or examples of craftsmanship that characterize a property will](https://img.pdfslide.us/doc/110x75/5ae5bb377f8b9a87048d012a/mailto-dosmyfloridacom-no-5-distinctive-materials-features-finishes-and.jpg)