Embed Size (px)
Citation preview

99
Chapter IV
ANALYSIS AND INTERPRETATION OF DATA The purpose of the study was to find the relationship of socio-economic
status with physical fitness, health status, sports performance, proneness to
disorders, Cancer prone, proneness to coronary Heart diseases, Psychopathic
behavior prone, Healthy personality, Depression prone, Addiction prone among
the sports persons of University of Mysore, who had participated in various
sports and games.
To accomplish the purpose of the study, 311 male sports persons who
had participated and qualified for the final selection trials of various sports and
games held to choose the persons to represent University of Mysore in the
inter-university competitions during the year 2003-04 were selected as subjects.
The method of collection of data of the variables under study was explained in
chapter-III, Methodology.
The collected data were tabulated and statistical analysis was carried out
accordingly, and the same have been presented in this chapter.
To achieve the objectives stated and to verify the hypotheses stated
following statistical techniques were applied in the present investigation.
Descriptive statistics
Cross tabs procedure
Pearson’s product moment correlation
Analysis of Variance-2 way
A brief description of nature of each of the statistical method and
applicability is presented in the following paragraphs.

100
Descriptive statistics
Descriptive statistics provides summary information about the
distribution, variability, and central tendency of a variable. In the present
investigation, the description of the sample was taken for several variables
using descriptive statistics technique.
Cross-tabs procedure
The Cross-tabs procedure forms two-way and multi-way tables and
provides a variety of tests and measures of association for two-way tables. The
structure of the table and whether categories are ordered determine what test or
measure to use. In the present study contingency coefficient test was applied to
find out the association between type of games and SES status to find out the
association between the two variables.
Pearson’s product moment correlation (Bi-variate correlation)
The Bi-variate Correlations procedure computes Pearson’s correlation
coefficient measure how variables or rank orders are related. Before calculating
a correlation coefficient, one has to screen the data for outliers (which can
cause misleading results) and evidence of a linear relationship. Pearson’s
correlation coefficient is a measure of linear association. In the present study
correlation technique was applied to find out the influence of SES over other
variables like physical fitness, general health status, performance and
proneness to disorders.
Analysis of Variance-2 way (GLM)
The GLM (General Linear Model) uni-variate procedure provides
analysis of variance for one dependent variable by one or more factors and/or
variables. The factor variables divide the population into groups. Using this
General Linear Model procedure, one can test null hypotheses about the effects
of other variables on the means of various groupings of a single dependent

101
variable. One can investigate interactions between factors as well as the effects
of individual factors, some of which may be random. In the present study, two-
way ANOVA was employed to find out the significance of difference between
mean scores of SES and games on various dependent variables along with the
interaction effect.
The statistical techniques were done through SPSS for Windows
(Statistical Presentation System Software, SPSS, 1999, SPSS Inc, New York)
All the significance levels obtained through software are presented as it
is in the following analysis tables. As per the standard norm, any significance
value (P Value) below .05 level is considered as significant. Any P value at
.000 level is considered as highly significant.
For the sake of clarity and clear understanding, the analysis was carried
out in three sections. They were;
Section I : Description of the sample
Section II : Relationship between SES and other variables
Section III : Influence of SES and type of games on selected variables
Section I : Description of the sample selected
In this section, descriptive statistics of the sample, for socio-economic
status, physical fitness variables, subscales and total scores of General Health
Questionnaire aspects, sports performance, proneness to disorders were given
separately.
a) Socio-economic status and type of game
A total of three hundred and eleven subjects who pursued different
games and sports were included in the present research. On the basis of the
nature and features of those sporting events they were broadly classified into
102
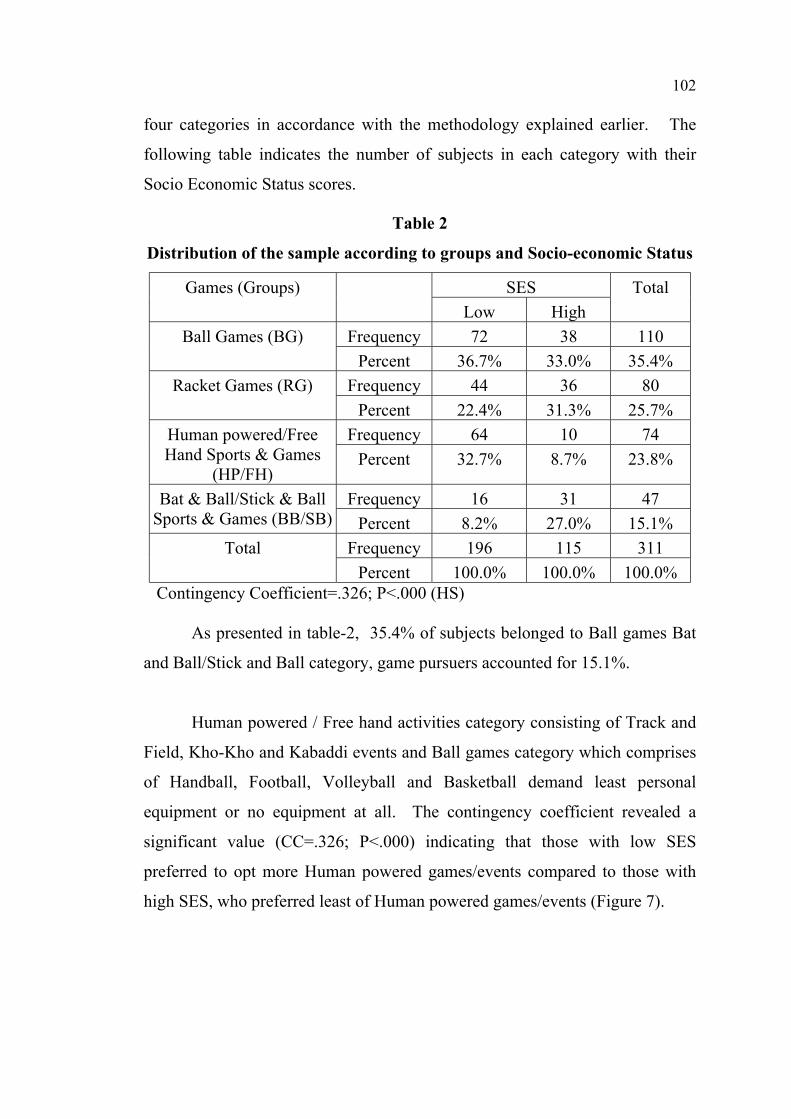
four categories in accordance with the methodology explained earlier. The
following table indicates the number of subjects in each category with their
Socio Economic Status scores.
Table 2
Distribution of the sample according to groups and Socio-economic Status
SES Games (Groups) Low High
Total
Frequency 72 38 110 Ball Games (BG) Percent 36.7% 33.0% 35.4%
Frequency 44 36 80 Racket Games (RG) Percent 22.4% 31.3% 25.7%
Frequency 64 10 74 Human powered/Free Hand Sports & Games
(HP/FH) Percent 32.7% 8.7% 23.8%
Frequency 16 31 47 Bat & Ball/Stick & Ball Sports & Games (BB/SB) Percent 8.2% 27.0% 15.1%
Frequency 196 115 311 Total Percent 100.0% 100.0% 100.0%
Contingency Coefficient=.326; P<.000 (HS)
As presented in table-2, 35.4% of subjects belonged to Ball games Bat
and Ball/Stick and Ball category, game pursuers accounted for 15.1%.
Human powered / Free hand activities category consisting of Track and
Field, Kho-Kho and Kabaddi events and Ball games category which comprises
of Handball, Football, Volleyball and Basketball demand least personal
equipment or no equipment at all. The contingency coefficient revealed a
significant value (CC=.326; P<.000) indicating that those with low SES
preferred to opt more Human powered games/events compared to those with
high SES, who preferred least of Human powered games/events (Figure 7).

103
0%
20%
40%
60%
80%
100%
Perc
enta
ge o
f su
bjec
ts
BG RG HP/FH BB/SB
Groups
Low SES High SES
Illustration No.1
Distribution of the sample (%) according to groups (games) and SES
It was natural for the people of low Socio Economic Status to opt for
such activities where they would be required to invest less money on sports
gears/gadgets and equipment. On the other hand, Racket games such as
Badminton, Tennis, Ball Badminton, Table Tennis, and Bat and Ball/ Stick and
Ball games such as Cricket and Hockey demand moderate to expensive sports
gears besides the sports persons had to possess one or several personal
equipment which could be met by the subjects whose Socio Economic Status
was high. A cursory glance of Table-2 suggests that inexpensive sporting
events were preferred by more number of subjects belonging to low Socio
Economic Status and expensive sporting events were preferred by more
number of subjects belonging to high Socio Economic Status, which fact
corroborates with the study of P.Krishnaiah (1988), Vaidya (1986) and S.K.
Gupta (1986). Thus it became evident that Socio Economic Status and choice
of sporting event were related.

104
Table 3
Descriptive statistics for Socio-economic status of the sample
Variable Mean S.D Mode Minimum (0) Maximum(100)
Socio-economic status
43.25 4.05 42.78 33.96 56.43
From Table-3 it was observed that the mean SES scores of the selected
sample was found to be 43.25 with standard deviation of 4.05. The mode of
the sample in SES score was 42.78. The lowest SES score was found to be
33.96 and highest was 56.43. The SES score of the sample was slightly below
50%, which indicates that the SES score of the study group was moderate.
b. Physical Fitness variables
To find out the physical fitness level of the subjects various subtests
were given to them. The detailed descriptive analysis of each of the subtests
and total physical fitness score were presented below.
Table 4
Descriptive statistics for Physical Fitness variables
Variable Mean S.D Mode Minimum Maximum
Weight (in Kgs) 61.92 8.39 65 42 110 Flexibility (in inches) 6.46 5.35 7.00 -20 18 12 min Walk & Run (in meters)
2592.28 311.32 2450.00 1440 3750
Burpee (Squat thrust) (in total numbers)
48.28 11.62 40.00 20 87
Standing Vertical arm thrust test (weight in kgs)
45.74 8.58 45.00 25 95
Bench squat test (weight kgs)
88.80 14.27 80.00 10 125
Total Physical fitness (max 100)
55.04 9.98 57.45 16.09 76.4
Weight: The mean weight of the selected sample was 61.92 kgs with
standard deviation of 8.39. The mode of this variable was 65. The weight of
the selected sample ranged from 42 to 110 kilograms.

105
Flexibility: The mean flexibility value of the selected sample was found
to be 6.46 inches and standard deviation was 5.35. The mode value of
flexibility was 7. The flexibility of the selected sample ranged from -20 to +18
inches.
12 minutes walk and run test: The mean distance in meters for the 12
minutes walk and run test of the selected sample was found to be 2592.28
meters with standard deviation was 311.32. The mode value was 2450. The
total distance covered by the selected sample ranged from 1440 to 3750 meters.
Burpee (Squat thrust) test: The selected sample had a mean burpee
value of 48.28 with standard deviation of 11.62. The mode value of burpee
was 40. The number of burpees performed by the selected sample ranged from
20 to 87.
Standing Vertical arm thrust test: The selected sample had a mean
standing vertical arm thrust value of 45.74 kilograms with standard deviation of
8.58. The mode value was 45. The performance in standing vertical arm thrust
of the selected sample ranged from 25 to 95 kilograms.
Bench squat test: The mean value of bench squat test of the selected
sample was found to be 88.80 kilograms and standard deviation was 14.27.
The mode value of bench squat was 80. The performance in bench squat of the
selected sample ranged from 20 to 125 kilograms.
Total physical fitness: The selected sample had a mean total physical
fitness value of 55.04 with standard deviation of 9.98. The mode value was
57.45. The physical fitness scores of the selected sports persons ranged from
16.09 to 76.04. The total physical fitness value of the sample was 55.04
percent out of 100, which indicates that the sample had slightly higher
moderate physical fitness.

106
c. General Health Status (Dimensions of symptomatology)
Table 5
Descriptive statistics for total and sub scales of General Health Status
Variable Mean S.D Mode Minimum Maximum
Somatic symptoms 3.75 2.98 4 0 15
Anxiety/Insomnia 4.23 3.42 3 0 17
Social dysfunction 4.76 2.70 3 0 15
Severe depression 4.30 3.29 4 0 16
Total GHQ 17.05 9.53 19 0 49
Somatic symptoms: The mean somatic symptoms scores of the sample
was found to be 3.75 with the standard deviation of 2.98. This indicates that
the sample had very less negative somatic symptoms. The mode was 4 and
scores ranged from 0 to 15. The score was very less in this dimension
indicating that the sample had least somatic symptoms, which clearly reveals
that group had minimum physical complaints.
Anxiety/Insomnia: The mean anxiety/insomnia scores of the sample
was found to be 4.23 with the standard deviation of 3.42. This indicates that
the sample had very less anxiety and insomnia symptoms. The mode was 3
and scores ranged from 0 to 17. Even in this dimension, the group had least
score, further indicating that group had minimum anxiety and insomnia (lack of
sleep) symptoms.
Social dysfunction: The selected sample had the mean social
dysfunction score of 4.76 with the standard deviation of 2.70. This indicates
lower social dysfunction of the sample in this dimension. The mode was 3 and
scores ranged from 0 to 16. In social dysfunction, the study sample had least
scores as much as 2.70, where study sample showed very good in social
functioning.

107
Severe depression: The mean scores in this dimension was found to be
4.30 with the standard deviation of 3.29. This indicates that the sample had
very less severe depression symptoms. The mode was 4 and scores ranged
from 0 to 16. As in the cases of other dimensions, in this dimension also the
study group had least severe depression scores, indicating further that the group
had almost no severe depression symptoms, showing very good health status.
Total GHQ scores: The selected sample had the mean total GHQ score
of 17.05 with the standard deviation of 9.53. This indicates better health status
of the sample in all the dimensions of symptomatology. The mode was 19 and
scores ranged from 0 to 49. In other words, the group had very good health
status, having totally symptom free which could be an added factor for physical
fitness.
d. Sports performance
Table 6
Descriptive statistics for sports performance
Variable Mean S.D Mode Minimum Maximum
Sports performance
118.98 11.71 112 92 146
The mean value of sports performance of the selected sample was found
to be 118.98 with standard deviation of 11.71. The mode of the sample was
112. The lowest performance score was 92 and highest was 146 out of 156. A
performance score of 118.98 out of 156 indicates 76.23 percent out of 100,
which is above 75 percentiles, where one can definitely say that the sample
selection after initial screening was a true representation of the universe, where
the sample represents best selection from each college.

108
e. Proneness to disorders
The descriptive statistics for various subscales of Proneness to disorders
for selected sample were given below.
Table 7 Descriptive statistics for Proneness to Disorders
Variable Mean S.D Mode Minimum Maximum Cancer proneness 5.40 1.89 6.00 0 10
CHD proneness 5.72 1.93 6.00 0 10
Psychopathic proneness
5.72 1.92 6.00 1 10
Healthy personality 11.88 2.96 13.00 2 19
Depression proneness
6.61 1.83 6.00 1 10
Addiction proneness
4.99 1.84 4.00 0 10
Cancer proneness: The mean cancer proneness scores of the sample
was found to be 5.40 with the standard deviation of 1.89. This indicates
moderate proneness of the sample in this dimension. The sample is not easily
prone to cancer diseases, as the stress level they may experience is moderate.
The mode was 6 and scores ranged from 0 to 10.
CHD proneness: The mean CHD proneness scores of the sample was
found to be 5.72 with the standard deviation of 1.93. This indicates moderate
proneness of the sample in this dimension. Again in this factor the sample
showed average signs of proneness to CHD, which is really a good feature of
the sample. The mode was 6 and scores ranged from 0 to 10.
Psychopathic behaviour proneness: The selected sample had the mean
psychopathic behaviour proneness score of 5.72 with the standard deviation of
1.92. This indicates moderate proneness of the sample in this dimension. Too
much of psychopathic proneness leads to destructive mentality, which was
absent in the study sample. The mode was 6 and scores ranged from 0 to 10.

109
Healthy personality: The sample had mean healthy personality scores
of 11.88 with the standard deviation of 2.96. This indicates that the sample had
moderate healthy personality. The mode was 13 and scores ranged from 2 to
19. The healthy personality always leads to better adjustment to self and the
surroundings, where a Sportsperson maintains such healthy personality can
perform better in his events.
Depression proneness: The selected sample had the mean depression
proneness score of 6.61 with the standard deviation of 1.83. This indicates
slightly higher proneness of the sample in this dimension. The mode was 6 and
scores ranged from 1 to 10. But this is different from severe depression (GHQ)
where in this scale only proneness could be evaluated, not the actual one. The
fear of failure, under performance, not being able to get in to the creamy layer
etc could be attributed for such proneness to depression.
Addiction proneness: The mean addiction proneness scores of the
sample were found to be 4.49 with the standard deviation of 1.84. This
indicates that the sample had moderate addiction proneness. The mode was 4
and scores ranged from 0 to 10. The higher the negative symptoms more
would be the addiction as negative symptoms lead to addiction process.
However, present group showed moderate levels of addiction proneness, which
could be simply situational.
110
Section –II Relationship between Socio-economic Status and other study
variables a) SES and Physical Fitness.
Hypothesis: There is no relationship between SES and Physical Fitness of
Sports students.
To test the above hypothesis, the significance of Pearson product
moment correlation coefficient was calculated for SES and Physical fitness and
presented in table 8.
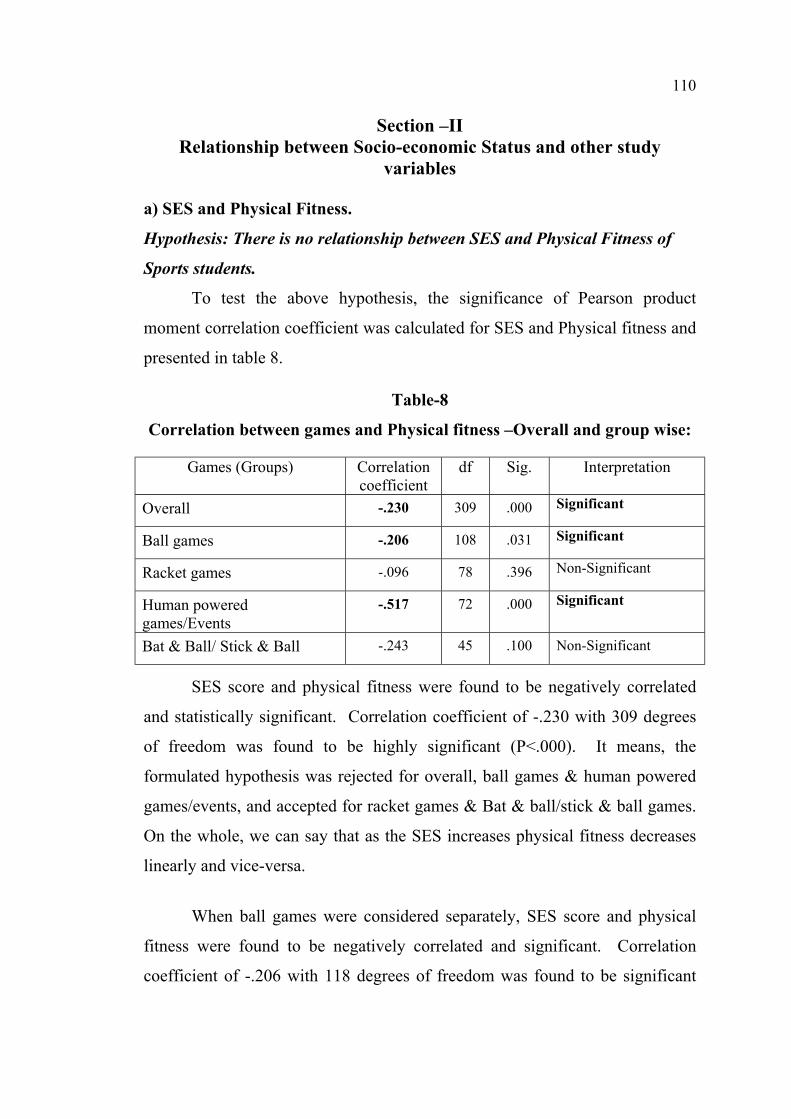
Table-8
Correlation between games and Physical fitness –Overall and group wise:
SES score and physical fitness were found to be negatively correlated
and statistically significant. Correlation coefficient of -.230 with 309 degrees
of freedom was found to be highly significant (P<.000). It means, the
formulated hypothesis was rejected for overall, ball games & human powered
games/events, and accepted for racket games & Bat & ball/stick & ball games.
On the whole, we can say that as the SES increases physical fitness decreases
linearly and vice-versa.
When ball games were considered separately, SES score and physical
fitness were found to be negatively correlated and significant. Correlation
coefficient of -.206 with 118 degrees of freedom was found to be significant
Games (Groups) Correlation coefficient
df Sig. Interpretation
Overall -.230 309 .000 Significant
Ball games -.206 108 .031 Significant
Racket games -.096 78 .396 Non-Significant
Human powered games/Events
-.517 72 .000 Significant
Bat & Ball/ Stick & Ball -.243 45 .100 Non-Significant

111
(P<.031). In other words, we can say that as the SES increases physical fitness
decreases linearly and vice-versa.
SES score and physical fitness (of racket games group) were found to be
not related and independent of each other as the obtained correlation coefficient
failed to reach the significance level criterion.
When human powered games and events were considered separately, the
SES and physical fitness were found to be correlated significantly and
negatively. In other words, as the SES score level increases physical fitness
decreases linearly and vice-versa.
When bat/ball and stick/ball games were considered separately, SES and
physical fitness were found to be independent of each other. No statistical
significance was found between these two variables.
The life style of people belonging to high Socio Economic Status was
characterized by use of motor vehicles, increased use of electrical and
electronic appliances, passive recreational pursuits, people to do strenuous
activities, which substantially jeopardize development and maintenance of
physical fitness. On the other hand people of low Socio Economic Status by
and large depend on their physical prowesses to perform household chores,
commute short and moderately short distances on foot, employ less varieties of
electrical and electronic gadgets, prefer active modes of recreation. PRISTA
and MARUQES who concluded physical activity was more intense among
underprivileged students due to domestic activities and walking time per day,
support the finding of the present study that higher the Socio Economic Status
lower the physical fitness and lower the Socio Economic Status, higher was the
physical fitness.

112
The phenomenon was due to the reluctant attitude of high Socio
Economic Status subjects to pursue sports seriously. Since the subjects
belonging to low Socio Economic Status group tend to take part in the training
programme seriously in pursuit of career opportunities their physical fitness
level was better compared to the subjects of high Socio Economic Status.
Under the Racket games the activities included were Ball Badminton,
Badminton (shuttle), Tennis and Table Tennis. As, in the intercollegiate level
the players of these games depend more on their skills and strategies than
physical fitness, no significant relationship was observed between SES and
physical fitness.
Track and field sports, Kabaddi and Kho-Kho - the indigenous games of
India – though encompass varieties of skills, their acquisition and application to
acquit well in serious contests depends upon the physical prowesses of the
sportspersons. It is logical then that human powered game’s sportspersons
possess a reasonably high level of physical fitness. When the association of
physical fitness of these students with SES was investigated, the variables were
found to be related significantly, but negatively, which may be noted. The
phenomenon that higher the SES, lower the physical fitness and vice versa may
be attributed to achievement motivation and perseverance which were seen in
good measure among the sports persons of low SES.
The games Cricket and Hockey were included under the Bat and Ball /
Stick and Ball games. The subjects’ economic status was not related to
physical fitness. A cursory glance of Table-8 indicates that about 66% of these
subjects hail from high Socio-economic group and 34% belong to low SES
group. The high SES of majority of the subjects and increased dependence on
skills and strategies in these games may be the reason behind this phenomenon.

113
Toddomico(1982), Dennis(1981), Parks (1980), Grewal (1986),
Ekblom(2005), Prista and Marques (1998) and Sack and Thiel (1979) in their
studies stated that SES yield greater influence on the involvement of individual
selection of physical activity and their physical fitness.
b. SES and Dimensions of Symptomatology (General Health Status)
Hypothesis: There is no relationship between SES and Dimensions of
Symptomatology (General health Status) of sports students.
To test the above hypothesis the significance of Pearson’s product
moment correlation coefficient was calculated for SES and dimensions of
Symptomatology (General health Status) of sports students of University of
Mysore were presented in Table-9.
When Socio-economic status (SES score) was correlated with subscales
and total dimensions of symptomatalogy, it was found that SES was found to
be negatively correlated and statistically significant with all of the subscales,
except for social dysfunction. As the SES score level increases somatic
symptoms, anxiety/insomnia, severe depression and total score decreases
linearly and vice-versa. In other words higher SES score leads to better health
status. From table-9 it is revealed that the formulated hypothesis was rejected.
It means that there is a significant relationship between SES and GHS of
students of University of Mysore. Sub-scales of GHS is also significantly
related with SES except social dysfunction.
When only ball games were considered, all the dimensions of general
health questionnaire including total scores were not significantly related to SES
as all the obtained correlation coefficients were found to be non-significant.
Hence, the hypothesis formulated for the above is accepted.

114
Table 9.
Correlation coefficients between Symptomatology of GHQ with SES: Overall and group-wise
Groups
Overall Ball Games Racket games Human Powered/Events
Bat & Ball / Stick & Ball
Symptomatology (GHQ)
Cor Sig Cor Sig Cor Sig Cor Sig Cor Sig Somatic symptoms.
-.183 .001 (S) -.067 .487 (NS) -.255 .023 (S) -.077 .516 (NS) .044 .770 (NS)
Anxiety/Insomnia -.119 .001 (S) -.029 .764 (NS) -.133 .240 (NS) .070 .556 (NS) -.184 .216 (NS)
Social dysfunction -.091 .110 (NS) -.111 .248 (NS) -.041 .719 (NS) .067 .570 (NS) -.115 .440 (NS)
Severe depression -.248 .000 (S) -.082 .395 (NS) -.497 .000 (S) .017 .885 (NS) -.086 .567 (NS)
Total GHQ -.211 .000 (S) -.083 .387 (NS) -.323 .003 (S) -.024 .839 (NS) -.116 .437 (NS)
Degrees of freedom
309 118 78 72 45
Note: S-Significant:: NS-Non-significant:: Cor- Correlation coefficient:: Sig- Significance (P)

115
Except for anxiety/insomnia and social dysfunction, all other factors
including total GHQ score were found to be significant and negatively related.
As the SES levels increased somatic symptoms, severe depression and total
scores decreased linearly and vice-versa. In other words higher SES leads to
better health status in the above-mentioned dimensions. However,
anxiety/insomnia and social dysfunction were found to be independent of SES.
From the Table-9 it is revealed that the formulated hypothesis was rejected. It
means that there is a significant relationship between SES and general health
status of students of University of Mysore. Sub scales GHS were also
significantly related with SES except social dysfunction. Hypothesis
formulated in this regard is accepted for anxiety/insomnia & social
dysfunction, and rejected for the rest of the dimensions.
All the dimensions of general health questionnaire including total scores
were not significantly correlated to SES scores as all the obtained correlation
coefficients were found to be not significant when only Ball games were
considered. The hypothesis is accepted for the dimensions of general health
questionnaire.
All the dimensions of general health questionnaire including total scores
were not significantly correlated to SES score as all the obtained correlation
coefficients were found to be not significant, when only human powered games
were considered. The hypothesis is accepted for the dimensions of general
health questionnaire.
All the dimensions of general health questionnaire including total scores
were not significantly related to SES as all the obtained correlation coefficients
were found to be not significant, when only Bat and ball/ stick and ball games
were considered. The hypothesis is accepted for the dimensions of general
health questionnaire.

116
Persons of high Socio Economic Status were likely to be stable and
hence did not show much of somatic symptoms and anxiety, did not confront
high degree of insomnia and depression. Hence, the study suggests that high
Socio Economic Status group enjoyed better general health status as compared
to low Socio Economic Status group of sports persons. It may be noted that
general health questionnaire helped to know how the subjects felt about their
health, and it did not make a comprehensive assessment of health of the
subjects. Waltham’s study had indicated that social conditions lead to
depriving children of material care that leads to low central nervous system
serotonin function, which underlines depression and hostility, which contribute
to ill health. It would be hazardous then to conclude Socio Economic Status
and overall health status (when estimated with the help of GHQ) were
positively correlated.
Bucher (1974), Koebel Swank and Shelburne (1992), William and
Curtis (1990), Spink (2003), Spreitzer E (1992), Adegoke (1986) and Brekke
(1986) suggest that fitness for effective living implies freedom from diseases
enough strength agility and skill to meet the demands of daily living. They
found a positive relationship between levels of physical activity and effect of
SES on feeling of well being.
c) SES and Sports performance
Hypothesis: There is no relationship between SES and Sports performance of
sports students.
To test the above hypothesis the significance of Pearson’s product
moment correlation coefficient was calculated for SES and Sports performance
of sports students of University of Mysore, and the same were presented in
Table-10.

117
Table-10 Correlation coefficients between SES games and Sports
performance – Overall and group wise Games Correlation
coefficient Df Significance Interpretation
Overall .130 309 .022 Significant
Ball games .043 118 .655 Non-Significant
Racket games .160 78 .155 Non-Significant
Human powered games/Events
.326 72 .000 Significant
Bat & Ball/ Stick & Ball .161 45 .279 Non-Significant
SES score and sports performance were found to be positively correlated
and statistically significant. Correlation coefficient of .130 with 309 degrees of
freedom was found to be significant (P<.022). The formulated hypothesis was
rejected as the product moment correlation coefficient between SES and sports
performance is 0.130, which is significant at 0.005 level. It means there is a
significant relationship between SES and sports performance of students of
University of Mysore. In other words, we can say that as the SES score
increases sports performance also increases linearly. The hypothesis
formulated for the above is rejected for overall and Human powered
games/events and accepted for rest of the factors. A careful observation further
reveled that the overall relationship between SES and sports performance was
contributed maximum by human powered games/events.
Sports performance and SES score were found to be not related and
independent of each other as the obtained correlation coefficient failed to reach
the significance level criterion, in case of Ball games, Racket games and Bat
and Ball or Stick and Ball games.
The relationship between SES and Sports performance, in case of
Human powered games/events were found to be positively correlated and
statistically significant as correlation coefficient of -0.326 with 72 degrees of
freedom was found to be significant. (P<.841).

118
Sports performance was dependent upon a number of factors such as
indulgence in a coaching regimen, availability of a competent coach and
trainer, nutritious food, availability of necessary gadgets or equipment and
competition experience. However, importance of possession of appropriate
level of physical fitness, proficiency over skills, adaptability, favourable
attitude towards training and competition, discipline and psychological
depositions were of no less importance. Most of these were developed and
acquired with substantial spending of time, energy and money. Thus, the
finding, higher Socio Economic Status group students show better performance
in sports was justified.
Under the Ball games category, the games such as Handball, Football,
Volleyball and Basketball were included. For the pursuance of these games,
there was hardly any financial constraint on the part of students at the
collegiate level, since the colleges or University provided almost every
equipment. Even training and coaching were freely available in the University
of Mysore. It may be due to these reasons no significant relationship was
obtained between Socio Economic Status and sports performance in ball games
category.
Although Racket games demand a host of supplies and the players have to
incur substantial amount of money to procure the needed materials and expend on
travel and avail the services of trainers, which the well-to-do can only afford, in
the present study no significant relationship was observed between sports
performance and SES among Racket game players category. Analysis of
situations suggests that professional sport coaching has not crept in a big way at
the area chosen for the study. University and the colleges were also standing by
the side of the subjects by providing equipment, and facilities were mostly
provided free of charges. These benefits had to arrive at the conclusion that ‘SES
and sports performance were found to be not related and independent of each
other’ despite a couple of earlier studies suggested otherwise.

119
The argument put forth about the non-significant relationship between
physical fitness and SES was vindicated on observing the relationship between
SES and sports performance. It evidently proves that Bat and Ball / Stick and
Ball games of this study were related more with skill and strategy.
Singh (1984), pate (1984), Johnson and Buskirk (1974), Schoolarnder
(2003), Grupe’s (1972), Sidentop (1984), Sharma (1984) and Singh (2003)
were of the different views that it was not physical, physiological,
environmental and socio-economic factors alone that influence sports
performance. Psychological factors were also playing dominant role besides
physique, body composition, technique and tactics level of motor and physical
abilities, personality make up of a sportsmen etc, which influence sports
performance.
d) SES and Proneness to disorders
Hypothesis: There is no relationship between SES and Proneness to
disorders of sports students.
To test the above hypothesis the significance of Pearson’s product
moment correlation coefficient was calculated for SES and Proneness to
disorders of sports students of University of Mysore and the same were
presented in Table-11.

120
Table 11
Correlation coefficients between SES and Proneness to Disorders –Overall and Group-wise
Groups
Overall Ball Games Racket games Human Powered/Events
Bat & Ball / Stick & Ball Proneness
Cor Sig Cor Sig Cor Sig Cor Sig Cor Sig Cancer proneness -.087 .125
(NS) .061 .526
(NS) -.113 .319
(NS) -.179 .127
(NS) -.119 .425
(NS) CHD proneness -.069 .225
(NS) -.124 .198
(NS) -.037 .743
(NS) .055 .640
(NS) -.131 .380
(NS) Psychopathic proneness
-.071 .211 (NS)
-.023 .815 (NS)
-.193 .086 (NS)
-.112 .341 (NS)
.028 .850 (NS)
Healthy personality -.027 .635 (NS)
-.014 .884 (NS)
-.065 .570 (NS)
.059 .615 (NS)
-.063 .675 (NS)
Depression proneness -.064 .264 (NS)
.029 .766 (NS)
-.167 .138 (NS)
.170 147 (NS)
-.239 .105 (NS)
Addiction proneness -.150 .008 (S) .040 .681 (NS)
-.313 .005 (S) -.119 .311 (NS)
-.117 .433 (NS)
Degrees of freedom 309 118 78 72 45
Note: S-Significant: NS-Non-significant: Cor-Correlation coefficient : Sig- Significance (P)

121
Socio-economic status (SES) was found to be negatively correlated with
addiction proneness (r=-.150; P<.008) and rest of the proneness subscales were
found to be independent of SES. As the SES increases addiction proneness
decreases and vice versa. The formulated hypothesis was rejected with
reference SES and overall groups and racket games group. On the whole, since
most of relationships were found to be non-significant, the hypothesis
formulated for proneness to disorders is accepted.
The Ball games chosen for the study call upon the players to perform
under substantial amount of physical strain. Since active involvement in
strenuous physical activity fosters health, the subjects of Ball games category
enjoyed good health. This may be the reason behind Socio Economic Status
not showing significant relationship with proneness to disorders in this
category.
Socio-economic status (SES) was found to be negatively correlated with
addiction proneness (r=-.313; P<.005) and rest of the proneness subscales were
found to be independent of SES. As the SES increased addiction proneness
decreased linearly and vice versa. Even though there was negative
directionality in the correlation coefficients, they failed to reach the
significance level criterion.
All the subscales of proneness to disorders were not significantly related
to SES as all the obtained correlation coefficients were found to be non-
significant, when only ball games, Human powered games, Bat & Ball/Stick &
Ball games are considered separately.
Solomna (1984), WHO (2004), Ader and Cohen (1975), Sklar and
Anishman (1981), Gilmore (1983), Dun et.al. (2001), Porch and Schullen

122
(1998) and Tuinstra et.al (1998) studies strongly revealed that there was varied
relations-ship between SES and health risk behaviours. Analysis indicated that
the relationship between SES and health risk behaviour is not as linear as is
often found in adulthood. Overall there was an absence in relationship SES
and health risk behaviour. The only exception applies to sports which is
linearly related to SES.

123
Section-III
Influence of Socio-economic Status and type of
games on selected variables
In this section results of 2-way ANOVA for various parameters taking
SES and type of games as Independent variables are presented to find out effect
of SES (low and High) and type of games (ball games, racket games, Human
Powered/ Free hand and Bat & Ball and Stick & Ball) on parameters selected
along with the interaction effects.
a) Physical fitness
Hypothesis : There is no significant interaction between SES and games on
physical fitness of sports students.
Table 12 Mean scores of physical fitness for sports students playing different
games having different SES Games (Groups)
SES Ball Racket
Human Powered / Free hand
Bat & Ball Stick &
Ball
Overall
Mean S.D Mean S.D Mean S.D Mean S.D Mean S.D Low 57.07 8.76 46.98 10.50 60.87 6.86 56.46 7.31 55.83 9.67
High 57.86 8.52 44.58 7.74 61.53 6.85 55.21 6.74 53.68 10.39
Total 57.26 8.67 45.72 9.18 61.15 6.82 56.06 7.08 55.04 9.98

124
Table 13 ANOVA table for Mean scores of physical fitness of sports students
playing different games having different SES
Source of variation Sum of Squares Df Mean Square F value P value
Between Games (A) 10077.557 3 3359.186 49.900 .000
Between SES (B) 19.127 1 19.127 0.284 .594
Interaction (A x B) 135.361 3 45.120 0.670 .571
Error 20397.493 303 67.318
Total 972837.183 311
Corrected Total 30856.592 310
A significant difference existed in the mean physical fitness scores of
subjects playing different games (F=49.90; P<.000). Further mean values
revealed that those who were playing human powered/free hand games had
significantly higher physical fitness compared to other subjects playing ball
games, bat and ball/ stick and ball and those subjects who were playing racket
games had significantly lesser physical fitness, which is clearly depicted in
figure 8. However, students belonging to low and high SES did not differ
significantly in their physical fitness scores. The interaction effect between
games and SES levels was also found to be non-significant. Hence the
formulated hypothesis is accepted. There is no significant interaction between
SES and games on physical fitness of sports students.

125
Note: BG-Ball games: RG-racket games: HP/FH-Human powered/Freehand: BB/SB-Bat/ball & Stick/Ball
Illustration No.2 Mean scores of physical fitness of sports students playing different games having different SES
35
40
45
50
55
60
65
Mea
n Ph
ysic
al fi
tnes
s sc
ores
BG RG HP/FH BB/SB TotalGames
Low-SES High-SES Total

126 b) Dimensions of symptomatology (General Health Status)
Hypothesis :There is no significant interaction between SES and games on
Somatic Symptoms (GHS) of Sports students.
Table 14
Mean scores of Somatic Symptoms (GHS) for sports students playing Different games having different SES
Games (Groups)
Ball Racket Human
Powered/ Free hand
Bat & Ball Stick & Ball
Overall SES
Mean S.D Mean S.D Mean S.D Mean S.D Mean S.D Low 4.06 3.28 3.18 2.16 5.20 2.94 2.31 2.09 4.09 2.99
High 3.76 3.22 2.39 2.52 4.60 2.17 2.90 2.81 3.17 2.88
Total 3.95 3.25 2.82 2.35 5.12 2.85 2.70 2.58 3.75 2.98
Table 15 ANOVA table for Mean scores of Somatic Symptoms (GHS) of sports
students playing different games having different SES
Source of variation Sum of Squares Df Mean Square F value P value
Between Games (A) 2680.336 3 52.859 6.509 .000
Between SES (B) 4.002 1 4.002 .493 .483
Interaction (A x B) 13.858 3 4.619 .569 .636
Error 2460.654 303 8.121
Total 7125.000 311
Corrected Total 2745.936 310
A significant difference existed in the mean somatic symptoms scores of
subjects playing different games (F=6.509; P<.000). Further mean values
revealed that those who were playing human powered/free Hand Games had
significantly higher somatic symptom scores compared to other subjects

127
playing ball games, and racket games and lastly subjects playing bat and ball/
Stick and Ball Games had significantly lesser somatic symptom scores, which
is clearly depicted in figure 9. However, students belonging to low and high
SES did not differ significantly in their somatic symptom scores. The
interaction effect between games and SES levels was also found to be non-
significant. Hence the formulated hypothesis is accepted. There is no
significant interaction between SES and games on Somatic Symptoms (GHS)
of Sports students.
Note: BG-Ball games: RG-racket games: HP/FH-Human powered/Freehand: BB/SB-Bat/ball & Stick/Ball
Illustation No.3 Mean scores of Somatic Symptoms (GHS) of sports students playing
different games having different SES.
1
2
3
4
5
6
Mea
n So
mat
ic
scor
es
BG RG HP/FH BB/SB TotalGames
Low-SES High-SES Total

128
Hypothesis :There is no significant interaction between SES and games on
Social dysfunction (GHS) of Sports students
Table 16
Mean scores of social dysfunction (GHS) for sports students playing different games having different SES
Games (Groups)
Ball Racket Human
Powered/ Free hand
Bat & Ball Stick & Ball
Overall SES
Mean S.D Mean S.D Mean S.D Mean S.D Mean S.D Low 4.89 2.72 4.34 2.22 5.37 2.71 4.38 1.86 4.88 2.57 High 4.18 2.39 4.58 3.02 6.20 4.21 4.42 2.86 4.55 2.91 Total 4.65 2.63 4.45 2.59 5.49 2.93 4.40 2.54 4.76 2.70
Table 17
ANOVA table for Mean scores of Social dysfunction (GHS) of sports students playing different games having different SES
Source of variation Sum of Squares Df Mean Square F value P value
Between Games (A) 51.512 3 17.171 2.379 .070
Between SES (B) 0.550 1 0.550 0.076 .783
Interaction (A x B) 19.011 3 6.337 0.878 .453
Error 2187.356 303 7.219
Total 9304.000 311
Corrected Total 2260.913 310
Neither the subjects playing different games nor the subjects belonging
to different SES levels differ significantly in their mean social dysfunction
scores. Even the interaction effect between games and SES was found to be
significant indicating that pattern of social dysfunction scores was same for
subjects with different SES levels irrespective of the game they play. Hence,
the formulated hypothesis is accepted that there is no significant interaction
between SES and games on Social dysfunction.

129
Hypothesis: There is no significant interaction between SES and games on Anxiety/Insomnia (GHS) for Sports students.
Table 18
Mean scores of Anxiety/insomnia (GHS) scores for sports students playing different games having different SES
Games (Groups)
Ball Racket Human Powered/ Free hand
Bat & Ball Stick & Ball
Overall SES
Mean S.D Mean S.D Mean S.D Mean S.D Mean S.D Low 4.33 3.46 4.25 3.41 4.86 3.40 3.88 2.96 4.45 3.38
High 4.76 4.74 3.36 2.57 4.10 2.73 3.26 2.50 3.86 3.47
Total 4.48 3.94 3.85 3.07 4.76 3.31 3.47 2.65 4.23 3.42
Table 19 ANOVA table for Mean scores of Anxiety/Insomnia (GHS) for sports
students playing different games having different SES
Source of variation Sum of Squares Df Mean Square F value P value
Between Games (A) 43.304 3 14.435 1.238 .296
Between SES (B) 11.188 1 11.188 0.960 .328
Interaction (A x B) 22.989 3 7.663 0.657 .579
Error 3531.744 303 11.656
Total 9196.000 311
Corrected Total 3627.331 310
In all the individual factors as well as interaction factors, the obtained F
values failed to reach significance levels. In other words, subjects playing
different games did not differ significantly in their mean anxiety/insomnia
scores as well as subjects with different SES levels. Also, the interaction effect
between games and SES was found to be non-significant indicating that pattern
of anxiety/insomnia scores was same for subjects with different SES levels

130
irrespective of the game they play. Hence the formulated hypothesis is accepted
that there is no significant interaction between SES and games on
Anxiety/Insomnia of sports students.
Hypothesis: There is no significant interaction between SES and games
on Severe Depression (GHS) for Sports students.
Table 20 Mean scores of Severe depression (GHS) for sports students playing
different games having different SES
Games (Groups)
Ball Racket Human
Powered/ Free hand
Bat & Ball Stick & Ball
Overall SES
Mean S.D Mean S.D Mean S.D Mean S.D Mean S.D Low 4.47 3.01 5.14 2.95 5.67 3.14 3.13 2.00 4.90 3.04
High 4.26 3.73 2.08 2.82 4.90 2.85 2.94 3.59 3.28 3.47
Total 4.40 3.26 3.76 3.26 5.57 3.10 3.00 3.11 4.30 3.29
Table 21
ANOVA table for Mean scores of Severe Depression (GHS) for sports students playing different games having different SES
Source of variation Sum of Squares Df Mean Square F value P value
Between Games (A) 122.078 3 40.693 4.177 .006
Between SES (B) 59.244 1 59.244 6.081 .014
Interaction (A x B) 104.688 3 34.896 3.582 .014
Error 2951.875 303 9.742
Total 9122.000 311
Corrected Total 3365.588 310
Subjects playing different games differed significantly in their mean severe
depression scores (F=4.177; P<.006). Further, mean values revealed that those who
were playing human powered/free Hand Games had significantly higher severe
depression scores compared to other subjects playing ball games, and racket games

131
and lastly subjects playing bat and ball/ stick and ball had significantly lesser severe
depression scores, which is clearly depicted in figure 10. Students belonging to low
SES had significantly (F=6.081; P<.014) higher severe depression scores compared to
students with high SES. Also, the interaction effect between games and SES levels
was found to be significant (F=3.582; P<.014) where subjects with high SES playing
racket games had significantly lesser scores compared to subjects with low SES
involved in racket games, which is very much illustrated in the figure 10. Hence, the
formulated hypothesis is rejected. In other words, there is a significant interaction
between SES and games in severe depression.
Note: BG-Ball games: RG-racket games: HP/FH-Human powered/Freehand: BB/SB-
Bat/ball & Stick/Ball
Illustration No.4 Mean scores of Severe depression (GHS) for sports students playing
different games having different SES.
1
2
3
4
5
6
Mea
n Ps
y se
v sc
ores
BG RG HP/FH BB/SB TotalGames
Low-SES High-SES Total

132
Hypothesis: There is no significant interaction between SES and games on General Health (GHS total scores) of Sports students.
Table 22 Mean scores of GHS -total scores for sports students playing
different games having different SES
Games (Groups)
Ball Racket Human Powered/ Free hand
Bat & Ball Stick & Ball
Overall SES
Mean S.D Mean S.D Mean S.D Mean S.D Mean S.D Low 17.75 10.38 16.91 7.91 21.11 8.63 13.69 4.06 18.33 9.13 High 16.97 11.31 12.42 8.53 19.8 6.07 13.52 9.55 14.86 9.84 Total 17.48 10.67 14.89 8.45 20.93 8.31 13.57 8.06 17.05 9.53
Table 23
ANOVA table for Mean scores of GHS-total scores for sports students playing different games having different SES
Source of variation Sum of Squares Df Mean
Square F value P value
Between Games (A) 1228.783 3 409.594 4.840 .003
Between SES (B) 151.301 1 151.301 1.788 .182
Interaction (A x B) 199.027 3 66.342 0.784 .504
Error 25639.874 303 84.620
Total 118503.000 311
Corrected Total 28147.370 310
A significant difference existed in the mean total GHQ scores of
subjects playing different games (F=4.840; P<.003). Further, mean values
revealed that those who were playing human powered/free Hand Games had
significantly higher GHQ scores compared to other subjects playing ball
games, and racket games and bat and ball/ stick and ball games which is shown
in figure 11. However, students belonging to low and high SES did not differ

133
significantly in their total GHQ scores. The interaction effect between games
and SES levels was also found to be non-significant. Hence the formulated
hypothesis is accepted that there is no interaction effect between games and
SES levels on GHS of Sports students.
Note: BG-Ball games: RG-racket games: HP/FH-Human powered/Freehand: BB/SB-Bat/ball & Stick/Ball
Illustration No.5
Mean scores of GHS for sports students playing different games having different SES
8
12
16
20
24
Mea
n G
HQ
sco
res
BG RG HP/FH BB/SB TotalGames
Low-SES High-SES Total

134
Hypothesis : There is no significant interaction between SES and games on sports performance of sports students
Table 24
Mean scores of sports performance for sports students playing different
games having different SES
Games (Groups)
Ball Racket Human
Powered/ Free hand
Bat & Ball Stick & Ball
Overall SES
Mean S.D Mean S.D Mean S.D Mean S.D Mean S.D Low 120.68 11.72 120.47 10.46 117.02 11.18 114.00 9.72 118.77 11.27 High 120.12 11.63 121.74 10.34 115.09 8.61 114.47 10.13 118.57 10.52 Total 120.55 11.65 121.14 10.35 116.19 10.13 114.15 9.74 118.69 10.98
Table 25
ANOVA table for Mean scores of sports performance for sports students
playing different games having different SES
Source of variation Sum of Squares Df Mean Square F value P value
Between Games (A) 2004.130 3 668.043 5.782 .001
Between SES (B) 2.292 1 2.292 0.020 .888
Interaction (A x B) 104.202 3 34.734 0.301 .825
Error 35005.996 303 115.531
Total 4418894.000 311
Corrected Total 37403.981 310
Subjects playing different games differed significantly in their mean sports
performance scores (F=5.391; P<.001). Further mean values revealed that those who
were playing racket games and ball games had higher sports performance compared to
other subjects playing human powered/free hand games and those who were involved
in bat/ball and stick/ball games had significantly lesser sports performance, which is
clearly depicted in figure 12. Students belonging to high SES had significantly
(F=4.403; P<.037) higher sports performance scores compared to students with lower

135
SES. The interaction effect between games and SES was found to be non-significant.
Hence the formulated hypothesis is accepted that there is no significant interaction
between SES and Games on sports performance of sports students.
Note: BG-Ball games: RG-racket games: HP/FH-Human powered/Freehand: BB/SB-
Bat/ball & Stick/Ball
Illustration No.6 Mean scores of sports performance for sports students playing different
games having different SES
105
110
115
120
125
Mea
n Pe
rfor
man
ce
scor
es
BG RG HP/FH BB/SB TotalGames
Low-SES High-SES Total

136
Hypothesis : There is no significant interaction between SES and games on
Cancer proneness of sports students.
Table 26 Mean scores of Cancer Proneness for sports students playing different
games having different SES Games (Groups)
Ball Racket Human
Powered/ Free hand
Bat & Ball Stick & Ball
Overall SES
Mean S.D Mean S.D Mean S.D Mean S.D Mean S.D Low 5.29 1.94 5.50 1.96 5.56 1.78 4.94 2.54 5.40 1.94
High 5.71 1.61 5.44 1.89 5.00 1.41 5.06 2.05 5.39 1.81
Total 5.44 1.84 5.48 1.92 5.49 1.74 5.02 2.20 5.40 1.89
Table 27
ANOVA table for Mean scores of Cancer Proneness for sports students playing different games having different SES
Source of variation Sum of Squares Df Mean Square F value P value
Between Games (A) 8.533 3 2.844 0.788 .501
Between SES (B) 0.017 1 0.017 0.005 .945
Interaction (A x B) 6.806 3 2.269 0.629 .597
Error 1093.138 303 3.608
Total 10162.000 311
Corrected Total 1108.354 310
Neither the subjects playing different games nor the subjects belonging
to different SES levels differ significantly in their mean cancer proneness
scores. Even the interaction effect between games and SES was found to be
non-significant indicating that pattern of cancer proneness scores was same for
subjects with different SES levels irrespective of the game they play. Hence,
the formulated hypothesis is accepted. That means there is no significant
interaction between SES and games on Cancer Proneness of Sports students.
137
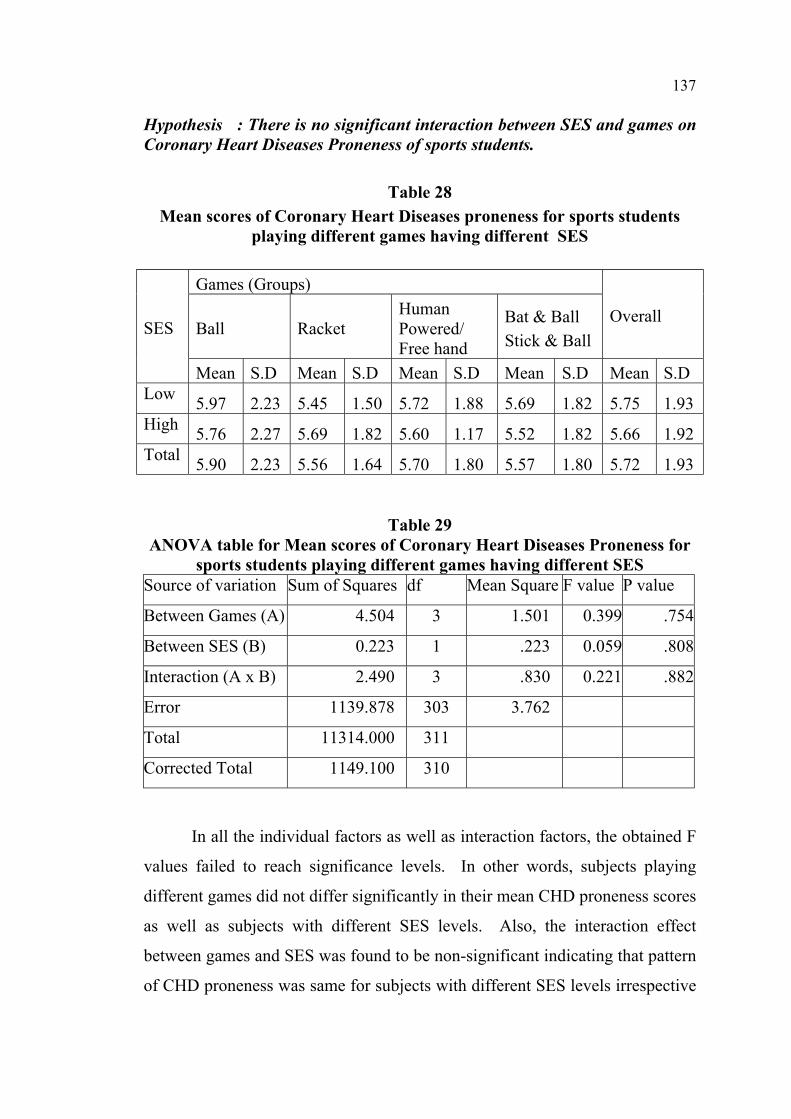
Hypothesis : There is no significant interaction between SES and games on Coronary Heart Diseases Proneness of sports students.
Table 28
Mean scores of Coronary Heart Diseases proneness for sports students playing different games having different SES
Games (Groups)
Ball Racket Human Powered/ Free hand
Bat & Ball Stick & Ball
Overall SES
Mean S.D Mean S.D Mean S.D Mean S.D Mean S.D Low 5.97 2.23 5.45 1.50 5.72 1.88 5.69 1.82 5.75 1.93 High 5.76 2.27 5.69 1.82 5.60 1.17 5.52 1.82 5.66 1.92 Total 5.90 2.23 5.56 1.64 5.70 1.80 5.57 1.80 5.72 1.93
Table 29 ANOVA table for Mean scores of Coronary Heart Diseases Proneness for
sports students playing different games having different SES Source of variation Sum of Squares df Mean Square F value P value
Between Games (A) 4.504 3 1.501 0.399 .754
Between SES (B) 0.223 1 .223 0.059 .808
Interaction (A x B) 2.490 3 .830 0.221 .882
Error 1139.878 303 3.762
Total 11314.000 311
Corrected Total 1149.100 310
In all the individual factors as well as interaction factors, the obtained F
values failed to reach significance levels. In other words, subjects playing
different games did not differ significantly in their mean CHD proneness scores
as well as subjects with different SES levels. Also, the interaction effect
between games and SES was found to be non-significant indicating that pattern
of CHD proneness was same for subjects with different SES levels irrespective

138
of the game they play. Hence, the formulated hypothesis is accepted. That
means there is no significant interaction between SES and Games on Coronary
Heart Diseases Proneness of sports students.
Hypothesis : There is no significant interaction between SES and games on Psychopathic Personality proneness of sports students.
Table 30 Mean scores of Psychopathic Personality Proneness for sports students
playing different games having different SES
Games (Groups)
Ball Racket Human
Powered/ Free hand
Bat & Ball Stick & Ball
Overall SES
Mean S.D Mean S.D Mean S.D Mean S.D Mean S.D Low 5.97 1.94 6.09 1.83 5.69 1.82 5.44 2.66 5.86 1.94 High 5.74 1.91 5.39 1.84 4.60 1.35 5.52 1.96 5.47 1.87 Total 5.89 1.93 5.77 1.86 5.54 1.80 5.49 2.20 5.72 1.92
Table 31
ANOVA table for Mean scores of Psychopathic Proneness for sports students playing different games having different SES
Source of variation Sum of Squares Df Mean Square F value P value
Between Games (A) 14.907 3 4.969 1.352 .258
Between SES (B) 12.581 1 12.581 3.424 .065
Interaction (A x B) 8.865 3 2.955 0.804 .492
Error 1113.334 303 3.674
Total 11308.000 311
Corrected Total 1143.100 310
Neither the subjects playing different games nor the subjects belonging
to different SES levels differ significantly in their mean psychopathic

139
personality scores. Even the interaction effect between games and SES was
found to be non-significant indicating that pattern of psychopathic personality
scores was same for subjects with different SES levels irrespective of the game
they play. Hence, the formulated hypothesis is accepted and there is no
significant interaction between SES and Games on Psychopathic Personality
Proneness of sports students.
Hypothesis : There is no significant interaction between SES and games on Healthy Personality of sports students.
Table 32 Mean scores Healthy Personality scores for sports students playing
different games having different SES. Games (Groups)
Ball Racket Human
Powered/ Free hand
Bat & Ball Stick & Ball
Overall SES
Mean S.D Mean S.D Mean S.D Mean S.D Mean S.D Low 11.72 3.11 11.73 2.30 12.28 2.98 12.00 3.48 11.93 2.93 High 11.66 3.66 11.44 2.94 11.80 2.35 12.35 2.42 11.79 3.02 Total 11.70 3.30 11.60 2.59 12.22 2.89 12.23 2.79 11.88 2.96
Table 33
ANOVA table for Mean scores of Healthy Personality for sports students playing different games having different SES
Source of variation Sum of Squares df Mean Square F value P value
Between Games (A) 12.799 3 4.266 0.482 .695
Between SES (B) 0.745 1 0.745 0.084 .772
Interaction (A x B) 4.110 3 1.370 0.155 .926
Error 2680.248 303 8.846
Total 46586.000 311
Corrected Total 2709.357 310

140
In all the individual factors as well as interaction factors, the obtained F
values failed to reach significance levels. In other words, subjects playing
different games did not differ significantly in their mean healthy personality
scores as well as subjects with different SES levels. Also, the interaction effect
between games and SES was found to be non-significant indicating that pattern
of healthy personality was same for subjects with different SES levels
irrespective of the game they play. Hence, the formulated hypothesis is
accepted and there is no significant interaction between SES and games on
Healthy Personality of sports students.
Hypothesis : There is no significant interaction between SES and games on
Depression proneness of sports students.
Table 34
Mean scores of Depression Proneness for sports students playing different games having different SES
Games (Groups)
Ball Racket Human
Powered/ Free hand
Bat & Ball Stick & Ball
Overall SES
Mean S.D Mean S.D Mean S.D Mean S.D Mean S.D Low 6.39 1.76 6.77 1.46 7.05 1.93 7.25 1.95 6.76 1.79 High 6.47 2.01 6.28 1.63 6.8 1.99 6.13 1.98 6.35 1.87 Total 6.42 1.84 6.55 1.55 7.01 1.93 6.51 2.02 6.61 1.83

141
Table 35 ANOVA table for Mean scores of Depression Proneness for sports students
playing different games having different SES Source of variation Sum of Squares df Mean Square F value P value
Between Games (A) 6.997 3 2.332 0.708 .548
Between SES (B) 10.499 1 10.499 3.186 .075
Interaction (A x B) 11.475 3 3.825 1.161 .325
Error 998.478 303 3.295
Total 14613.000 311
Corrected Total 1034.141 310
Neither the subjects playing different games nor the subjects belonging
to different SES levels differ significantly in their mean depression proneness
scores. Even the interaction effect between games and SES was found to be
non-significant indicating that pattern of depression proneness was same for
subjects with different SES levels irrespective of the game they play. Hence,
the formulated hypothesis is accepted and there is no significant interaction
between SES and Games on Depression Proneness of sports students.
Hypothesis : There is no significant interaction between SES and games on
Addiction proneness of sports students.
Table 36 Mean scores of Addiction proneness for sports students playing different
games having different SES Games (Groups)
Ball Racket Human
Powered/ Free hand
Bat & Ball Stick & Ball
Overall SES
Mean S.D Mean S.D Mean S.D Mean S.D Mean S.D Low 4.82 1.96 5.18 1.66 5.47 1.78 4.75 1.98 5.11 1.85 High 4.87 1.99 4.72 1.92 5.20 1.03 4.68 1.68 4.80 1.81 Total 4.84 1.96 4.97 1.79 5.43 1.70 4.70 1.77 4.99 1.84

142
Table 37 ANOVA table for Mean scores of Addiction Proneness for sports students
playing different games having different SES Source of variation Sum of Squares Df Mean Square F value P value
Between Games (A) 8.392 3 2.797 0.831 .478
Between SES (B) 1.878 1 1.878 0.558 .456
Interaction (A x B) 3.038 3 1.013 0.301 .825
Error 1020.074 303 3.367
Total 8801.000 311
Corrected Total 1045.987 310
In all the individual factors as well as interaction factors, the obtained F
values failed to reach significance levels. In other words, subjects playing
different games did not differ significantly in their mean addiction proneness
scores as well as subjects with different SES levels. The interaction effect
between games and SES was found to be non-significant indicating that pattern
of addiction proneness was same for subjects with different SES levels
irrespective of the game they play. Hence, the formulated hypothesis is
accepted, as there is no significant interaction between SES and Games on
Addiction Proneness of sports students.
A starting revolution of the study is that, there were no interaction
effects in all but one area, that is, there is interaction between socio-economic
status and human powered / free hand games on severe depression. The
possible causes for this kind of phenomena area (i) majority of the subjects
belong to low socio-economic status groups. Severe depression prevalent
among the subjects of this sports category may be due to their low SES than
pursuance of particular sports, (ii) The human powered / free hand games
sports persons do not participate in competitions in special attire or use
attractive gadgets. They have low social esteem, with abysmally low social
recognition and patronage.