Embed Size (px)
Citation preview
Analysis and Geochemical Modeling of Vanadium Contamination in Groundwater New Rifle Processing Site, Colorado July 2010
LMS/RFN/S06654ESL-RPT-2010-01

This page intentionally left blank
LMS/RFN/S06654 ESL-RPT-2010-01
Analysis and Geochemical Modeling of Vanadium Contamination in Groundwater
New Rifle Processing Site, Colorado
July 2010

This page intentionally left blank
U.S. Department of Energy Analysis and Geochemical Modeling of Vanadium Contamination in Groundwater, Rifle, Colorado July 2010 Doc. No. S06654 Page i
Contents Abbreviations................................................................................................................................. iii Executive Summary .........................................................................................................................v 1.0 Introduction ............................................................................................................................1 2.0 Methods..................................................................................................................................4
2.1 Well Installation............................................................................................................7 2.2 SOARS System.............................................................................................................7 2.3 Groundwater Analyses..................................................................................................8 2.4 Soil Analyses ................................................................................................................9
3.0 Results ....................................................................................................................................9 3.1 Groundwater Elevations ...............................................................................................9 3.2 Groundwater Major Ion Chemistry ............................................................................11 3.3 Vanadium in Groundwater .........................................................................................14 3.4 Vanadium in Soil ........................................................................................................18
4.0 Discussion ............................................................................................................................20 4.1 Vanadium Chemistry ..................................................................................................20 4.2 Redox State of New Rifle Alluvial Groundwater.......................................................21 4.3 Mineral Saturation Indices..........................................................................................23 4.4 Correlation of Vanadium Concentration with Dewatering Event ..............................25 4.5 Conceptual Model for Groundwater Vanadium .........................................................27 4.6 Numerical Transport Model .......................................................................................28
5.0 Conclusions ..........................................................................................................................34 6.0 References ............................................................................................................................35
Figures Figure 1. Location of the New Rifle Processing Site, Garfield County, Colorado......................... 1 Figure 2. 1974 Photo of New Rifle Processing Site Showing Locations of Tailings Piles,
Holding Ponds, Mill Buildings, Ore Storage Areas, and Colorado River Sampling Location 0322 .................................................................................................................. 2
Figure 3. 2008 Aerial Photo of City of Rifle Wastewater Treatment Plant Showing Soil Sampling Locations (RFNV prefix) and the City's Dewatering Wells (CW prefix). ...... 5
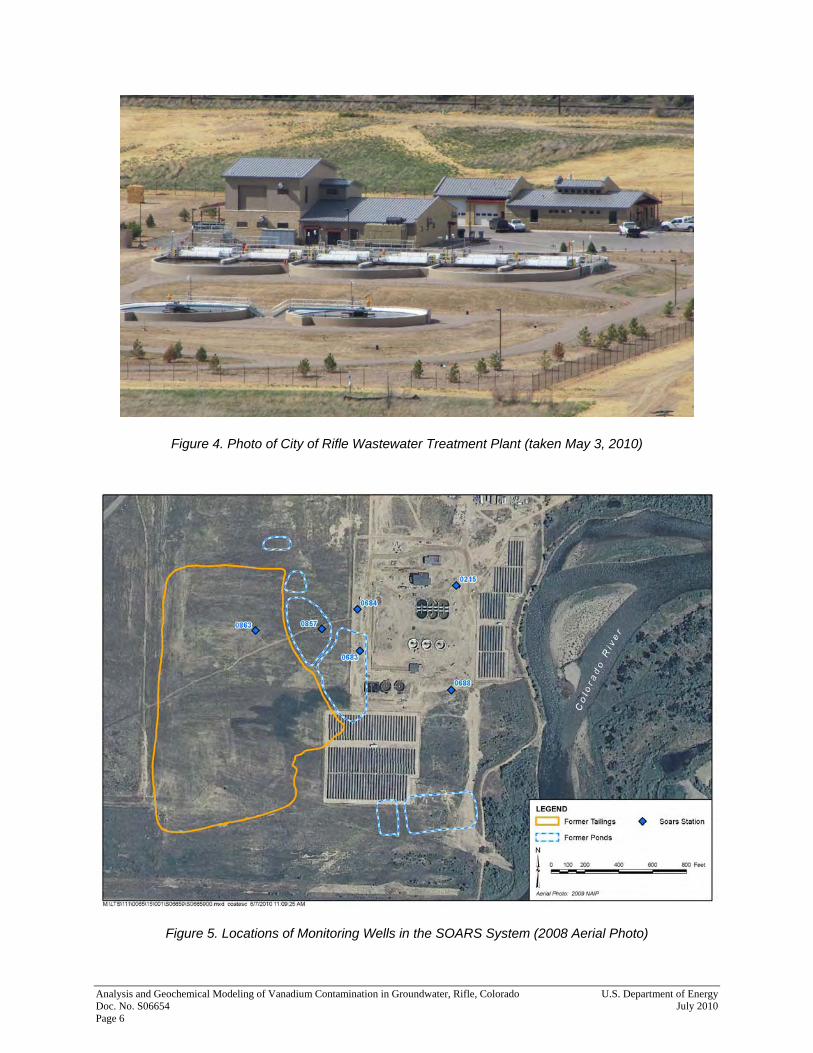
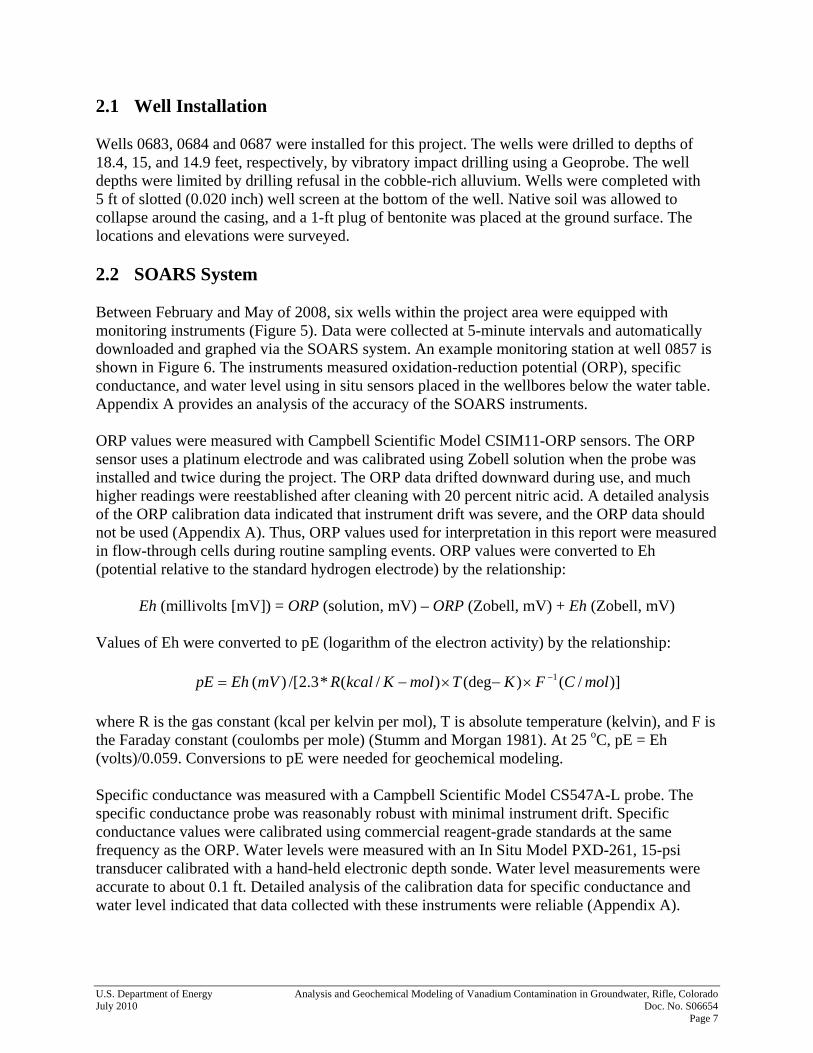
Figure 4. Photo of City of Rifle Wastewater Treatment Plant (taken May 3, 2010) ...................... 6 Figure 5. Locations of Monitoring Wells in the SOARS System (2008 Aerial Photo).................. 6 Figure 6. SOARS Station at Well 0857, Collects Data from Well 0857 and Weather
Instruments....................................................................................................................... 8 Figure 7. Colorado River Discharge Measured at the USGS Gauging Station,
Glenwood Springs, Colorado, and Groundwater Elevations at the Project Site............ 10 Figure 8. Long-Term Hydrograph of Well 0215 Showing Rebound to Nearly Non-Pumped
Levels by May 21, 2009................................................................................................. 11 Figure 9. Piper Diagram of Groundwater and Colorado River Water.......................................... 12 Figure 10. Specific Conductance in Groundwater........................................................................ 14 Figure 11. Location Map for Alluvial Groundwater Sampling Wells .......................................... 15 Figure 12. Vanadium Concentrations in Alluvial Groundwater Samples. ................................... 16 Figure 13. History of Vanadium Concentrations in Well 0855 .................................................... 17 Figure 14. History of Vanadium Concentrations in Well 0857 .................................................... 18
Analysis and Geochemical Modeling of Vanadium Contamination in Groundwater, Rifle, Colorado U.S. Department of Energy Doc. No. S06654 July 2010 Page ii
Figure 15. Yellow-Green Staining on Alluvial Gravels in the Wastewater Treatment Plant Construction Area (Photo taken May 2009) .................................................................. 19
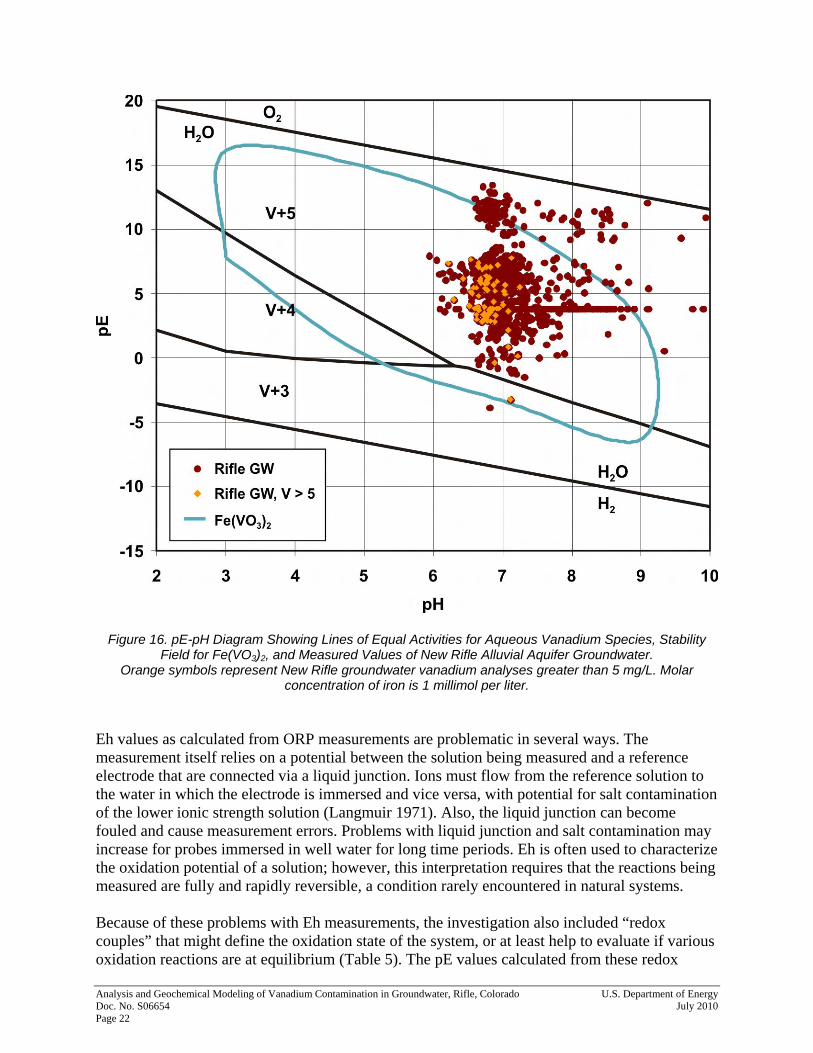
Figure 16. pE-pH Diagram Showing Lines of Equal Activities for Aqueous Vanadium Species, Stability Field for Fe(VO3)2, and Measured Values of New Rifle Alluvial Aquifer Groundwater. .................................................................................................... 22
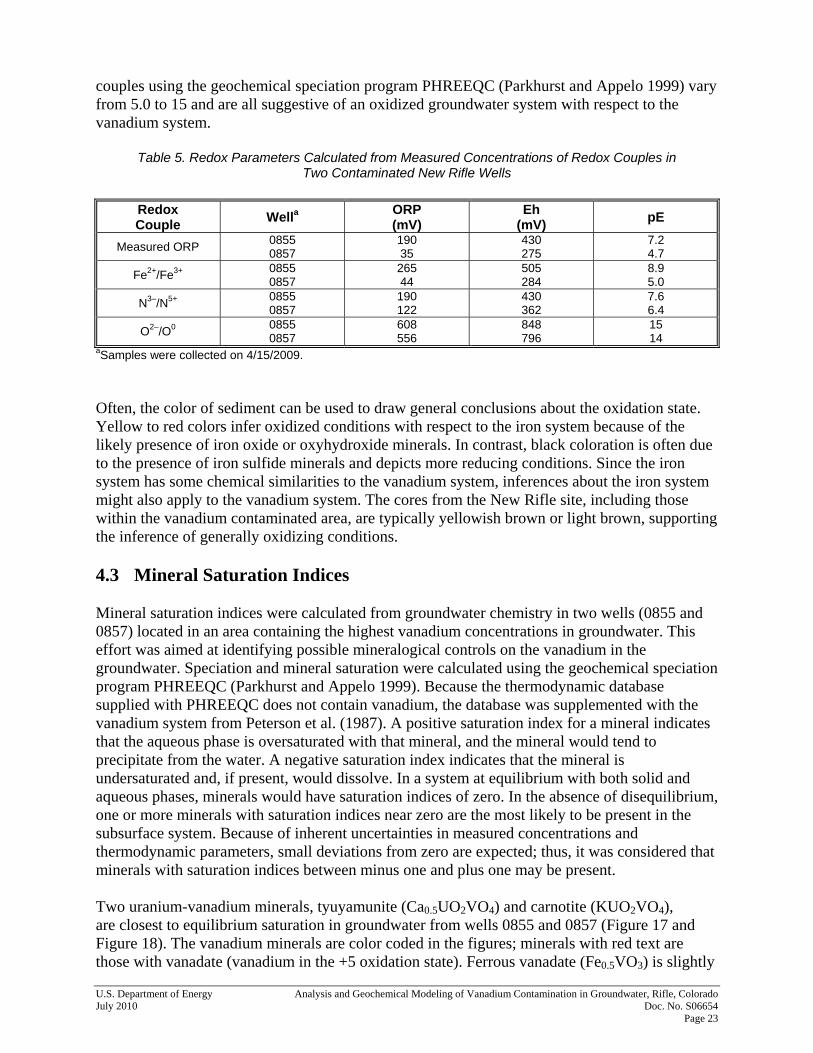
Figure 17. Vanadium Mineral Saturation Indices in Groundwater Sampled from Well 0855 on 4/15/2010. Oxidation states of vanadium are color coded. Minerals near the top are nearest to being in equilibrium with the water sample. ........................................... 24
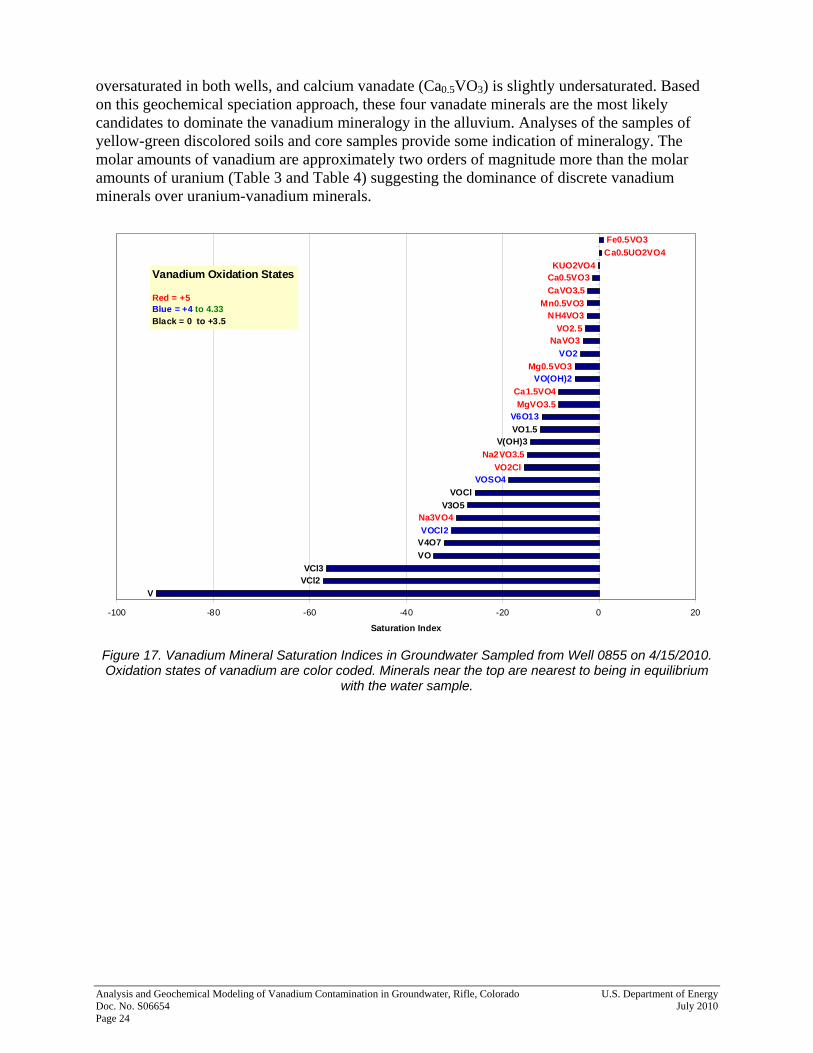
Figure 18. Vanadium Mineral Saturation Indices in Groundwater Sampled from Well 0857 on 4/15/2010. Oxidation states of vanadium are color coded. Minerals near the top are nearest to being in equilibrium with the water sample. ........................................... 25
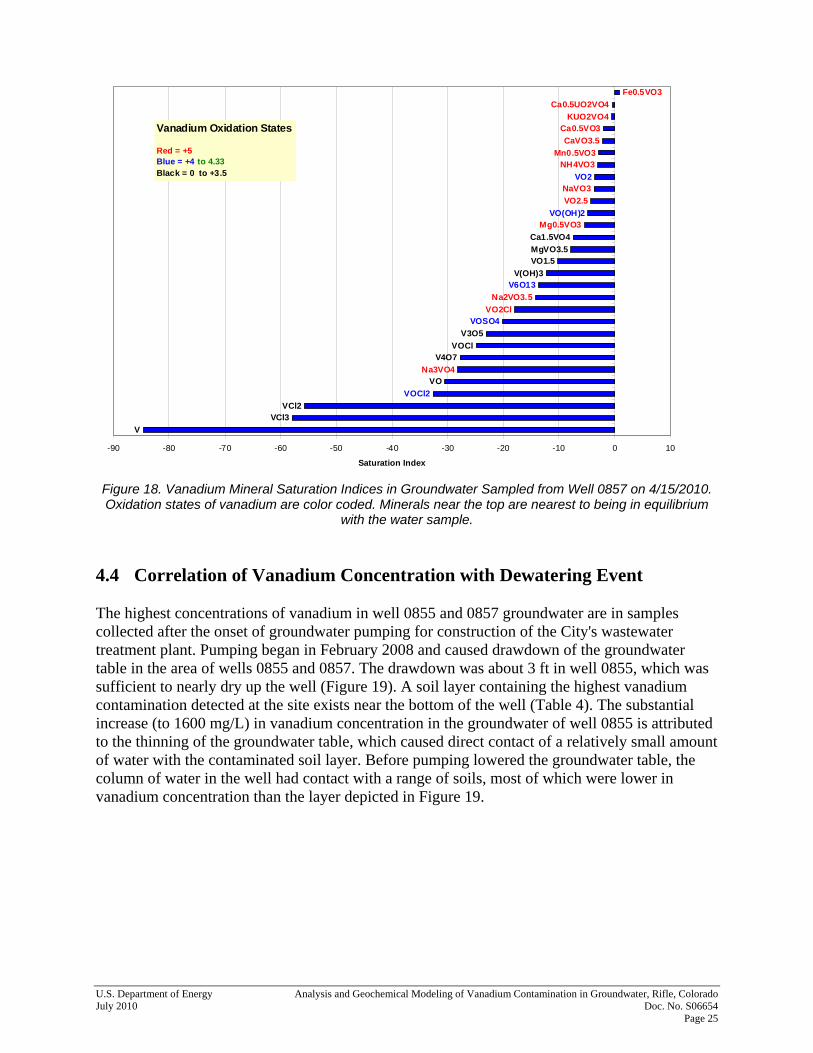
Figure 19. Vanadium Concentration, Groundwater Elevation, and Soil Vanadium Contamination in Well 855............................................................................................ 26
Figure 20. Vanadium Concentration and Groundwater Elevation in Well 857............................ 27 Figure 21. Conceptual Model of Vanadium System in New Rifle Alluvium............................... 28 Figure 22. Numerical Representation of Vanadium Accumulation in New Rifle Alluvium........ 29 Figure 23. Modeled Effluent (Cell 10) Logarithmic Concentrations of Vanadium
and Uranium................................................................................................................... 31 Figure 24. Modeled Effluent Concentrations of Vanadium-Bearing Minerals (in moles per
liter of pore fluid). Initial concentrations: ferrous-vanadate, tyuyamunite, and carnotite are 0.1 mol/L; for Ca-vanadate, 0.3 mol/L. ................................................... 31
Figure 25. Modeled Changes (Delta) in Mineral Abundances. Positive values indicate mineral precipitation, negative values indicate dissolution, zero indicates that the mineral is at equilibrium with the aqueous phase........................................................................... 32
Figure 26. Modeled Effluent Concentrations of Adsorbed Species (in moles per liter of pore fluid)............................................................................................................................... 33
Tables Table 1. Groundwater Composition in Samples Collected April 15, 2009 .................................. 13 Table 2. Concentrations of Contaminants in Wells 0855 and 0857 (mg/L)
(sampled April 15, 2009) ............................................................................................... 18 Table 3. Analysis of Yellow-Green Soils ..................................................................................... 19 Table 4. Concentrations of Constituents in Borehole Samples..................................................... 20 Table 5. Redox Parameters Calculated from Measured Concentrations of Redox Couples
in Two Contaminated New Rifle Wells......................................................................... 23 Table 6. Parameters Used in Numerical Model ............................................................................ 30
Appendixes Appendix A Instrument Calibration Summary Report Appendix B Chemical Data Appendix C Input Files for PHREEQC Simulations Appendix D Well Logs
U.S. Department of Energy Analysis and Geochemical Modeling of Vanadium Contamination in Groundwater, Rifle, Colorado July 2010 Doc. No. S06654 Page iii
Abbreviations ACL alternate concentration limit
AFO amorphous ferric oxyhydroxide
COCs contaminants of concern
DOE U.S. Department of Energy
GCAP Ground Water Compliance Action Plan
ICP-MS inductively coupled plasma mass spectrometry
ICs institutional controls
LM (DOE) Office of Legacy Management
μg/L micrograms per liter
mg/kg milligrams per kilogram
mg/L milligrams per liter
mS/cm millisiemens per centimeter
msl mean seal level
ORP oxidation-reduction potential
SOARS System Operation and Analysis at Remote Sites
SOWP Site Observational Work Plan
ZVI zero-valent iron

Analysis and Geochemical Modeling of Vanadium Contamination in Groundwater, Rifle, Colorado U.S. Department of Energy Doc. No. S06654 July 2010 Page iv
This page intentionally left blank
U.S. Department of Energy Analysis and Geochemical Modeling of Vanadium Contamination in Groundwater, Rifle, Colorado July 2010 Doc. No. S06654 Page v
Executive Summary This investigation examines the occurrence of a vanadium groundwater plume at the New Rifle Processing Site. Project documents indicate that vanadium is the only contaminant that will not flush in the 100-year time frame regulated for natural flushing. Groundwater compliance at the site is regulated through the Ground Water Compliance Action Plan (GCAP). The draft GCAP proposes an alternate concentration limit (ACL) of 50 milligrams per liter (mg/L) for vanadium, which is determined to be protective at the Colorado River point of compliance. This concentration value was selected in part because it was higher than any concentrations yet observed in groundwater samples. Institutional controls, including deed restrictions, are in place to prevent exposure to contaminated groundwater. However, the GCAP warns of possible exceedances to the ACL if the land surface is disturbed during construction activities. It was postulated that oxidation during surface disturbances could lead to desorption of vanadium, causing increased concentrations in groundwater, possibly exceeding the ACL. The City of Rifle has plans for land use that include construction activities, but deed restrictions require that these activities receive U.S. Department of Energy Office of Legacy Management (LM) approval. The current study was undertaken to better understand the nature of the groundwater vanadium system and chemical mechanisms that might cause exceedances of the ACL. The study is funded through LM's Applied Science and Technology program and covered 24 months, from February 2008 through February 2010. This project did not investigate human health or ecological risk factors associated with the groundwater vanadium plume; thus, recommendations regarding land use are not included. The goal of the project was to monitor the vanadium plume during a significant land disturbance—the construction of a wastewater treatment plant and associated aquifer dewatering—and to provide a reasonable explanation for the observed vanadium behavior. This information can then be used to update the GCAP. In February 2008, dewatering began for installation of the wastewater treatment facility immediately east of the former mill site. Although details are lacking, it is likely that several hundred gallons per minute were pumped for 6 to 8 months. Under normal (non-pumped) conditions, groundwater at the site flows generally westerly or southwesterly subparallel to the Colorado River. Groundwater pumping for construction dewatering significantly altered this flow regime and caused groundwater to flow from the central portion of the site to the east. This dewatering event provided an opportunity to observe and evaluate modifications to the groundwater system during a construction-related disturbance. Three new wells were installed at the eastern portion of the site to help monitor the groundwater table during dewatering. Six wells within the project area were equipped with monitoring instruments (specific conductance, water level, and oxidation-reduction potential) and connected to LM's System Operation and Analysis at Remote Sites (SOARS) network for real-time data analysis. Groundwater sampling of a network of wells was conducted at several times during the project, and an autosampler was used to track approximately weekly changes in vanadium concentrations in one of the more critical wells. Several samples of yellow-green soils that were exposed during construction were analyzed during this study. Vanadium concentrations in the yellow-green soils are high and are similar to concentrations in core samples collected at the site in 1999. Vanadium concentrations in the groundwater exceeded the risk-based value of 0.33 mg/L in some monitoring wells. In some wells, the concentration exceeded this value by more than an
Analysis and Geochemical Modeling of Vanadium Contamination in Groundwater, Rifle, Colorado U.S. Department of Energy Doc. No. S06654 July 2010 Page vi
order of magnitude. One sample from well 0855 had a vanadium concentration of 1600 mg/L, the highest recorded on the site. Groundwater levels were affected by both the dewatering operation and changing water levels of the Colorado River. Influences on groundwater chemistry include influx from the Colorado River, local recharge, and contamination from the mill site. There is considerable variation in specific conductance (a measure of salt content) in some of these wells that is likely related to variable groundwater movements caused by dewatering from pumping. One of the goals of the project was to better define the oxidation state of the groundwater. All chemical indicators of groundwater oxidation state suggest that the groundwater is oxidized relative to the vanadium system. Groundwater analyses from the entire New Rifle site form a tight cluster on a pE-pH diagram. With the exception of two points, the New Rifle groundwater data all plot in the V(+5) field suggesting that the groundwater is oxidized relative to the vanadium system. The substantial increase in vanadium concentration to 1600 mg/L in well 0855 occurred during aquifer dewatering. The groundwater table at the time of this sampling had been drawn down to a level at which the well was nearly dry, and the small amount of water in the well was at the same elevation as a soil layer containing the highest concentration of vanadium observed at the site. The elevated concentration of dissolved vanadium is attributed to this thinning of the groundwater table, causing direct contact of a relatively small amount of water with the contaminated soil layer. When the water table is higher, the well receives groundwater that has contacted a variety of soil compositions, yielding a lower dissolved vanadium concentration. To better understand the physical and geochemical partitioning of vanadium in the alluvial aquifer and to better predict effects that surface disturbance might have on vanadium concentrations in the groundwater system, mineral saturation indices were calculated from groundwater chemistry, and a one-dimensional transport model was developed to demonstrate geochemical interactions in the subsurface. The transport model invokes mineral precipitation, mineral dissolution, soil adsorption, and soil desorption. The model simulates chemical reactions occurring along a single stream tube as background-quality groundwater flows into the contaminated domain beneath a former mill pond. Adsorption is modeled using a surface complexation approach. The model predicts an extremely high initial effluent vanadium concentration caused by the dissolution of calcium vanadate, a highly soluble mineral. After the depletion of calcium vanadate, ferrous vanadate dissolves, yielding vanadium to solution but at a lower concentration. Finally, after ferrous vanadate is expended, desorption is the dominant process controlling aqueous vanadium concentrations. The variations observed in the modeled vanadium concentrations are consistent with the variations observed in well water samples. Dissolved uranium concentrations in the wells are much lower than the vanadium concentrations. The modeled uranium concentrations are also low due to equilibrium with uranyl-vanadate minerals. Thus, the model also helps explain the relatively low uranium concentrations detected in the New Rifle site groundwater system. The groundwater analyses of samples collected for this study offer direct evidence that vanadium concentrations can exceed the ACL of 50 mg/L as a result of construction disturbance. Evidence presented suggests an alternate mechanism to the addition of oxygen (oxidation) as postulated in site documents. Instead, it is suggested that vanadium concentrations increase due to changing water levels that bring smaller amounts of groundwater into direct contact with vanadium-rich
U.S. Department of Energy Analysis and Geochemical Modeling of Vanadium Contamination in Groundwater, Rifle, Colorado July 2010 Doc. No. S06654 Page vii
soils. Most chemical indicators suggest that the aquifer is largely oxidized with respect to the vanadium system. Further oxidation would not dissolve vanadate minerals. Vanadium at the New Rifle site is present in high concentrations in subsurface soils in a heterogeneous distribution. The soil vanadium is probably dominated by the +5 oxidation state occurring in vanadates and uranium vanadates and in vanadium adsorbed to soil particles, particularly those containing ferric oxides and oxyhydroxides. The vanadium in the soils was likely a residual from mill leachates that infiltrated the subsurface during milling and were not removed during site remediation in the early 1990s. Without removal of the vanadiferous soil layers, it is likely that vanadium concentration in the groundwater will remain at tens of milligrams per liter with occasional increases when contaminated soil layers are in more direct contact with a limited volume of groundwater.

Analysis and Geochemical Modeling of Vanadium Contamination in Groundwater, Rifle, Colorado U.S. Department of Energy Doc. No. S06654 July 2010 Page viii
This page intentionally left blank
U.S. Department of Energy Analysis and Geochemical Modeling of Vanadium Contamination in Groundwater, Rifle, Colorado July 2010 Doc. No. S06654 Page 1
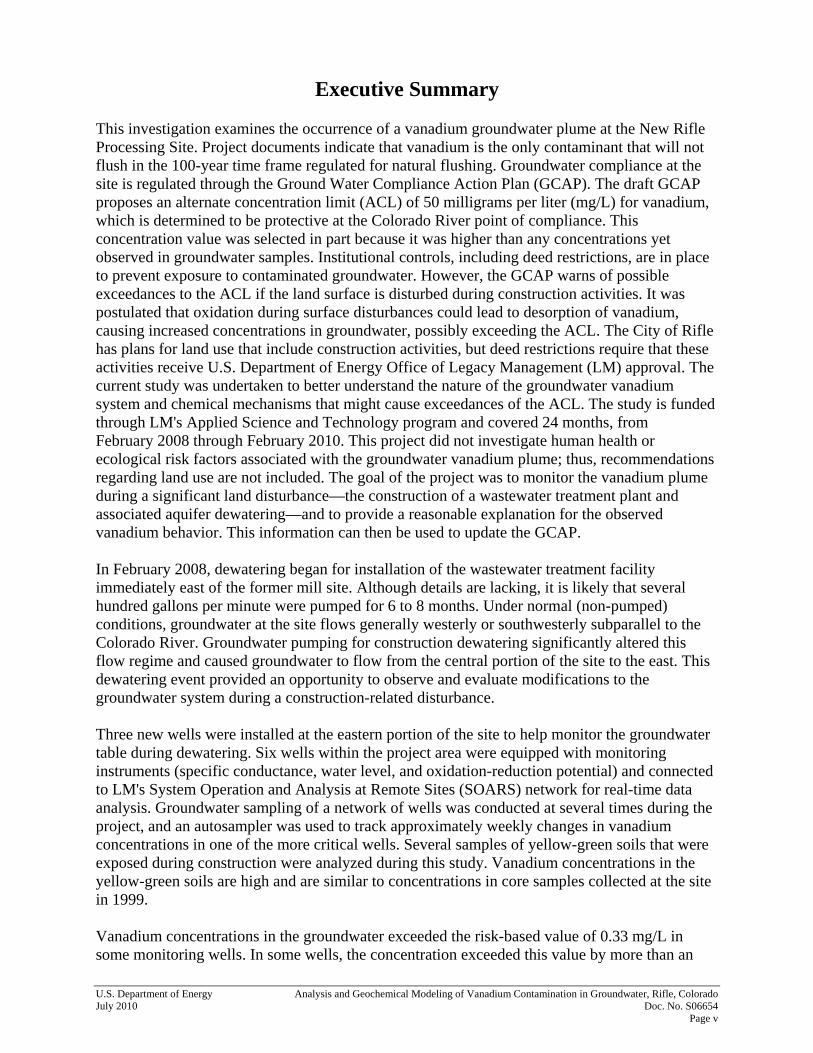
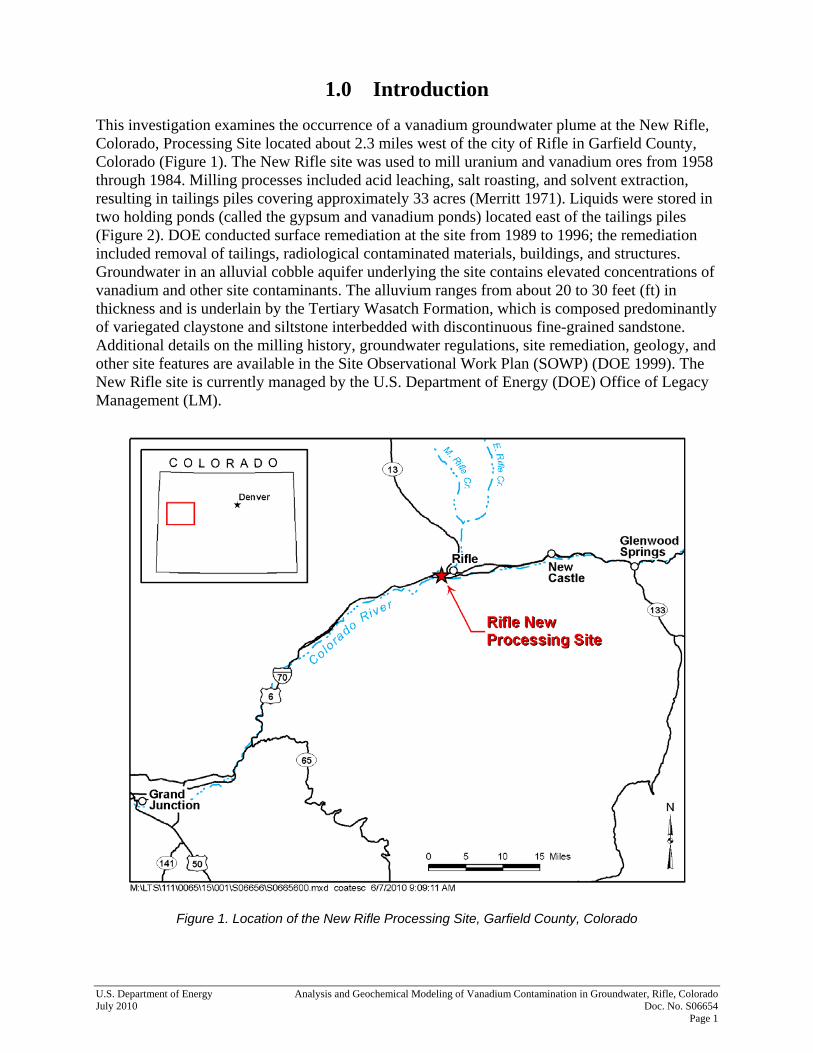
1.0 Introduction This investigation examines the occurrence of a vanadium groundwater plume at the New Rifle, Colorado, Processing Site located about 2.3 miles west of the city of Rifle in Garfield County, Colorado (Figure 1). The New Rifle site was used to mill uranium and vanadium ores from 1958 through 1984. Milling processes included acid leaching, salt roasting, and solvent extraction, resulting in tailings piles covering approximately 33 acres (Merritt 1971). Liquids were stored in two holding ponds (called the gypsum and vanadium ponds) located east of the tailings piles (Figure 2). DOE conducted surface remediation at the site from 1989 to 1996; the remediation included removal of tailings, radiological contaminated materials, buildings, and structures. Groundwater in an alluvial cobble aquifer underlying the site contains elevated concentrations of vanadium and other site contaminants. The alluvium ranges from about 20 to 30 feet (ft) in thickness and is underlain by the Tertiary Wasatch Formation, which is composed predominantly of variegated claystone and siltstone interbedded with discontinuous fine-grained sandstone. Additional details on the milling history, groundwater regulations, site remediation, geology, and other site features are available in the Site Observational Work Plan (SOWP) (DOE 1999). The New Rifle site is currently managed by the U.S. Department of Energy (DOE) Office of Legacy Management (LM).
Figure 1. Location of the New Rifle Processing Site, Garfield County, Colorado
Analysis and Geochemical Modeling of Vanadium Contamination in Groundwater, Rifle, Colorado U.S. Department of Energy Doc. No. S06654 July 2010 Page 2
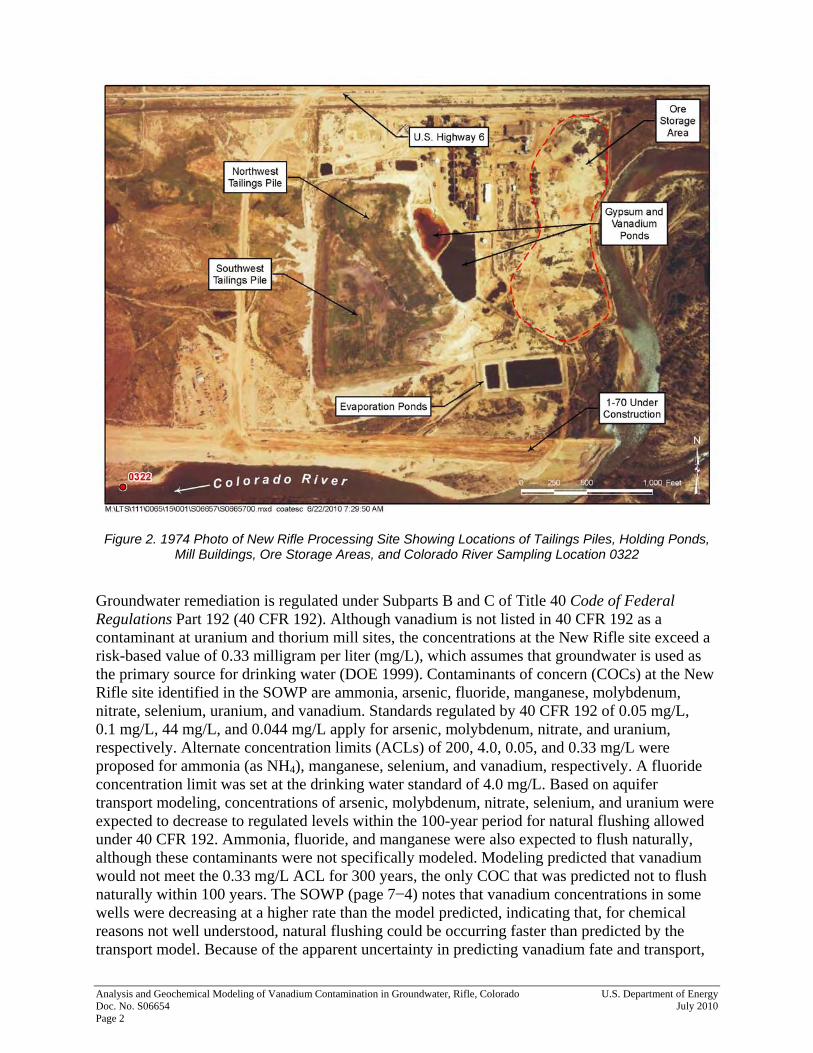
Figure 2. 1974 Photo of New Rifle Processing Site Showing Locations of Tailings Piles, Holding Ponds, Mill Buildings, Ore Storage Areas, and Colorado River Sampling Location 0322
Groundwater remediation is regulated under Subparts B and C of Title 40 Code of Federal Regulations Part 192 (40 CFR 192). Although vanadium is not listed in 40 CFR 192 as a contaminant at uranium and thorium mill sites, the concentrations at the New Rifle site exceed a risk-based value of 0.33 milligram per liter (mg/L), which assumes that groundwater is used as the primary source for drinking water (DOE 1999). Contaminants of concern (COCs) at the New Rifle site identified in the SOWP are ammonia, arsenic, fluoride, manganese, molybdenum, nitrate, selenium, uranium, and vanadium. Standards regulated by 40 CFR 192 of 0.05 mg/L, 0.1 mg/L, 44 mg/L, and 0.044 mg/L apply for arsenic, molybdenum, nitrate, and uranium, respectively. Alternate concentration limits (ACLs) of 200, 4.0, 0.05, and 0.33 mg/L were proposed for ammonia (as NH4), manganese, selenium, and vanadium, respectively. A fluoride concentration limit was set at the drinking water standard of 4.0 mg/L. Based on aquifer transport modeling, concentrations of arsenic, molybdenum, nitrate, selenium, and uranium were expected to decrease to regulated levels within the 100-year period for natural flushing allowed under 40 CFR 192. Ammonia, fluoride, and manganese were also expected to flush naturally, although these contaminants were not specifically modeled. Modeling predicted that vanadium would not meet the 0.33 mg/L ACL for 300 years, the only COC that was predicted not to flush naturally within 100 years. The SOWP (page 7−4) notes that vanadium concentrations in some wells were decreasing at a higher rate than the model predicted, indicating that, for chemical reasons not well understood, natural flushing could be occurring faster than predicted by the transport model. Because of the apparent uncertainty in predicting vanadium fate and transport,
U.S. Department of Energy Analysis and Geochemical Modeling of Vanadium Contamination in Groundwater, Rifle, Colorado July 2010 Doc. No. S06654 Page 3
active remediation alternatives were evaluated for vanadium with the recommendation that pump-and-treat remediation using zero-valent iron (ZVI) as the treatment medium be pilot tested. In addition, characterization of vanadium concentrations in soil and groundwater was conducted in 2000 (DOE 2000a and 2000b). Those studies identified vanadium concentrations of up to 6190 milligrams per kilogram (mg/kg) in soil and up to 32 mg/L in groundwater. The highest concentrations of soil vanadium were approximately 10 ft below ground surface in areas of the former mill ponds. Prototype testing of ZVI treatment was conducted by LM's Environmental Sciences Laboratory at the Grand Junction Office from September 27 through December 22, 2000 (DOE 2001). Favorable vanadium removal from the prototype tests led to construction of a full-scale pilot plant, which began operation in January 29, 2001. The plant consisted of a set of ZVI treatment columns, flocculation tanks, and an infiltration gallery. The flocculation removed iron that dissolved during ZVI treatment and provided supplemental removal of vanadium. The treated water was infiltrated back into the aquifer downgradient of the plant. The vanadium concentration in the groundwater plume did not decrease significantly during the operation of the pilot plant, and it was concluded that pumping was not an efficient method for aquifer restoration. High partitioning of vanadium to the solid particles in the aquifer was proposed as the reason for the inefficiency. Because of the inefficiency at decreasing aquifer vanadium concentrations, the pilot plant was discontinued on November 19, 2001, after treating 2.9 million gallons of groundwater. In 2003, DOE reexamined the issue of vanadium in the groundwater based on the observation that concentrations in some wells appeared to be decreasing more rapidly than predicted by the transport model described in the SOWP. An analytical algorithm was used to describe localized vanadium transport using individual sets of time-concentration data (DOE 2003). In contrast to the previous transport modeling, the 2003 investigation concluded that vanadium concentrations were likely to meet the 0.33 mg/L ACL in 100 years. In 2005, DOE prepared a Ground Water Compliance Action Plan (GCAP) (DOE 2005) to direct the groundwater remediation effort. Remediation concentration goals were the same as the concentration limits provided in the SOWP with the following exceptions: a risk-based standard of 155 mg/L was set for ammonia (decreased from 200 mg/L); background was set for manganese, and the historical background concentration was stated as 5.9 mg/L (increased from 4.0 mg/L); a combined standard of 10 mg/L (as N) was set for nitrate plus nitrite (modified from 44 mg/L as NO3); and the standard for uranium was set at the greater of 0.044 mg/L or background, stated as 0.059 mg/L (increased from 0.044 mg/L). The remediation goal for vanadium in the GCAP remained at the risk-based value of 0.33 mg/L given in the SOWP. The GCAP maintains that “Evidence strongly suggests that disturbing the subsurface down into the water table tends to release vanadium from sorbed sites and increase concentrations in the groundwater. Consequently, future disturbance should be minimized. ICs [institutional controls] that prevent disturbance of the groundwater system … [are needed].” The GCAP also states that vanadium concentrations in the groundwater system will decrease to the 0.33 mg/L remediation goal “if the groundwater system is not disturbed.” Deed restrictions are described that would prohibit the use of groundwater and excavation or well construction for the site. A second GCAP was prepared in 2006 (DOE 2006). Most remediation goals were the same as in the previous GCAP with the following exceptions: ammonia, fluoride, and manganese were
Analysis and Geochemical Modeling of Vanadium Contamination in Groundwater, Rifle, Colorado U.S. Department of Energy Doc. No. S06654 July 2010 Page 4
removed from the COC list. The remediation goal for selenium decreased from the ACL value of 0.05 mg/L in the SOWP to a background value of 0.036 mg/L (or maximum background level). The remediation goal for uranium increased from 0.059 mg/L given in the previous GCAP to 0.067 mg/L (or maximum background level). The ACL for vanadium increased from 0.33 to 50 mg/L. The higher vanadium ACL was determined to be protective at the Colorado River point of compliance and to be higher than any values observed in groundwater samples. Institutional controls (ICs) were established to eliminate exposure to contaminated groundwater through deed and zoning restrictions. The land has been deeded to the City of Rifle. Much of the land is within the growth corridor for the city, and the city would benefit from commercial and industrial construction in this area. Construction that contacts the contaminated groundwater is of concern. The 2006 GCAP contains a map in Appendix A, Part A1 showing areas of “No Disturbance” and “Limited Disturbance.” This map was filed with the quitclaim deed, presumably as a measure to control subsurface disturbances that could mobilize vanadium; however, the GCAP is vague on the meaning of “limited disturbance.” The exact nature of the restrictions is still under discussion, and the current study was intended to help provide information useful to the decision process. In February 2008, dewatering began for installation of a wastewater treatment facility just east of the site (Figure 3 and Figure 4). Although details are lacking, it is likely that several hundred gallons per minute were pumped for 6 to 8 months. Water was discharged to the Colorado River. The pumping resulted in a lowering of the groundwater table within the study area extending at least as far west as well 0863 (Figure 5). Three new wells (0683, 0684, 0688) were drilled specifically for this study (Figure 5). These wells and existing wells 0215, 0857, and 0863 (Figure 5) were instrumented and connected to LM's System Operation and Analysis at Remote Sites (SOARS), but unfortunately, this detailed data collection network was not in place until a couple months after the onset of pumping. Decisions on land use are closely tied to the eventual fate of vanadium in groundwater. Previous documents discuss mobilization and transport of vanadium in a broad sense. This study was undertaken to better evaluate the geochemical nature of the vanadium plume. The study is funded through LM's Applied Science and Technology program. The purpose is to provide a reasonable understanding of vanadium geochemistry as it applies to groundwater compliance. Information from the study will feed into the decision-making process for possible land use restrictions, additional characterization, and/or additional groundwater remediation. The study period covered 24 months, from February 2008 through February 2010.
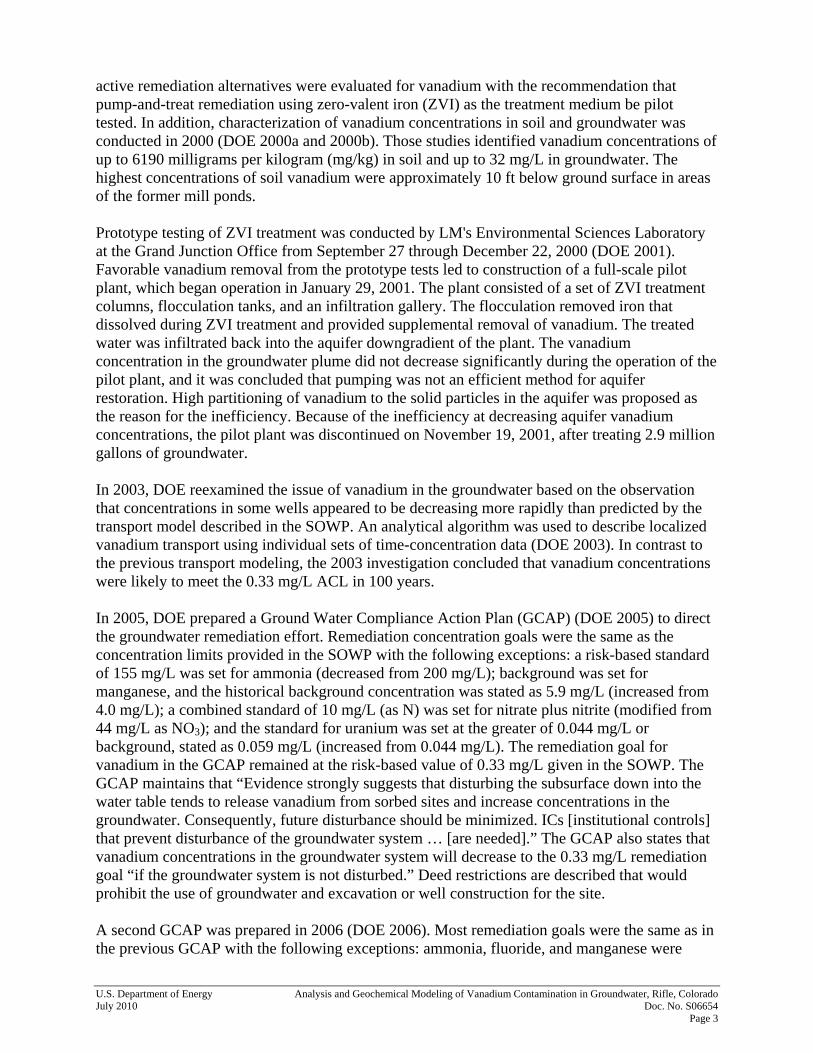
2.0 Methods In February 2008, the City of Rifle began dewatering for installation of a wastewater treatment facility near the eastern portion of the site. Thirty 12-inch-diameter wells (prefix CW) were used to extract groundwater at pumping rates in the hundreds of gallons per minute (Figure 3). Some of the dewatering wells were sampled for this study, although detailed pumping rates during the dewatering operation were unavailable. Some wells were assigned to DOE and continue to be monitored as part of the groundwater remediation effort. For the current study, three new monitoring wells were installed, real-time groundwater monitoring instruments were placed in six wells, groundwater samples were collected and analyzed, and soil samples were analyzed.
U.S. Department of Energy Analysis and Geochemical Modeling of Vanadium Contamination in Groundwater, Rifle, Colorado July 2010 Doc. No. S06654 Page 5
Figure 3. 2008 Aerial Photo of City of Rifle Wastewater Treatment Plant Showing Soil Sampling Locations
(RFNV prefix) and the City's Dewatering Wells (CW prefix).
Analysis and Geochemical Modeling of Vanadium Contamination in Groundwater, Rifle, Colorado U.S. Department of Energy Doc. No. S06654 July 2010 Page 6
Figure 4. Photo of City of Rifle Wastewater Treatment Plant (taken May 3, 2010)
Figure 5. Locations of Monitoring Wells in the SOARS System (2008 Aerial Photo)
U.S. Department of Energy Analysis and Geochemical Modeling of Vanadium Contamination in Groundwater, Rifle, Colorado July 2010 Doc. No. S06654 Page 7
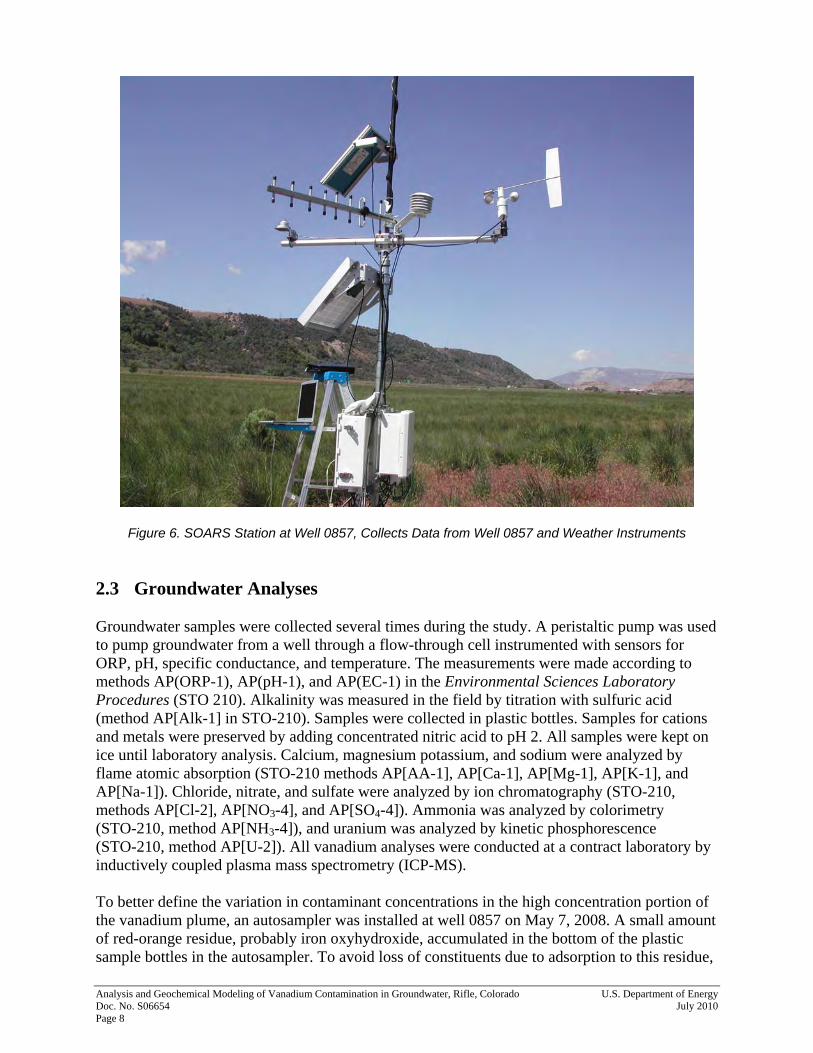
2.1 Well Installation Wells 0683, 0684 and 0687 were installed for this project. The wells were drilled to depths of 18.4, 15, and 14.9 feet, respectively, by vibratory impact drilling using a Geoprobe. The well depths were limited by drilling refusal in the cobble-rich alluvium. Wells were completed with 5 ft of slotted (0.020 inch) well screen at the bottom of the well. Native soil was allowed to collapse around the casing, and a 1-ft plug of bentonite was placed at the ground surface. The locations and elevations were surveyed. 2.2 SOARS System Between February and May of 2008, six wells within the project area were equipped with monitoring instruments (Figure 5). Data were collected at 5-minute intervals and automatically downloaded and graphed via the SOARS system. An example monitoring station at well 0857 is shown in Figure 6. The instruments measured oxidation-reduction potential (ORP), specific conductance, and water level using in situ sensors placed in the wellbores below the water table. Appendix A provides an analysis of the accuracy of the SOARS instruments. ORP values were measured with Campbell Scientific Model CSIM11-ORP sensors. The ORP sensor uses a platinum electrode and was calibrated using Zobell solution when the probe was installed and twice during the project. The ORP data drifted downward during use, and much higher readings were reestablished after cleaning with 20 percent nitric acid. A detailed analysis of the ORP calibration data indicated that instrument drift was severe, and the ORP data should not be used (Appendix A). Thus, ORP values used for interpretation in this report were measured in flow-through cells during routine sampling events. ORP values were converted to Eh (potential relative to the standard hydrogen electrode) by the relationship:
Eh (millivolts [mV]) = ORP (solution, mV) – ORP (Zobell, mV) + Eh (Zobell, mV)
Values of Eh were converted to pE (logarithm of the electron activity) by the relationship:
)]/()(deg)/(*3.2/[)( 1 molCFKTmolKkcalRmVEhpE −×−×−= where R is the gas constant (kcal per kelvin per mol), T is absolute temperature (kelvin), and F is the Faraday constant (coulombs per mole) (Stumm and Morgan 1981). At 25 oC, pE = Eh (volts)/0.059. Conversions to pE were needed for geochemical modeling. Specific conductance was measured with a Campbell Scientific Model CS547A-L probe. The specific conductance probe was reasonably robust with minimal instrument drift. Specific conductance values were calibrated using commercial reagent-grade standards at the same frequency as the ORP. Water levels were measured with an In Situ Model PXD-261, 15-psi transducer calibrated with a hand-held electronic depth sonde. Water level measurements were accurate to about 0.1 ft. Detailed analysis of the calibration data for specific conductance and water level indicated that data collected with these instruments were reliable (Appendix A).
Analysis and Geochemical Modeling of Vanadium Contamination in Groundwater, Rifle, Colorado U.S. Department of Energy Doc. No. S06654 July 2010 Page 8
Figure 6. SOARS Station at Well 0857, Collects Data from Well 0857 and Weather Instruments 2.3 Groundwater Analyses Groundwater samples were collected several times during the study. A peristaltic pump was used to pump groundwater from a well through a flow-through cell instrumented with sensors for ORP, pH, specific conductance, and temperature. The measurements were made according to methods AP(ORP-1), AP(pH-1), and AP(EC-1) in the Environmental Sciences Laboratory Procedures (STO 210). Alkalinity was measured in the field by titration with sulfuric acid (method AP[Alk-1] in STO-210). Samples were collected in plastic bottles. Samples for cations and metals were preserved by adding concentrated nitric acid to pH 2. All samples were kept on ice until laboratory analysis. Calcium, magnesium potassium, and sodium were analyzed by flame atomic absorption (STO-210 methods AP[AA-1], AP[Ca-1], AP[Mg-1], AP[K-1], and AP[Na-1]). Chloride, nitrate, and sulfate were analyzed by ion chromatography (STO-210, methods AP[Cl-2], AP[NO3-4], and AP[SO4-4]). Ammonia was analyzed by colorimetry (STO-210, method AP[NH3-4]), and uranium was analyzed by kinetic phosphorescence (STO-210, method AP[U-2]). All vanadium analyses were conducted at a contract laboratory by inductively coupled plasma mass spectrometry (ICP-MS). To better define the variation in contaminant concentrations in the high concentration portion of the vanadium plume, an autosampler was installed at well 0857 on May 7, 2008. A small amount of red-orange residue, probably iron oxyhydroxide, accumulated in the bottom of the plastic sample bottles in the autosampler. To avoid loss of constituents due to adsorption to this residue,
U.S. Department of Energy Analysis and Geochemical Modeling of Vanadium Contamination in Groundwater, Rifle, Colorado July 2010 Doc. No. S06654 Page 9
the bottles were agitated to homogenize and suspend the residue prior to splitting a sample for analysis. Samples were collected daily from May 7 through May 19, 2008; on 4-day intervals from May 19, 2008, through November 3, 2009; and weekly from November 9, 2009, through January 18, 2010. All samples from the autosampler were analyzed for uranium and vanadium by ICP-MS at a contract laboratory. Some samples were also analyzed for arsenic, molybdenum, and selenium. Chemical data collected during this project are provided as Appendix B. 2.4 Soil Analyses Yellow-green discolored soils were uncovered in the southwestern portion of the construction area during excavation for the wastewater treatment plant. Contractor site personnel collected three samples of the discolored soil for this study. Sample material was biased toward fine-grained soil and excluded pebbles and cobbles. The samples were collected with a hand scoop and placed in plastic bags. One sample (“Yellow Soil”) was sieved to –10 mesh (<2 millimeters [mm]), air dried in the Environmental Sciences Laboratory, and then sent to a contract laboratory. The other two samples were further biased by hand selecting the most discolored material and sending it to a contract laboratory. At the contract laboratory, the samples were oven dried at about 105 oC and digested in a mixture of nitric acid (at 95 °C), hydrochloric acid, and peroxide (EPA procedure 3050B). Nitric acid and peroxide were repeatedly added until no further change was apparent. A separate extraction using the same procedure but without hydrochloric acid was conducted for vanadium analysis, because the chlorate ion interfered with the vanadium analysis. Iron was determined by ICP-emission; uranium and vanadium were determined by ICP-MS. Personnel from the City of Rifle's contractor for the wastewater treatment system, Stanek, also collected discolored samples from a similar area. Less is known about the sampling and analysis methods used for the Stanek sampling; however, the data are included in this study. These samples were also collected with a hand scoop, presumably avoiding the larger pebbles and cobbles and were likely biased for discoloration and fines. It is likely that the samples were oven dried and extracted using EPA procedure 3050B, although that information was not available for this study. The Stanek samples were analyzed using ICP-emission for arsenic, molybdenum, selenium, uranium, and vanadium.
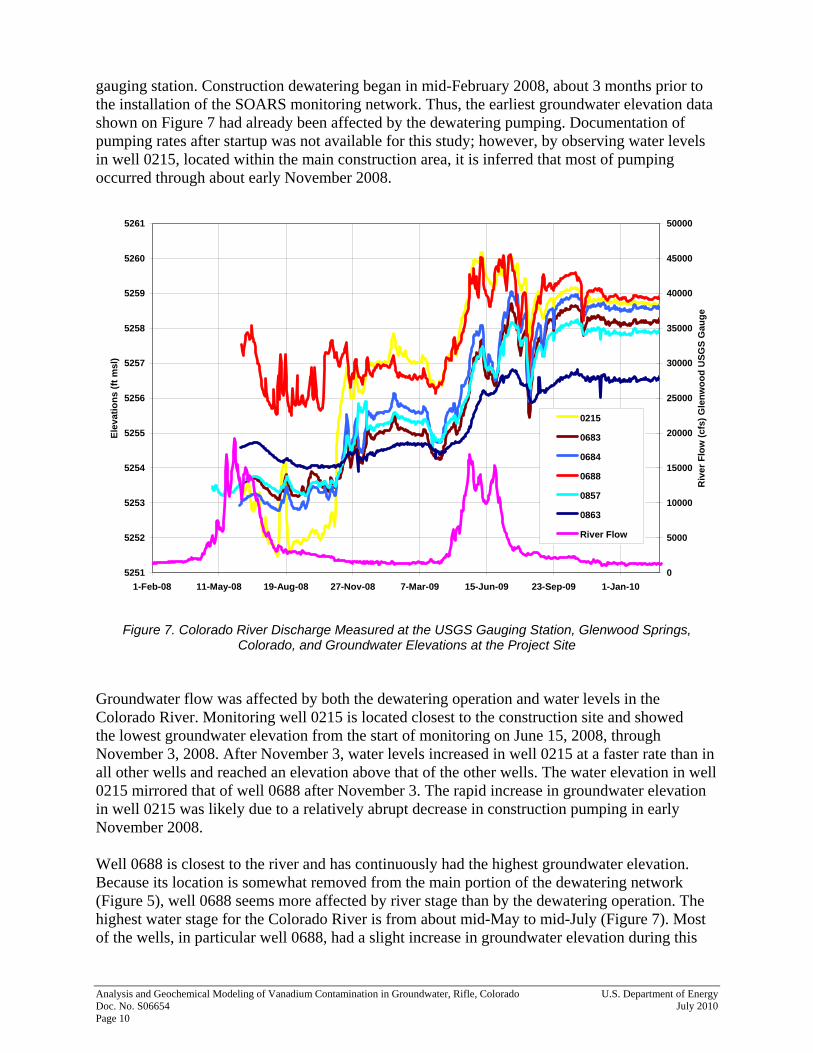
3.0 Results 3.1 Groundwater Elevations Under normal (non-pumped) conditions, groundwater at the site flows generally westerly or southwesterly subparallel to the Colorado River (DOE 1999, SOWP Figure 5−11). Groundwater pumping for construction dewatering significantly altered this flow regime, causing groundwater to flow from the central portion of the site to the east, forming a groundwater divide near well 0863. As discussed in Section 3.2, lowering of the groundwater table by dewatering pumping increased direct contact of groundwater with contaminated soil zones and resulted in substantially higher vanadium concentrations in some wells. Figure 7 shows a comparison of groundwater elevations in the 6 wells monitored with SOARS to the Colorado River discharge measured 28 miles upstream at the Glenwood, Colorado, USGS
Analysis and Geochemical Modeling of Vanadium Contamination in Groundwater, Rifle, Colorado U.S. Department of Energy Doc. No. S06654 July 2010 Page 10
gauging station. Construction dewatering began in mid-February 2008, about 3 months prior to the installation of the SOARS monitoring network. Thus, the earliest groundwater elevation data shown on Figure 7 had already been affected by the dewatering pumping. Documentation of pumping rates after startup was not available for this study; however, by observing water levels in well 0215, located within the main construction area, it is inferred that most of pumping occurred through about early November 2008.
5251
5252
5253
5254
5255
5256
5257
5258
5259
5260
5261
1-Feb-08 11-May-08 19-Aug-08 27-Nov-08 7-Mar-09 15-Jun-09 23-Sep-09 1-Jan-10
Elev
atio
ns (f
t msl
)
0
5000
10000
15000
20000
25000
30000
35000
40000
45000
50000
Riv
er F
low
(cfs
) Gle
nwoo
d U
SGS
Gau
ge
0215
0683
0684
0688
0857
0863
River Flow
Figure 7. Colorado River Discharge Measured at the USGS Gauging Station, Glenwood Springs, Colorado, and Groundwater Elevations at the Project Site
Groundwater flow was affected by both the dewatering operation and water levels in the Colorado River. Monitoring well 0215 is located closest to the construction site and showed the lowest groundwater elevation from the start of monitoring on June 15, 2008, through November 3, 2008. After November 3, water levels increased in well 0215 at a faster rate than in all other wells and reached an elevation above that of the other wells. The water elevation in well 0215 mirrored that of well 0688 after November 3. The rapid increase in groundwater elevation in well 0215 was likely due to a relatively abrupt decrease in construction pumping in early November 2008. Well 0688 is closest to the river and has continuously had the highest groundwater elevation. Because its location is somewhat removed from the main portion of the dewatering network (Figure 5), well 0688 seems more affected by river stage than by the dewatering operation. The highest water stage for the Colorado River is from about mid-May to mid-July (Figure 7). Most of the wells, in particular well 0688, had a slight increase in groundwater elevation during this
U.S. Department of Energy Analysis and Geochemical Modeling of Vanadium Contamination in Groundwater, Rifle, Colorado July 2010 Doc. No. S06654 Page 11
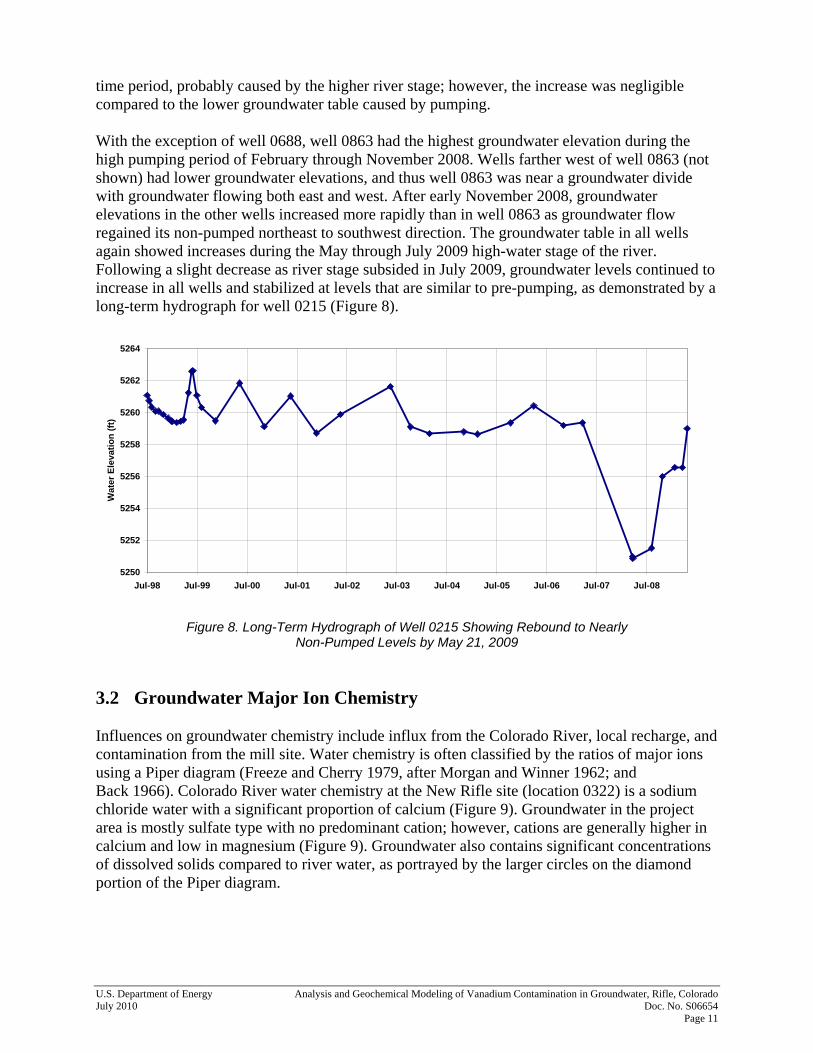
time period, probably caused by the higher river stage; however, the increase was negligible compared to the lower groundwater table caused by pumping. With the exception of well 0688, well 0863 had the highest groundwater elevation during the high pumping period of February through November 2008. Wells farther west of well 0863 (not shown) had lower groundwater elevations, and thus well 0863 was near a groundwater divide with groundwater flowing both east and west. After early November 2008, groundwater elevations in the other wells increased more rapidly than in well 0863 as groundwater flow regained its non-pumped northeast to southwest direction. The groundwater table in all wells again showed increases during the May through July 2009 high-water stage of the river. Following a slight decrease as river stage subsided in July 2009, groundwater levels continued to increase in all wells and stabilized at levels that are similar to pre-pumping, as demonstrated by a long-term hydrograph for well 0215 (Figure 8).
5250
5252
5254
5256
5258
5260
5262
5264
Jul-98 Jul-99 Jul-00 Jul-01 Jul-02 Jul-03 Jul-04 Jul-05 Jul-06 Jul-07 Jul-08
Wat
er E
leva
tion
(ft)
Figure 8. Long-Term Hydrograph of Well 0215 Showing Rebound to Nearly Non-Pumped Levels by May 21, 2009
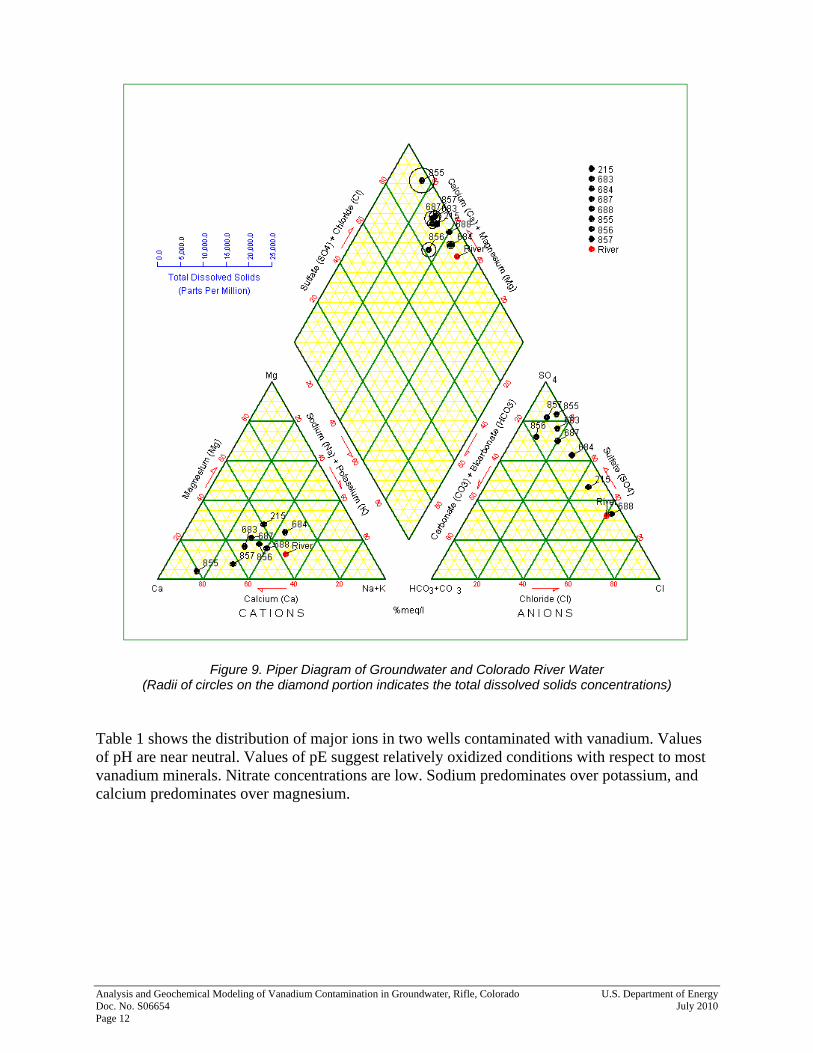
3.2 Groundwater Major Ion Chemistry Influences on groundwater chemistry include influx from the Colorado River, local recharge, and contamination from the mill site. Water chemistry is often classified by the ratios of major ions using a Piper diagram (Freeze and Cherry 1979, after Morgan and Winner 1962; and Back 1966). Colorado River water chemistry at the New Rifle site (location 0322) is a sodium chloride water with a significant proportion of calcium (Figure 9). Groundwater in the project area is mostly sulfate type with no predominant cation; however, cations are generally higher in calcium and low in magnesium (Figure 9). Groundwater also contains significant concentrations of dissolved solids compared to river water, as portrayed by the larger circles on the diamond portion of the Piper diagram.
Analysis and Geochemical Modeling of Vanadium Contamination in Groundwater, Rifle, Colorado U.S. Department of Energy Doc. No. S06654 July 2010 Page 12
Figure 9. Piper Diagram of Groundwater and Colorado River Water (Radii of circles on the diamond portion indicates the total dissolved solids concentrations)
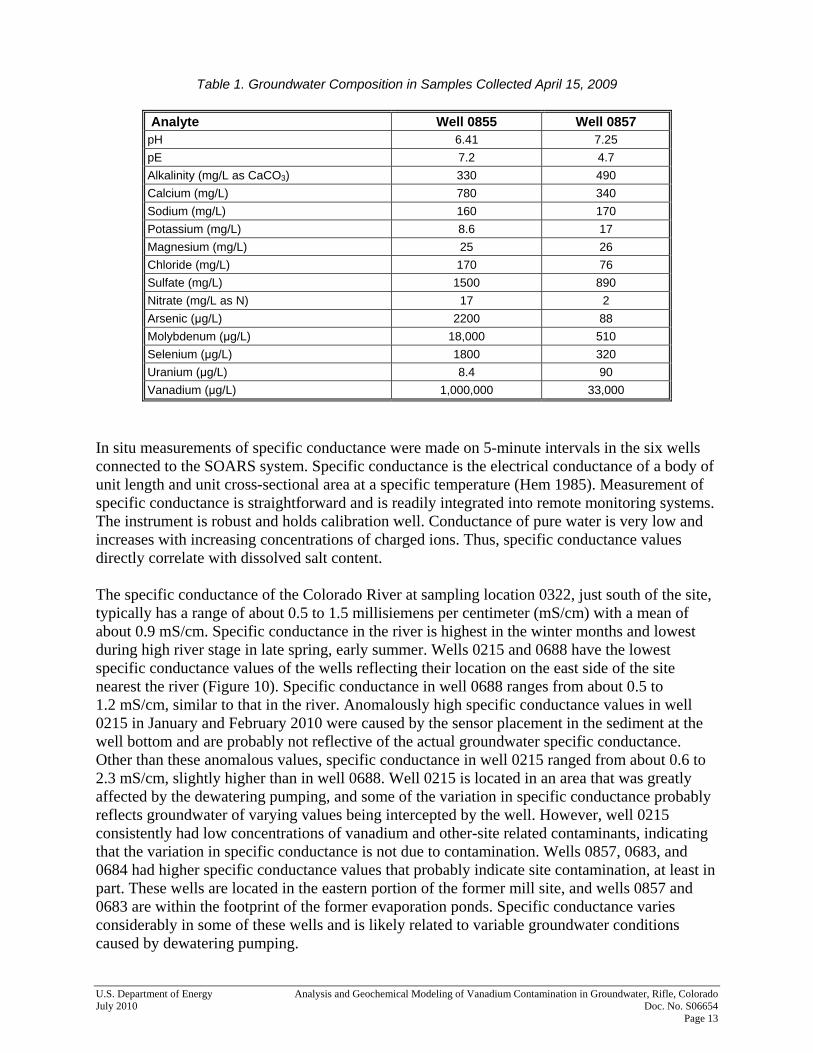
Table 1 shows the distribution of major ions in two wells contaminated with vanadium. Values of pH are near neutral. Values of pE suggest relatively oxidized conditions with respect to most vanadium minerals. Nitrate concentrations are low. Sodium predominates over potassium, and calcium predominates over magnesium.
U.S. Department of Energy Analysis and Geochemical Modeling of Vanadium Contamination in Groundwater, Rifle, Colorado July 2010 Doc. No. S06654 Page 13
Table 1. Groundwater Composition in Samples Collected April 15, 2009
Analyte Well 0855 Well 0857 pH 6.41 7.25 pE 7.2 4.7 Alkalinity (mg/L as CaCO3) 330 490 Calcium (mg/L) 780 340 Sodium (mg/L) 160 170 Potassium (mg/L) 8.6 17 Magnesium (mg/L) 25 26 Chloride (mg/L) 170 76 Sulfate (mg/L) 1500 890 Nitrate (mg/L as N) 17 2 Arsenic (μg/L) 2200 88 Molybdenum (μg/L) 18,000 510 Selenium (μg/L) 1800 320 Uranium (μg/L) 8.4 90 Vanadium (μg/L) 1,000,000 33,000
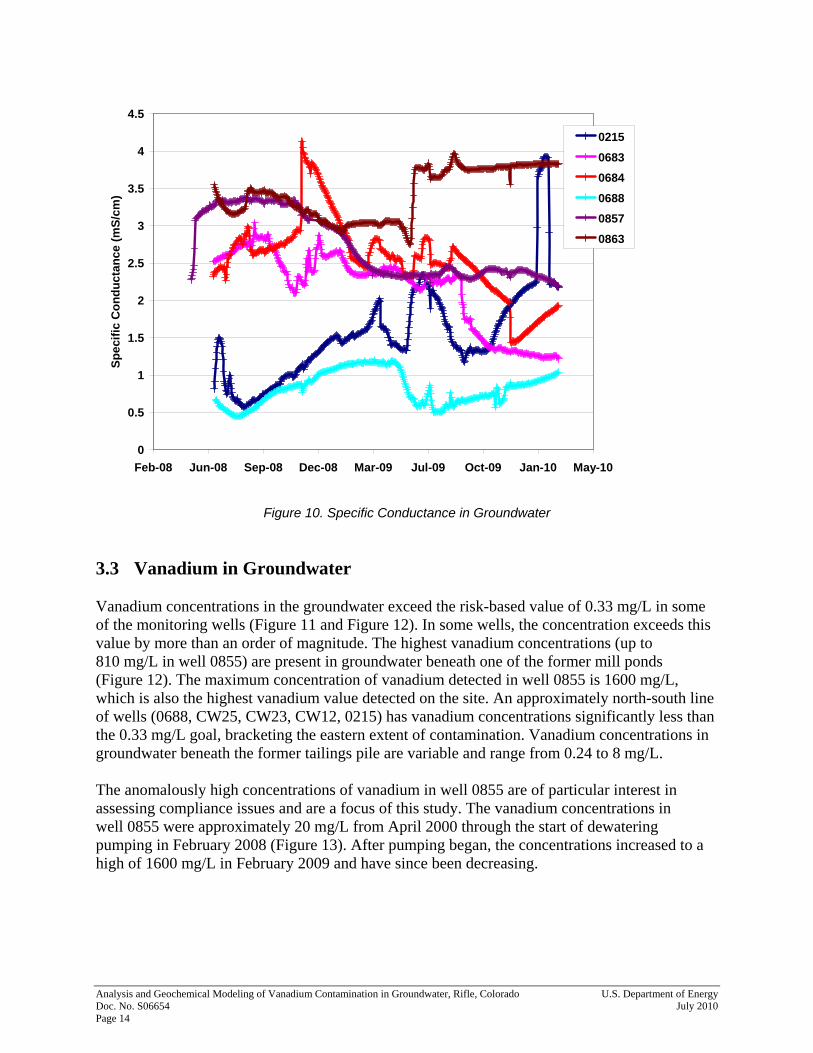
In situ measurements of specific conductance were made on 5-minute intervals in the six wells connected to the SOARS system. Specific conductance is the electrical conductance of a body of unit length and unit cross-sectional area at a specific temperature (Hem 1985). Measurement of specific conductance is straightforward and is readily integrated into remote monitoring systems. The instrument is robust and holds calibration well. Conductance of pure water is very low and increases with increasing concentrations of charged ions. Thus, specific conductance values directly correlate with dissolved salt content. The specific conductance of the Colorado River at sampling location 0322, just south of the site, typically has a range of about 0.5 to 1.5 millisiemens per centimeter (mS/cm) with a mean of about 0.9 mS/cm. Specific conductance in the river is highest in the winter months and lowest during high river stage in late spring, early summer. Wells 0215 and 0688 have the lowest specific conductance values of the wells reflecting their location on the east side of the site nearest the river (Figure 10). Specific conductance in well 0688 ranges from about 0.5 to 1.2 mS/cm, similar to that in the river. Anomalously high specific conductance values in well 0215 in January and February 2010 were caused by the sensor placement in the sediment at the well bottom and are probably not reflective of the actual groundwater specific conductance. Other than these anomalous values, specific conductance in well 0215 ranged from about 0.6 to 2.3 mS/cm, slightly higher than in well 0688. Well 0215 is located in an area that was greatly affected by the dewatering pumping, and some of the variation in specific conductance probably reflects groundwater of varying values being intercepted by the well. However, well 0215 consistently had low concentrations of vanadium and other-site related contaminants, indicating that the variation in specific conductance is not due to contamination. Wells 0857, 0683, and 0684 had higher specific conductance values that probably indicate site contamination, at least in part. These wells are located in the eastern portion of the former mill site, and wells 0857 and 0683 are within the footprint of the former evaporation ponds. Specific conductance varies considerably in some of these wells and is likely related to variable groundwater conditions caused by dewatering pumping.
Analysis and Geochemical Modeling of Vanadium Contamination in Groundwater, Rifle, Colorado U.S. Department of Energy Doc. No. S06654 July 2010 Page 14
0
0.5
1
1.5
2
2.5
3
3.5
4
4.5
Feb-08 Jun-08 Sep-08 Dec-08 Mar-09 Jul-09 Oct-09 Jan-10 May-10
Spec
ific
Con
duct
ance
(mS/
cm)
0215
06830684
06880857
0863
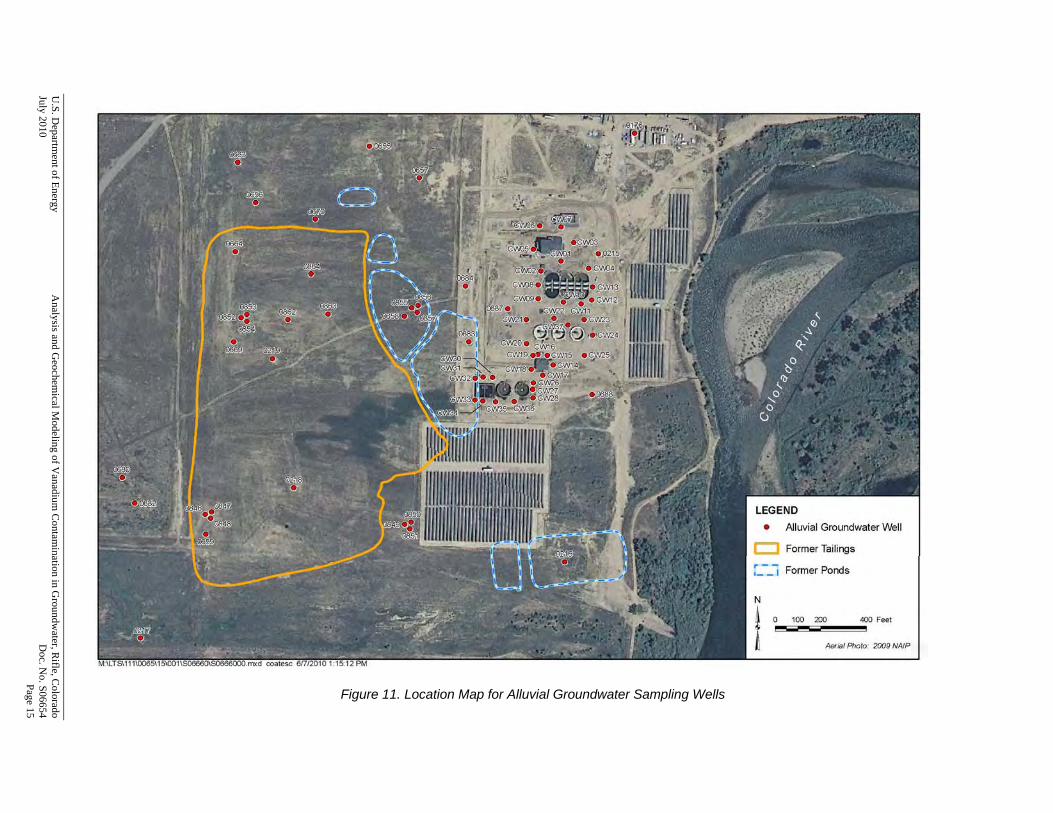
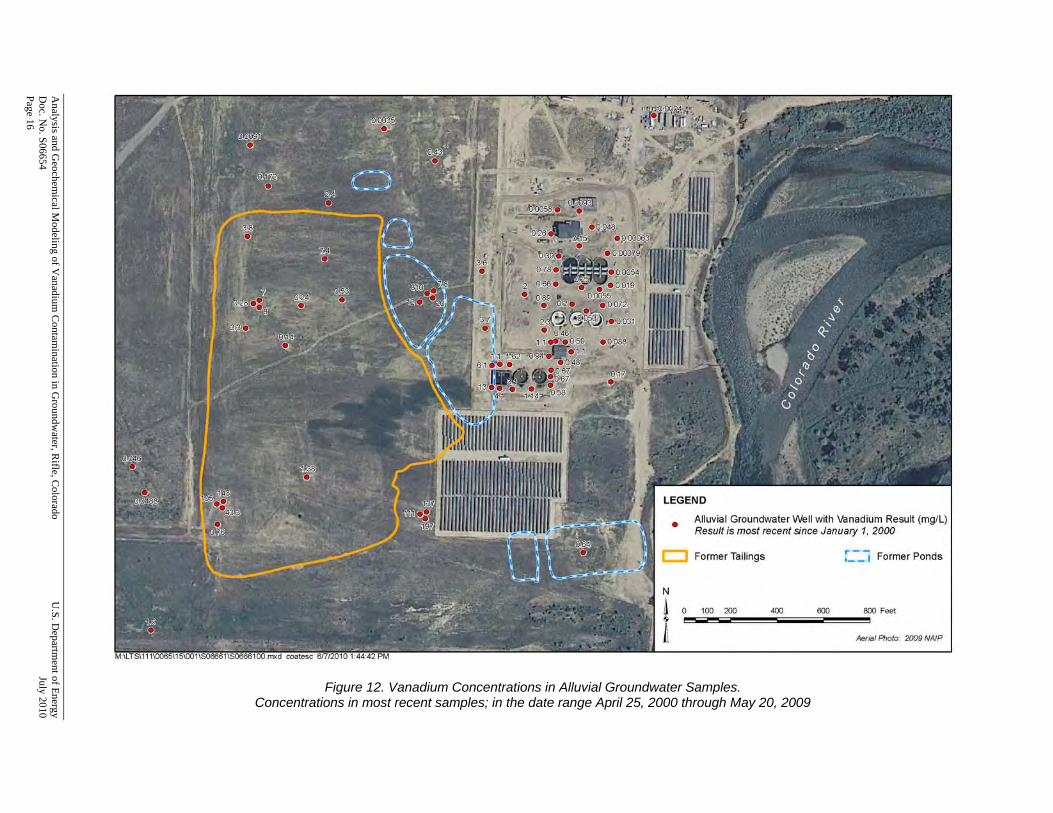
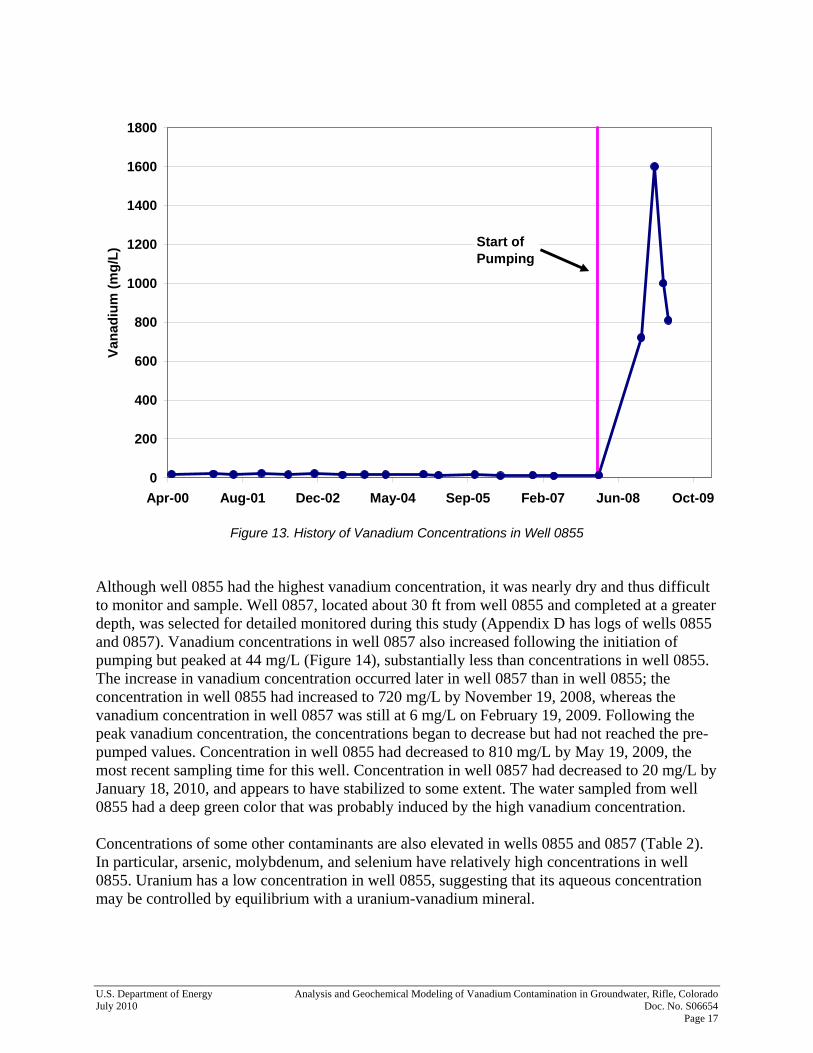
Figure 10. Specific Conductance in Groundwater 3.3 Vanadium in Groundwater Vanadium concentrations in the groundwater exceed the risk-based value of 0.33 mg/L in some of the monitoring wells (Figure 11 and Figure 12). In some wells, the concentration exceeds this value by more than an order of magnitude. The highest vanadium concentrations (up to 810 mg/L in well 0855) are present in groundwater beneath one of the former mill ponds (Figure 12). The maximum concentration of vanadium detected in well 0855 is 1600 mg/L, which is also the highest vanadium value detected on the site. An approximately north-south line of wells (0688, CW25, CW23, CW12, 0215) has vanadium concentrations significantly less than the 0.33 mg/L goal, bracketing the eastern extent of contamination. Vanadium concentrations in groundwater beneath the former tailings pile are variable and range from 0.24 to 8 mg/L. The anomalously high concentrations of vanadium in well 0855 are of particular interest in assessing compliance issues and are a focus of this study. The vanadium concentrations in well 0855 were approximately 20 mg/L from April 2000 through the start of dewatering pumping in February 2008 (Figure 13). After pumping began, the concentrations increased to a high of 1600 mg/L in February 2009 and have since been decreasing.
U.S. D
epartment of Energy
Analysis and G
eochemical M
odeling of Vanadium
Contam
ination in Groundw
ater, Rifle, C
olorado July 2010
D
oc. No. S06654
Page 15
Figure 11. Location Map for Alluvial Groundwater Sampling Wells
Analysis and G
eochemical M
odeling of Vanadium
Contam
ination in Groundw
ater, Rifle, C
olorado U
.S. Departm
ent of Energy D
oc. No. S06654
July 2010
Page 16
Figure 12. Vanadium Concentrations in Alluvial Groundwater Samples. Concentrations in most recent samples; in the date range April 25, 2000 through May 20, 2009
U.S. Department of Energy Analysis and Geochemical Modeling of Vanadium Contamination in Groundwater, Rifle, Colorado July 2010 Doc. No. S06654 Page 17
0
200
400
600
800
1000
1200
1400
1600
1800
Apr-00 Aug-01 Dec-02 May-04 Sep-05 Feb-07 Jun-08 Oct-09
Vana
dium
(mg/
L)
Start of Pumping
Figure 13. History of Vanadium Concentrations in Well 0855
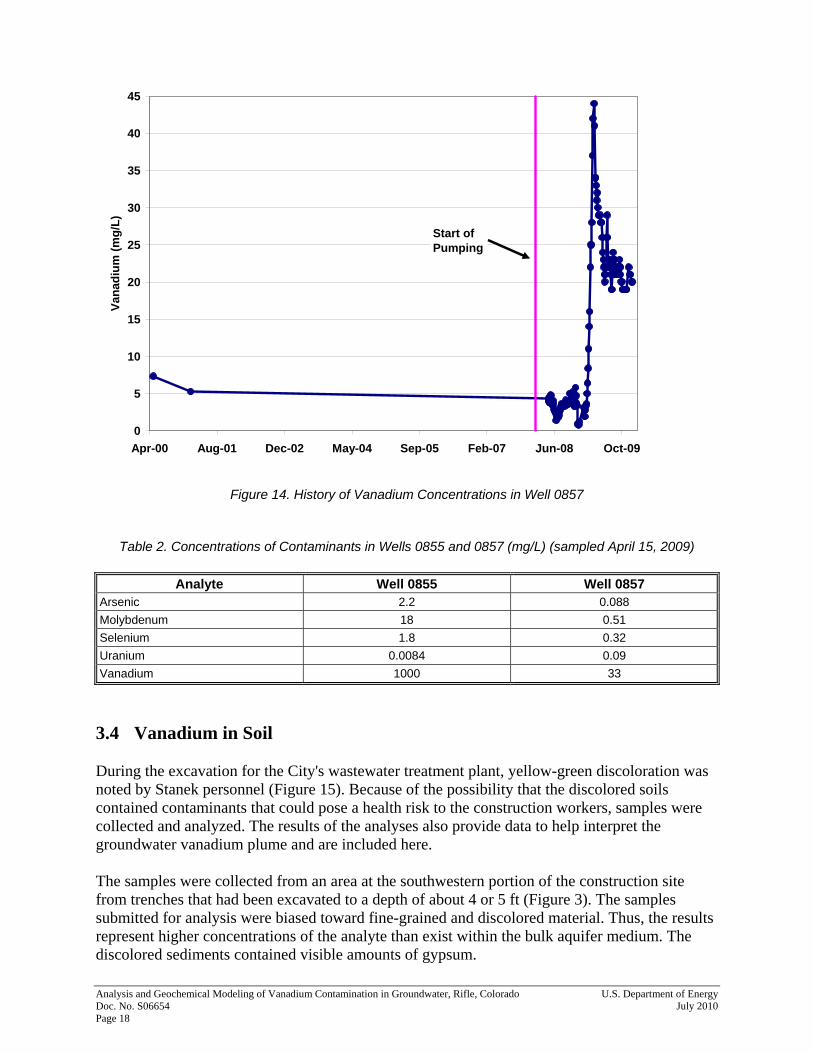
Although well 0855 had the highest vanadium concentration, it was nearly dry and thus difficult to monitor and sample. Well 0857, located about 30 ft from well 0855 and completed at a greater depth, was selected for detailed monitored during this study (Appendix D has logs of wells 0855 and 0857). Vanadium concentrations in well 0857 also increased following the initiation of pumping but peaked at 44 mg/L (Figure 14), substantially less than concentrations in well 0855. The increase in vanadium concentration occurred later in well 0857 than in well 0855; the concentration in well 0855 had increased to 720 mg/L by November 19, 2008, whereas the vanadium concentration in well 0857 was still at 6 mg/L on February 19, 2009. Following the peak vanadium concentration, the concentrations began to decrease but had not reached the pre-pumped values. Concentration in well 0855 had decreased to 810 mg/L by May 19, 2009, the most recent sampling time for this well. Concentration in well 0857 had decreased to 20 mg/L by January 18, 2010, and appears to have stabilized to some extent. The water sampled from well 0855 had a deep green color that was probably induced by the high vanadium concentration. Concentrations of some other contaminants are also elevated in wells 0855 and 0857 (Table 2). In particular, arsenic, molybdenum, and selenium have relatively high concentrations in well 0855. Uranium has a low concentration in well 0855, suggesting that its aqueous concentration may be controlled by equilibrium with a uranium-vanadium mineral.
Analysis and Geochemical Modeling of Vanadium Contamination in Groundwater, Rifle, Colorado U.S. Department of Energy Doc. No. S06654 July 2010 Page 18
0
5
10
15
20
25
30
35
40
45
Apr-00 Aug-01 Dec-02 May-04 Sep-05 Feb-07 Jun-08 Oct-09
Vana
dium
(mg/
L)
Start of Pumping
Figure 14. History of Vanadium Concentrations in Well 0857
Table 2. Concentrations of Contaminants in Wells 0855 and 0857 (mg/L) (sampled April 15, 2009)
Analyte Well 0855 Well 0857 Arsenic 2.2 0.088 Molybdenum 18 0.51 Selenium 1.8 0.32 Uranium 0.0084 0.09 Vanadium 1000 33
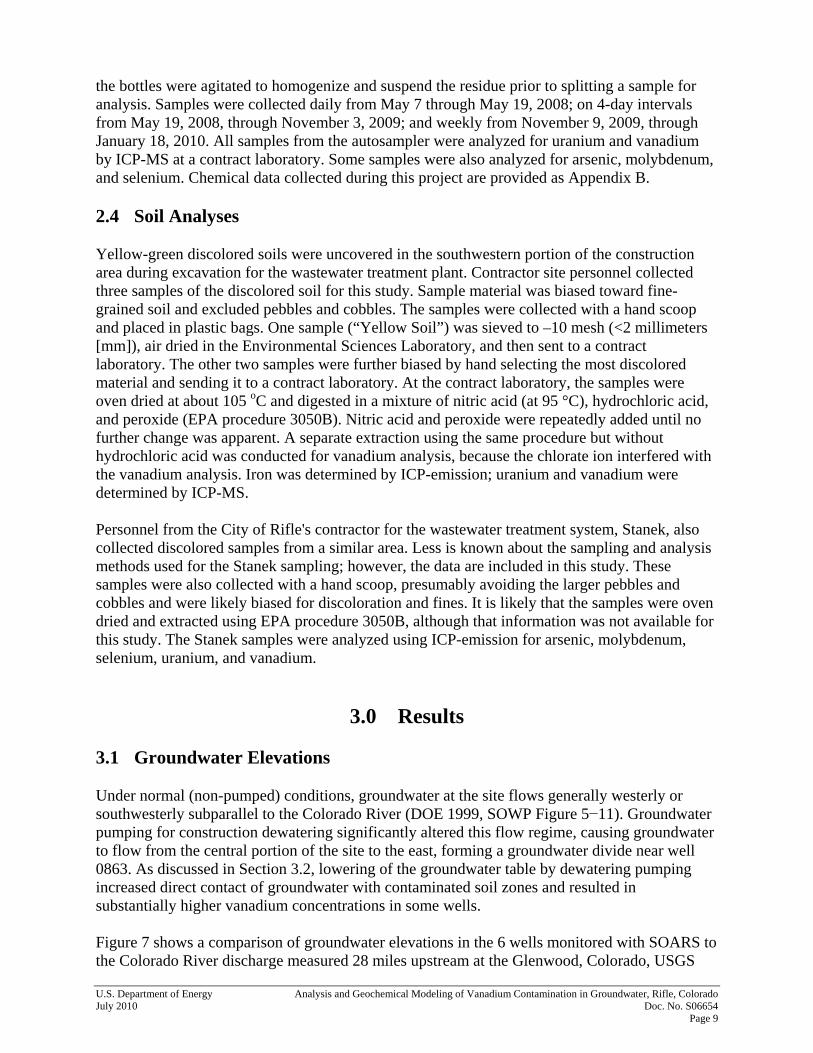
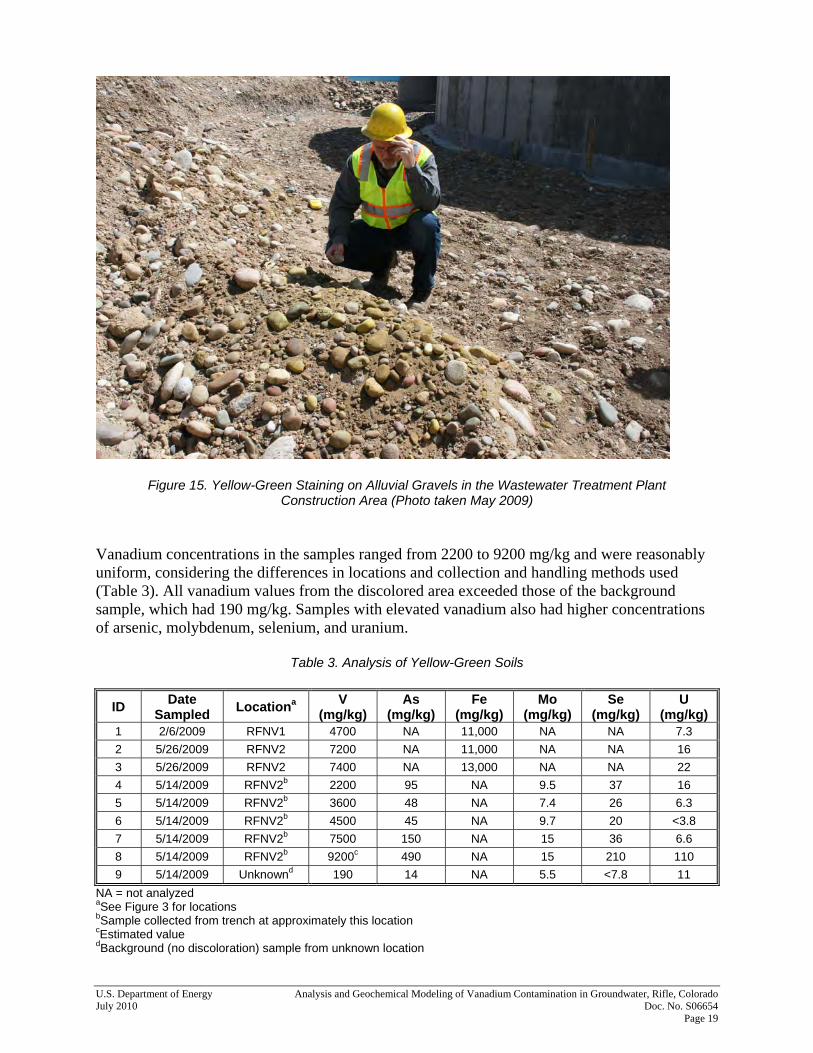
3.4 Vanadium in Soil During the excavation for the City's wastewater treatment plant, yellow-green discoloration was noted by Stanek personnel (Figure 15). Because of the possibility that the discolored soils contained contaminants that could pose a health risk to the construction workers, samples were collected and analyzed. The results of the analyses also provide data to help interpret the groundwater vanadium plume and are included here. The samples were collected from an area at the southwestern portion of the construction site from trenches that had been excavated to a depth of about 4 or 5 ft (Figure 3). The samples submitted for analysis were biased toward fine-grained and discolored material. Thus, the results represent higher concentrations of the analyte than exist within the bulk aquifer medium. The discolored sediments contained visible amounts of gypsum.
U.S. Department of Energy Analysis and Geochemical Modeling of Vanadium Contamination in Groundwater, Rifle, Colorado July 2010 Doc. No. S06654 Page 19
Figure 15. Yellow-Green Staining on Alluvial Gravels in the Wastewater Treatment Plant Construction Area (Photo taken May 2009)
Vanadium concentrations in the samples ranged from 2200 to 9200 mg/kg and were reasonably uniform, considering the differences in locations and collection and handling methods used (Table 3). All vanadium values from the discolored area exceeded those of the background sample, which had 190 mg/kg. Samples with elevated vanadium also had higher concentrations of arsenic, molybdenum, selenium, and uranium.
Table 3. Analysis of Yellow-Green Soils
ID Date Sampled Locationa V
(mg/kg) As
(mg/kg) Fe
(mg/kg) Mo
(mg/kg) Se
(mg/kg) U
(mg/kg) 1 2/6/2009 RFNV1 4700 NA 11,000 NA NA 7.3 2 5/26/2009 RFNV2 7200 NA 11,000 NA NA 16 3 5/26/2009 RFNV2 7400 NA 13,000 NA NA 22 4 5/14/2009 RFNV2b 2200 95 NA 9.5 37 16 5 5/14/2009 RFNV2b 3600 48 NA 7.4 26 6.3 6 5/14/2009 RFNV2b 4500 45 NA 9.7 20 <3.8 7 5/14/2009 RFNV2b 7500 150 NA 15 36 6.6 8 5/14/2009 RFNV2b 9200c 490 NA 15 210 110 9 5/14/2009 Unknownd 190 14 NA 5.5 <7.8 11
NA = not analyzed aSee Figure 3 for locations bSample collected from trench at approximately this location cEstimated value dBackground (no discoloration) sample from unknown location
Analysis and Geochemical Modeling of Vanadium Contamination in Groundwater, Rifle, Colorado U.S. Department of Energy Doc. No. S06654 July 2010 Page 20
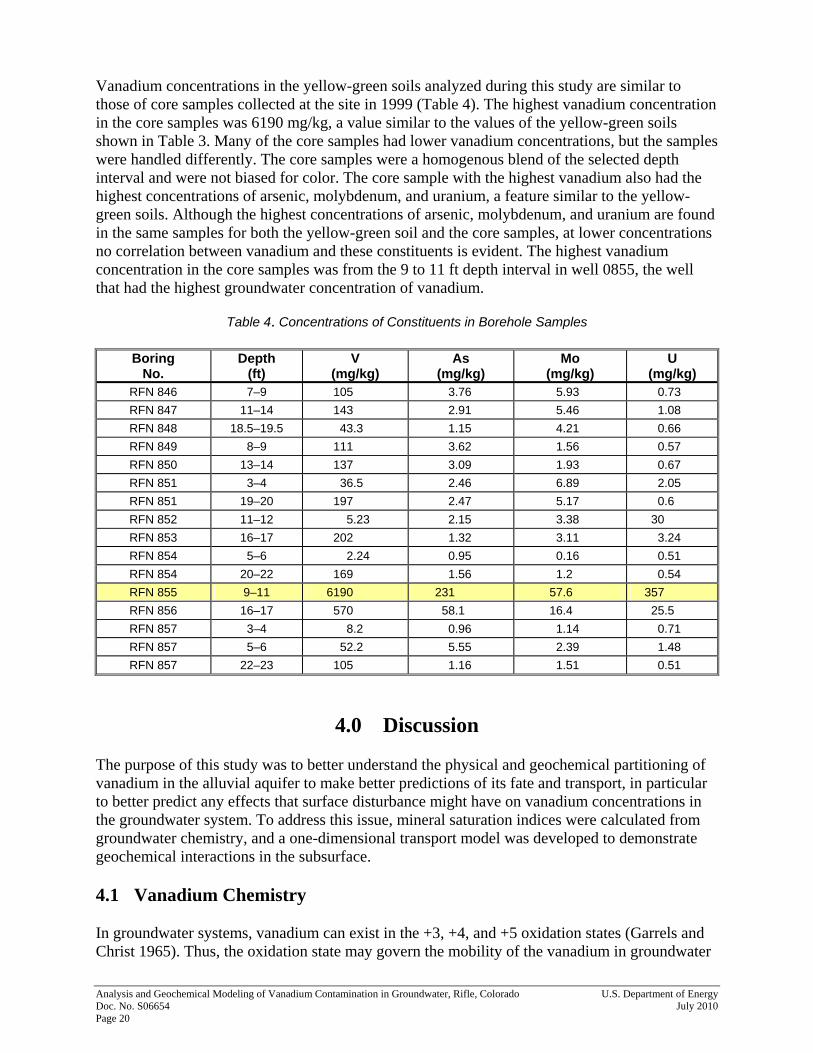
Vanadium concentrations in the yellow-green soils analyzed during this study are similar to those of core samples collected at the site in 1999 (Table 4). The highest vanadium concentration in the core samples was 6190 mg/kg, a value similar to the values of the yellow-green soils shown in Table 3. Many of the core samples had lower vanadium concentrations, but the samples were handled differently. The core samples were a homogenous blend of the selected depth interval and were not biased for color. The core sample with the highest vanadium also had the highest concentrations of arsenic, molybdenum, and uranium, a feature similar to the yellow-green soils. Although the highest concentrations of arsenic, molybdenum, and uranium are found in the same samples for both the yellow-green soil and the core samples, at lower concentrations no correlation between vanadium and these constituents is evident. The highest vanadium concentration in the core samples was from the 9 to 11 ft depth interval in well 0855, the well that had the highest groundwater concentration of vanadium.
Table 4. Concentrations of Constituents in Borehole Samples
Boring No.
Depth (ft)
V (mg/kg)
As (mg/kg)
Mo (mg/kg)
U (mg/kg)
RFN 846 7–9 105 3.76 5.93 0.73 RFN 847 11–14 143 2.91 5.46 1.08 RFN 848 18.5–19.5 43.3 1.15 4.21 0.66 RFN 849 8–9 111 3.62 1.56 0.57 RFN 850 13–14 137 3.09 1.93 0.67 RFN 851 3–4 36.5 2.46 6.89 2.05 RFN 851 19–20 197 2.47 5.17 0.6 RFN 852 11–12 5.23 2.15 3.38 30 RFN 853 16–17 202 1.32 3.11 3.24 RFN 854 5–6 2.24 0.95 0.16 0.51 RFN 854 20–22 169 1.56 1.2 0.54 RFN 855 9–11 6190 231 57.6 357 RFN 856 16–17 570 58.1 16.4 25.5 RFN 857 3–4 8.2 0.96 1.14 0.71 RFN 857 5–6 52.2 5.55 2.39 1.48 RFN 857 22–23 105 1.16 1.51 0.51
4.0 Discussion The purpose of this study was to better understand the physical and geochemical partitioning of vanadium in the alluvial aquifer to make better predictions of its fate and transport, in particular to better predict any effects that surface disturbance might have on vanadium concentrations in the groundwater system. To address this issue, mineral saturation indices were calculated from groundwater chemistry, and a one-dimensional transport model was developed to demonstrate geochemical interactions in the subsurface. 4.1 Vanadium Chemistry In groundwater systems, vanadium can exist in the +3, +4, and +5 oxidation states (Garrels and Christ 1965). Thus, the oxidation state may govern the mobility of the vanadium in groundwater
U.S. Department of Energy Analysis and Geochemical Modeling of Vanadium Contamination in Groundwater, Rifle, Colorado July 2010 Doc. No. S06654 Page 21
systems. Vanadate (vanadium +5) is the most common oxidation state in groundwater systems and forms anionic complexes with oxygen and hydroxide (Hem 1985). Solubility of metal vanadates, in particular ferrous vanadate, may control mobility of vanadium in groundwater systems, and vanadium has high solubility in alkaline solution (Hem 1985). Hem (1985) provides some general concentration data for vanadium. Most public water supplies have less than 0.004 mg/L vanadium, although one system had a concentration of 0.070 mg/L. Average river water worldwide has 0.0009 mg/L vanadium. Some of the highest naturally occurring vanadium concentrations are found in thermal springs in concentrations up to several tenths of a milligram per liter. The concentration in seawater is 0.0002 mg/L, and the predominant species is VO2(OH)3
2– in the +5 oxidation state (Evans and Landergren 1974). Evans and Landergren (1974) provide estimates of vanadium concentrations in the earth. The average concentration of vanadium in the earth's crust is 120 mg/kg. The highest concentrations of vanadium in naturally occurring minerals are found in magnetite and hematite, and iron ores have high vanadium concentrations. Red beds of the Colorado Plateau have relatively high concentrations of vanadium. Vanadium adsorbs to a variety of minerals; adsorption to ferric oxide is more efficient than adsorption to manganese oxide, montmorillonite, or organic substances (Evans and Landergren 1974). Amorphous ferric oxyhydroxide shows high desorption of vanadium above pH 11 (Dzombak and Morel 1990). The distribution of vanadium in soils often correlates with the iron distribution, suggesting precipitation as ferrous vanadate or adsorption to ferric oxyhydroxide (Rai and Zachara 1986). 4.2 Redox State of New Rifle Alluvial Groundwater Because vanadium occurs naturally in a variety of oxidation states, the oxidation of the groundwater is important in evaluating partitioning of vanadium between the mobile aqueous phase and the immobile solid phase. One approach to evaluating oxidation state is to examine existing New Rifle groundwater data in pE-pH space (Figure 16). The groundwater analyses form a tight cluster in an area with pE ranging from about 1 to 9, and pH ranging about 6.5 to 7.5. Groundwater samples containing high vanadium concentrations (more than 5 mg/L) form a slightly tighter cluster in the central portion of the same area. A smaller cluster of points ranging from about 10 to 13 is also present at higher pE values. A scattering of outliers that have pH values in excess of 9 are likely due to measurement errors. With the exception of two points, the New Rifle groundwater data all plot in the V(+5) field, suggesting that the groundwater is oxidized relative to the vanadium system. Vanadium (+4) is not likely to have an influence on the New Rifle groundwater system, since it normally only occurs at low pH.
Analysis and Geochemical Modeling of Vanadium Contamination in Groundwater, Rifle, Colorado U.S. Department of Energy Doc. No. S06654 July 2010 Page 22
Figure 16. pE-pH Diagram Showing Lines of Equal Activities for Aqueous Vanadium Species, Stability Field for Fe(VO3)2, and Measured Values of New Rifle Alluvial Aquifer Groundwater.
Orange symbols represent New Rifle groundwater vanadium analyses greater than 5 mg/L. Molar concentration of iron is 1 millimol per liter.
Eh values as calculated from ORP measurements are problematic in several ways. The measurement itself relies on a potential between the solution being measured and a reference electrode that are connected via a liquid junction. Ions must flow from the reference solution to the water in which the electrode is immersed and vice versa, with potential for salt contamination of the lower ionic strength solution (Langmuir 1971). Also, the liquid junction can become fouled and cause measurement errors. Problems with liquid junction and salt contamination may increase for probes immersed in well water for long time periods. Eh is often used to characterize the oxidation potential of a solution; however, this interpretation requires that the reactions being measured are fully and rapidly reversible, a condition rarely encountered in natural systems. Because of these problems with Eh measurements, the investigation also included “redox couples” that might define the oxidation state of the system, or at least help to evaluate if various oxidation reactions are at equilibrium (Table 5). The pE values calculated from these redox
U.S. Department of Energy Analysis and Geochemical Modeling of Vanadium Contamination in Groundwater, Rifle, Colorado July 2010 Doc. No. S06654 Page 23
couples using the geochemical speciation program PHREEQC (Parkhurst and Appelo 1999) vary from 5.0 to 15 and are all suggestive of an oxidized groundwater system with respect to the vanadium system.
Table 5. Redox Parameters Calculated from Measured Concentrations of Redox Couples in Two Contaminated New Rifle Wells
Redox Couple Wella ORP
(mV) Eh
(mV) pE
Measured ORP 0855 0857
190 35
430 275
7.2 4.7
Fe2+/Fe3+ 0855 0857
265 44
505 284
8.9 5.0
N3–/N5+ 0855 0857
190 122
430 362
7.6 6.4
O2–/O0 0855 0857
608 556
848 796
15 14
aSamples were collected on 4/15/2009. Often, the color of sediment can be used to draw general conclusions about the oxidation state. Yellow to red colors infer oxidized conditions with respect to the iron system because of the likely presence of iron oxide or oxyhydroxide minerals. In contrast, black coloration is often due to the presence of iron sulfide minerals and depicts more reducing conditions. Since the iron system has some chemical similarities to the vanadium system, inferences about the iron system might also apply to the vanadium system. The cores from the New Rifle site, including those within the vanadium contaminated area, are typically yellowish brown or light brown, supporting the inference of generally oxidizing conditions. 4.3 Mineral Saturation Indices Mineral saturation indices were calculated from groundwater chemistry in two wells (0855 and 0857) located in an area containing the highest vanadium concentrations in groundwater. This effort was aimed at identifying possible mineralogical controls on the vanadium in the groundwater. Speciation and mineral saturation were calculated using the geochemical speciation program PHREEQC (Parkhurst and Appelo 1999). Because the thermodynamic database supplied with PHREEQC does not contain vanadium, the database was supplemented with the vanadium system from Peterson et al. (1987). A positive saturation index for a mineral indicates that the aqueous phase is oversaturated with that mineral, and the mineral would tend to precipitate from the water. A negative saturation index indicates that the mineral is undersaturated and, if present, would dissolve. In a system at equilibrium with both solid and aqueous phases, minerals would have saturation indices of zero. In the absence of disequilibrium, one or more minerals with saturation indices near zero are the most likely to be present in the subsurface system. Because of inherent uncertainties in measured concentrations and thermodynamic parameters, small deviations from zero are expected; thus, it was considered that minerals with saturation indices between minus one and plus one may be present. Two uranium-vanadium minerals, tyuyamunite (Ca0.5UO2VO4) and carnotite (KUO2VO4), are closest to equilibrium saturation in groundwater from wells 0855 and 0857 (Figure 17 and Figure 18). The vanadium minerals are color coded in the figures; minerals with red text are those with vanadate (vanadium in the +5 oxidation state). Ferrous vanadate (Fe0.5VO3) is slightly
Analysis and Geochemical Modeling of Vanadium Contamination in Groundwater, Rifle, Colorado U.S. Department of Energy Doc. No. S06654 July 2010 Page 24
oversaturated in both wells, and calcium vanadate (Ca0.5VO3) is slightly undersaturated. Based on this geochemical speciation approach, these four vanadate minerals are the most likely candidates to dominate the vanadium mineralogy in the alluvium. Analyses of the samples of yellow-green discolored soils and core samples provide some indication of mineralogy. The molar amounts of vanadium are approximately two orders of magnitude more than the molar amounts of uranium (Table 3 and Table 4) suggesting the dominance of discrete vanadium minerals over uranium-vanadium minerals.
Figure 17. Vanadium Mineral Saturation Indices in Groundwater Sampled from Well 0855 on 4/15/2010. Oxidation states of vanadium are color coded. Minerals near the top are nearest to being in equilibrium
with the water sample.
VVCl2VCl3
VOV4O7
V3O5VOCl
V(OH)3VO1.5
Na2VO3.5VO2Cl
VOSO4
Na3VO4VOCl2
V6O13
VO(OH)2
MgVO3.5Ca1.5VO4
Mg0.5VO3VO2
NaVO3VO2.5
NH4VO3Mn0.5VO3
CaVO3.5Ca0.5VO3
Ca0.5UO2VO4Fe0.5VO3
KUO2VO4
-100 -80 -60 -40 -20 0 20
Saturation Index
Vanadium Oxidation States
Red = +5Blue = +4 to 4.33Black = 0 to +3.5
U.S. Department of Energy Analysis and Geochemical Modeling of Vanadium Contamination in Groundwater, Rifle, Colorado July 2010 Doc. No. S06654 Page 25
Figure 18. Vanadium Mineral Saturation Indices in Groundwater Sampled from Well 0857 on 4/15/2010. Oxidation states of vanadium are color coded. Minerals near the top are nearest to being in equilibrium
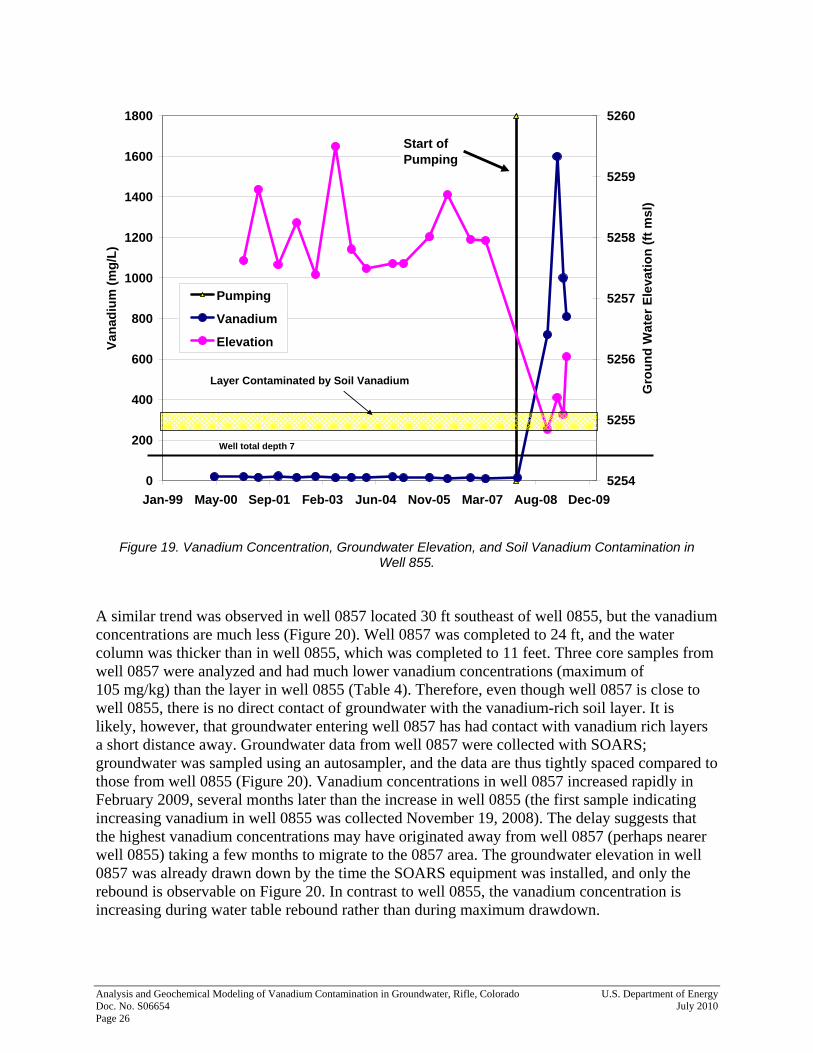
with the water sample. 4.4 Correlation of Vanadium Concentration with Dewatering Event The highest concentrations of vanadium in well 0855 and 0857 groundwater are in samples collected after the onset of groundwater pumping for construction of the City's wastewater treatment plant. Pumping began in February 2008 and caused drawdown of the groundwater table in the area of wells 0855 and 0857. The drawdown was about 3 ft in well 0855, which was sufficient to nearly dry up the well (Figure 19). A soil layer containing the highest vanadium contamination detected at the site exists near the bottom of the well (Table 4). The substantial increase (to 1600 mg/L) in vanadium concentration in the groundwater of well 0855 is attributed to the thinning of the groundwater table, which caused direct contact of a relatively small amount of water with the contaminated soil layer. Before pumping lowered the groundwater table, the column of water in the well had contact with a range of soils, most of which were lower in vanadium concentration than the layer depicted in Figure 19.
VVCl3
VCl2
VO
V4O7VOCl
V3O5
V(OH)3VO1.5MgVO3.5Ca1.5VO4
VOCl2
VOSO4
Ca0.5VO3
Ca0.5UO2VO4Fe0.5VO3
KUO2VO4
CaVO3.5Mn0.5VO3
NH4VO3
VO2.5NaVO3
Mg0.5VO3
Na2VO3.5VO2Cl
Na3VO4
VO2
VO(OH)2
V6O13
-90 -80 -70 -60 -50 -40 -30 -20 -10 0 10
Saturation Index
Vanadium Oxidation States
Red = +5Blue = +4 to 4.33Black = 0 to +3.5
Analysis and Geochemical Modeling of Vanadium Contamination in Groundwater, Rifle, Colorado U.S. Department of Energy Doc. No. S06654 July 2010 Page 26
0
200
400
600
800
1000
1200
1400
1600
1800
Jan-99 May-00 Sep-01 Feb-03 Jun-04 Nov-05 Mar-07 Aug-08 Dec-09
Vana
dium
(mg/
L)
5254
5255
5256
5257
5258
5259
5260
Gro
und
Wat
er E
leva
tion
(ft m
sl)
Pumping
Vanadium
Elevation
Layer Contaminated by Soil Vanadium
Well total depth 7
Start of Pumping
Figure 19. Vanadium Concentration, Groundwater Elevation, and Soil Vanadium Contamination in Well 855.
A similar trend was observed in well 0857 located 30 ft southeast of well 0855, but the vanadium concentrations are much less (Figure 20). Well 0857 was completed to 24 ft, and the water column was thicker than in well 0855, which was completed to 11 feet. Three core samples from well 0857 were analyzed and had much lower vanadium concentrations (maximum of 105 mg/kg) than the layer in well 0855 (Table 4). Therefore, even though well 0857 is close to well 0855, there is no direct contact of groundwater with the vanadium-rich soil layer. It is likely, however, that groundwater entering well 0857 has had contact with vanadium rich layers a short distance away. Groundwater data from well 0857 were collected with SOARS; groundwater was sampled using an autosampler, and the data are thus tightly spaced compared to those from well 0855 (Figure 20). Vanadium concentrations in well 0857 increased rapidly in February 2009, several months later than the increase in well 0855 (the first sample indicating increasing vanadium in well 0855 was collected November 19, 2008). The delay suggests that the highest vanadium concentrations may have originated away from well 0857 (perhaps nearer well 0855) taking a few months to migrate to the 0857 area. The groundwater elevation in well 0857 was already drawn down by the time the SOARS equipment was installed, and only the rebound is observable on Figure 20. In contrast to well 0855, the vanadium concentration is increasing during water table rebound rather than during maximum drawdown.
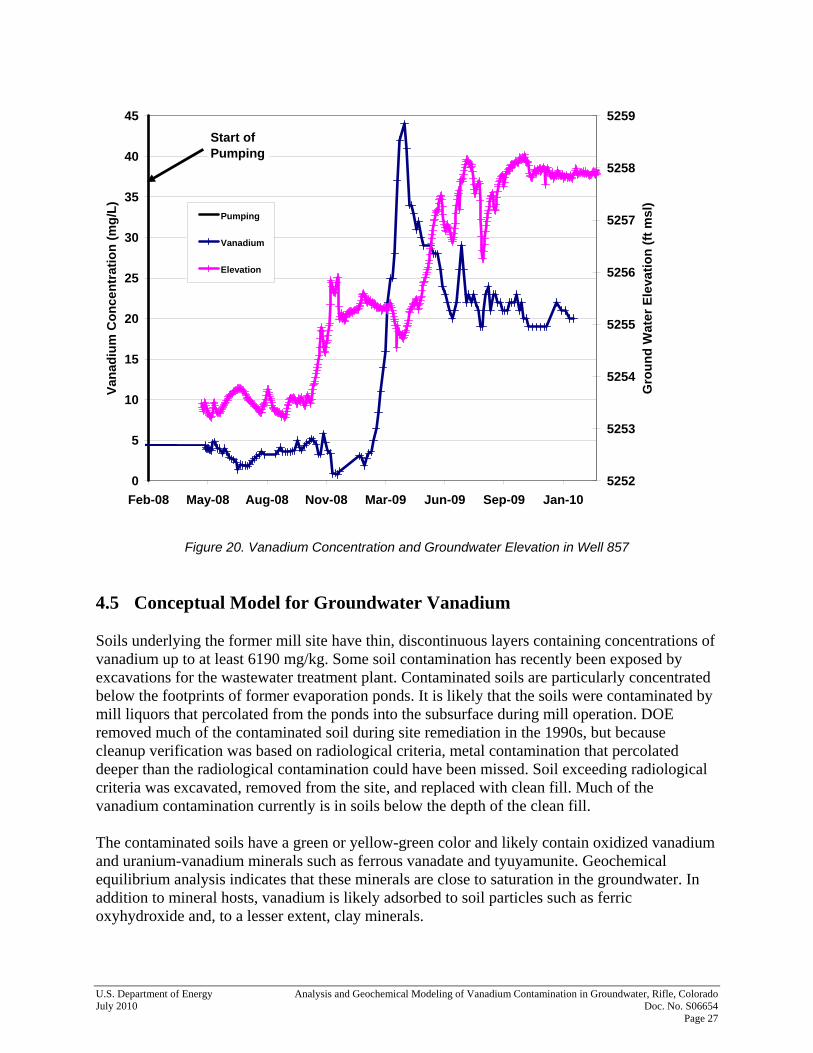
U.S. Department of Energy Analysis and Geochemical Modeling of Vanadium Contamination in Groundwater, Rifle, Colorado July 2010 Doc. No. S06654 Page 27
0
5
10
15
20
25
30
35
40
45
Feb-08 May-08 Aug-08 Nov-08 Mar-09 Jun-09 Sep-09 Jan-10
Vana
dium
Con
cent
ratio
n (m
g/L)
5252
5253
5254
5255
5256
5257
5258
5259
Gro
und
Wat
er E
leva
tion
(ft m
sl)
Pumping
Vanadium
Elevation
Start of Pumping
Figure 20. Vanadium Concentration and Groundwater Elevation in Well 857 4.5 Conceptual Model for Groundwater Vanadium Soils underlying the former mill site have thin, discontinuous layers containing concentrations of vanadium up to at least 6190 mg/kg. Some soil contamination has recently been exposed by excavations for the wastewater treatment plant. Contaminated soils are particularly concentrated below the footprints of former evaporation ponds. It is likely that the soils were contaminated by mill liquors that percolated from the ponds into the subsurface during mill operation. DOE removed much of the contaminated soil during site remediation in the 1990s, but because cleanup verification was based on radiological criteria, metal contamination that percolated deeper than the radiological contamination could have been missed. Soil exceeding radiological criteria was excavated, removed from the site, and replaced with clean fill. Much of the vanadium contamination currently is in soils below the depth of the clean fill. The contaminated soils have a green or yellow-green color and likely contain oxidized vanadium and uranium-vanadium minerals such as ferrous vanadate and tyuyamunite. Geochemical equilibrium analysis indicates that these minerals are close to saturation in the groundwater. In addition to mineral hosts, vanadium is likely adsorbed to soil particles such as ferric oxyhydroxide and, to a lesser extent, clay minerals.
Analysis and Geochemical Modeling of Vanadium Contamination in Groundwater, Rifle, Colorado U.S. Department of Energy Doc. No. S06654 July 2010 Page 28
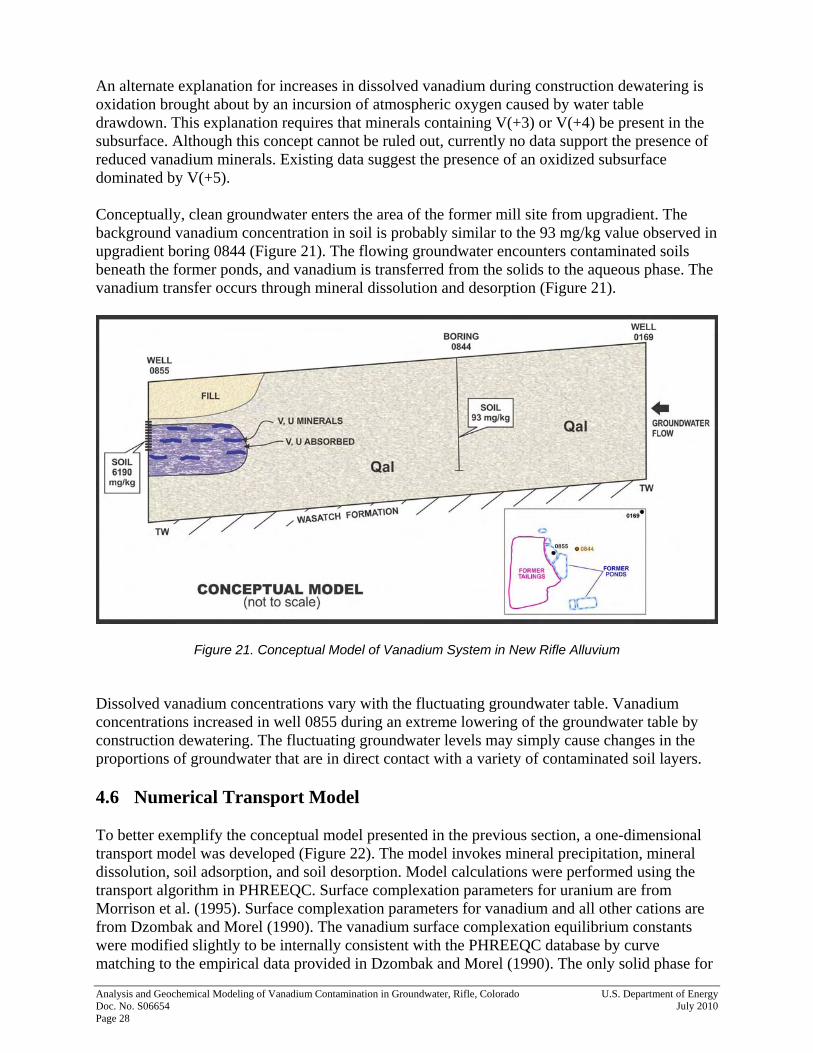
An alternate explanation for increases in dissolved vanadium during construction dewatering is oxidation brought about by an incursion of atmospheric oxygen caused by water table drawdown. This explanation requires that minerals containing V(+3) or V(+4) be present in the subsurface. Although this concept cannot be ruled out, currently no data support the presence of reduced vanadium minerals. Existing data suggest the presence of an oxidized subsurface dominated by V(+5). Conceptually, clean groundwater enters the area of the former mill site from upgradient. The background vanadium concentration in soil is probably similar to the 93 mg/kg value observed in upgradient boring 0844 (Figure 21). The flowing groundwater encounters contaminated soils beneath the former ponds, and vanadium is transferred from the solids to the aqueous phase. The vanadium transfer occurs through mineral dissolution and desorption (Figure 21).
Figure 21. Conceptual Model of Vanadium System in New Rifle Alluvium Dissolved vanadium concentrations vary with the fluctuating groundwater table. Vanadium concentrations increased in well 0855 during an extreme lowering of the groundwater table by construction dewatering. The fluctuating groundwater levels may simply cause changes in the proportions of groundwater that are in direct contact with a variety of contaminated soil layers. 4.6 Numerical Transport Model To better exemplify the conceptual model presented in the previous section, a one-dimensional transport model was developed (Figure 22). The model invokes mineral precipitation, mineral dissolution, soil adsorption, and soil desorption. Model calculations were performed using the transport algorithm in PHREEQC. Surface complexation parameters for uranium are from Morrison et al. (1995). Surface complexation parameters for vanadium and all other cations are from Dzombak and Morel (1990). The vanadium surface complexation equilibrium constants were modified slightly to be internally consistent with the PHREEQC database by curve matching to the empirical data provided in Dzombak and Morel (1990). The only solid phase for
U.S. Department of Energy Analysis and Geochemical Modeling of Vanadium Contamination in Groundwater, Rifle, Colorado July 2010 Doc. No. S06654 Page 29
which uranium and vanadium surface complexation parameters are available is amorphous ferric oxyhydroxide (AFO). Thus, the adsorption portion of the model is limited to adsorption on AFO. This assumption is reasonable in that uranium and vanadium adsorption in many alluvial aquifers is likely dominated by AFO. Other adsorption sites likely occur on clay minerals and other silicates as well as other oxide minerals, but those are likely subordinate to AFO. Since the distribution of adsorption sites and the amount of AFO present in the New Rifle aquifer are not known, the adsorption model is not rigorous and is used to best fit site data. Input files for the PHREEQC modeling are provided as Appendix C.
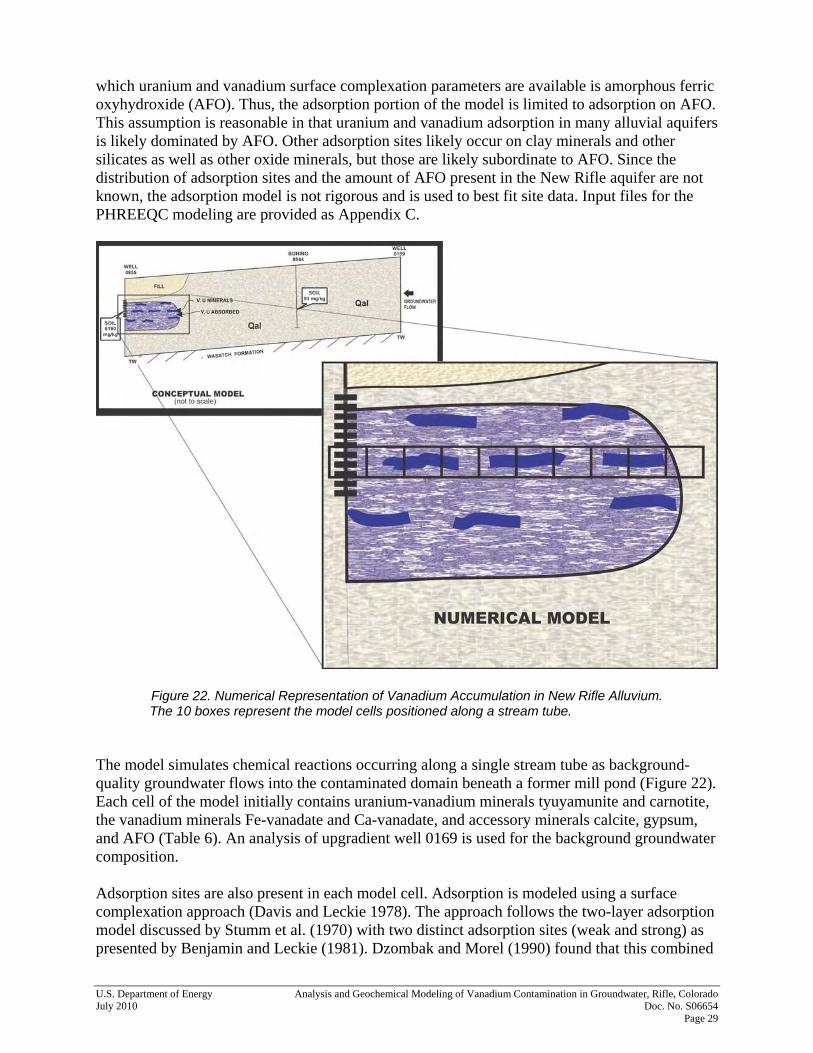
Figure 22. Numerical Representation of Vanadium Accumulation in New Rifle Alluvium. The 10 boxes represent the model cells positioned along a stream tube.
The model simulates chemical reactions occurring along a single stream tube as background-quality groundwater flows into the contaminated domain beneath a former mill pond (Figure 22). Each cell of the model initially contains uranium-vanadium minerals tyuyamunite and carnotite, the vanadium minerals Fe-vanadate and Ca-vanadate, and accessory minerals calcite, gypsum, and AFO (Table 6). An analysis of upgradient well 0169 is used for the background groundwater composition. Adsorption sites are also present in each model cell. Adsorption is modeled using a surface complexation approach (Davis and Leckie 1978). The approach follows the two-layer adsorption model discussed by Stumm et al. (1970) with two distinct adsorption sites (weak and strong) as presented by Benjamin and Leckie (1981). Dzombak and Morel (1990) found that this combined
Analysis and Geochemical Modeling of Vanadium Contamination in Groundwater, Rifle, Colorado U.S. Department of Energy Doc. No. S06654 July 2010 Page 30
model matched well with a multitude of acid-base titration and cation-anion adsorption data. For simplicity, surface precipitation on adsorption surfaces as discussed by Dzombak and Morel (1990) was neglected. Adsorption parameters used in the model are presented in Table 6.
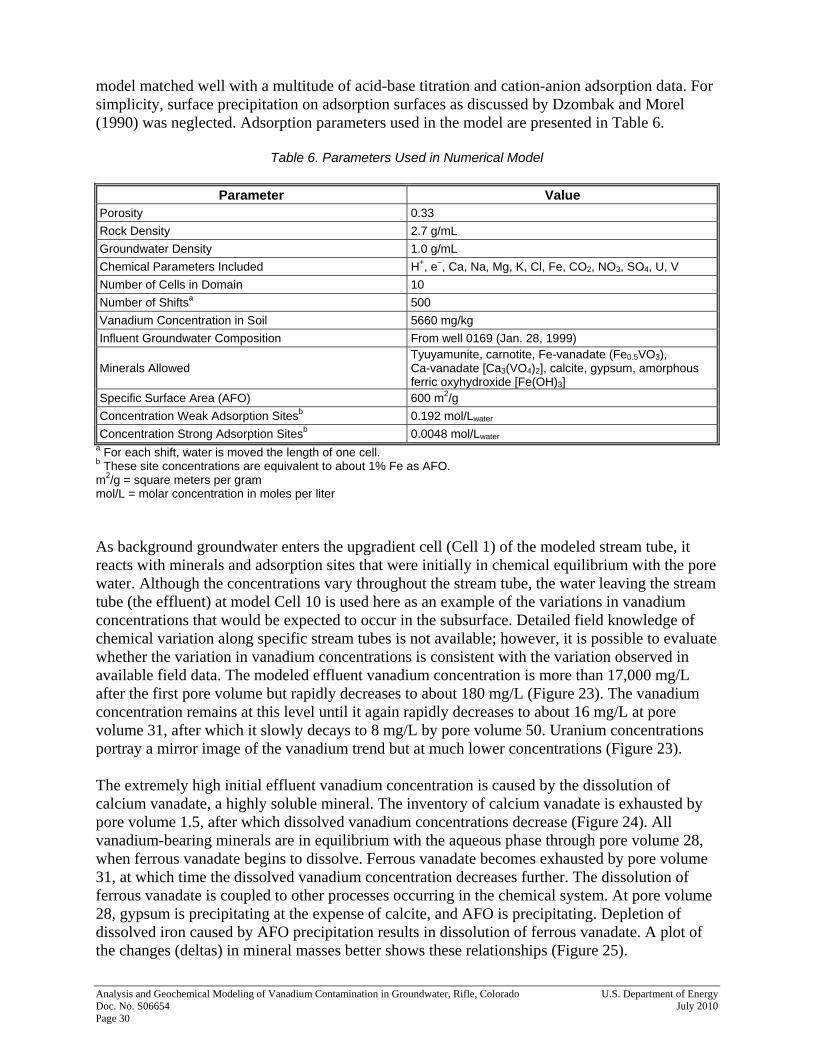
Table 6. Parameters Used in Numerical Model
Parameter Value Porosity 0.33 Rock Density 2.7 g/mL Groundwater Density 1.0 g/mL Chemical Parameters Included H+, e–, Ca, Na, Mg, K, Cl, Fe, CO2, NO3, SO4, U, V Number of Cells in Domain 10 Number of Shiftsa 500 Vanadium Concentration in Soil 5660 mg/kg Influent Groundwater Composition From well 0169 (Jan. 28, 1999)
Minerals Allowed Tyuyamunite, carnotite, Fe-vanadate (Fe0.5VO3), Ca-vanadate [Ca3(VO4)2], calcite, gypsum, amorphous ferric oxyhydroxide [Fe(OH)3]
Specific Surface Area (AFO) 600 m2/g Concentration Weak Adsorption Sitesb 0.192 mol/Lwater Concentration Strong Adsorption Sitesb 0.0048 mol/Lwater
a For each shift, water is moved the length of one cell. b These site concentrations are equivalent to about 1% Fe as AFO. m2/g = square meters per gram mol/L = molar concentration in moles per liter As background groundwater enters the upgradient cell (Cell 1) of the modeled stream tube, it reacts with minerals and adsorption sites that were initially in chemical equilibrium with the pore water. Although the concentrations vary throughout the stream tube, the water leaving the stream tube (the effluent) at model Cell 10 is used here as an example of the variations in vanadium concentrations that would be expected to occur in the subsurface. Detailed field knowledge of chemical variation along specific stream tubes is not available; however, it is possible to evaluate whether the variation in vanadium concentrations is consistent with the variation observed in available field data. The modeled effluent vanadium concentration is more than 17,000 mg/L after the first pore volume but rapidly decreases to about 180 mg/L (Figure 23). The vanadium concentration remains at this level until it again rapidly decreases to about 16 mg/L at pore volume 31, after which it slowly decays to 8 mg/L by pore volume 50. Uranium concentrations portray a mirror image of the vanadium trend but at much lower concentrations (Figure 23). The extremely high initial effluent vanadium concentration is caused by the dissolution of calcium vanadate, a highly soluble mineral. The inventory of calcium vanadate is exhausted by pore volume 1.5, after which dissolved vanadium concentrations decrease (Figure 24). All vanadium-bearing minerals are in equilibrium with the aqueous phase through pore volume 28, when ferrous vanadate begins to dissolve. Ferrous vanadate becomes exhausted by pore volume 31, at which time the dissolved vanadium concentration decreases further. The dissolution of ferrous vanadate is coupled to other processes occurring in the chemical system. At pore volume 28, gypsum is precipitating at the expense of calcite, and AFO is precipitating. Depletion of dissolved iron caused by AFO precipitation results in dissolution of ferrous vanadate. A plot of the changes (deltas) in mineral masses better shows these relationships (Figure 25).
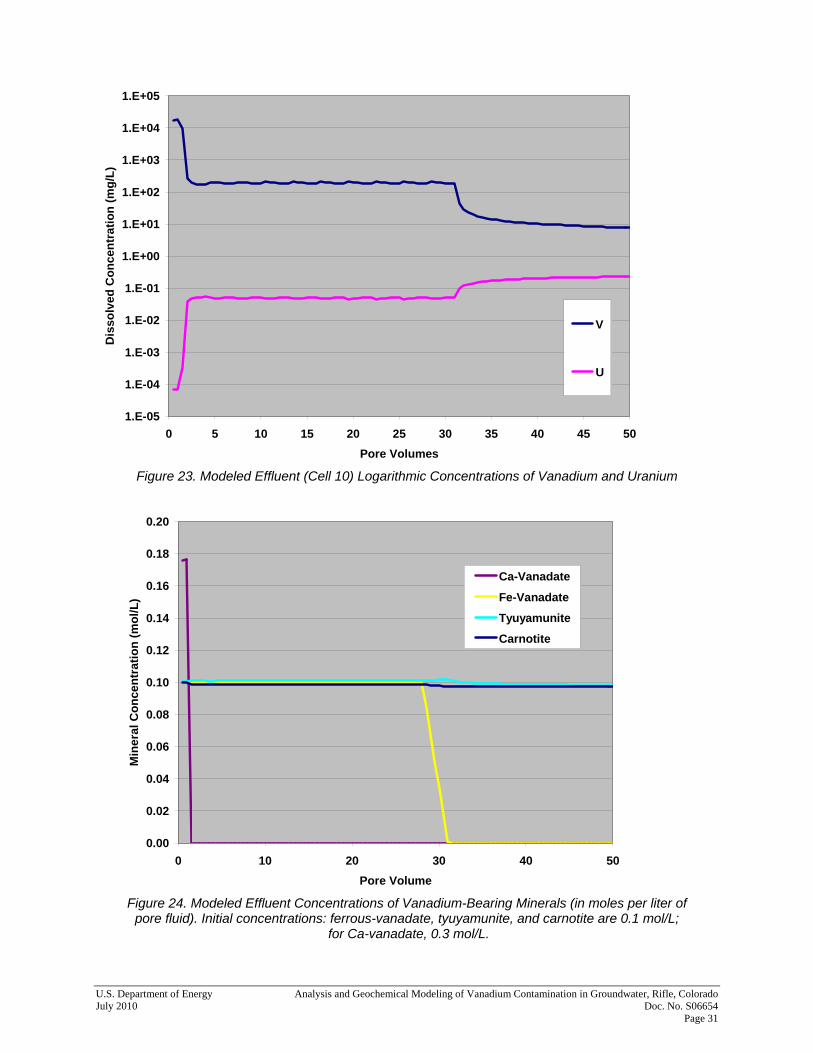
U.S. Department of Energy Analysis and Geochemical Modeling of Vanadium Contamination in Groundwater, Rifle, Colorado July 2010 Doc. No. S06654 Page 31
1.E-05
1.E-04
1.E-03
1.E-02
1.E-01
1.E+00
1.E+01
1.E+02
1.E+03
1.E+04
1.E+05
0 5 10 15 20 25 30 35 40 45 50Pore Volumes
Dis
solv
ed C
once
ntra
tion
(mg/
L)
V
U
Figure 23. Modeled Effluent (Cell 10) Logarithmic Concentrations of Vanadium and Uranium
0.00
0.02
0.04
0.06
0.08
0.10
0.12
0.14
0.16
0.18
0.20
0 10 20 30 40 50Pore Volume
Min
eral
Con
cent
ratio
n (m
ol/L
)
Ca-Vanadate
Fe-Vanadate
Tyuyamunite
Carnotite
Figure 24. Modeled Effluent Concentrations of Vanadium-Bearing Minerals (in moles per liter of
pore fluid). Initial concentrations: ferrous-vanadate, tyuyamunite, and carnotite are 0.1 mol/L; for Ca-vanadate, 0.3 mol/L.
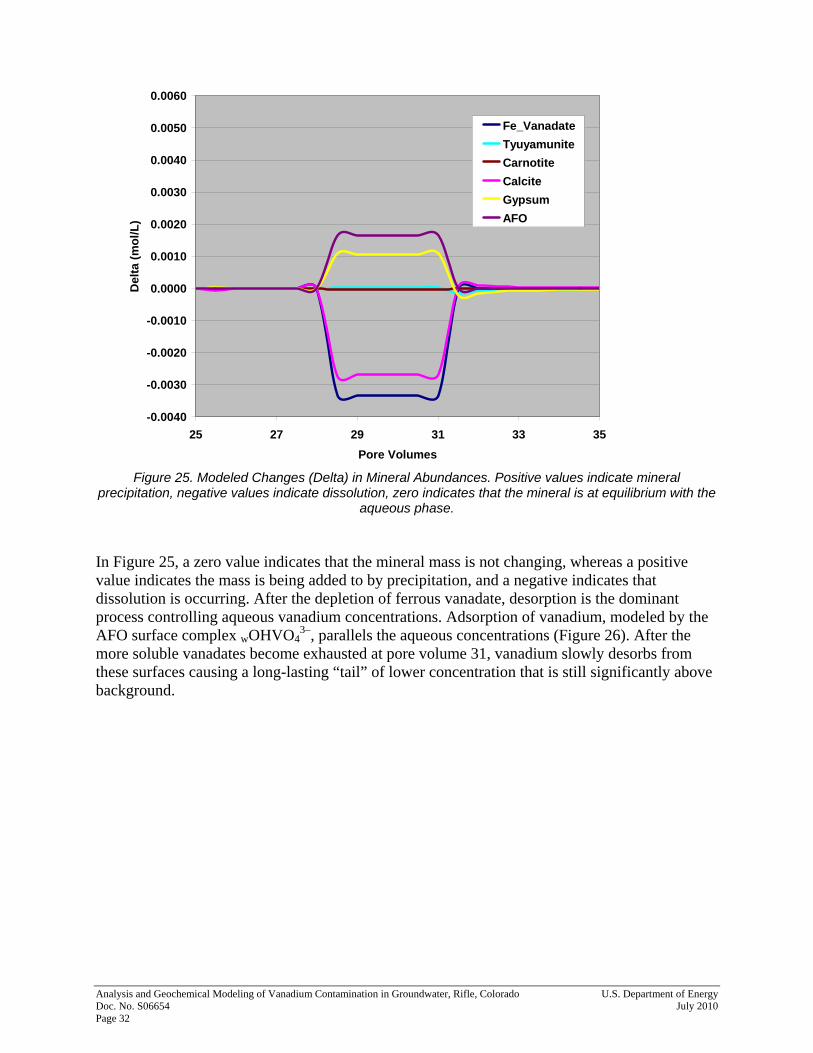
Analysis and Geochemical Modeling of Vanadium Contamination in Groundwater, Rifle, Colorado U.S. Department of Energy Doc. No. S06654 July 2010 Page 32
-0.0040
-0.0030
-0.0020
-0.0010
0.0000
0.0010
0.0020
0.0030
0.0040
0.0050
0.0060
25 27 29 31 33 35Pore Volumes
Del
ta (m
ol/L
)Fe_VanadateTyuyamuniteCarnotiteCalciteGypsumAFO
Figure 25. Modeled Changes (Delta) in Mineral Abundances. Positive values indicate mineral
precipitation, negative values indicate dissolution, zero indicates that the mineral is at equilibrium with the aqueous phase.
In Figure 25, a zero value indicates that the mineral mass is not changing, whereas a positive value indicates the mass is being added to by precipitation, and a negative indicates that dissolution is occurring. After the depletion of ferrous vanadate, desorption is the dominant process controlling aqueous vanadium concentrations. Adsorption of vanadium, modeled by the AFO surface complex wOHVO4
3–, parallels the aqueous concentrations (Figure 26). After the more soluble vanadates become exhausted at pore volume 31, vanadium slowly desorbs from these surfaces causing a long-lasting “tail” of lower concentration that is still significantly above background.
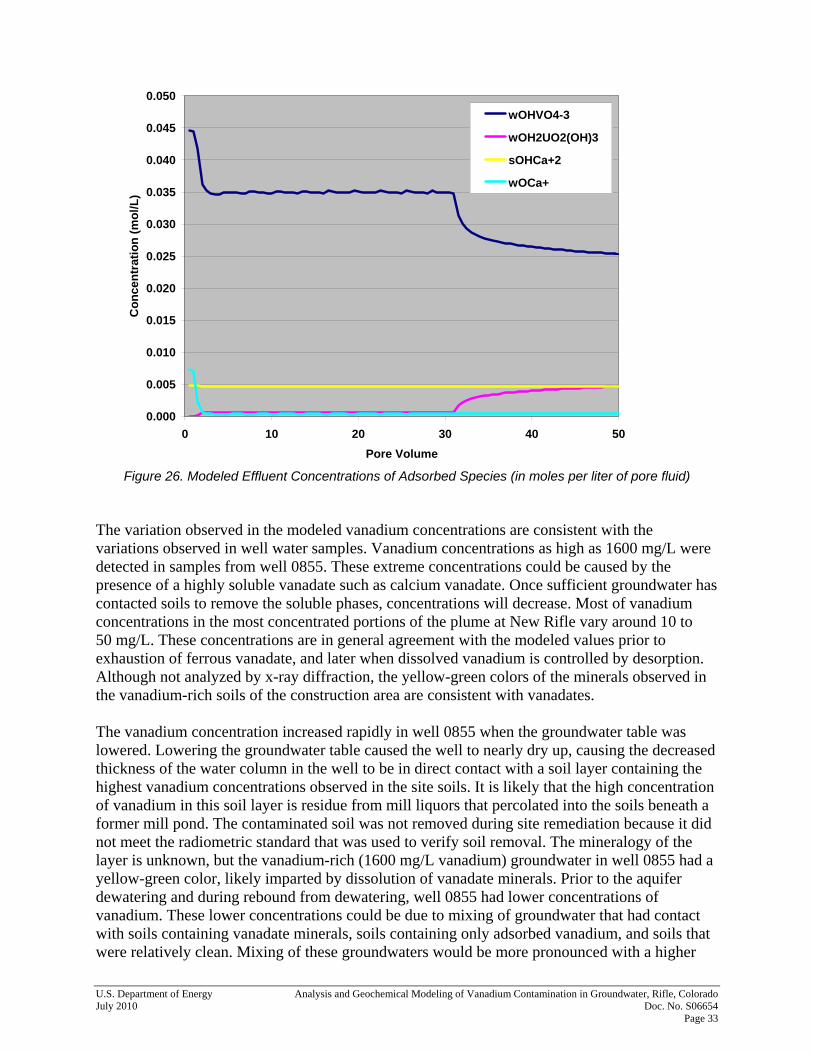
U.S. Department of Energy Analysis and Geochemical Modeling of Vanadium Contamination in Groundwater, Rifle, Colorado July 2010 Doc. No. S06654 Page 33
0.000
0.005
0.010
0.015
0.020
0.025
0.030
0.035
0.040
0.045
0.050
0 10 20 30 40 50Pore Volume
Con
cent
ratio
n (m
ol/L
)wOHVO4-3
wOH2UO2(OH)3
sOHCa+2
wOCa+
Figure 26. Modeled Effluent Concentrations of Adsorbed Species (in moles per liter of pore fluid)
The variation observed in the modeled vanadium concentrations are consistent with the variations observed in well water samples. Vanadium concentrations as high as 1600 mg/L were detected in samples from well 0855. These extreme concentrations could be caused by the presence of a highly soluble vanadate such as calcium vanadate. Once sufficient groundwater has contacted soils to remove the soluble phases, concentrations will decrease. Most of vanadium concentrations in the most concentrated portions of the plume at New Rifle vary around 10 to 50 mg/L. These concentrations are in general agreement with the modeled values prior to exhaustion of ferrous vanadate, and later when dissolved vanadium is controlled by desorption. Although not analyzed by x-ray diffraction, the yellow-green colors of the minerals observed in the vanadium-rich soils of the construction area are consistent with vanadates. The vanadium concentration increased rapidly in well 0855 when the groundwater table was lowered. Lowering the groundwater table caused the well to nearly dry up, causing the decreased thickness of the water column in the well to be in direct contact with a soil layer containing the highest vanadium concentrations observed in the site soils. It is likely that the high concentration of vanadium in this soil layer is residue from mill liquors that percolated into the soils beneath a former mill pond. The contaminated soil was not removed during site remediation because it did not meet the radiometric standard that was used to verify soil removal. The mineralogy of the layer is unknown, but the vanadium-rich (1600 mg/L vanadium) groundwater in well 0855 had a yellow-green color, likely imparted by dissolution of vanadate minerals. Prior to the aquifer dewatering and during rebound from dewatering, well 0855 had lower concentrations of vanadium. These lower concentrations could be due to mixing of groundwater that had contact with soils containing vanadate minerals, soils containing only adsorbed vanadium, and soils that were relatively clean. Mixing of these groundwaters would be more pronounced with a higher
Analysis and Geochemical Modeling of Vanadium Contamination in Groundwater, Rifle, Colorado U.S. Department of Energy Doc. No. S06654 July 2010 Page 34
groundwater table. Well 0857 also had higher concentrations of dissolved vanadium during dewatering, possibly also due to a change in the amounts of groundwater contaminated by the variable soil compositions. Dissolved uranium concentrations in wells 0855 and 0857 are much lower than the vanadium concentrations. The modeled uranium concentrations are low also, due to equilibrium with uranyl-vanadate minerals (tyuyamunite and carnotite). After depletion of iron vanadate at 31 pore volumes, uranium concentrations begin to increase slightly. The increasing dissolved uranium is from tyuyamunite dissolution being destabilized by the lower concentrations of dissolved vanadium during the desorption phase. Thus, the model results also help explain the relatively low uranium detected in the New Rifle groundwater system.
5.0 Conclusions The goal of the project was to monitor the vanadium plume during a significant dewatering of the groundwater system and to provide a reasonable explanation for the observed vanadium behavior. This project did not investigate human health or ecological risk factors associated with the groundwater vanadium plume; thus, this document does not address recommendations regarding land use. Vanadium at the New Rifle site is present in high concentrations in subsurface soils in a heterogeneous distribution. The soil vanadium is probably dominated by the +5 oxidation state occurring in vanadates and uranium vanadates and in vanadium adsorbed to soil particles, particularly those containing ferric oxides and oxyhydroxides. The vanadium in the soils was likely residue from mill leachates that infiltrated the subsurface during milling and were not removed during site remediation in the early 1990s. High concentrations of vanadium up to 1600 mg/L have been detected in groundwater beneath former mill ponds. The vanadium contamination in the groundwater is explained by dissolution of soluble vanadate minerals and desorption from ferric oxyhydroxides. Of note, a ferrous vanadate with solubility that is coupled to the iron system may in part control vanadium distributions, and changes in redox with respect to the iron system could also affect vanadium concentrations. Lowering of the groundwater table during construction dewatering caused vanadium concentrations in some wells to increase. These increases are attributed to more direct contact with the vanadiferous soil horizons. After the highly soluble mineral fraction is depleted, vanadium concentrations decrease to levels (tens of milligrams per liter) that are characteristic of soil desorption. Without removal of the vanadiferous soil layers, it is likely that vanadium concentrations in the groundwater will remain at tens of milligrams per liter with occasional increases at times when contaminated soil layers are in contact with a limited thickness of groundwater.
U.S. Department of Energy Analysis and Geochemical Modeling of Vanadium Contamination in Groundwater, Rifle, Colorado July 2010 Doc. No. S06654 Page 35
6.0 References 40 CFR 192. U.S. Environmental Protection Agency, “Health and Environmental Protection Standards for Uranium and Thorium Mill Tailing,” Code of Federal Regulations, July 1, 2009. Back, W., 1966. Hydrochemical facies and ground-water flow patterns in northern part of Atlantic Coastal Plain, U.S. Geol. Survey Prof. Paper 498-A. Benjamin, M.M., and J.O. Leckie, 1981. “Multiple site adsorption of Cd, Cu, Zn, and Pb on amorphous iron oxyhydroxide,” J. Colloid Interface Science., 79: 209–221. Davis, J.A., and J.O. Leckie, 1978. “Surface Ionization and Complexation at the Oxide/Water Interface, J. Colloid and Interface Science, 67: 90–107. DOE (U.S. Department of Energy), 1999. Final Site Observational Work Plan for the UMTRA Project New Rifle Site, GJO-99-112-TAR, Rev. 1, Grand Junction Office, Grand Junction, Colorado, November. DOE (U.S. Department of Energy), 2000a. Draft Work Plan for Vanadium Pilot Study New Rifle UMTRA Site, Rifle, Colorado, GWRFL 10.6.4, July. DOE (U.S. Department of Energy), 2000b. Distribution of Vanadium in Alluvial Sediments UMTRA Ground Water Project New Rifle, Colorado, Site. ESL-RPT-2000-10, June. DOE (U.S. Department of Energy), 2001. Prototype Tests of Zero-Valent Iron for Ex Situ Removal of Vanadium from Ground Water, GJO-2001-210-TAR, ESL-RPT-2001-03, Grand Junction Office, Grand Junction, Colorado, April. DOE (U.S. Department of Energy), 2003. Data Analysis of Vanadium at the New Rifle UMTRA Project Site, Rifle, Colorado, U0178700, Grand Junction, Colorado, March. DOE (U.S. Department of Energy), 2005. Ground Water Compliance Action Plan for the New Rifle, Colorado, Processing Site, DOE-LM/GJ942-2005, Grand Junction, Colorado, September. DOE (U.S. Department of Energy), 2006. Ground Water Compliance Action Plan for the New Rifle, Colorado, Processing Site, prepared for the U.S. Department of Energy Grand Junction Office, December 2006, DOE-LM/GJ1211-2006. Environmental Sciences Laboratory Procedures Manual. STO 210 (regularly updated), prepared by S.M. Stoller Corporation for the U.S. Department of Energy Office of Legacy Management, Grand Junction, Colorado. Dzombak, D.A., and F.M.M. Morel, 1990. Surface Complexation Modeling Hydrous Ferric Oxide, John Wiley & Sons, New York. Evans, H.T., and S. Landergren, 1974. Handbook of Geochemistry, Chapter 23, “Vanadium,” K.H. Wedepohl, ed., Springer Verlag, Berlin.
Analysis and Geochemical Modeling of Vanadium Contamination in Groundwater, Rifle, Colorado U.S. Department of Energy Doc. No. S06654 July 2010 Page 36
Freeze, R.A., and J.A. Cherry 1979. Groundwater, Prentice-Hall, Inc., Englewood Cliffs, New Jersey. Garrels, R.M., and C.L. Christ, 1965. Solutions, Minerals, and Equilibria, Freeman, Cooper & Company, San Francisco. Hem, J.D., 1985. Study and Interpretation of the Chemical Characteristics of Natural Water, 3rd Edition, U.S. Geol. Surv. Water Supply Paper 2254. Langmuir, D., 1971. "Eh-pH Determination," in R.E. Carver (Ed.) Procedures in Sedimentary Petrology, Wiley Interscience, New York, pp. 597–634. Merritt, Robert C., 1971. The Extractive Metallurgy of Uranium, prepared by Colorado School of Mines Research Institute for the U.S. Atomic Energy Commission. Morgan, C.O., and M.D. Winner, Jr., 1962. Hydrochemical Facies in the 400 Foot and 600 Foot Sands of the Baton Rouge Area, Louisiana, U. S. Geol. Surv. Prof. Paper 450-B, pp. B120–121. Morrison, S.J., R.R. Spangler, and V.S. Tripathi, 1995. “Adsorption of Uranium(VI) on Amorphous Ferric Oxyhydroxide at High Concentrations of Dissolved Carbon(VI) and Sulfur(VI),” J. Contam. Hydrol., 17: 333–346. Parkhurst, D.L., and C.A.J. Appelo, 1999. User's Guide to PHREEQC (Version 2)—A Computer Program for Speciation, Batch-Reaction, One-Dimensional Transport, and Inverse Geochemical Calculations, U.S. Geol. Surv. Water-Resources Investigation Report 99-4259, 312 pp. Peterson, S.R., C.J. Hostetler, W.J., Deutsch, and C.E., Cowan, 1987. MINTEQ User's Manual, NUREG CR-4808, prepared for Division of Waste Management Office of Nuclear Material Safety and Safeguards, U. S. Nuclear Regulatory Commission, Washington, D.C. Rai, D., and J.M. Zachara, 1986. Chemical Attenuation Rates, Coefficients, and Constants in Leachate Migration, Volume 1: A Critical Review, EPRI EA-3356, prepared for Electric Power Research Institute, Palo Alto, California. Stumm, W., and J.J. Morgan, 1981. Aquatic Chemistry, 2nd Edition. John Wiley & Sons, New York. Stumm, W., C.P. Huang, and S.R. Jenkins, 1970. “Specific Chemical Interactions Affecting the Stability of Dispersed Systems,” Croct. Chem. Acta, 42: 223–244.
Appendix A
Instrument Calibration Summary Report

This page intentionally left blank
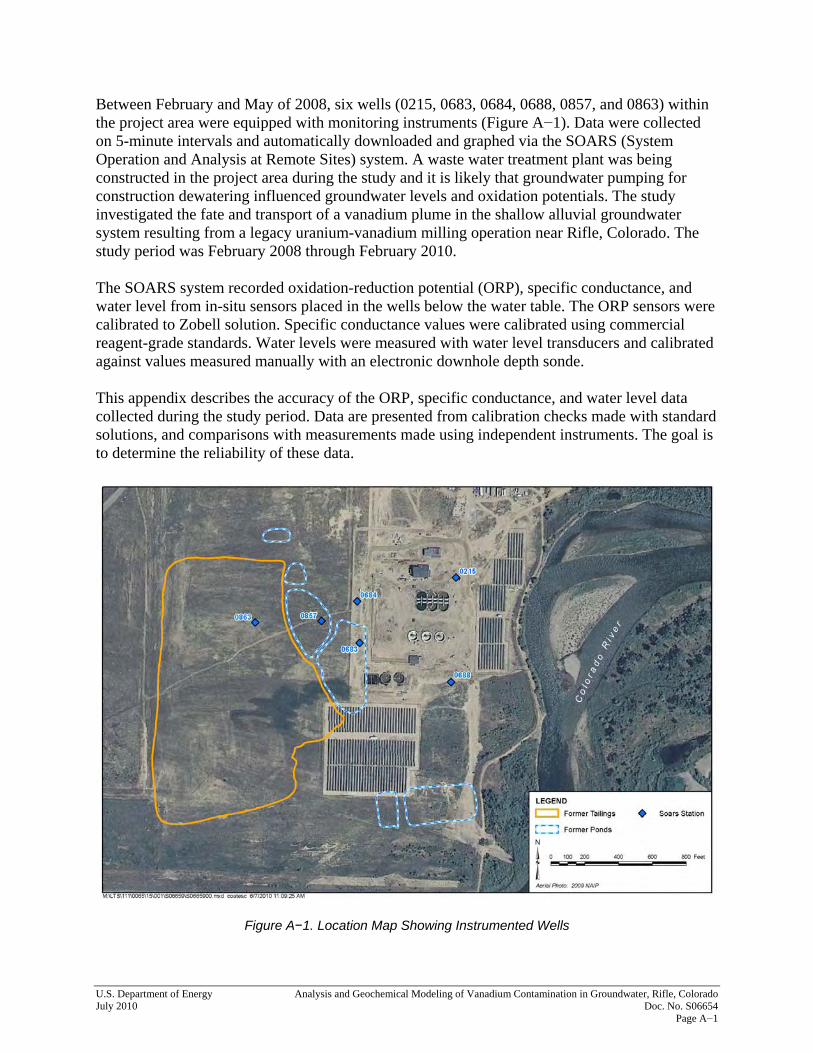
U.S. Department of Energy Analysis and Geochemical Modeling of Vanadium Contamination in Groundwater, Rifle, Colorado July 2010 Doc. No. S06654 Page A−1
Between February and May of 2008, six wells (0215, 0683, 0684, 0688, 0857, and 0863) within the project area were equipped with monitoring instruments (Figure A−1). Data were collected on 5-minute intervals and automatically downloaded and graphed via the SOARS (System Operation and Analysis at Remote Sites) system. A waste water treatment plant was being constructed in the project area during the study and it is likely that groundwater pumping for construction dewatering influenced groundwater levels and oxidation potentials. The study investigated the fate and transport of a vanadium plume in the shallow alluvial groundwater system resulting from a legacy uranium-vanadium milling operation near Rifle, Colorado. The study period was February 2008 through February 2010. The SOARS system recorded oxidation-reduction potential (ORP), specific conductance, and water level from in-situ sensors placed in the wells below the water table. The ORP sensors were calibrated to Zobell solution. Specific conductance values were calibrated using commercial reagent-grade standards. Water levels were measured with water level transducers and calibrated against values measured manually with an electronic downhole depth sonde. This appendix describes the accuracy of the ORP, specific conductance, and water level data collected during the study period. Data are presented from calibration checks made with standard solutions, and comparisons with measurements made using independent instruments. The goal is to determine the reliability of these data.
Figure A−1. Location Map Showing Instrumented Wells
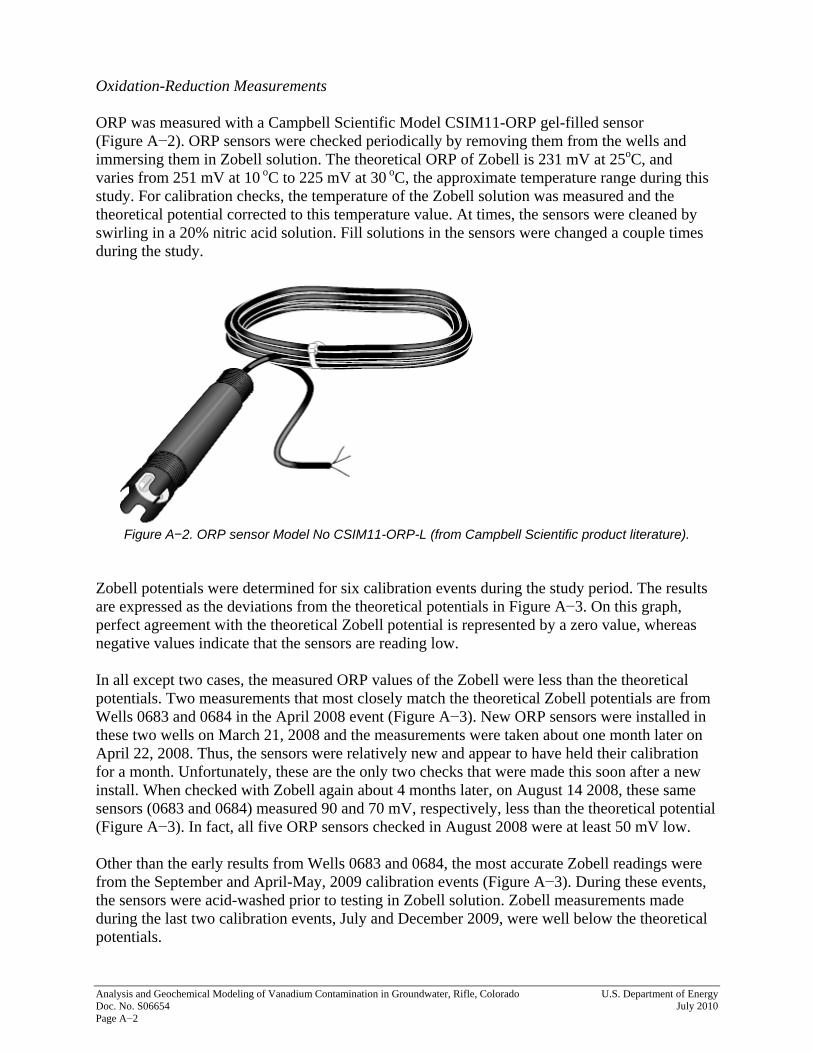
Analysis and Geochemical Modeling of Vanadium Contamination in Groundwater, Rifle, Colorado U.S. Department of Energy Doc. No. S06654 July 2010 Page A−2
Oxidation-Reduction Measurements ORP was measured with a Campbell Scientific Model CSIM11-ORP gel-filled sensor (Figure A−2). ORP sensors were checked periodically by removing them from the wells and immersing them in Zobell solution. The theoretical ORP of Zobell is 231 mV at 25oC, and varies from 251 mV at 10 oC to 225 mV at 30 oC, the approximate temperature range during this study. For calibration checks, the temperature of the Zobell solution was measured and the theoretical potential corrected to this temperature value. At times, the sensors were cleaned by swirling in a 20% nitric acid solution. Fill solutions in the sensors were changed a couple times during the study.
Figure A−2. ORP sensor Model No CSIM11-ORP-L (from Campbell Scientific product literature).
Zobell potentials were determined for six calibration events during the study period. The results are expressed as the deviations from the theoretical potentials in Figure A−3. On this graph, perfect agreement with the theoretical Zobell potential is represented by a zero value, whereas negative values indicate that the sensors are reading low. In all except two cases, the measured ORP values of the Zobell were less than the theoretical potentials. Two measurements that most closely match the theoretical Zobell potentials are from Wells 0683 and 0684 in the April 2008 event (Figure A−3). New ORP sensors were installed in these two wells on March 21, 2008 and the measurements were taken about one month later on April 22, 2008. Thus, the sensors were relatively new and appear to have held their calibration for a month. Unfortunately, these are the only two checks that were made this soon after a new install. When checked with Zobell again about 4 months later, on August 14 2008, these same sensors (0683 and 0684) measured 90 and 70 mV, respectively, less than the theoretical potential (Figure A−3). In fact, all five ORP sensors checked in August 2008 were at least 50 mV low. Other than the early results from Wells 0683 and 0684, the most accurate Zobell readings were from the September and April-May, 2009 calibration events (Figure A−3). During these events, the sensors were acid-washed prior to testing in Zobell solution. Zobell measurements made during the last two calibration events, July and December 2009, were well below the theoretical potentials.
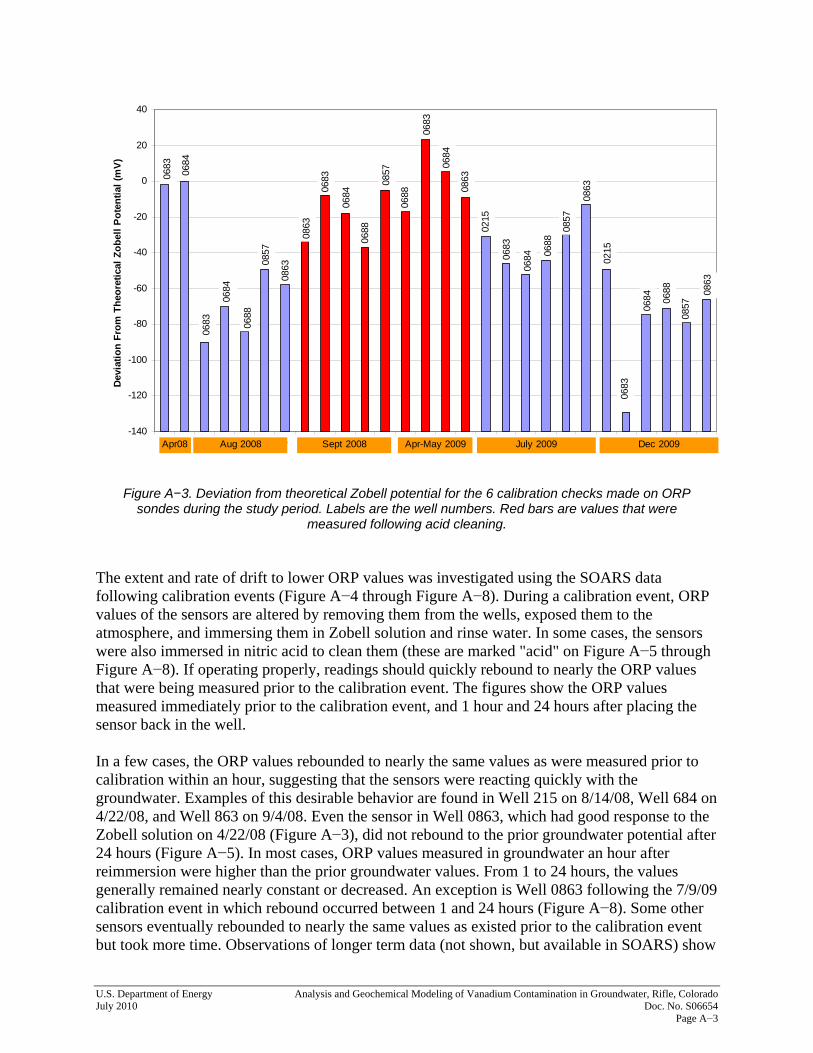
U.S. Department of Energy Analysis and Geochemical Modeling of Vanadium Contamination in Groundwater, Rifle, Colorado July 2010 Doc. No. S06654 Page A−3
-140
-120
-100
-80
-60
-40
-20
0
20
40
1 2 3 4 5 6 7 8 9 10 11 12 13 14 15 16 17 18 19 20 21 22 23 24 25 26 27 28
Dev
iatio
n Fr
om T
heor
etic
al Z
obel
l Pot
entia
l (m
V)
Apr08
0683
0684
Aug 2008 Sept 2008 Apr-May 2009 July 2009 Dec 2009
0683
0684
0688
0857
0863
0684
0684
0684
0684
0683
0683
0683
0683
0863
0863
0863
0688
0688
0688
0688
0857
0857
0857
0863
0215
0215
Figure A−3. Deviation from theoretical Zobell potential for the 6 calibration checks made on ORP sondes during the study period. Labels are the well numbers. Red bars are values that were
measured following acid cleaning. The extent and rate of drift to lower ORP values was investigated using the SOARS data following calibration events (Figure A−4 through Figure A−8). During a calibration event, ORP values of the sensors are altered by removing them from the wells, exposed them to the atmosphere, and immersing them in Zobell solution and rinse water. In some cases, the sensors were also immersed in nitric acid to clean them (these are marked "acid" on Figure A−5 through Figure A−8). If operating properly, readings should quickly rebound to nearly the ORP values that were being measured prior to the calibration event. The figures show the ORP values measured immediately prior to the calibration event, and 1 hour and 24 hours after placing the sensor back in the well. In a few cases, the ORP values rebounded to nearly the same values as were measured prior to calibration within an hour, suggesting that the sensors were reacting quickly with the groundwater. Examples of this desirable behavior are found in Well 215 on 8/14/08, Well 684 on 4/22/08, and Well 863 on 9/4/08. Even the sensor in Well 0863, which had good response to the Zobell solution on 4/22/08 (Figure A−3), did not rebound to the prior groundwater potential after 24 hours (Figure A−5). In most cases, ORP values measured in groundwater an hour after reimmersion were higher than the prior groundwater values. From 1 to 24 hours, the values generally remained nearly constant or decreased. An exception is Well 0863 following the 7/9/09 calibration event in which rebound occurred between 1 and 24 hours (Figure A−8). Some other sensors eventually rebounded to nearly the same values as existed prior to the calibration event but took more time. Observations of longer term data (not shown, but available in SOARS) show
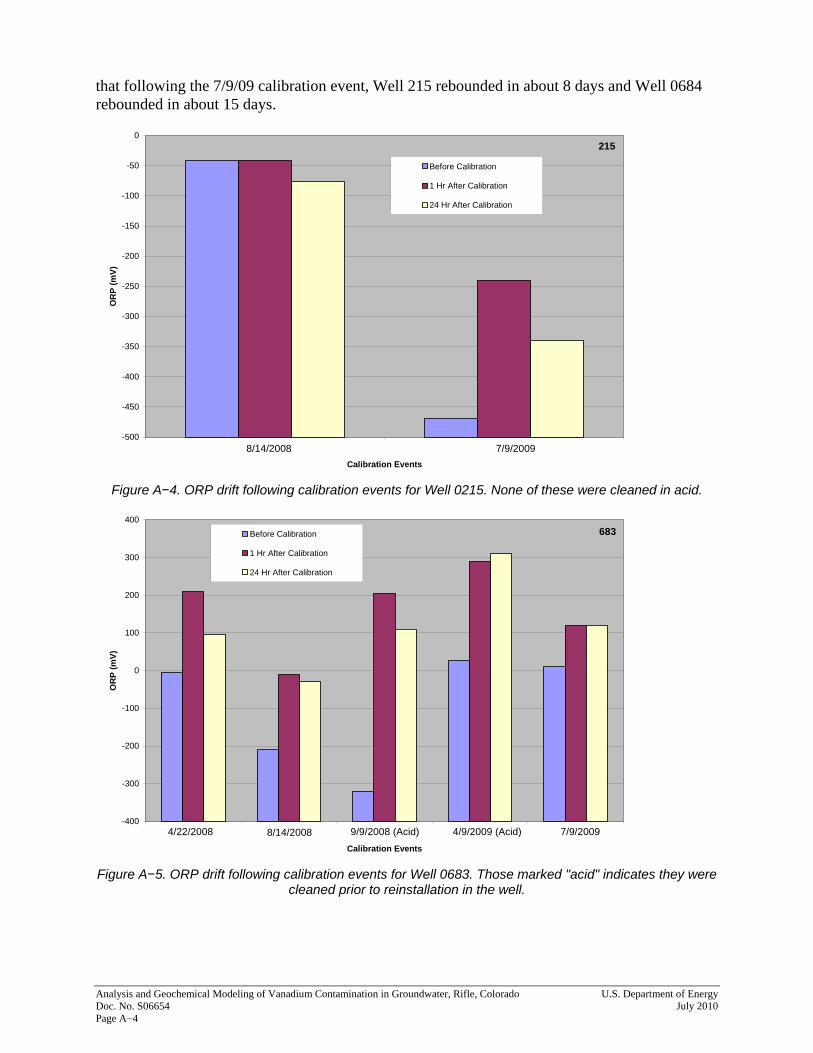
Analysis and Geochemical Modeling of Vanadium Contamination in Groundwater, Rifle, Colorado U.S. Department of Energy Doc. No. S06654 July 2010 Page A−4
that following the 7/9/09 calibration event, Well 215 rebounded in about 8 days and Well 0684 rebounded in about 15 days.
215
-500
-450
-400
-350
-300
-250
-200
-150
-100
-50
0
1 2
Calibration Events
OR
P (m
V)
Before Calibration
1 Hr After Calibration
24 Hr After Calibration
8/14/2008 7/9/2009
Figure A−4. ORP drift following calibration events for Well 0215. None of these were cleaned in acid.
683
-400
-300
-200
-100
0
100
200
300
400
1 2 3 4 5
Calibration Events
OR
P (m
V)
Before Calibration
1 Hr After Calibration
24 Hr After Calibration
4/22/2008 8/14/2008 9/9/2008 (Acid) 4/9/2009 (Acid) 7/9/2009
Figure A−5. ORP drift following calibration events for Well 0683. Those marked "acid" indicates they were
cleaned prior to reinstallation in the well.
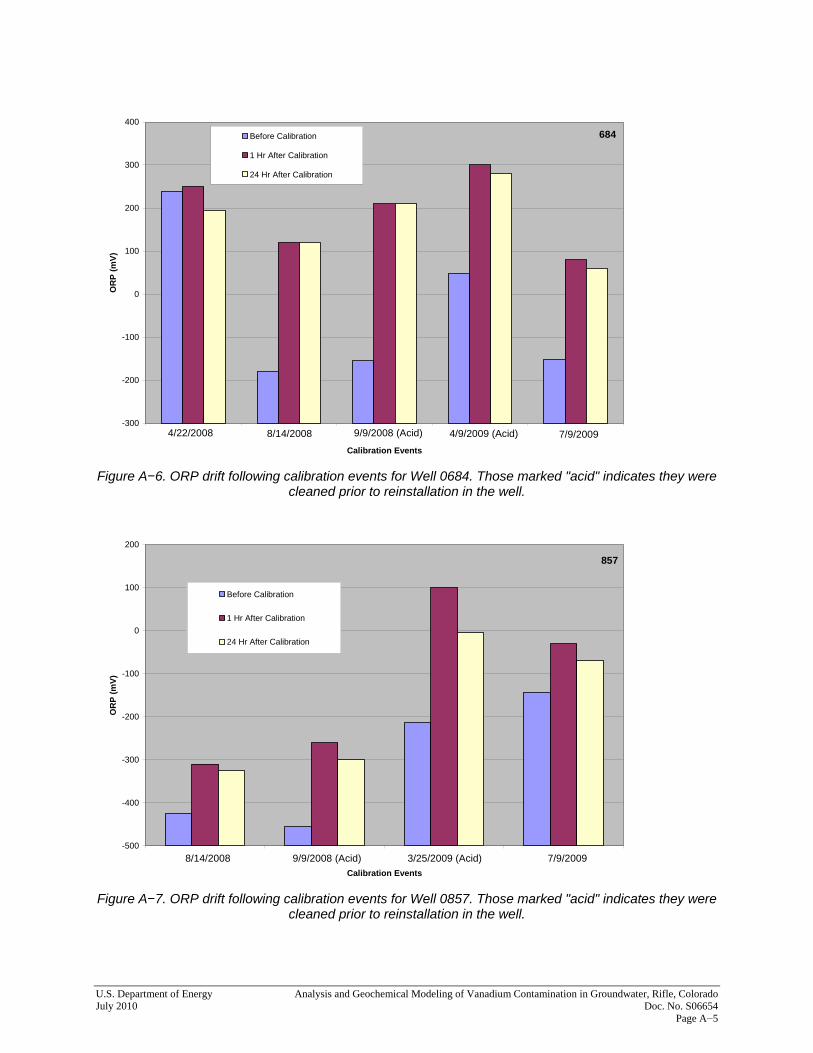
U.S. Department of Energy Analysis and Geochemical Modeling of Vanadium Contamination in Groundwater, Rifle, Colorado July 2010 Doc. No. S06654 Page A−5
684
-300
-200
-100
0
100
200
300
400
1 2 3 4 5
Calibration Events
OR
P (m
V)
Before Calibration
1 Hr After Calibration
24 Hr After Calibration
4/22/2008 8/14/2008 9/9/2008 (Acid) 4/9/2009 (Acid) 7/9/2009
Figure A−6. ORP drift following calibration events for Well 0684. Those marked "acid" indicates they were
cleaned prior to reinstallation in the well.
857
-500
-400
-300
-200
-100
0
100
200
1 2 3 4
Calibration Events
OR
P (m
V)
Before Calibration
1 Hr After Calibration
24 Hr After Calibration
8/14/2008 9/9/2008 (Acid) 3/25/2009 (Acid) 7/9/2009
Figure A−7. ORP drift following calibration events for Well 0857. Those marked "acid" indicates they were
cleaned prior to reinstallation in the well.
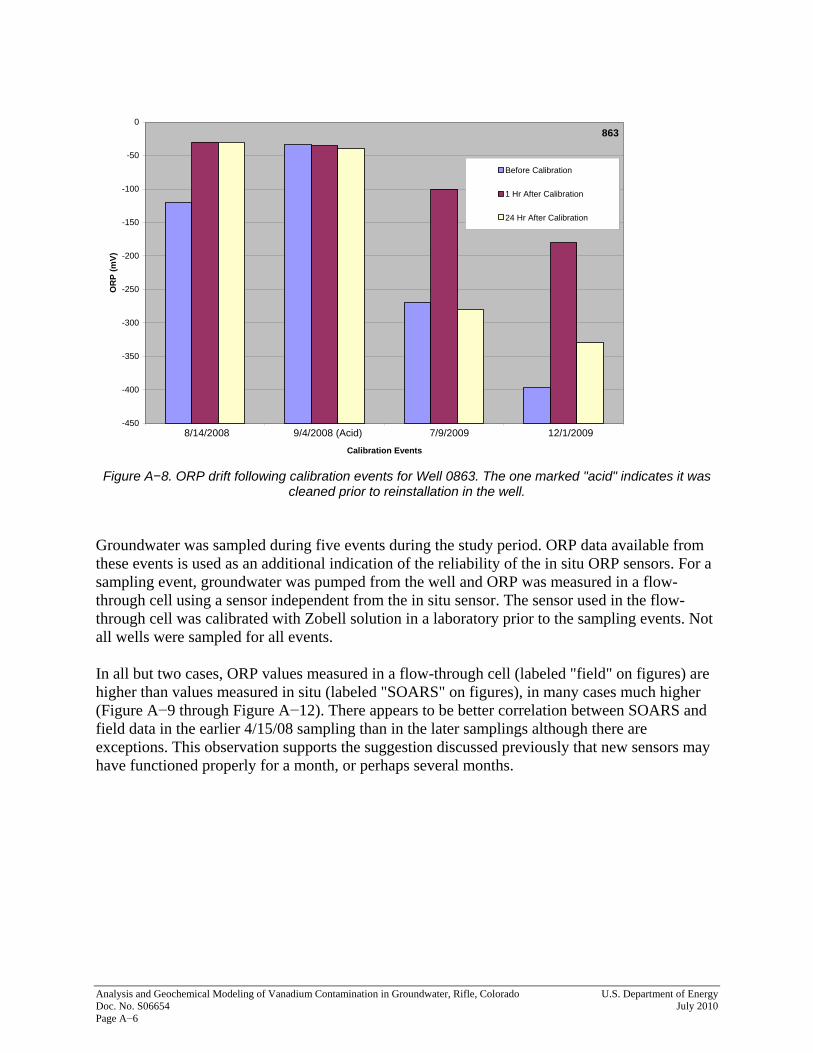
Analysis and Geochemical Modeling of Vanadium Contamination in Groundwater, Rifle, Colorado U.S. Department of Energy Doc. No. S06654 July 2010 Page A−6
863
-450
-400
-350
-300
-250
-200
-150
-100
-50
0
1 2 3 4
Calibration Events
OR
P (m
V)
Before Calibration
1 Hr After Calibration
24 Hr After Calibration
8/14/2008 9/4/2008 (Acid) 7/9/2009 12/1/2009
Figure A−8. ORP drift following calibration events for Well 0863. The one marked "acid" indicates it was
cleaned prior to reinstallation in the well. Groundwater was sampled during five events during the study period. ORP data available from these events is used as an additional indication of the reliability of the in situ ORP sensors. For a sampling event, groundwater was pumped from the well and ORP was measured in a flow-through cell using a sensor independent from the in situ sensor. The sensor used in the flow-through cell was calibrated with Zobell solution in a laboratory prior to the sampling events. Not all wells were sampled for all events. In all but two cases, ORP values measured in a flow-through cell (labeled "field" on figures) are higher than values measured in situ (labeled "SOARS" on figures), in many cases much higher (Figure A−9 through Figure A−12). There appears to be better correlation between SOARS and field data in the earlier 4/15/08 sampling than in the later samplings although there are exceptions. This observation supports the suggestion discussed previously that new sensors may have functioned properly for a month, or perhaps several months.
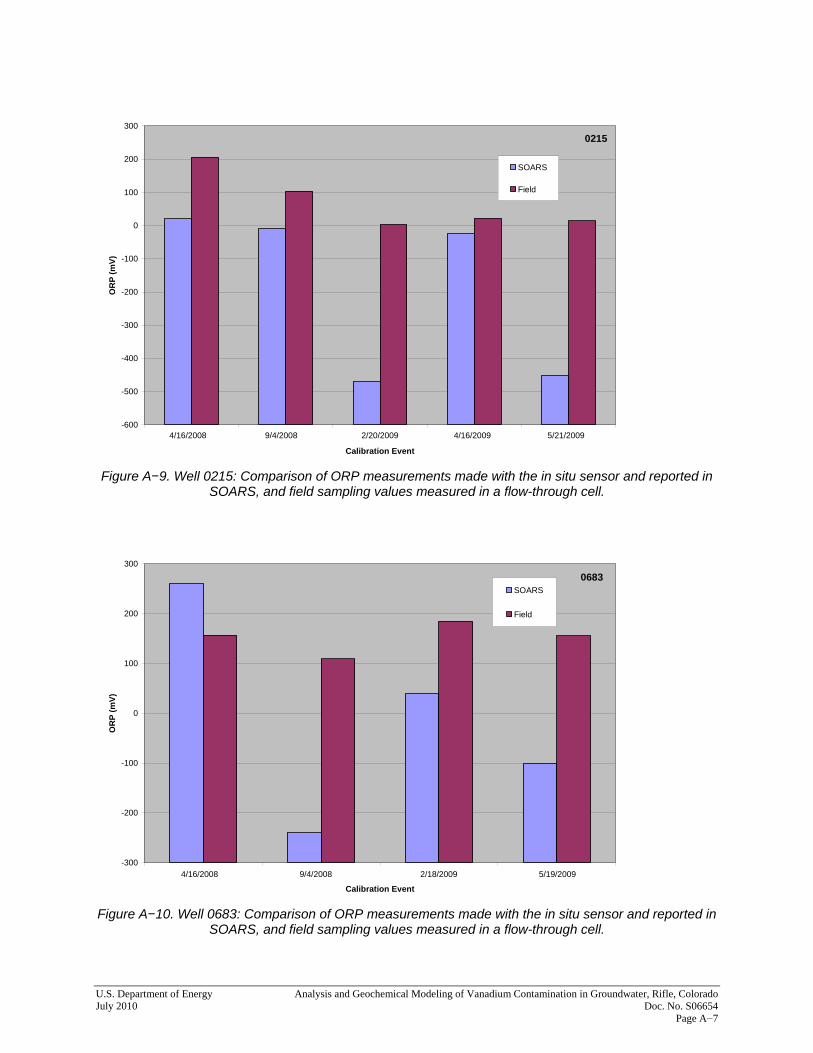
U.S. Department of Energy Analysis and Geochemical Modeling of Vanadium Contamination in Groundwater, Rifle, Colorado July 2010 Doc. No. S06654 Page A−7
0215
-600
-500
-400
-300
-200
-100
0
100
200
300
1 2 3 4 5
Calibration Event
OR
P (m
V)
SOARS
Field
4/16/2008 9/4/2008 2/20/2009 4/16/2009 5/21/2009
Figure A−9. Well 0215: Comparison of ORP measurements made with the in situ sensor and reported in
SOARS, and field sampling values measured in a flow-through cell.
0683
-300
-200
-100
0
100
200
300
1 2 3 4
Calibration Event
OR
P (m
V)
SOARS
Field
4/16/2008 9/4/2008 2/18/2009 5/19/2009
Figure A−10. Well 0683: Comparison of ORP measurements made with the in situ sensor and reported in
SOARS, and field sampling values measured in a flow-through cell.
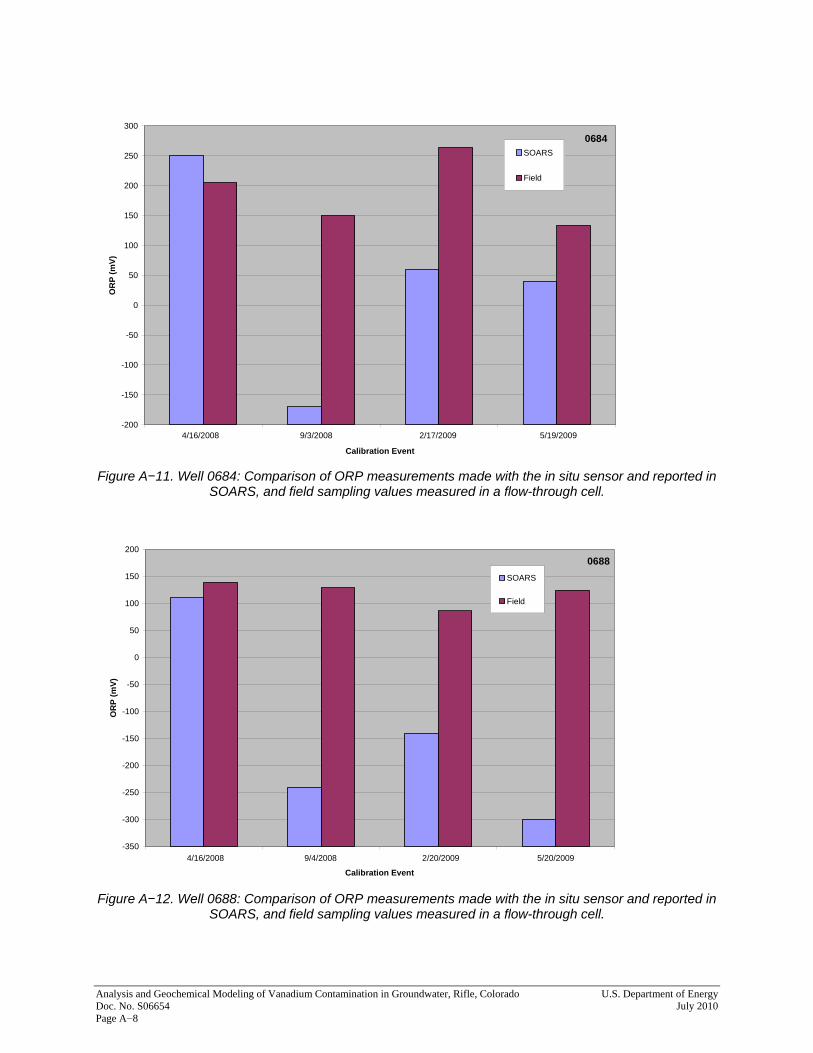
Analysis and Geochemical Modeling of Vanadium Contamination in Groundwater, Rifle, Colorado U.S. Department of Energy Doc. No. S06654 July 2010 Page A−8
0684
-200
-150
-100
-50
0
50
100
150
200
250
300
1 2 3 4
Calibration Event
OR
P (m
V)
SOARS
Field
4/16/2008 9/3/2008 2/17/2009 5/19/2009
Figure A−11. Well 0684: Comparison of ORP measurements made with the in situ sensor and reported in
SOARS, and field sampling values measured in a flow-through cell.
0688
-350
-300
-250
-200
-150
-100
-50
0
50
100
150
200
1 2 3 4
Calibration Event
OR
P (m
V)
SOARS
Field
4/16/2008 9/4/2008 2/20/2009 5/20/2009
Figure A−12. Well 0688: Comparison of ORP measurements made with the in situ sensor and reported in
SOARS, and field sampling values measured in a flow-through cell.
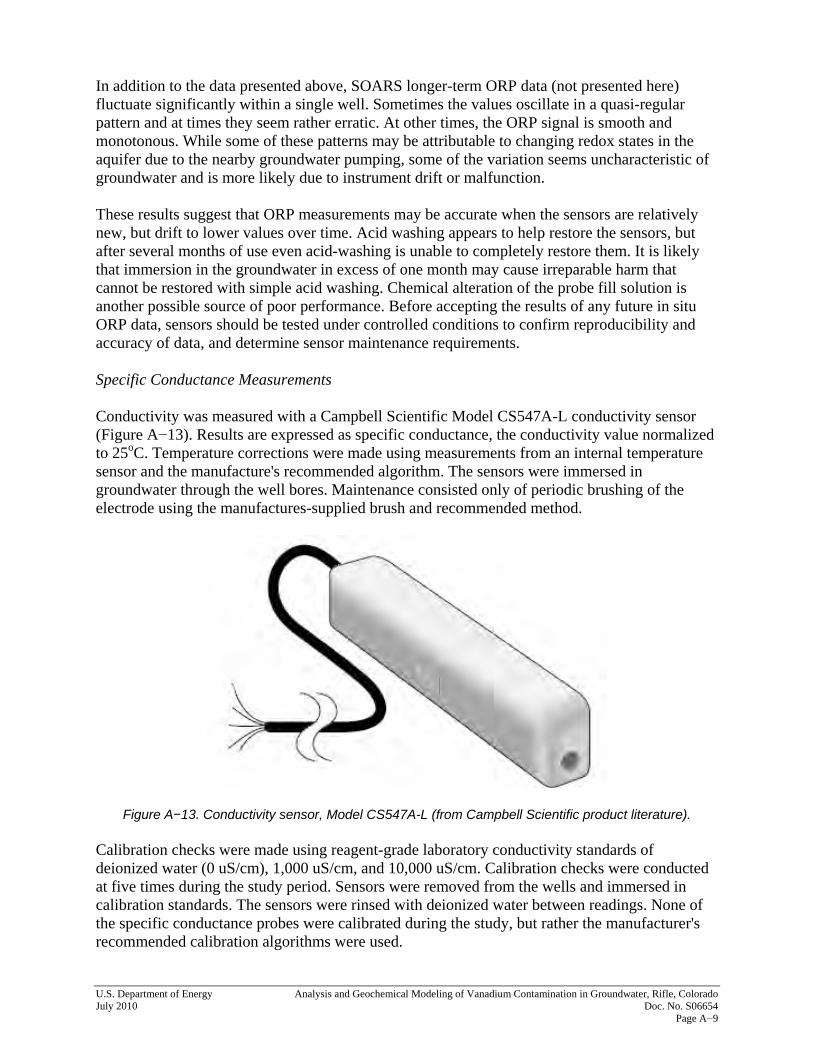
U.S. Department of Energy Analysis and Geochemical Modeling of Vanadium Contamination in Groundwater, Rifle, Colorado July 2010 Doc. No. S06654 Page A−9
In addition to the data presented above, SOARS longer-term ORP data (not presented here) fluctuate significantly within a single well. Sometimes the values oscillate in a quasi-regular pattern and at times they seem rather erratic. At other times, the ORP signal is smooth and monotonous. While some of these patterns may be attributable to changing redox states in the aquifer due to the nearby groundwater pumping, some of the variation seems uncharacteristic of groundwater and is more likely due to instrument drift or malfunction. These results suggest that ORP measurements may be accurate when the sensors are relatively new, but drift to lower values over time. Acid washing appears to help restore the sensors, but after several months of use even acid-washing is unable to completely restore them. It is likely that immersion in the groundwater in excess of one month may cause irreparable harm that cannot be restored with simple acid washing. Chemical alteration of the probe fill solution is another possible source of poor performance. Before accepting the results of any future in situ ORP data, sensors should be tested under controlled conditions to confirm reproducibility and accuracy of data, and determine sensor maintenance requirements. Specific Conductance Measurements Conductivity was measured with a Campbell Scientific Model CS547A-L conductivity sensor (Figure A−13). Results are expressed as specific conductance, the conductivity value normalized to 25oC. Temperature corrections were made using measurements from an internal temperature sensor and the manufacture's recommended algorithm. The sensors were immersed in groundwater through the well bores. Maintenance consisted only of periodic brushing of the electrode using the manufactures-supplied brush and recommended method.
Figure A−13. Conductivity sensor, Model CS547A-L (from Campbell Scientific product literature). Calibration checks were made using reagent-grade laboratory conductivity standards of deionized water (0 uS/cm), 1,000 uS/cm, and 10,000 uS/cm. Calibration checks were conducted at five times during the study period. Sensors were removed from the wells and immersed in calibration standards. The sensors were rinsed with deionized water between readings. None of the specific conductance probes were calibrated during the study, but rather the manufacturer's recommended calibration algorithms were used.
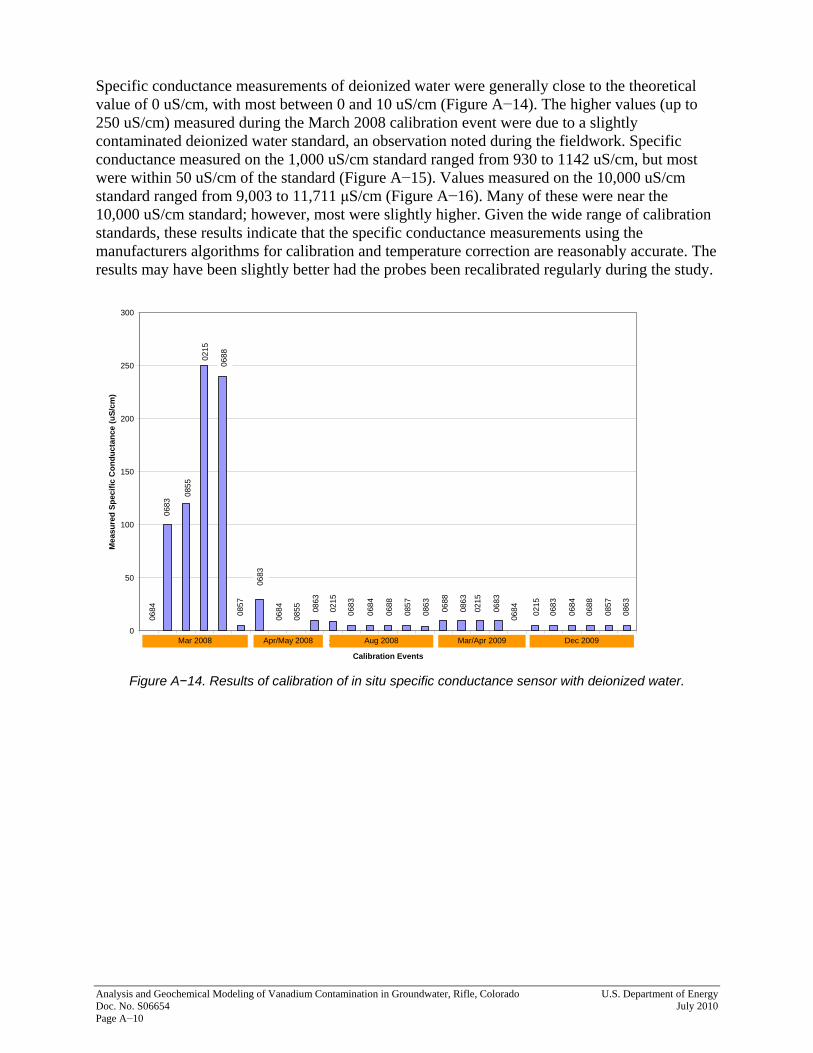
Analysis and Geochemical Modeling of Vanadium Contamination in Groundwater, Rifle, Colorado U.S. Department of Energy Doc. No. S06654 July 2010 Page A−10
Specific conductance measurements of deionized water were generally close to the theoretical value of 0 uS/cm, with most between 0 and 10 uS/cm (Figure A−14). The higher values (up to 250 uS/cm) measured during the March 2008 calibration event were due to a slightly contaminated deionized water standard, an observation noted during the fieldwork. Specific conductance measured on the 1,000 uS/cm standard ranged from 930 to 1142 uS/cm, but most were within 50 uS/cm of the standard (Figure A−15). Values measured on the 10,000 uS/cm standard ranged from 9,003 to 11,711 μS/cm (Figure A−16). Many of these were near the 10,000 uS/cm standard; however, most were slightly higher. Given the wide range of calibration standards, these results indicate that the specific conductance measurements using the manufacturers algorithms for calibration and temperature correction are reasonably accurate. The results may have been slightly better had the probes been recalibrated regularly during the study.
0
50
100
150
200
250
300
1 2 3 4 5 6 7 8 9 10 11 12 13 14 15 16 17 18 19 20 21 22 23 24 25 26 27
Calibration Events
Mea
sure
d Sp
ecifi
c C
ondu
ctan
ce (u
S/cm
)
Mar 2008 Apr/May 2008 Aug 2008 Mar/Apr 2009 Dec 2009
0684
0684 06
84
0684 06
84
0683
0683
0683 0683
0683
0855
0855
0215
0215
0215
0215
0688
0688 0688
0688
0857
0857
08570863
0863 0863
0863
Figure A−14. Results of calibration of in situ specific conductance sensor with deionized water.
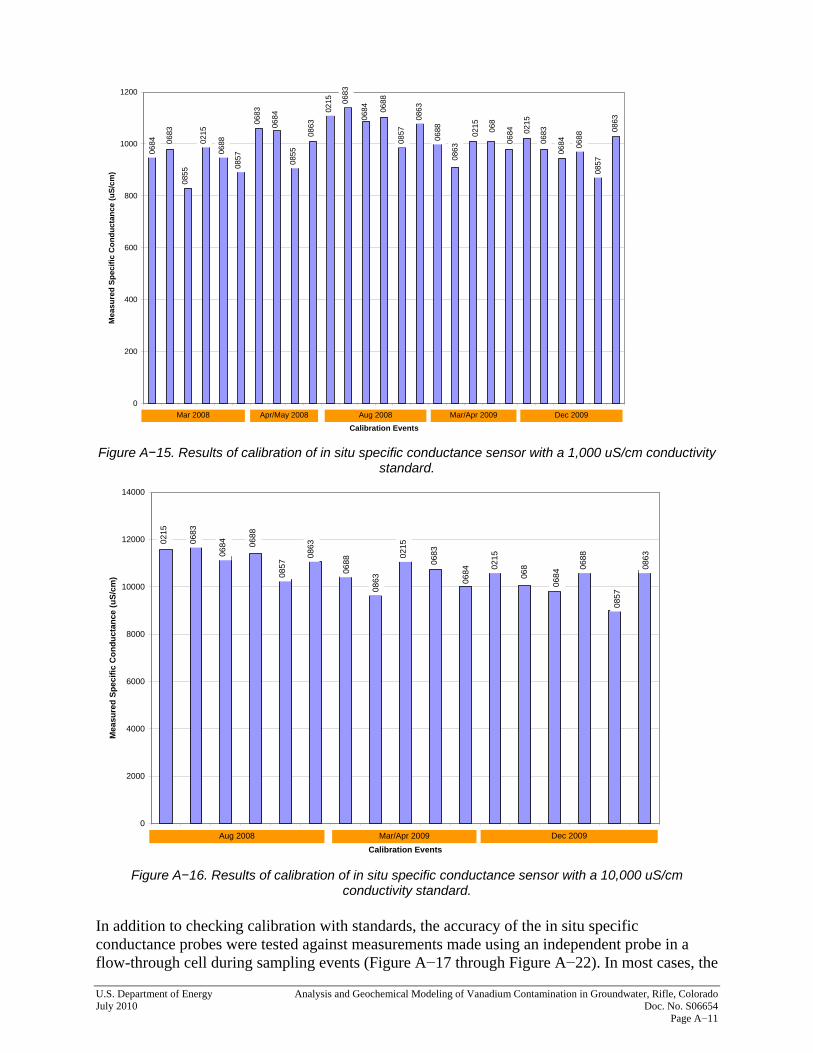
U.S. Department of Energy Analysis and Geochemical Modeling of Vanadium Contamination in Groundwater, Rifle, Colorado July 2010 Doc. No. S06654 Page A−11
0
200
400
600
800
1000
1200
1 2 3 4 5 6 7 8 9 10 11 12 13 14 15 16 17 18 19 20 21 22 23 24 25 26 27
Calibration Events
Mea
sure
d Sp
ecifi
c C
ondu
ctan
ce (u
S/cm
)
Mar 2008 Apr/May 2008 Aug 2008 Mar/Apr 2009 Dec 2009
0684
0684 06
84
0684
068406
83
0683
0683
068
0683
0855
0855
0215
0215
0215
0215
0688
0688
0688
0688
0857
0857
0857
0863
0863
0863
0863
Figure A−15. Results of calibration of in situ specific conductance sensor with a 1,000 uS/cm conductivity
standard.
0
2000
4000
6000
8000
10000
12000
14000
1 2 3 4 5 6 7 8 9 10 11 12 13 14 15 16 17
Calibration Events
Mea
sure
d Sp
ecifi
c C
ondu
ctan
ce (u
S/cm
)
Aug 2008 Mar/Apr 2009 Dec 2009
0684
0684
0684
0683
0683
068
0215
0215
0215
0688
0688 0688
0857
0857
0863
0863
0863
Figure A−16. Results of calibration of in situ specific conductance sensor with a 10,000 uS/cm
conductivity standard. In addition to checking calibration with standards, the accuracy of the in situ specific conductance probes were tested against measurements made using an independent probe in a flow-through cell during sampling events (Figure A−17 through Figure A−22). In most cases, the
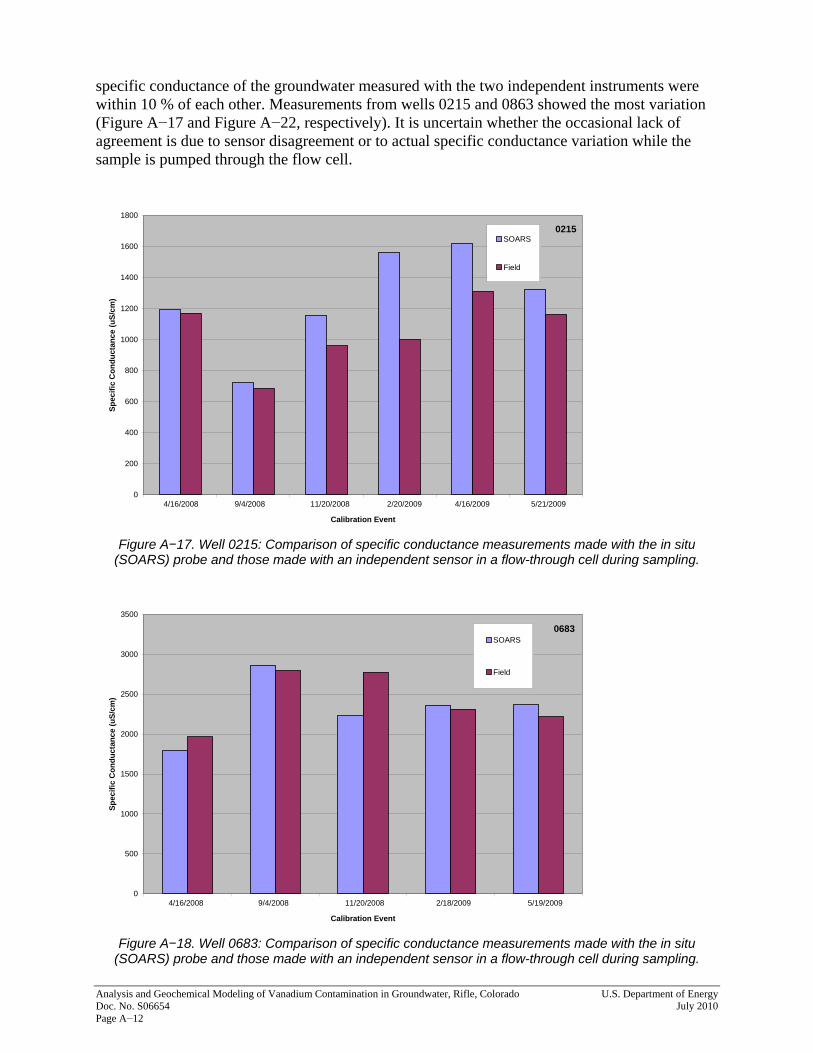
Analysis and Geochemical Modeling of Vanadium Contamination in Groundwater, Rifle, Colorado U.S. Department of Energy Doc. No. S06654 July 2010 Page A−12
specific conductance of the groundwater measured with the two independent instruments were within 10 % of each other. Measurements from wells 0215 and 0863 showed the most variation (Figure A−17 and Figure A−22, respectively). It is uncertain whether the occasional lack of agreement is due to sensor disagreement or to actual specific conductance variation while the sample is pumped through the flow cell.
0215
0
200
400
600
800
1000
1200
1400
1600
1800
1 2 3 4 5 6
Calibration Event
Spec
ific
Con
duct
ance
(uS/
cm)
SOARS
Field
4/16/2008 9/4/2008 11/20/2008 2/20/2009 4/16/2009 5/21/2009
Figure A−17. Well 0215: Comparison of specific conductance measurements made with the in situ
(SOARS) probe and those made with an independent sensor in a flow-through cell during sampling.
0683
0
500
1000
1500
2000
2500
3000
3500
1 2 3 4 5
Calibration Event
Spec
ific
Con
duct
ance
(uS/
cm)
SOARS
Field
4/16/2008 9/4/2008 11/20/2008 2/18/2009 5/19/2009
Figure A−18. Well 0683: Comparison of specific conductance measurements made with the in situ
(SOARS) probe and those made with an independent sensor in a flow-through cell during sampling.
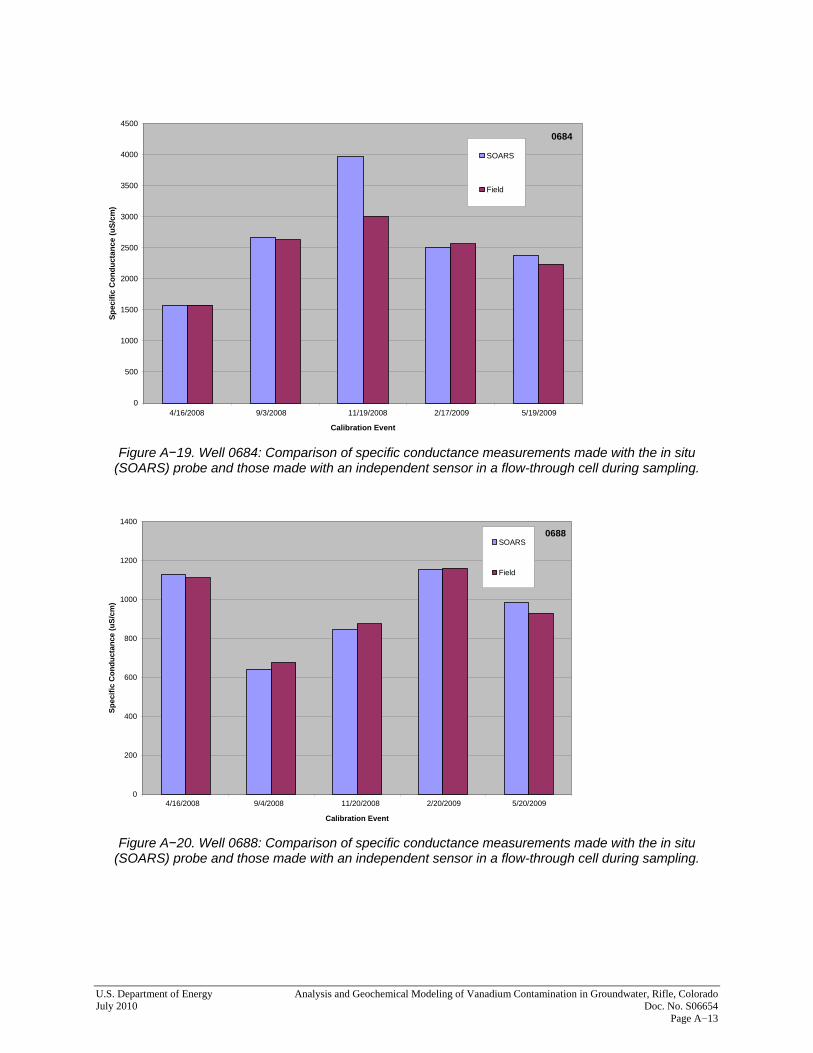
U.S. Department of Energy Analysis and Geochemical Modeling of Vanadium Contamination in Groundwater, Rifle, Colorado July 2010 Doc. No. S06654 Page A−13
0684
0
500
1000
1500
2000
2500
3000
3500
4000
4500
1 2 3 4 5
Calibration Event
Spec
ific
Con
duct
ance
(uS/
cm)
SOARS
Field
4/16/2008 9/3/2008 11/19/2008 2/17/2009 5/19/2009
Figure A−19. Well 0684: Comparison of specific conductance measurements made with the in situ
(SOARS) probe and those made with an independent sensor in a flow-through cell during sampling.
0688
0
200
400
600
800
1000
1200
1400
1 2 3 4 5
Calibration Event
Spec
ific
Con
duct
ance
(uS/
cm)
SOARS
Field
4/16/2008 9/4/2008 11/20/2008 2/20/2009 5/20/2009
Figure A−20. Well 0688: Comparison of specific conductance measurements made with the in situ
(SOARS) probe and those made with an independent sensor in a flow-through cell during sampling.
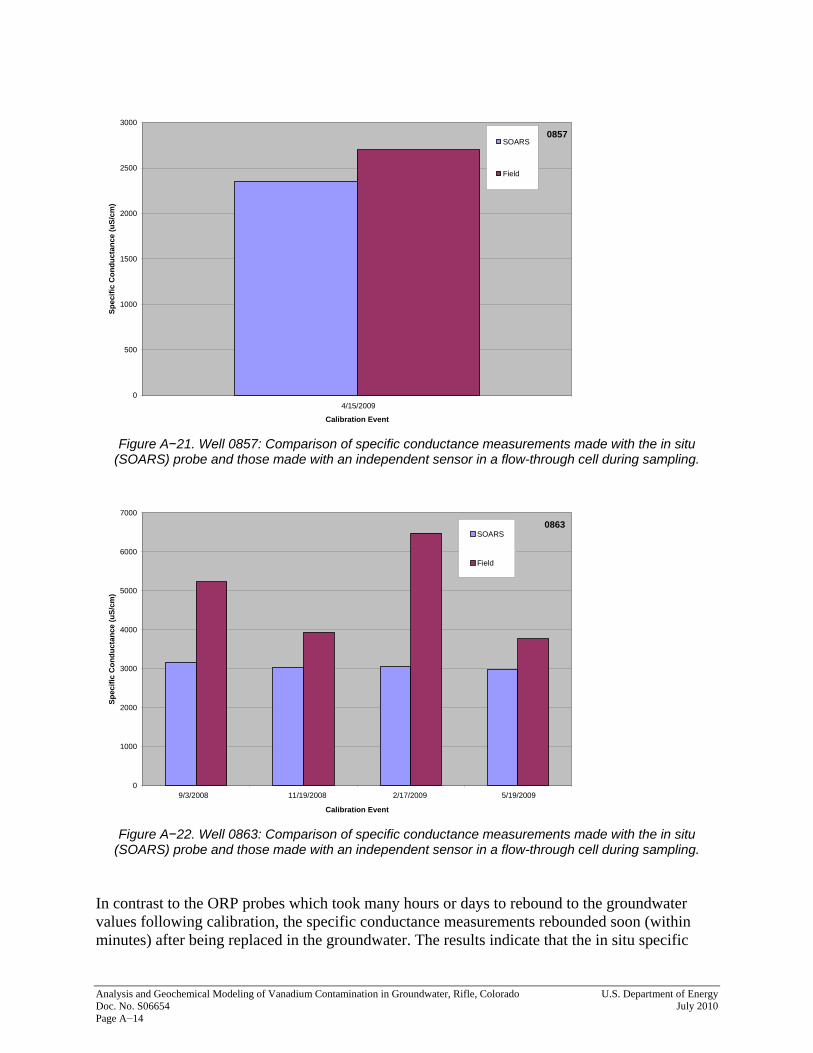
Analysis and Geochemical Modeling of Vanadium Contamination in Groundwater, Rifle, Colorado U.S. Department of Energy Doc. No. S06654 July 2010 Page A−14
0857
0
500
1000
1500
2000
2500
3000
1
Calibration Event
Spec
ific
Con
duct
ance
(uS/
cm)
SOARS
Field
4/15/2009
Figure A−21. Well 0857: Comparison of specific conductance measurements made with the in situ
(SOARS) probe and those made with an independent sensor in a flow-through cell during sampling.
0863
0
1000
2000
3000
4000
5000
6000
7000
1 2 3 4
Calibration Event
Spec
ific
Con
duct
ance
(uS/
cm)
SOARS
Field
9/3/2008 11/19/2008 2/17/2009 5/19/2009
Figure A−22. Well 0863: Comparison of specific conductance measurements made with the in situ
(SOARS) probe and those made with an independent sensor in a flow-through cell during sampling. In contrast to the ORP probes which took many hours or days to rebound to the groundwater values following calibration, the specific conductance measurements rebounded soon (within minutes) after being replaced in the groundwater. The results indicate that the in situ specific
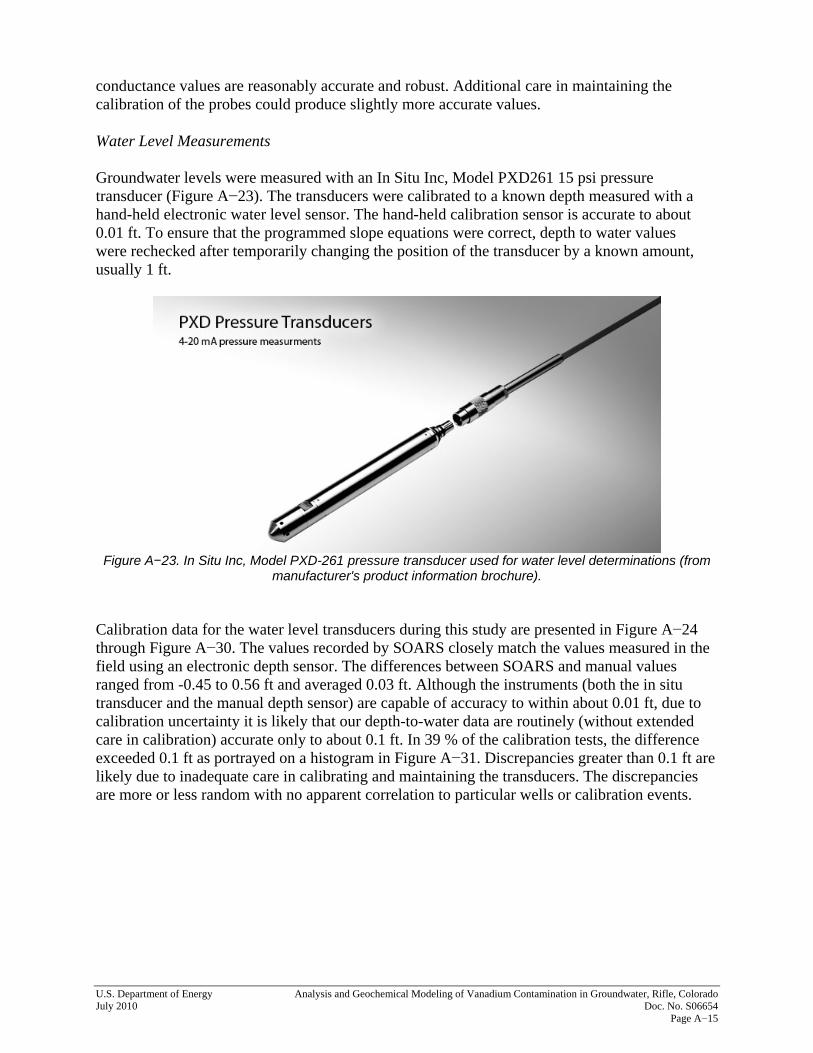
U.S. Department of Energy Analysis and Geochemical Modeling of Vanadium Contamination in Groundwater, Rifle, Colorado July 2010 Doc. No. S06654 Page A−15
conductance values are reasonably accurate and robust. Additional care in maintaining the calibration of the probes could produce slightly more accurate values. Water Level Measurements Groundwater levels were measured with an In Situ Inc, Model PXD261 15 psi pressure transducer (Figure A−23). The transducers were calibrated to a known depth measured with a hand-held electronic water level sensor. The hand-held calibration sensor is accurate to about 0.01 ft. To ensure that the programmed slope equations were correct, depth to water values were rechecked after temporarily changing the position of the transducer by a known amount, usually 1 ft.
Figure A−23. In Situ Inc, Model PXD-261 pressure transducer used for water level determinations (from
manufacturer's product information brochure). Calibration data for the water level transducers during this study are presented in Figure A−24 through Figure A−30. The values recorded by SOARS closely match the values measured in the field using an electronic depth sensor. The differences between SOARS and manual values ranged from -0.45 to 0.56 ft and averaged 0.03 ft. Although the instruments (both the in situ transducer and the manual depth sensor) are capable of accuracy to within about 0.01 ft, due to calibration uncertainty it is likely that our depth-to-water data are routinely (without extended care in calibration) accurate only to about 0.1 ft. In 39 % of the calibration tests, the difference exceeded 0.1 ft as portrayed on a histogram in Figure A−31. Discrepancies greater than 0.1 ft are likely due to inadequate care in calibrating and maintaining the transducers. The discrepancies are more or less random with no apparent correlation to particular wells or calibration events.
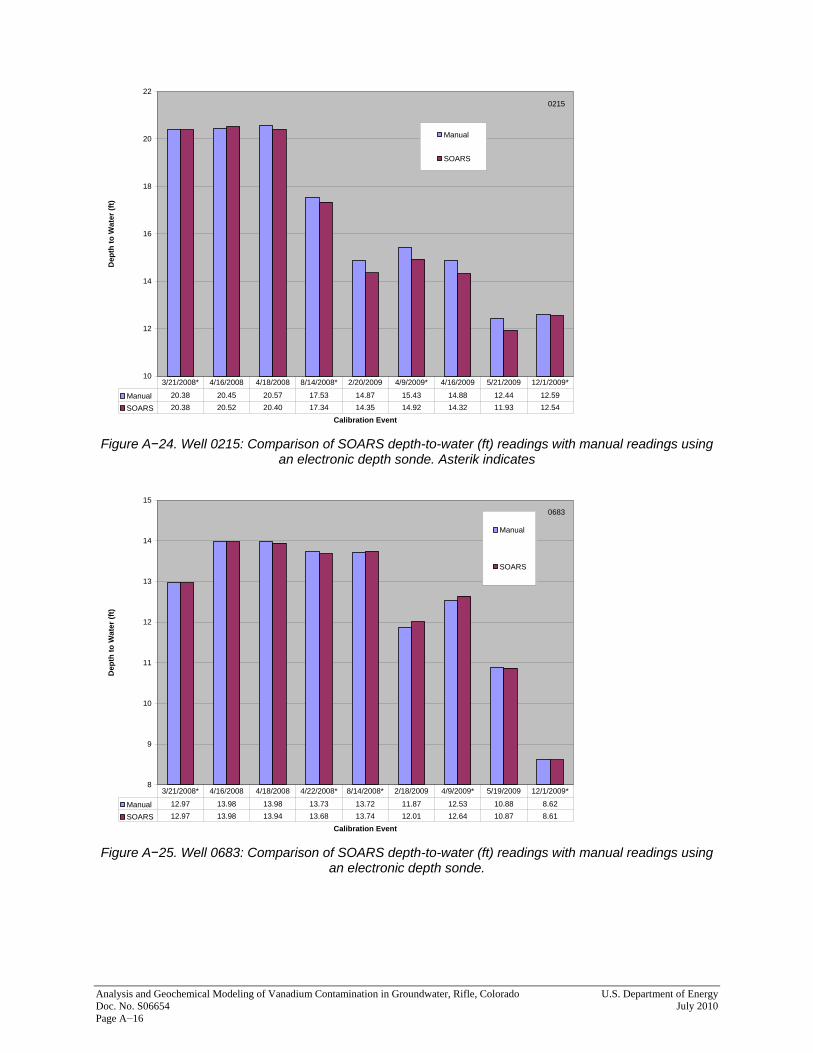
Analysis and Geochemical Modeling of Vanadium Contamination in Groundwater, Rifle, Colorado U.S. Department of Energy Doc. No. S06654 July 2010 Page A−16
10
12
14
16
18
20
22
Calibration Event
Dep
th to
Wat
er (f
t)
Manual
SOARS
Manual 20.38 20.45 20.57 17.53 14.87 15.43 14.88 12.44 12.59
SOARS 20.38 20.52 20.40 17.34 14.35 14.92 14.32 11.93 12.54
3/21/2008* 4/16/2008 4/18/2008 8/14/2008* 2/20/2009 4/9/2009* 4/16/2009 5/21/2009 12/1/2009*
0215
Figure A−24. Well 0215: Comparison of SOARS depth-to-water (ft) readings with manual readings using
an electronic depth sonde. Asterik indicates
8
9
10
11
12
13
14
15
Calibration Event
Dep
th to
Wat
er (f
t)
Manual
SOARS
Manual 12.97 13.98 13.98 13.73 13.72 11.87 12.53 10.88 8.62
SOARS 12.97 13.98 13.94 13.68 13.74 12.01 12.64 10.87 8.61
3/21/2008* 4/16/2008 4/18/2008 4/22/2008* 8/14/2008* 2/18/2009 4/9/2009* 5/19/2009 12/1/2009*
0683
Figure A−25. Well 0683: Comparison of SOARS depth-to-water (ft) readings with manual readings using
an electronic depth sonde.
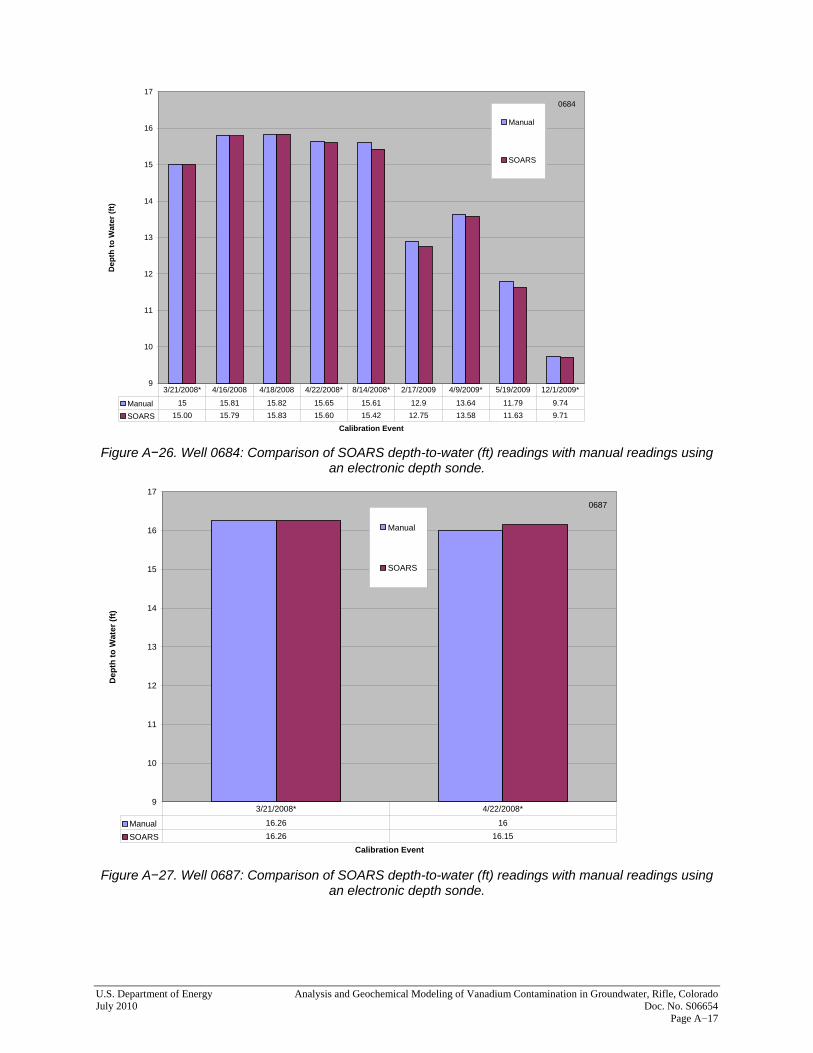
U.S. Department of Energy Analysis and Geochemical Modeling of Vanadium Contamination in Groundwater, Rifle, Colorado July 2010 Doc. No. S06654 Page A−17
9
10
11
12
13
14
15
16
17
Calibration Event
Dep
th to
Wat
er (f
t)Manual
SOARS
Manual 15 15.81 15.82 15.65 15.61 12.9 13.64 11.79 9.74
SOARS 15.00 15.79 15.83 15.60 15.42 12.75 13.58 11.63 9.71
3/21/2008* 4/16/2008 4/18/2008 4/22/2008* 8/14/2008* 2/17/2009 4/9/2009* 5/19/2009 12/1/2009*
0684
Figure A−26. Well 0684: Comparison of SOARS depth-to-water (ft) readings with manual readings using
an electronic depth sonde.
9
10
11
12
13
14
15
16
17
Calibration Event
Dep
th to
Wat
er (f
t)
Manual
SOARS
Manual 16.26 16
SOARS 16.26 16.15
3/21/2008* 4/22/2008*
0687
Figure A−27. Well 0687: Comparison of SOARS depth-to-water (ft) readings with manual readings using
an electronic depth sonde.
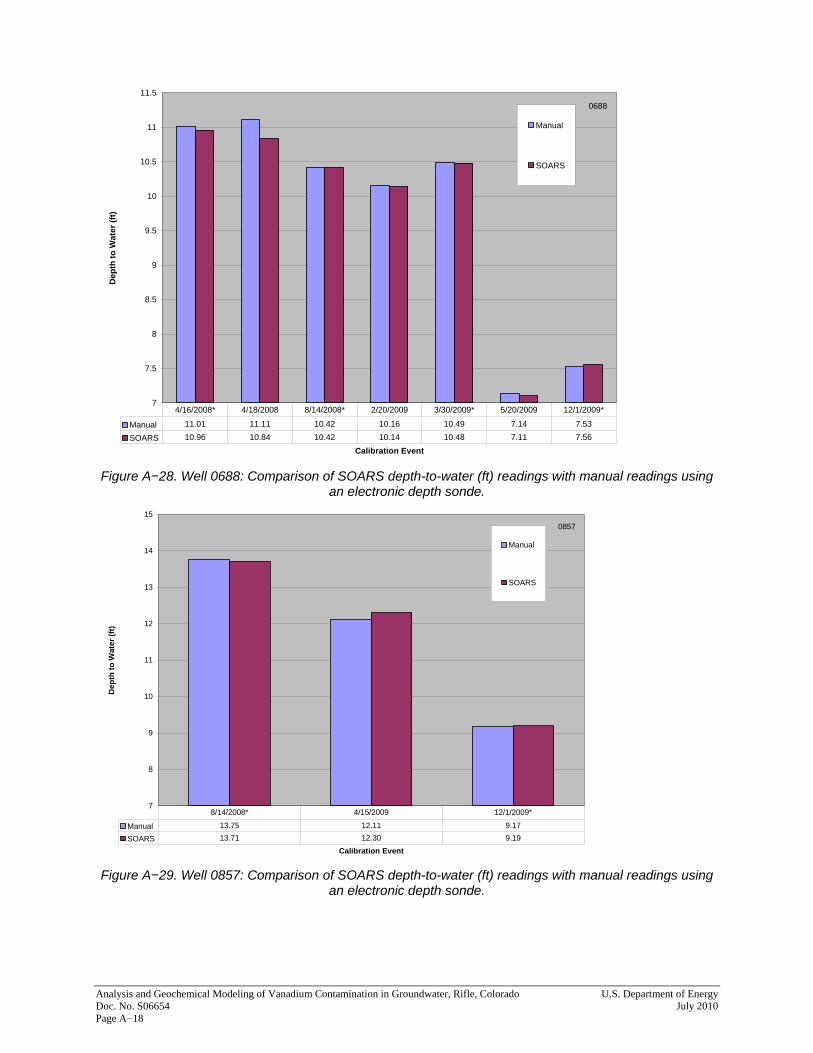
Analysis and Geochemical Modeling of Vanadium Contamination in Groundwater, Rifle, Colorado U.S. Department of Energy Doc. No. S06654 July 2010 Page A−18
7
7.5
8
8.5
9
9.5
10
10.5
11
11.5
Calibration Event
Dep
th to
Wat
er (f
t)Manual
SOARS
Manual 11.01 11.11 10.42 10.16 10.49 7.14 7.53
SOARS 10.96 10.84 10.42 10.14 10.48 7.11 7.56
4/16/2008* 4/18/2008 8/14/2008* 2/20/2009 3/30/2009* 5/20/2009 12/1/2009*
0688
Figure A−28. Well 0688: Comparison of SOARS depth-to-water (ft) readings with manual readings using
an electronic depth sonde.
7
8
9
10
11
12
13
14
15
Calibration Event
Dep
th to
Wat
er (f
t)
Manual
SOARS
Manual 13.75 12.11 9.17
SOARS 13.71 12.30 9.19
8/14/2008* 4/15/2009 12/1/2009*
0857
Figure A−29. Well 0857: Comparison of SOARS depth-to-water (ft) readings with manual readings using
an electronic depth sonde.
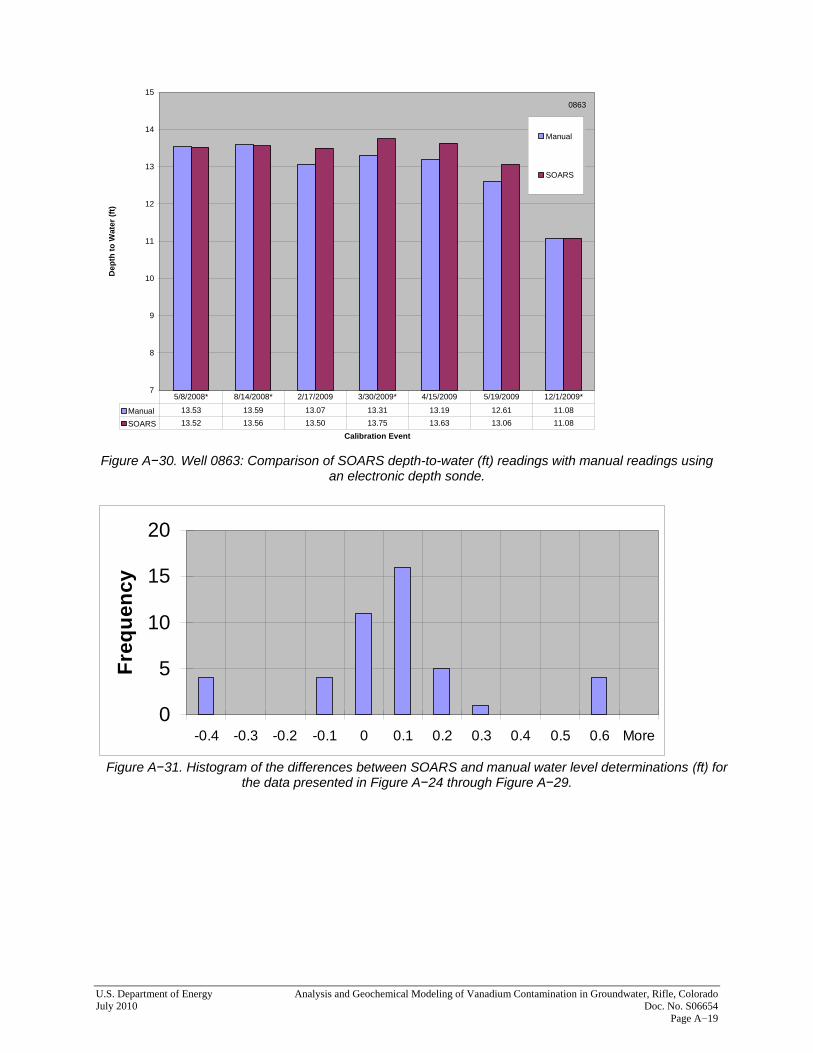
U.S. Department of Energy Analysis and Geochemical Modeling of Vanadium Contamination in Groundwater, Rifle, Colorado July 2010 Doc. No. S06654 Page A−19
7
8
9
10
11
12
13
14
15
Calibration Event
Dep
th to
Wat
er (f
t)
Manual
SOARS
Manual 13.53 13.59 13.07 13.31 13.19 12.61 11.08
SOARS 13.52 13.56 13.50 13.75 13.63 13.06 11.08
5/8/2008* 8/14/2008* 2/17/2009 3/30/2009* 4/15/2009 5/19/2009 12/1/2009*
0863
Figure A−30. Well 0863: Comparison of SOARS depth-to-water (ft) readings with manual readings using
an electronic depth sonde.
0
5
10
15
20
-0.4 -0.3 -0.2 -0.1 0 0.1 0.2 0.3 0.4 0.5 0.6 More
Freq
uenc
y
Figure A−31. Histogram of the differences between SOARS and manual water level determinations (ft) for
the data presented in Figure A−24 through Figure A−29.
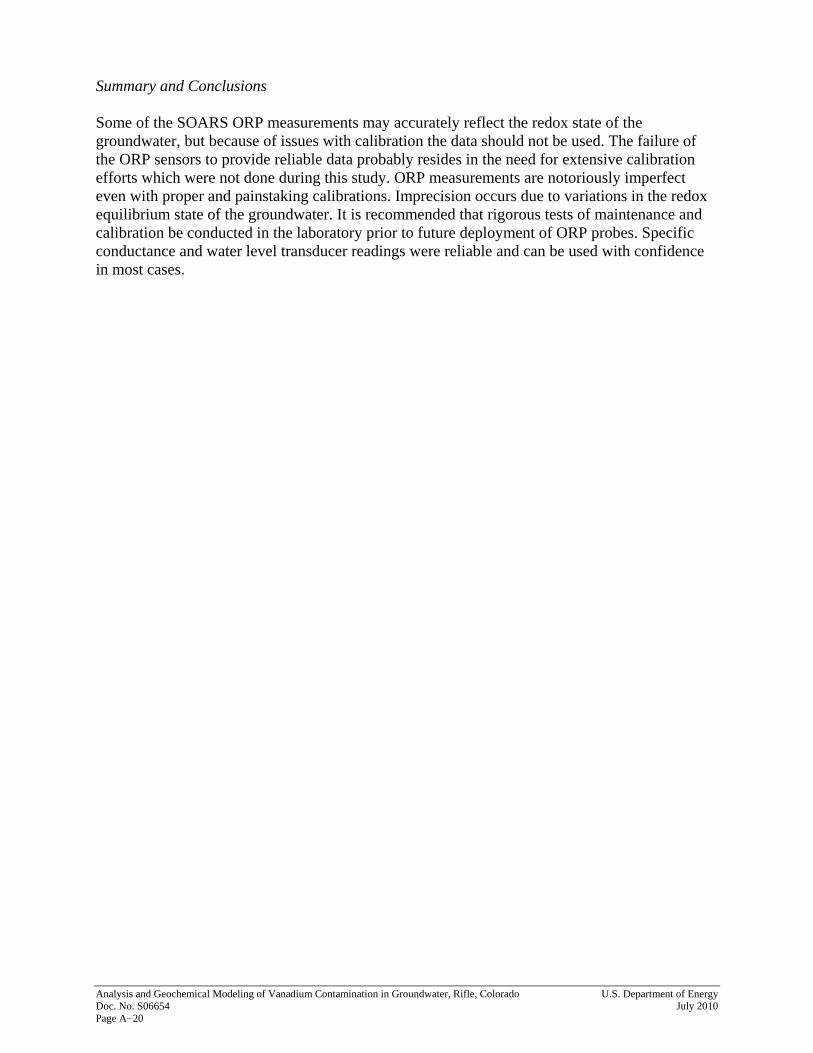
Analysis and Geochemical Modeling of Vanadium Contamination in Groundwater, Rifle, Colorado U.S. Department of Energy Doc. No. S06654 July 2010 Page A−20
Summary and Conclusions Some of the SOARS ORP measurements may accurately reflect the redox state of the groundwater, but because of issues with calibration the data should not be used. The failure of the ORP sensors to provide reliable data probably resides in the need for extensive calibration efforts which were not done during this study. ORP measurements are notoriously imperfect even with proper and painstaking calibrations. Imprecision occurs due to variations in the redox equilibrium state of the groundwater. It is recommended that rigorous tests of maintenance and calibration be conducted in the laboratory prior to future deployment of ORP probes. Specific conductance and water level transducer readings were reliable and can be used with confidence in most cases.
Appendix B
Chemical Data

This page intentionally left blank
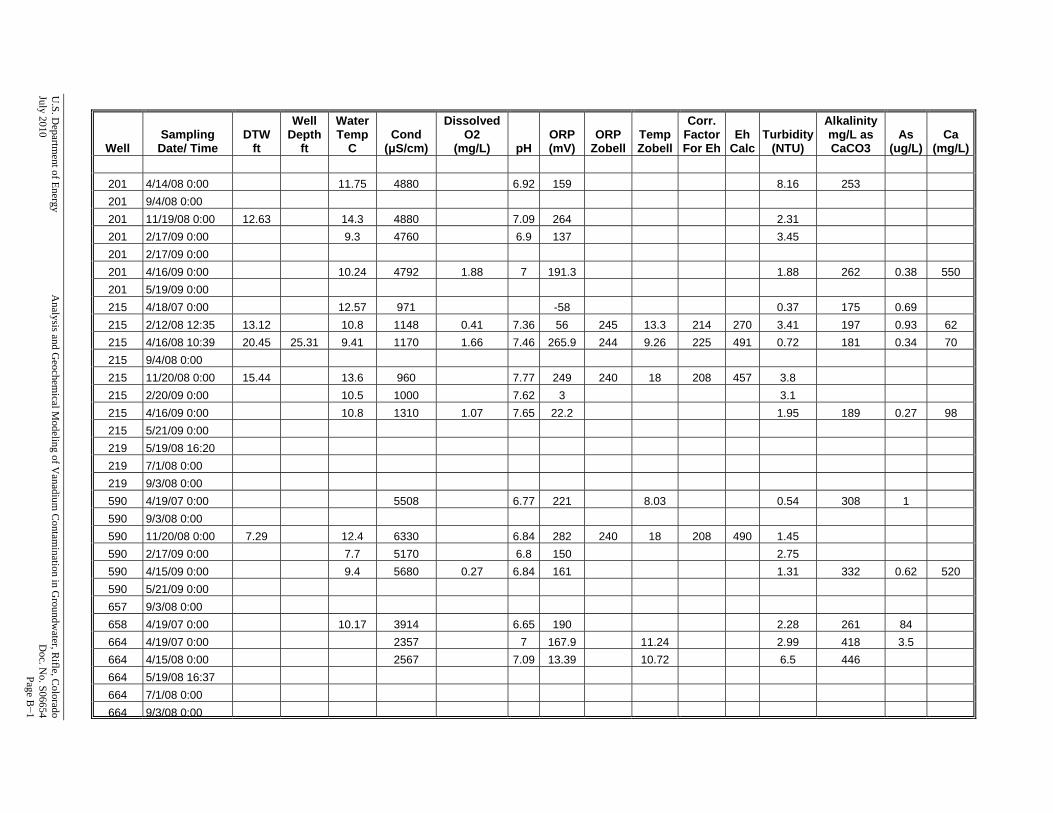
U.S. D
epartment of Energy
Analysis and G
eochemical M
odeling of Vanadium
Contam
ination in Groundw
ater, Rifle, C
olorado July 2010
D
oc. No. S06654
Page B−1
Well Sampling Date/ Time
DTW ft
Well Depth
ft
Water Temp
C Cond
(μS/cm)
Dissolved O2
(mg/L) pH ORP (mV)
ORP Zobell
Temp Zobell
Corr. FactorFor Eh
Eh Calc
Turbidity(NTU)
Alkalinity mg/L as CaCO3
As (ug/L)
Ca (mg/L)
201 4/14/08 0:00 11.75 4880 6.92 159 8.16 253 201 9/4/08 0:00 201 11/19/08 0:00 12.63 14.3 4880 7.09 264 2.31 201 2/17/09 0:00 9.3 4760 6.9 137 3.45 201 2/17/09 0:00 201 4/16/09 0:00 10.24 4792 1.88 7 191.3 1.88 262 0.38 550 201 5/19/09 0:00 215 4/18/07 0:00 12.57 971 -58 0.37 175 0.69 215 2/12/08 12:35 13.12 10.8 1148 0.41 7.36 56 245 13.3 214 270 3.41 197 0.93 62 215 4/16/08 10:39 20.45 25.31 9.41 1170 1.66 7.46 265.9 244 9.26 225 491 0.72 181 0.34 70 215 9/4/08 0:00 215 11/20/08 0:00 15.44 13.6 960 7.77 249 240 18 208 457 3.8 215 2/20/09 0:00 10.5 1000 7.62 3 3.1 215 4/16/09 0:00 10.8 1310 1.07 7.65 22.2 1.95 189 0.27 98 215 5/21/09 0:00 219 5/19/08 16:20 219 7/1/08 0:00 219 9/3/08 0:00 590 4/19/07 0:00 5508 6.77 221 8.03 0.54 308 1 590 9/3/08 0:00 590 11/20/08 0:00 7.29 12.4 6330 6.84 282 240 18 208 490 1.45 590 2/17/09 0:00 7.7 5170 6.8 150 2.75 590 4/15/09 0:00 9.4 5680 0.27 6.84 161 1.31 332 0.62 520 590 5/21/09 0:00 657 9/3/08 0:00 658 4/19/07 0:00 10.17 3914 6.65 190 2.28 261 84 664 4/19/07 0:00 2357 7 167.9 11.24 2.99 418 3.5 664 4/15/08 0:00 2567 7.09 13.39 10.72 6.5 446 664 5/19/08 16:37 664 7/1/08 0:00 664 9/3/08 0:00
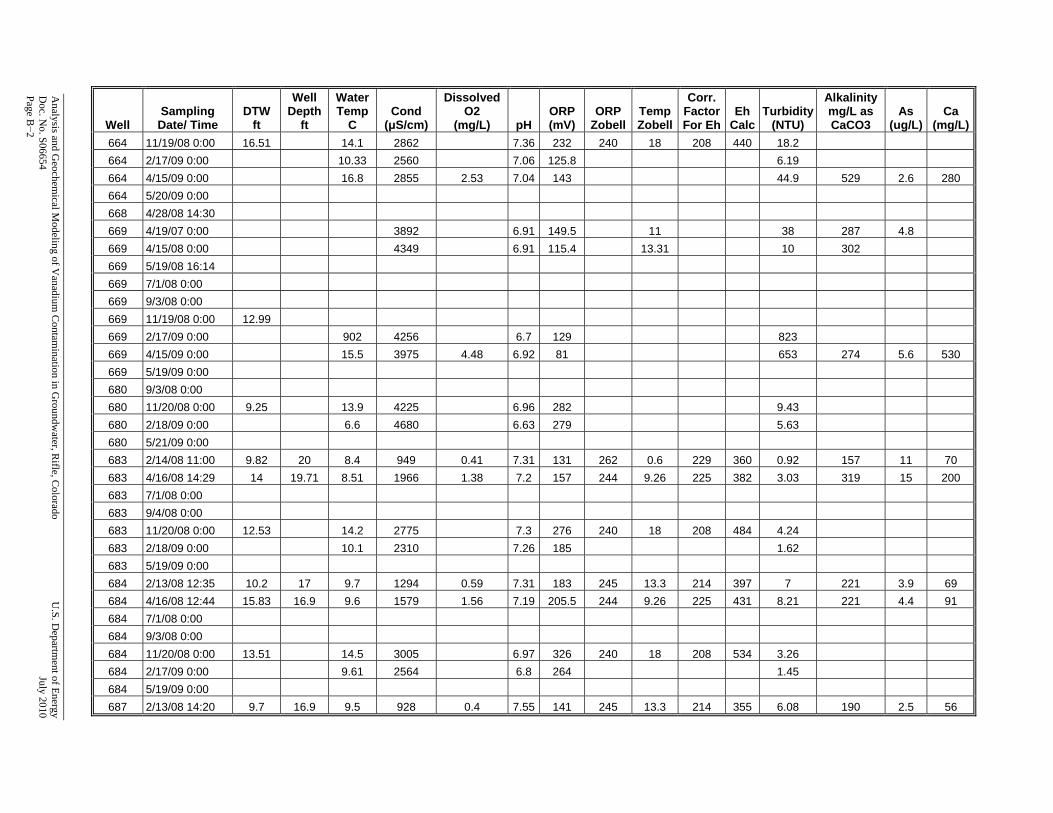
Analysis and G
eochemical M
odeling of Vanadium
Contam
ination in Groundw
ater, Rifle, C
olorado U
.S. Departm
ent of Energy D
oc. No. S06654
July 2010
Page B−2
Well Sampling Date/ Time
DTW ft
Well Depth
ft
Water Temp
C Cond
(μS/cm)
Dissolved O2
(mg/L) pH ORP (mV)
ORP Zobell
Temp Zobell
Corr. FactorFor Eh
Eh Calc
Turbidity(NTU)
Alkalinity mg/L as CaCO3
As (ug/L)
Ca (mg/L)
664 11/19/08 0:00 16.51 14.1 2862 7.36 232 240 18 208 440 18.2 664 2/17/09 0:00 10.33 2560 7.06 125.8 6.19 664 4/15/09 0:00 16.8 2855 2.53 7.04 143 44.9 529 2.6 280 664 5/20/09 0:00 668 4/28/08 14:30 669 4/19/07 0:00 3892 6.91 149.5 11 38 287 4.8 669 4/15/08 0:00 4349 6.91 115.4 13.31 10 302 669 5/19/08 16:14 669 7/1/08 0:00 669 9/3/08 0:00 669 11/19/08 0:00 12.99 669 2/17/09 0:00 902 4256 6.7 129 823 669 4/15/09 0:00 15.5 3975 4.48 6.92 81 653 274 5.6 530 669 5/19/09 0:00 680 9/3/08 0:00 680 11/20/08 0:00 9.25 13.9 4225 6.96 282 9.43 680 2/18/09 0:00 6.6 4680 6.63 279 5.63 680 5/21/09 0:00 683 2/14/08 11:00 9.82 20 8.4 949 0.41 7.31 131 262 0.6 229 360 0.92 157 11 70 683 4/16/08 14:29 14 19.71 8.51 1966 1.38 7.2 157 244 9.26 225 382 3.03 319 15 200 683 7/1/08 0:00 683 9/4/08 0:00 683 11/20/08 0:00 12.53 14.2 2775 7.3 276 240 18 208 484 4.24 683 2/18/09 0:00 10.1 2310 7.26 185 1.62 683 5/19/09 0:00 684 2/13/08 12:35 10.2 17 9.7 1294 0.59 7.31 183 245 13.3 214 397 7 221 3.9 69 684 4/16/08 12:44 15.83 16.9 9.6 1579 1.56 7.19 205.5 244 9.26 225 431 8.21 221 4.4 91 684 7/1/08 0:00 684 9/3/08 0:00 684 11/20/08 0:00 13.51 14.5 3005 6.97 326 240 18 208 534 3.26 684 2/17/09 0:00 9.61 2564 6.8 264 1.45 684 5/19/09 0:00 687 2/13/08 14:20 9.7 16.9 9.5 928 0.4 7.55 141 245 13.3 214 355 6.08 190 2.5 56
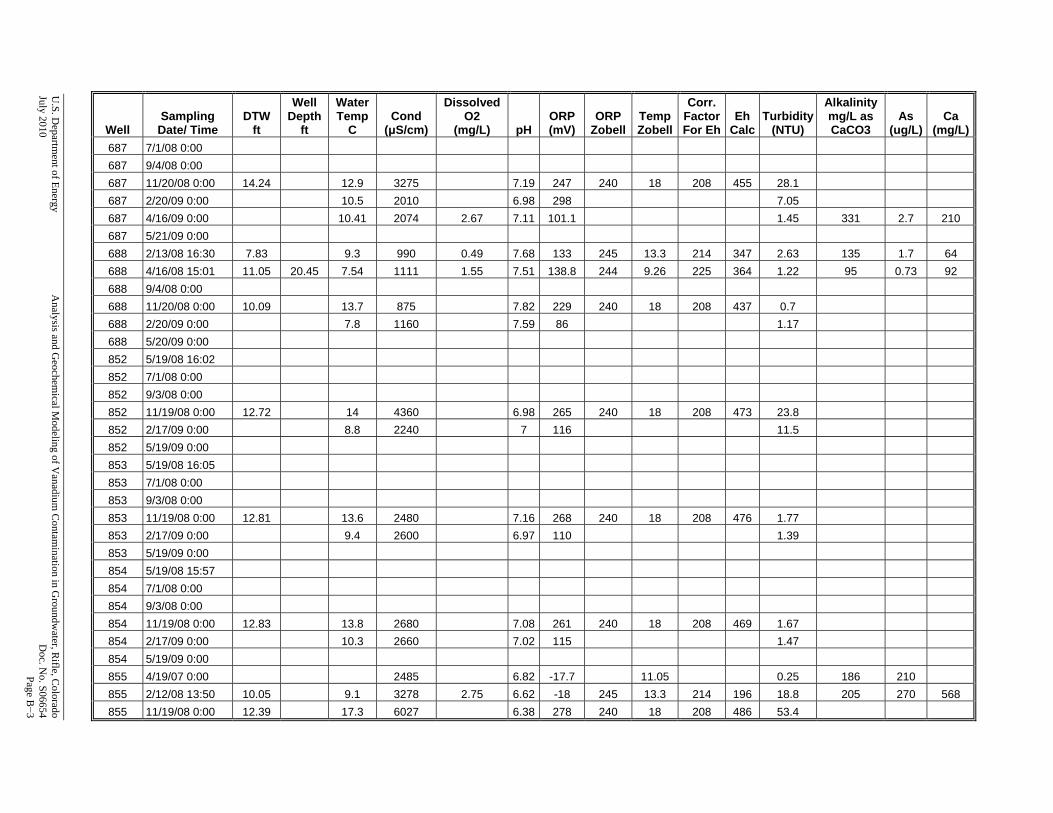
U.S. D
epartment of Energy
Analysis and G
eochemical M
odeling of Vanadium
Contam
ination in Groundw
ater, Rifle, C
olorado July 2010
D
oc. No. S06654
Page B−3
Well Sampling Date/ Time
DTW ft
Well Depth
ft
Water Temp
C Cond
(μS/cm)
Dissolved O2
(mg/L) pH ORP (mV)
ORP Zobell
Temp Zobell
Corr. FactorFor Eh
Eh Calc
Turbidity(NTU)
Alkalinity mg/L as CaCO3
As (ug/L)
Ca (mg/L)
687 7/1/08 0:00 687 9/4/08 0:00 687 11/20/08 0:00 14.24 12.9 3275 7.19 247 240 18 208 455 28.1 687 2/20/09 0:00 10.5 2010 6.98 298 7.05 687 4/16/09 0:00 10.41 2074 2.67 7.11 101.1 1.45 331 2.7 210 687 5/21/09 0:00 688 2/13/08 16:30 7.83 9.3 990 0.49 7.68 133 245 13.3 214 347 2.63 135 1.7 64 688 4/16/08 15:01 11.05 20.45 7.54 1111 1.55 7.51 138.8 244 9.26 225 364 1.22 95 0.73 92 688 9/4/08 0:00 688 11/20/08 0:00 10.09 13.7 875 7.82 229 240 18 208 437 0.7 688 2/20/09 0:00 7.8 1160 7.59 86 1.17 688 5/20/09 0:00 852 5/19/08 16:02 852 7/1/08 0:00 852 9/3/08 0:00 852 11/19/08 0:00 12.72 14 4360 6.98 265 240 18 208 473 23.8 852 2/17/09 0:00 8.8 2240 7 116 11.5 852 5/19/09 0:00 853 5/19/08 16:05 853 7/1/08 0:00 853 9/3/08 0:00 853 11/19/08 0:00 12.81 13.6 2480 7.16 268 240 18 208 476 1.77 853 2/17/09 0:00 9.4 2600 6.97 110 1.39 853 5/19/09 0:00 854 5/19/08 15:57 854 7/1/08 0:00 854 9/3/08 0:00 854 11/19/08 0:00 12.83 13.8 2680 7.08 261 240 18 208 469 1.67 854 2/17/09 0:00 10.3 2660 7.02 115 1.47 854 5/19/09 0:00 855 4/19/07 0:00 2485 6.82 -17.7 11.05 0.25 186 210 855 2/12/08 13:50 10.05 9.1 3278 2.75 6.62 -18 245 13.3 214 196 18.8 205 270 568 855 11/19/08 0:00 12.39 17.3 6027 6.38 278 240 18 208 486 53.4
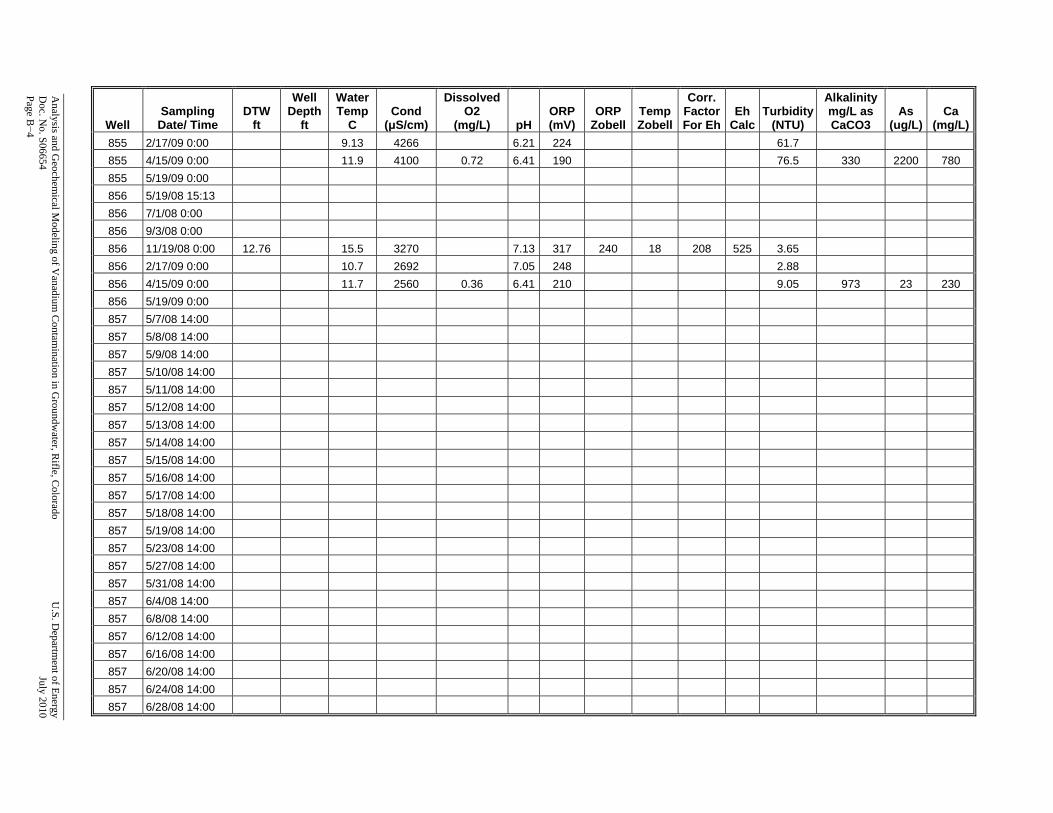
Analysis and G
eochemical M
odeling of Vanadium
Contam
ination in Groundw
ater, Rifle, C
olorado U
.S. Departm
ent of Energy D
oc. No. S06654
July 2010
Page B−4
Well Sampling Date/ Time
DTW ft
Well Depth
ft
Water Temp
C Cond
(μS/cm)
Dissolved O2
(mg/L) pH ORP (mV)
ORP Zobell
Temp Zobell
Corr. FactorFor Eh
Eh Calc
Turbidity(NTU)
Alkalinity mg/L as CaCO3
As (ug/L)
Ca (mg/L)
855 2/17/09 0:00 9.13 4266 6.21 224 61.7 855 4/15/09 0:00 11.9 4100 0.72 6.41 190 76.5 330 2200 780 855 5/19/09 0:00 856 5/19/08 15:13 856 7/1/08 0:00 856 9/3/08 0:00 856 11/19/08 0:00 12.76 15.5 3270 7.13 317 240 18 208 525 3.65 856 2/17/09 0:00 10.7 2692 7.05 248 2.88 856 4/15/09 0:00 11.7 2560 0.36 6.41 210 9.05 973 23 230 856 5/19/09 0:00 857 5/7/08 14:00 857 5/8/08 14:00 857 5/9/08 14:00 857 5/10/08 14:00 857 5/11/08 14:00 857 5/12/08 14:00 857 5/13/08 14:00 857 5/14/08 14:00 857 5/15/08 14:00 857 5/16/08 14:00 857 5/17/08 14:00 857 5/18/08 14:00 857 5/19/08 14:00 857 5/23/08 14:00 857 5/27/08 14:00 857 5/31/08 14:00 857 6/4/08 14:00 857 6/8/08 14:00 857 6/12/08 14:00 857 6/16/08 14:00 857 6/20/08 14:00 857 6/24/08 14:00 857 6/28/08 14:00
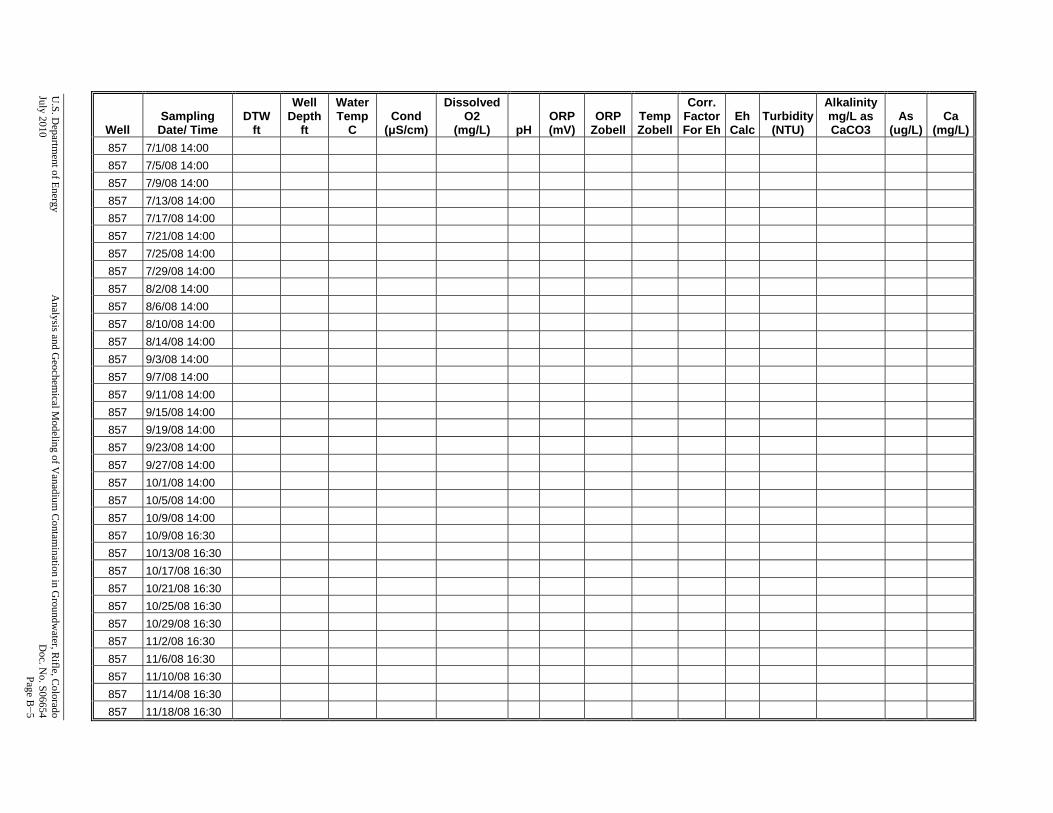
U.S. D
epartment of Energy
Analysis and G
eochemical M
odeling of Vanadium
Contam
ination in Groundw
ater, Rifle, C
olorado July 2010
D
oc. No. S06654
Page B−5
Well Sampling Date/ Time
DTW ft
Well Depth
ft
Water Temp
C Cond
(μS/cm)
Dissolved O2
(mg/L) pH ORP (mV)
ORP Zobell
Temp Zobell
Corr. FactorFor Eh
Eh Calc
Turbidity(NTU)
Alkalinity mg/L as CaCO3
As (ug/L)
Ca (mg/L)
857 7/1/08 14:00 857 7/5/08 14:00 857 7/9/08 14:00 857 7/13/08 14:00 857 7/17/08 14:00 857 7/21/08 14:00 857 7/25/08 14:00 857 7/29/08 14:00 857 8/2/08 14:00 857 8/6/08 14:00 857 8/10/08 14:00 857 8/14/08 14:00 857 9/3/08 14:00 857 9/7/08 14:00 857 9/11/08 14:00 857 9/15/08 14:00 857 9/19/08 14:00 857 9/23/08 14:00 857 9/27/08 14:00 857 10/1/08 14:00 857 10/5/08 14:00 857 10/9/08 14:00 857 10/9/08 16:30 857 10/13/08 16:30 857 10/17/08 16:30 857 10/21/08 16:30 857 10/25/08 16:30 857 10/29/08 16:30 857 11/2/08 16:30 857 11/6/08 16:30 857 11/10/08 16:30 857 11/14/08 16:30 857 11/18/08 16:30
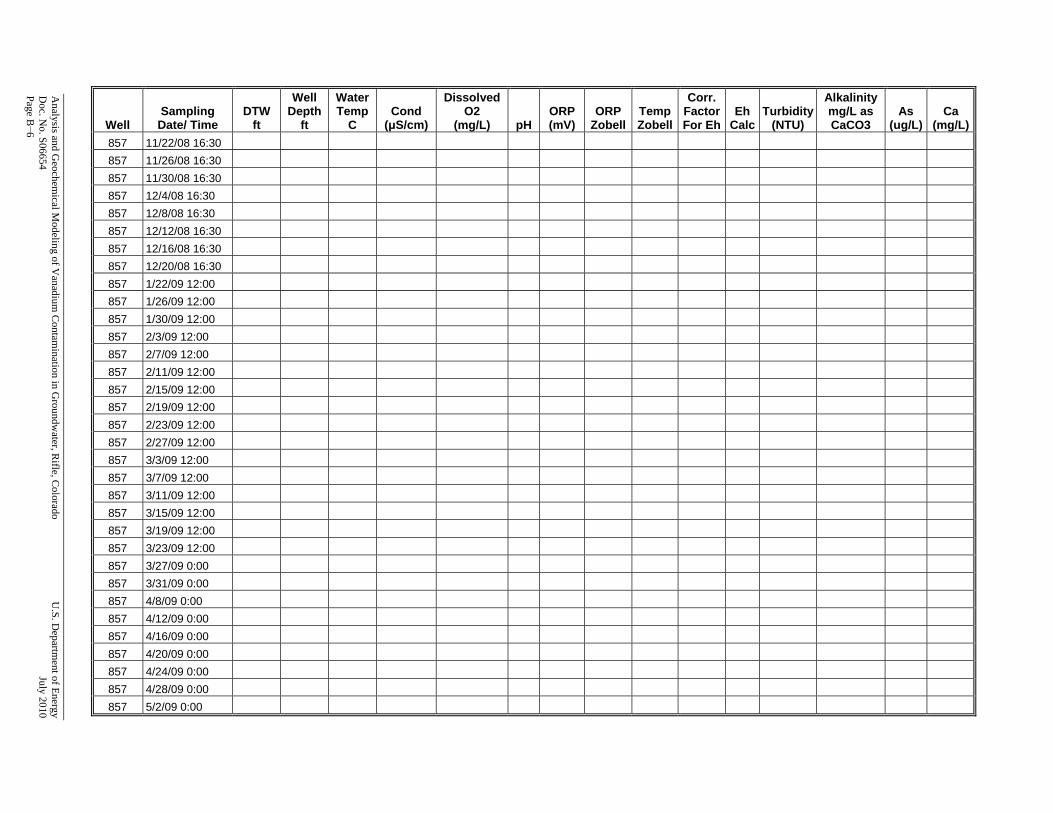
Analysis and G
eochemical M
odeling of Vanadium
Contam
ination in Groundw
ater, Rifle, C
olorado U
.S. Departm
ent of Energy D
oc. No. S06654
July 2010
Page B−6
Well Sampling Date/ Time
DTW ft
Well Depth
ft
Water Temp
C Cond
(μS/cm)
Dissolved O2
(mg/L) pH ORP (mV)
ORP Zobell
Temp Zobell
Corr. FactorFor Eh
Eh Calc
Turbidity(NTU)
Alkalinity mg/L as CaCO3
As (ug/L)
Ca (mg/L)
857 11/22/08 16:30 857 11/26/08 16:30 857 11/30/08 16:30 857 12/4/08 16:30 857 12/8/08 16:30 857 12/12/08 16:30 857 12/16/08 16:30 857 12/20/08 16:30 857 1/22/09 12:00 857 1/26/09 12:00 857 1/30/09 12:00 857 2/3/09 12:00 857 2/7/09 12:00 857 2/11/09 12:00 857 2/15/09 12:00 857 2/19/09 12:00 857 2/23/09 12:00 857 2/27/09 12:00 857 3/3/09 12:00 857 3/7/09 12:00 857 3/11/09 12:00 857 3/15/09 12:00 857 3/19/09 12:00 857 3/23/09 12:00 857 3/27/09 0:00 857 3/31/09 0:00 857 4/8/09 0:00 857 4/12/09 0:00 857 4/16/09 0:00 857 4/20/09 0:00 857 4/24/09 0:00 857 4/28/09 0:00 857 5/2/09 0:00

U.S. D
epartment of Energy
Analysis and G
eochemical M
odeling of Vanadium
Contam
ination in Groundw
ater, Rifle, C
olorado July 2010
D
oc. No. S06654
Page B−7
Well Sampling Date/ Time
DTW ft
Well Depth
ft
Water Temp
C Cond
(μS/cm)
Dissolved O2
(mg/L) pH ORP (mV)
ORP Zobell
Temp Zobell
Corr. FactorFor Eh
Eh Calc
Turbidity(NTU)
Alkalinity mg/L as CaCO3
As (ug/L)
Ca (mg/L)
857 5/6/09 0:00 857 5/10/09 0:00 857 5/22/09 12:00 56 857 5/26/09 12:00 49 857 5/30/09 12:00 45 857 6/3/09 12:00 45 857 6/7/09 12:00 39 857 6/11/09 12:00 37 857 6/15/09 12:00 37 857 6/19/09 12:00 33 857 6/23/09 12:00 33 857 6/27/09 12:00 38 857 7/1/09 12:00 38 857 7/5/09 12:00 39 857 7/9/09 12:00 60 857 7/13/09 12:00 50 857 7/17/09 12:00 44 857 7/21/09 12:00 41 857 7/25/09 12:00 39 857 7/29/09 12:00 37 857 8/2/09 12:00 37 857 8/6/09 12:00 39 857 8/10/09 12:00 42 857 8/14/09 12:00 38 857 8/18/09 12:00 34 857 8/19/09 12:00 41 857 8/23/09 12:00 42 857 8/27/09 12:00 42 857 8/31/09 12:00 44 857 9/4/09 12:00 42 857 9/8/09 12:00 43 857 9/12/09 12:00 42 857 9/16/09 12:00 41
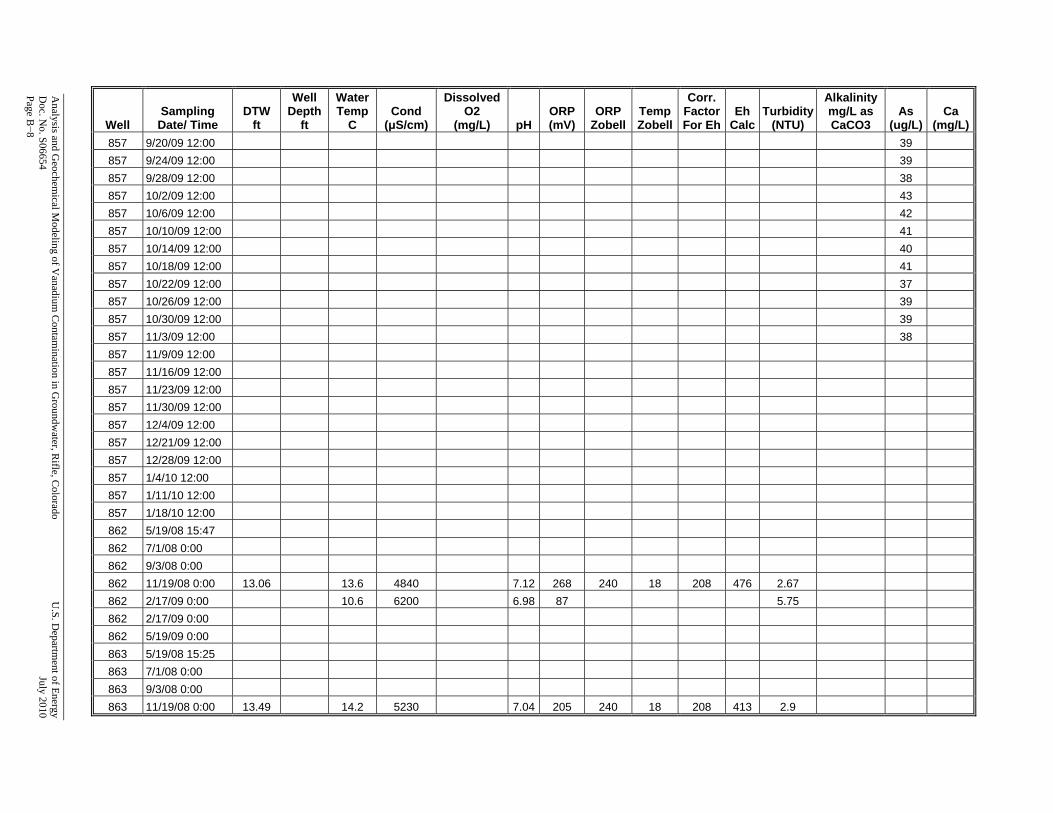
Analysis and G
eochemical M
odeling of Vanadium
Contam
ination in Groundw
ater, Rifle, C
olorado U
.S. Departm
ent of Energy D
oc. No. S06654
July 2010
Page B−8
Well Sampling Date/ Time
DTW ft
Well Depth
ft
Water Temp
C Cond
(μS/cm)
Dissolved O2
(mg/L) pH ORP (mV)
ORP Zobell
Temp Zobell
Corr. FactorFor Eh
Eh Calc
Turbidity(NTU)
Alkalinity mg/L as CaCO3
As (ug/L)
Ca (mg/L)
857 9/20/09 12:00 39 857 9/24/09 12:00 39 857 9/28/09 12:00 38 857 10/2/09 12:00 43 857 10/6/09 12:00 42 857 10/10/09 12:00 41 857 10/14/09 12:00 40 857 10/18/09 12:00 41 857 10/22/09 12:00 37 857 10/26/09 12:00 39 857 10/30/09 12:00 39 857 11/3/09 12:00 38 857 11/9/09 12:00 857 11/16/09 12:00 857 11/23/09 12:00 857 11/30/09 12:00 857 12/4/09 12:00 857 12/21/09 12:00 857 12/28/09 12:00 857 1/4/10 12:00 857 1/11/10 12:00 857 1/18/10 12:00 862 5/19/08 15:47 862 7/1/08 0:00 862 9/3/08 0:00 862 11/19/08 0:00 13.06 13.6 4840 7.12 268 240 18 208 476 2.67 862 2/17/09 0:00 10.6 6200 6.98 87 5.75 862 2/17/09 0:00 862 5/19/09 0:00 863 5/19/08 15:25 863 7/1/08 0:00 863 9/3/08 0:00 863 11/19/08 0:00 13.49 14.2 5230 7.04 205 240 18 208 413 2.9
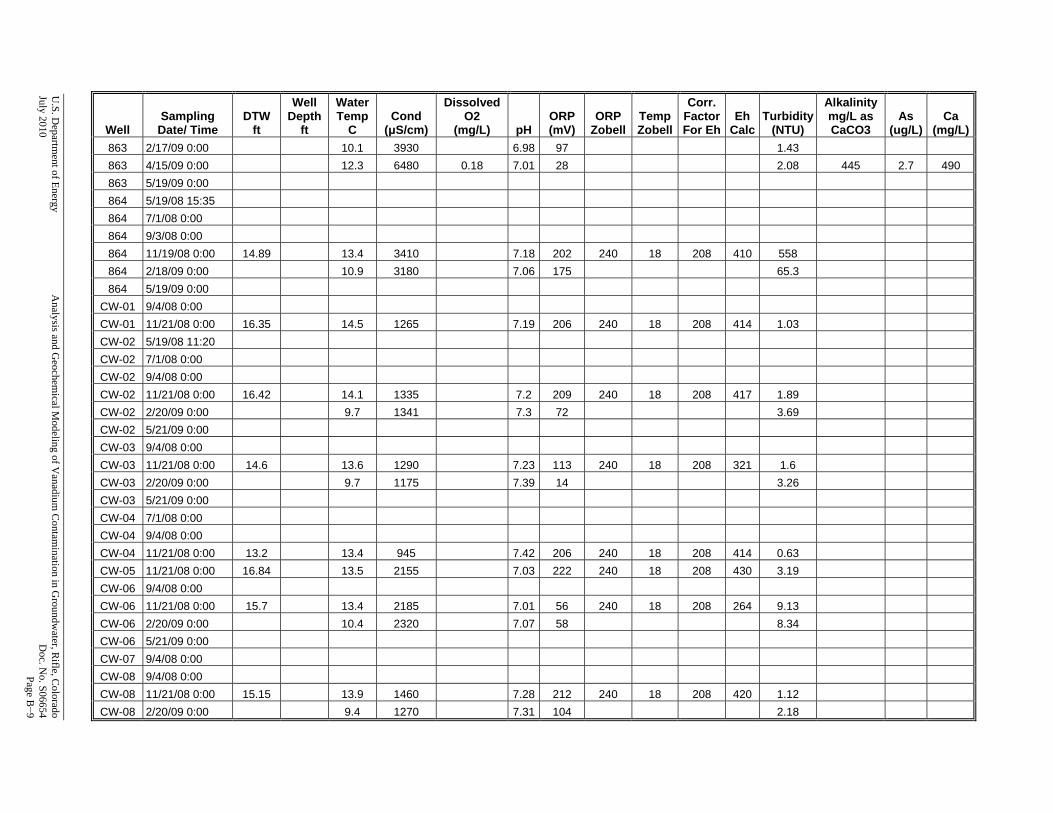
U.S. D
epartment of Energy
Analysis and G
eochemical M
odeling of Vanadium
Contam
ination in Groundw
ater, Rifle, C
olorado July 2010
D
oc. No. S06654
Page B−9
Well Sampling Date/ Time
DTW ft
Well Depth
ft
Water Temp
C Cond
(μS/cm)
Dissolved O2
(mg/L) pH ORP (mV)
ORP Zobell
Temp Zobell
Corr. FactorFor Eh
Eh Calc
Turbidity(NTU)
Alkalinity mg/L as CaCO3
As (ug/L)
Ca (mg/L)
863 2/17/09 0:00 10.1 3930 6.98 97 1.43 863 4/15/09 0:00 12.3 6480 0.18 7.01 28 2.08 445 2.7 490 863 5/19/09 0:00 864 5/19/08 15:35 864 7/1/08 0:00 864 9/3/08 0:00 864 11/19/08 0:00 14.89 13.4 3410 7.18 202 240 18 208 410 558 864 2/18/09 0:00 10.9 3180 7.06 175 65.3 864 5/19/09 0:00
CW-01 9/4/08 0:00 CW-01 11/21/08 0:00 16.35 14.5 1265 7.19 206 240 18 208 414 1.03 CW-02 5/19/08 11:20 CW-02 7/1/08 0:00 CW-02 9/4/08 0:00 CW-02 11/21/08 0:00 16.42 14.1 1335 7.2 209 240 18 208 417 1.89 CW-02 2/20/09 0:00 9.7 1341 7.3 72 3.69 CW-02 5/21/09 0:00 CW-03 9/4/08 0:00 CW-03 11/21/08 0:00 14.6 13.6 1290 7.23 113 240 18 208 321 1.6 CW-03 2/20/09 0:00 9.7 1175 7.39 14 3.26 CW-03 5/21/09 0:00 CW-04 7/1/08 0:00 CW-04 9/4/08 0:00 CW-04 11/21/08 0:00 13.2 13.4 945 7.42 206 240 18 208 414 0.63 CW-05 11/21/08 0:00 16.84 13.5 2155 7.03 222 240 18 208 430 3.19 CW-06 9/4/08 0:00 CW-06 11/21/08 0:00 15.7 13.4 2185 7.01 56 240 18 208 264 9.13 CW-06 2/20/09 0:00 10.4 2320 7.07 58 8.34 CW-06 5/21/09 0:00 CW-07 9/4/08 0:00 CW-08 9/4/08 0:00 CW-08 11/21/08 0:00 15.15 13.9 1460 7.28 212 240 18 208 420 1.12 CW-08 2/20/09 0:00 9.4 1270 7.31 104 2.18
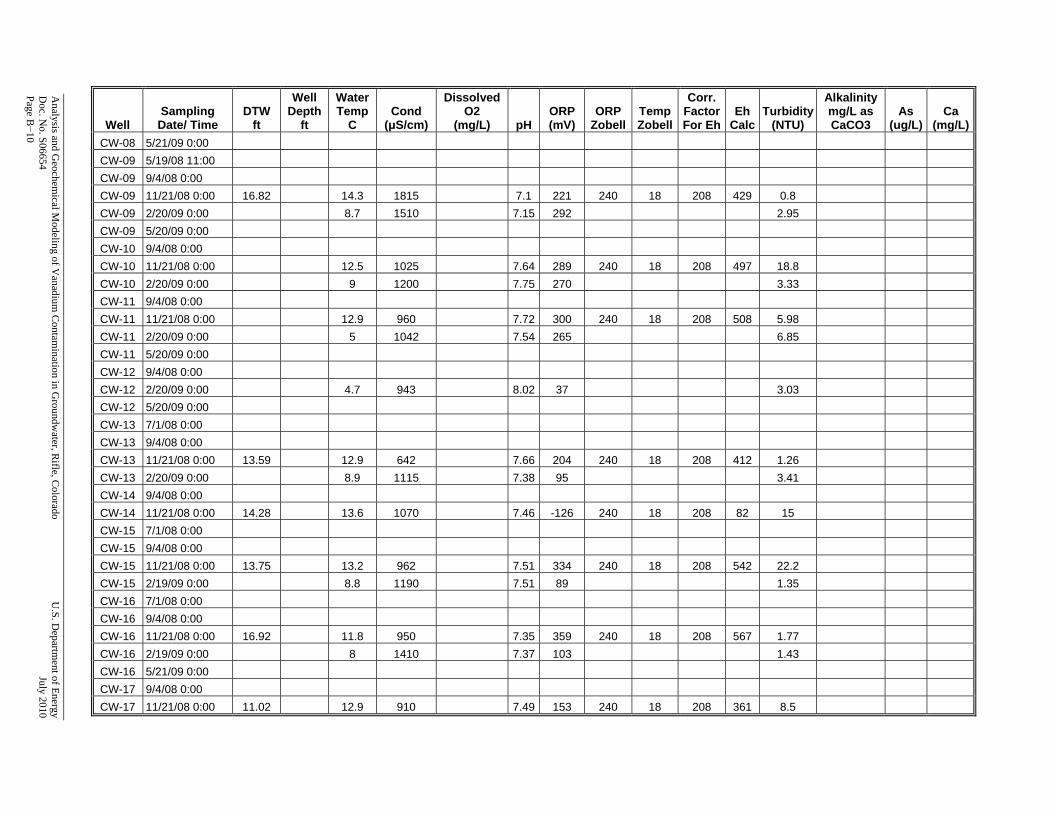
Analysis and G
eochemical M
odeling of Vanadium
Contam
ination in Groundw
ater, Rifle, C
olorado U
.S. Departm
ent of Energy D
oc. No. S06654
July 2010
Page B−10
Well Sampling Date/ Time
DTW ft
Well Depth
ft
Water Temp
C Cond
(μS/cm)
Dissolved O2
(mg/L) pH ORP (mV)
ORP Zobell
Temp Zobell
Corr. FactorFor Eh
Eh Calc
Turbidity(NTU)
Alkalinity mg/L as CaCO3
As (ug/L)
Ca (mg/L)
CW-08 5/21/09 0:00 CW-09 5/19/08 11:00 CW-09 9/4/08 0:00 CW-09 11/21/08 0:00 16.82 14.3 1815 7.1 221 240 18 208 429 0.8 CW-09 2/20/09 0:00 8.7 1510 7.15 292 2.95 CW-09 5/20/09 0:00 CW-10 9/4/08 0:00 CW-10 11/21/08 0:00 12.5 1025 7.64 289 240 18 208 497 18.8 CW-10 2/20/09 0:00 9 1200 7.75 270 3.33 CW-11 9/4/08 0:00 CW-11 11/21/08 0:00 12.9 960 7.72 300 240 18 208 508 5.98 CW-11 2/20/09 0:00 5 1042 7.54 265 6.85 CW-11 5/20/09 0:00 CW-12 9/4/08 0:00 CW-12 2/20/09 0:00 4.7 943 8.02 37 3.03 CW-12 5/20/09 0:00 CW-13 7/1/08 0:00 CW-13 9/4/08 0:00 CW-13 11/21/08 0:00 13.59 12.9 642 7.66 204 240 18 208 412 1.26 CW-13 2/20/09 0:00 8.9 1115 7.38 95 3.41 CW-14 9/4/08 0:00 CW-14 11/21/08 0:00 14.28 13.6 1070 7.46 -126 240 18 208 82 15 CW-15 7/1/08 0:00 CW-15 9/4/08 0:00 CW-15 11/21/08 0:00 13.75 13.2 962 7.51 334 240 18 208 542 22.2 CW-15 2/19/09 0:00 8.8 1190 7.51 89 1.35 CW-16 7/1/08 0:00 CW-16 9/4/08 0:00 CW-16 11/21/08 0:00 16.92 11.8 950 7.35 359 240 18 208 567 1.77 CW-16 2/19/09 0:00 8 1410 7.37 103 1.43 CW-16 5/21/09 0:00 CW-17 9/4/08 0:00 CW-17 11/21/08 0:00 11.02 12.9 910 7.49 153 240 18 208 361 8.5
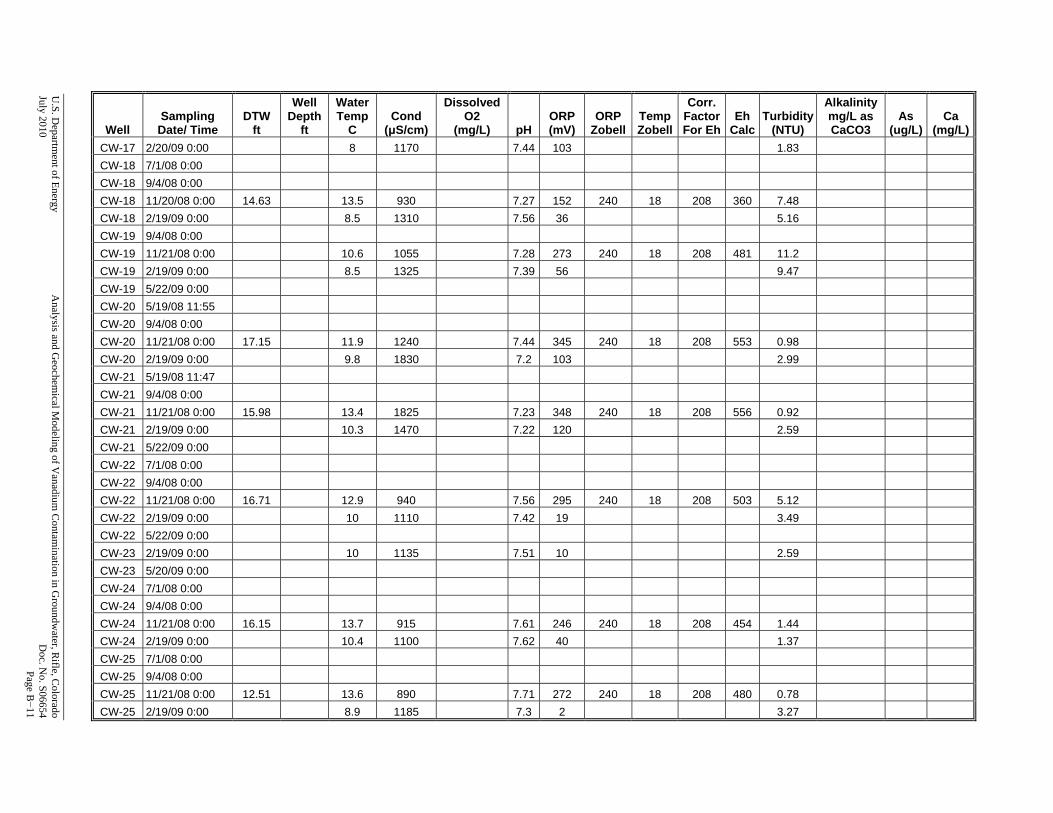
U.S. D
epartment of Energy
Analysis and G
eochemical M
odeling of Vanadium
Contam
ination in Groundw
ater, Rifle, C
olorado July 2010
D
oc. No. S06654
Page B−11
Well Sampling Date/ Time
DTW ft
Well Depth
ft
Water Temp
C Cond
(μS/cm)
Dissolved O2
(mg/L) pH ORP (mV)
ORP Zobell
Temp Zobell
Corr. FactorFor Eh
Eh Calc
Turbidity(NTU)
Alkalinity mg/L as CaCO3
As (ug/L)
Ca (mg/L)
CW-17 2/20/09 0:00 8 1170 7.44 103 1.83 CW-18 7/1/08 0:00 CW-18 9/4/08 0:00 CW-18 11/20/08 0:00 14.63 13.5 930 7.27 152 240 18 208 360 7.48 CW-18 2/19/09 0:00 8.5 1310 7.56 36 5.16 CW-19 9/4/08 0:00 CW-19 11/21/08 0:00 10.6 1055 7.28 273 240 18 208 481 11.2 CW-19 2/19/09 0:00 8.5 1325 7.39 56 9.47 CW-19 5/22/09 0:00 CW-20 5/19/08 11:55 CW-20 9/4/08 0:00 CW-20 11/21/08 0:00 17.15 11.9 1240 7.44 345 240 18 208 553 0.98 CW-20 2/19/09 0:00 9.8 1830 7.2 103 2.99 CW-21 5/19/08 11:47 CW-21 9/4/08 0:00 CW-21 11/21/08 0:00 15.98 13.4 1825 7.23 348 240 18 208 556 0.92 CW-21 2/19/09 0:00 10.3 1470 7.22 120 2.59 CW-21 5/22/09 0:00 CW-22 7/1/08 0:00 CW-22 9/4/08 0:00 CW-22 11/21/08 0:00 16.71 12.9 940 7.56 295 240 18 208 503 5.12 CW-22 2/19/09 0:00 10 1110 7.42 19 3.49 CW-22 5/22/09 0:00 CW-23 2/19/09 0:00 10 1135 7.51 10 2.59 CW-23 5/20/09 0:00 CW-24 7/1/08 0:00 CW-24 9/4/08 0:00 CW-24 11/21/08 0:00 16.15 13.7 915 7.61 246 240 18 208 454 1.44 CW-24 2/19/09 0:00 10.4 1100 7.62 40 1.37 CW-25 7/1/08 0:00 CW-25 9/4/08 0:00 CW-25 11/21/08 0:00 12.51 13.6 890 7.71 272 240 18 208 480 0.78 CW-25 2/19/09 0:00 8.9 1185 7.3 2 3.27
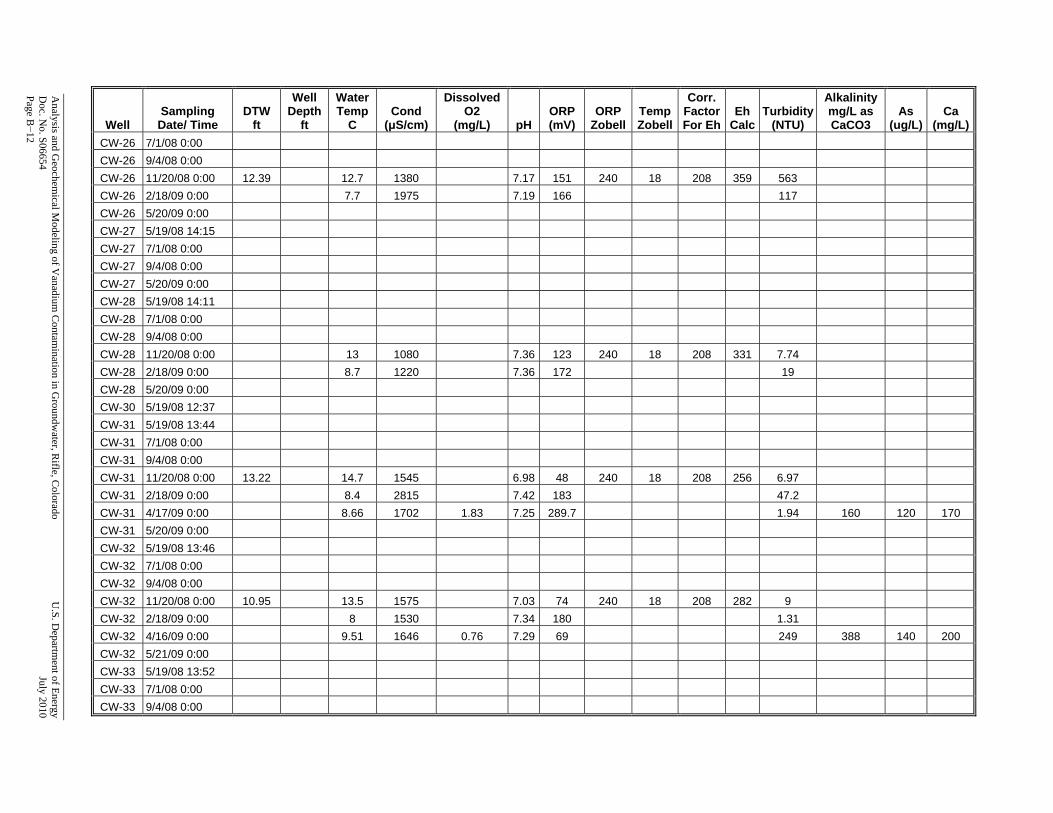
Analysis and G
eochemical M
odeling of Vanadium
Contam
ination in Groundw
ater, Rifle, C
olorado U
.S. Departm
ent of Energy D
oc. No. S06654
July 2010
Page B−12
Well Sampling Date/ Time
DTW ft
Well Depth
ft
Water Temp
C Cond
(μS/cm)
Dissolved O2
(mg/L) pH ORP (mV)
ORP Zobell
Temp Zobell
Corr. FactorFor Eh
Eh Calc
Turbidity(NTU)
Alkalinity mg/L as CaCO3
As (ug/L)
Ca (mg/L)
CW-26 7/1/08 0:00 CW-26 9/4/08 0:00 CW-26 11/20/08 0:00 12.39 12.7 1380 7.17 151 240 18 208 359 563 CW-26 2/18/09 0:00 7.7 1975 7.19 166 117 CW-26 5/20/09 0:00 CW-27 5/19/08 14:15 CW-27 7/1/08 0:00 CW-27 9/4/08 0:00 CW-27 5/20/09 0:00 CW-28 5/19/08 14:11 CW-28 7/1/08 0:00 CW-28 9/4/08 0:00 CW-28 11/20/08 0:00 13 1080 7.36 123 240 18 208 331 7.74 CW-28 2/18/09 0:00 8.7 1220 7.36 172 19 CW-28 5/20/09 0:00 CW-30 5/19/08 12:37 CW-31 5/19/08 13:44 CW-31 7/1/08 0:00 CW-31 9/4/08 0:00 CW-31 11/20/08 0:00 13.22 14.7 1545 6.98 48 240 18 208 256 6.97 CW-31 2/18/09 0:00 8.4 2815 7.42 183 47.2 CW-31 4/17/09 0:00 8.66 1702 1.83 7.25 289.7 1.94 160 120 170 CW-31 5/20/09 0:00 CW-32 5/19/08 13:46 CW-32 7/1/08 0:00 CW-32 9/4/08 0:00 CW-32 11/20/08 0:00 10.95 13.5 1575 7.03 74 240 18 208 282 9 CW-32 2/18/09 0:00 8 1530 7.34 180 1.31 CW-32 4/16/09 0:00 9.51 1646 0.76 7.29 69 249 388 140 200 CW-32 5/21/09 0:00 CW-33 5/19/08 13:52 CW-33 7/1/08 0:00 CW-33 9/4/08 0:00
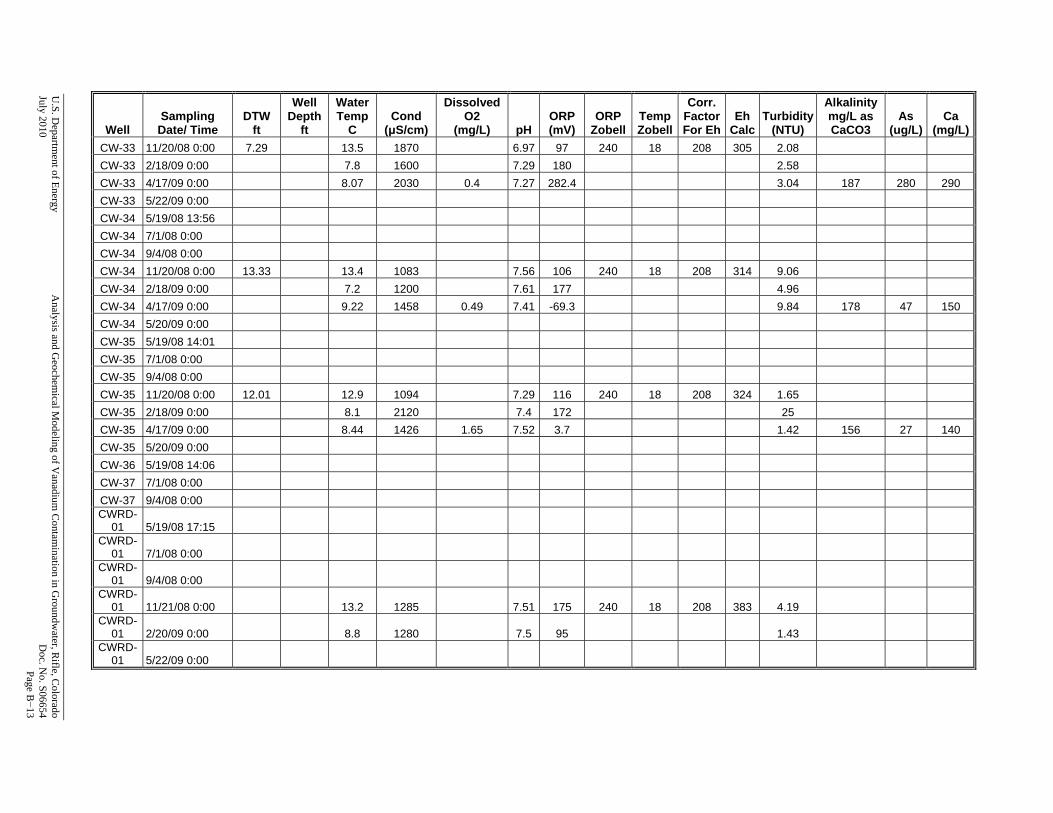
U.S. D
epartment of Energy
Analysis and G
eochemical M
odeling of Vanadium
Contam
ination in Groundw
ater, Rifle, C
olorado July 2010
D
oc. No. S06654
Page B−13
Well Sampling Date/ Time
DTW ft
Well Depth
ft
Water Temp
C Cond
(μS/cm)
Dissolved O2
(mg/L) pH ORP (mV)
ORP Zobell
Temp Zobell
Corr. FactorFor Eh
Eh Calc
Turbidity(NTU)
Alkalinity mg/L as CaCO3
As (ug/L)
Ca (mg/L)
CW-33 11/20/08 0:00 7.29 13.5 1870 6.97 97 240 18 208 305 2.08 CW-33 2/18/09 0:00 7.8 1600 7.29 180 2.58 CW-33 4/17/09 0:00 8.07 2030 0.4 7.27 282.4 3.04 187 280 290 CW-33 5/22/09 0:00 CW-34 5/19/08 13:56 CW-34 7/1/08 0:00 CW-34 9/4/08 0:00 CW-34 11/20/08 0:00 13.33 13.4 1083 7.56 106 240 18 208 314 9.06 CW-34 2/18/09 0:00 7.2 1200 7.61 177 4.96 CW-34 4/17/09 0:00 9.22 1458 0.49 7.41 -69.3 9.84 178 47 150 CW-34 5/20/09 0:00 CW-35 5/19/08 14:01 CW-35 7/1/08 0:00 CW-35 9/4/08 0:00 CW-35 11/20/08 0:00 12.01 12.9 1094 7.29 116 240 18 208 324 1.65 CW-35 2/18/09 0:00 8.1 2120 7.4 172 25 CW-35 4/17/09 0:00 8.44 1426 1.65 7.52 3.7 1.42 156 27 140 CW-35 5/20/09 0:00 CW-36 5/19/08 14:06 CW-37 7/1/08 0:00 CW-37 9/4/08 0:00 CWRD-
01 5/19/08 17:15 CWRD-
01 7/1/08 0:00 CWRD-
01 9/4/08 0:00 CWRD-
01 11/21/08 0:00 13.2 1285 7.51 175 240 18 208 383 4.19 CWRD-
01 2/20/09 0:00 8.8 1280 7.5 95 1.43 CWRD-
01 5/22/09 0:00
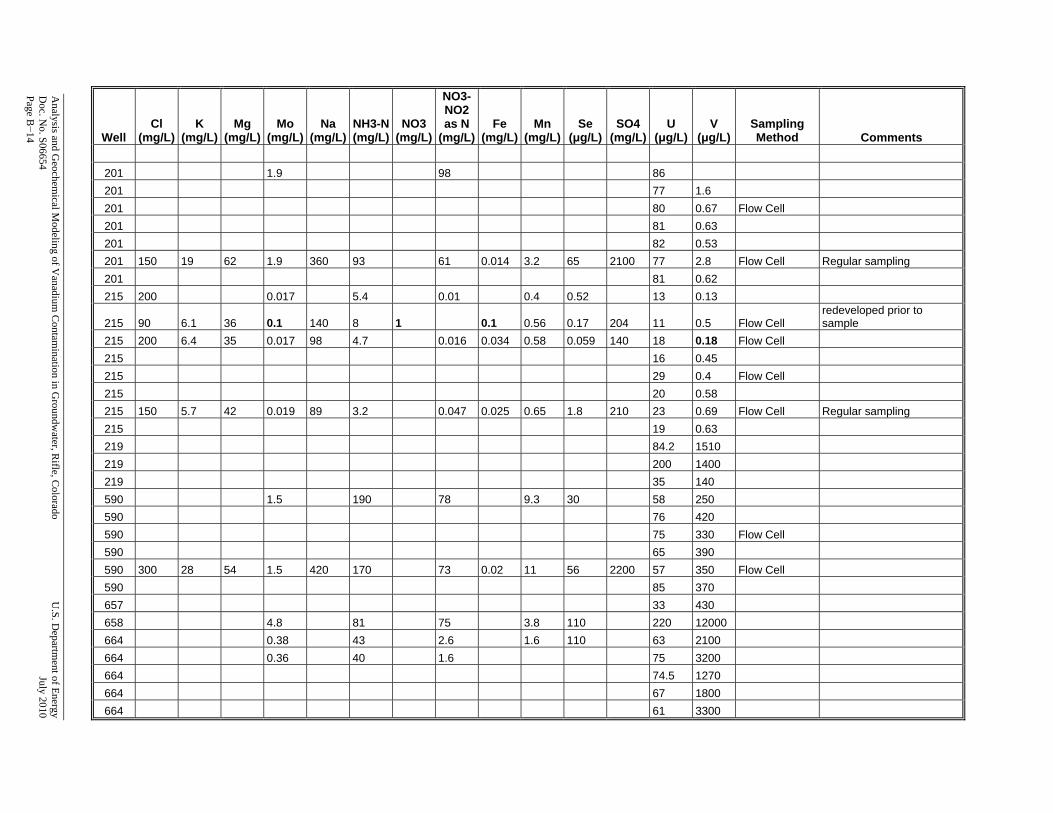
Analysis and G
eochemical M
odeling of Vanadium
Contam
ination in Groundw
ater, Rifle, C
olorado U
.S. Departm
ent of Energy D
oc. No. S06654
July 2010
Page B−14 Well
Cl (mg/L)
K (mg/L)
Mg (mg/L)
Mo (mg/L)
Na (mg/L)
NH3-N(mg/L)
NO3 (mg/L)
NO3-NO2 as N
(mg/L)Fe
(mg/L)Mn
(mg/L)Se
(μg/L)SO4
(mg/L) U
(μg/L)V
(μg/L)Sampling Method Comments
201 1.9 98 86 201 77 1.6 201 80 0.67 Flow Cell 201 81 0.63 201 82 0.53 201 150 19 62 1.9 360 93 61 0.014 3.2 65 2100 77 2.8 Flow Cell Regular sampling 201 81 0.62 215 200 0.017 5.4 0.01 0.4 0.52 13 0.13
215 90 6.1 36 0.1 140 8 1 0.1 0.56 0.17 204 11 0.5 Flow Cell redeveloped prior to sample
215 200 6.4 35 0.017 98 4.7 0.016 0.034 0.58 0.059 140 18 0.18 Flow Cell 215 16 0.45 215 29 0.4 Flow Cell 215 20 0.58 215 150 5.7 42 0.019 89 3.2 0.047 0.025 0.65 1.8 210 23 0.69 Flow Cell Regular sampling 215 19 0.63 219 84.2 1510 219 200 1400 219 35 140 590 1.5 190 78 9.3 30 58 250 590 76 420 590 75 330 Flow Cell 590 65 390 590 300 28 54 1.5 420 170 73 0.02 11 56 2200 57 350 Flow Cell 590 85 370 657 33 430 658 4.8 81 75 3.8 110 220 12000 664 0.38 43 2.6 1.6 110 63 2100 664 0.36 40 1.6 75 3200 664 74.5 1270 664 67 1800 664 61 3300
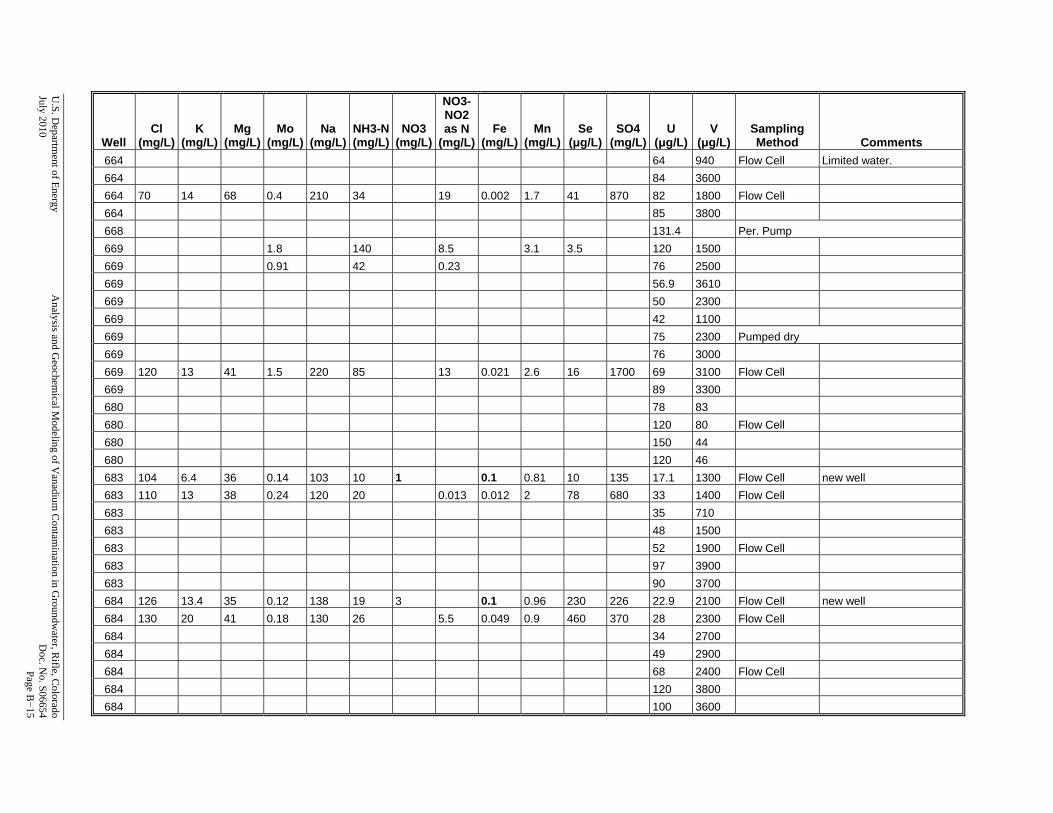
U.S. D
epartment of Energy
Analysis and G
eochemical M
odeling of Vanadium
Contam
ination in Groundw
ater, Rifle, C
olorado July 2010
D
oc. No. S06654
Page B−15
Well Cl
(mg/L) K
(mg/L) Mg
(mg/L) Mo
(mg/L) Na
(mg/L)NH3-N(mg/L)
NO3 (mg/L)
NO3-NO2 as N
(mg/L)Fe
(mg/L)Mn
(mg/L)Se
(μg/L)SO4
(mg/L) U
(μg/L)V
(μg/L)Sampling Method Comments
664 64 940 Flow Cell Limited water. 664 84 3600 664 70 14 68 0.4 210 34 19 0.002 1.7 41 870 82 1800 Flow Cell 664 85 3800 668 131.4 Per. Pump 669 1.8 140 8.5 3.1 3.5 120 1500 669 0.91 42 0.23 76 2500 669 56.9 3610 669 50 2300 669 42 1100 669 75 2300 Pumped dry 669 76 3000 669 120 13 41 1.5 220 85 13 0.021 2.6 16 1700 69 3100 Flow Cell 669 89 3300 680 78 83 680 120 80 Flow Cell 680 150 44 680 120 46 683 104 6.4 36 0.14 103 10 1 0.1 0.81 10 135 17.1 1300 Flow Cell new well 683 110 13 38 0.24 120 20 0.013 0.012 2 78 680 33 1400 Flow Cell 683 35 710 683 48 1500 683 52 1900 Flow Cell 683 97 3900 683 90 3700 684 126 13.4 35 0.12 138 19 3 0.1 0.96 230 226 22.9 2100 Flow Cell new well 684 130 20 41 0.18 130 26 5.5 0.049 0.9 460 370 28 2300 Flow Cell 684 34 2700 684 49 2900 684 68 2400 Flow Cell 684 120 3800 684 100 3600
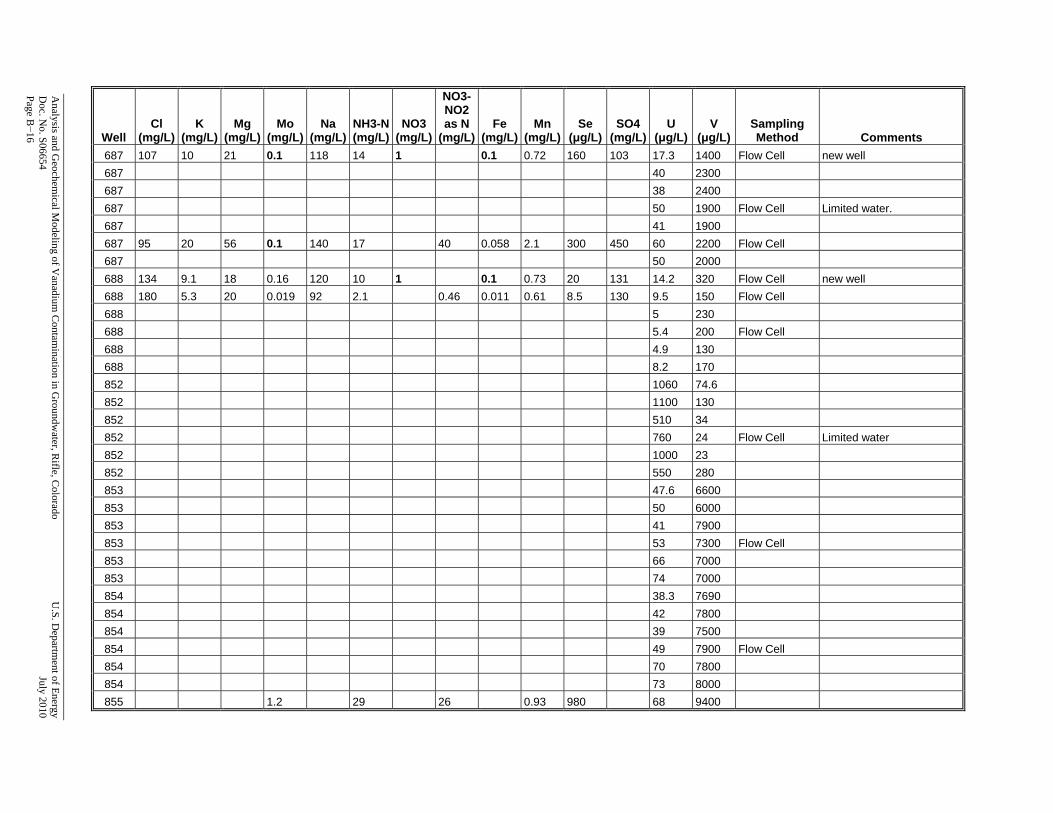
Analysis and G
eochemical M
odeling of Vanadium
Contam
ination in Groundw
ater, Rifle, C
olorado U
.S. Departm
ent of Energy D
oc. No. S06654
July 2010
Page B−16 Well
Cl (mg/L)
K (mg/L)
Mg (mg/L)
Mo (mg/L)
Na (mg/L)
NH3-N(mg/L)
NO3 (mg/L)
NO3-NO2 as N
(mg/L)Fe
(mg/L)Mn
(mg/L)Se
(μg/L)SO4
(mg/L) U
(μg/L)V
(μg/L)Sampling Method Comments
687 107 10 21 0.1 118 14 1 0.1 0.72 160 103 17.3 1400 Flow Cell new well 687 40 2300 687 38 2400 687 50 1900 Flow Cell Limited water. 687 41 1900 687 95 20 56 0.1 140 17 40 0.058 2.1 300 450 60 2200 Flow Cell 687 50 2000 688 134 9.1 18 0.16 120 10 1 0.1 0.73 20 131 14.2 320 Flow Cell new well 688 180 5.3 20 0.019 92 2.1 0.46 0.011 0.61 8.5 130 9.5 150 Flow Cell 688 5 230 688 5.4 200 Flow Cell 688 4.9 130 688 8.2 170 852 1060 74.6 852 1100 130 852 510 34 852 760 24 Flow Cell Limited water 852 1000 23 852 550 280 853 47.6 6600 853 50 6000 853 41 7900 853 53 7300 Flow Cell 853 66 7000 853 74 7000 854 38.3 7690 854 42 7800 854 39 7500 854 49 7900 Flow Cell 854 70 7800 854 73 8000 855 1.2 29 26 0.93 980 68 9400
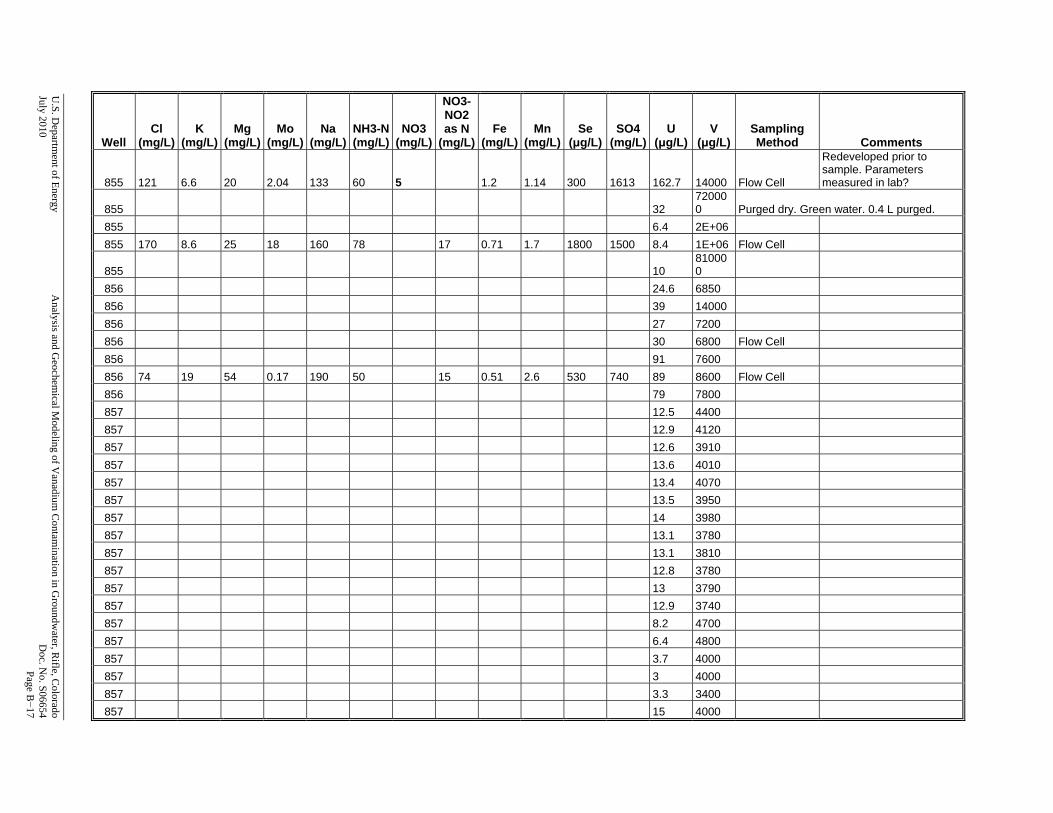
U.S. D
epartment of Energy
Analysis and G
eochemical M
odeling of Vanadium
Contam
ination in Groundw
ater, Rifle, C
olorado July 2010
D
oc. No. S06654
Page B−17
Well Cl
(mg/L) K
(mg/L) Mg
(mg/L) Mo
(mg/L) Na
(mg/L)NH3-N(mg/L)
NO3 (mg/L)
NO3-NO2 as N
(mg/L)Fe
(mg/L)Mn
(mg/L)Se
(μg/L)SO4
(mg/L) U
(μg/L)V
(μg/L)Sampling Method Comments
855 121 6.6 20 2.04 133 60 5 1.2 1.14 300 1613 162.7 14000 Flow Cell
Redeveloped prior to sample. Parameters measured in lab?
855 32 720000 Purged dry. Green water. 0.4 L purged.
855 6.4 2E+06 855 170 8.6 25 18 160 78 17 0.71 1.7 1800 1500 8.4 1E+06 Flow Cell
855 10 810000
856 24.6 6850 856 39 14000 856 27 7200 856 30 6800 Flow Cell 856 91 7600 856 74 19 54 0.17 190 50 15 0.51 2.6 530 740 89 8600 Flow Cell 856 79 7800 857 12.5 4400 857 12.9 4120 857 12.6 3910 857 13.6 4010 857 13.4 4070 857 13.5 3950 857 14 3980 857 13.1 3780 857 13.1 3810 857 12.8 3780 857 13 3790 857 12.9 3740 857 8.2 4700 857 6.4 4800 857 3.7 4000 857 3 4000 857 3.3 3400 857 15 4000
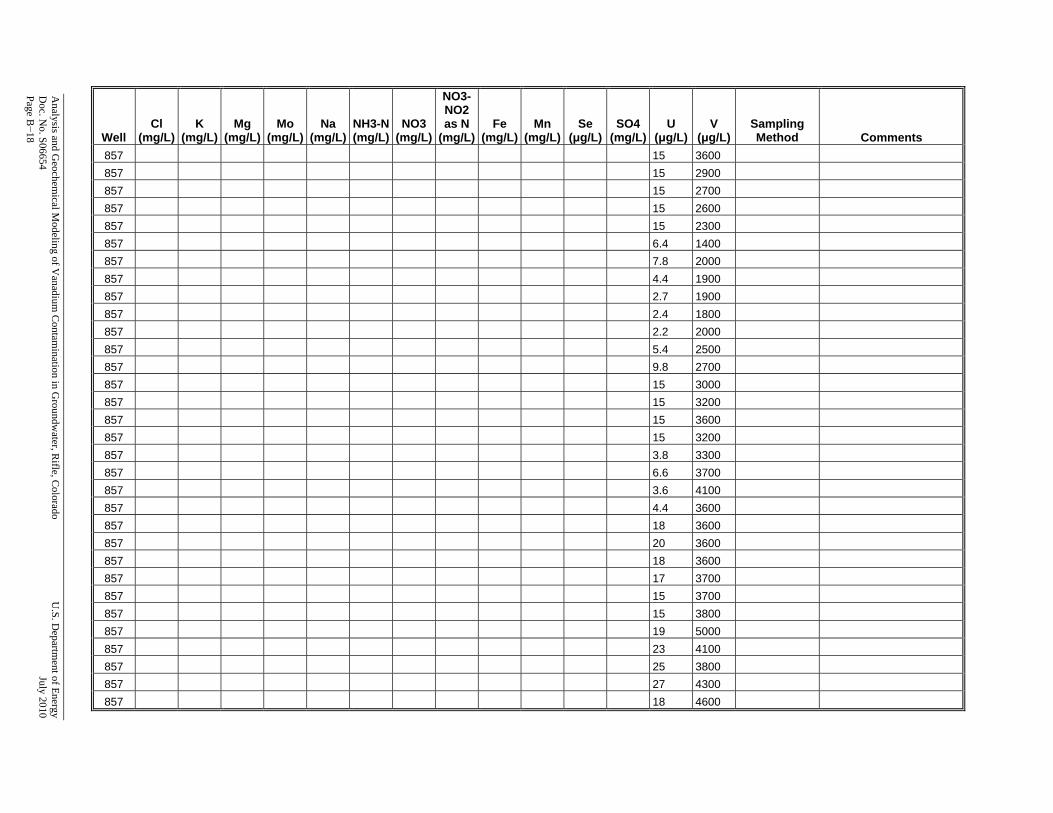
Analysis and G
eochemical M
odeling of Vanadium
Contam
ination in Groundw
ater, Rifle, C
olorado U
.S. Departm
ent of Energy D
oc. No. S06654
July 2010
Page B−18 Well
Cl (mg/L)
K (mg/L)
Mg (mg/L)
Mo (mg/L)
Na (mg/L)
NH3-N(mg/L)
NO3 (mg/L)
NO3-NO2 as N
(mg/L)Fe
(mg/L)Mn
(mg/L)Se
(μg/L)SO4
(mg/L) U
(μg/L)V
(μg/L)Sampling Method Comments
857 15 3600 857 15 2900 857 15 2700 857 15 2600 857 15 2300 857 6.4 1400 857 7.8 2000 857 4.4 1900 857 2.7 1900 857 2.4 1800 857 2.2 2000 857 5.4 2500 857 9.8 2700 857 15 3000 857 15 3200 857 15 3600 857 15 3200 857 3.8 3300 857 6.6 3700 857 3.6 4100 857 4.4 3600 857 18 3600 857 20 3600 857 18 3600 857 17 3700 857 15 3700 857 15 3800 857 19 5000 857 23 4100 857 25 3800 857 27 4300 857 18 4600
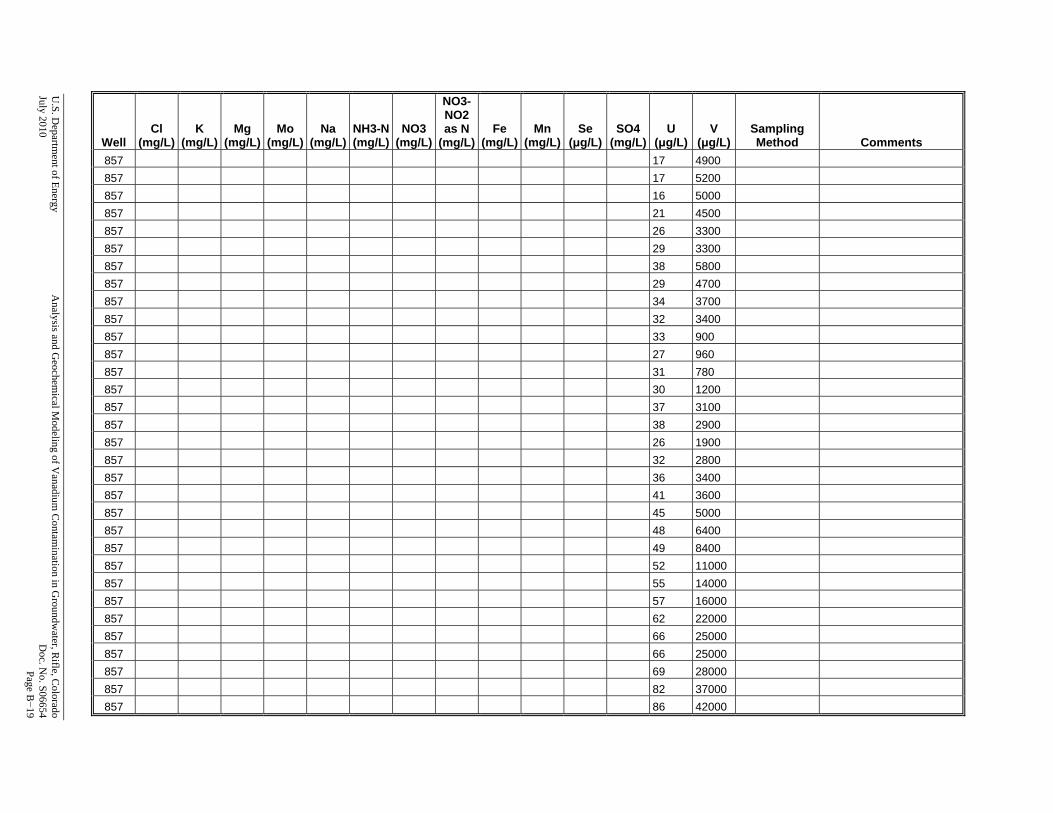
U.S. D
epartment of Energy
Analysis and G
eochemical M
odeling of Vanadium
Contam
ination in Groundw
ater, Rifle, C
olorado July 2010
D
oc. No. S06654
Page B−19
Well Cl
(mg/L) K
(mg/L) Mg
(mg/L) Mo
(mg/L) Na
(mg/L)NH3-N(mg/L)
NO3 (mg/L)
NO3-NO2 as N
(mg/L)Fe
(mg/L)Mn
(mg/L)Se
(μg/L)SO4
(mg/L) U
(μg/L)V
(μg/L)Sampling Method Comments
857 17 4900 857 17 5200 857 16 5000 857 21 4500 857 26 3300 857 29 3300 857 38 5800 857 29 4700 857 34 3700 857 32 3400 857 33 900 857 27 960 857 31 780 857 30 1200 857 37 3100 857 38 2900 857 26 1900 857 32 2800 857 36 3400 857 41 3600 857 45 5000 857 48 6400 857 49 8400 857 52 11000 857 55 14000 857 57 16000 857 62 22000 857 66 25000 857 66 25000 857 69 28000 857 82 37000 857 86 42000
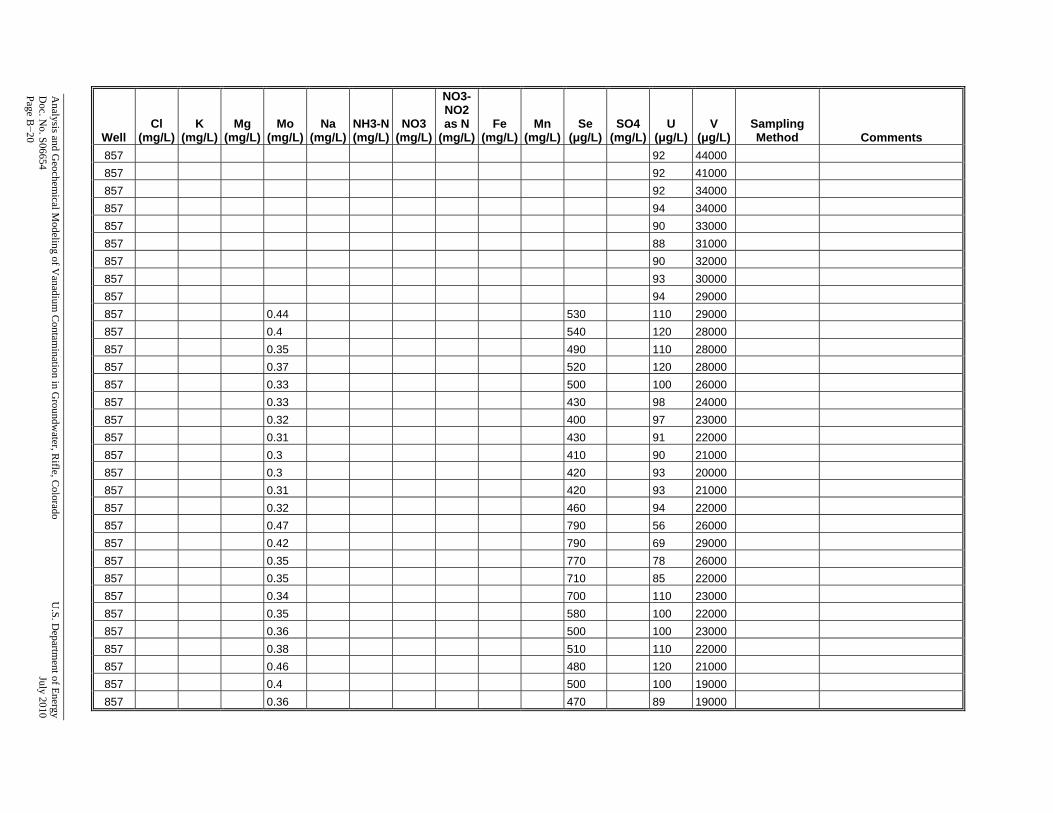
Analysis and G
eochemical M
odeling of Vanadium
Contam
ination in Groundw
ater, Rifle, C
olorado U
.S. Departm
ent of Energy D
oc. No. S06654
July 2010
Page B−20 Well
Cl (mg/L)
K (mg/L)
Mg (mg/L)
Mo (mg/L)
Na (mg/L)
NH3-N(mg/L)
NO3 (mg/L)
NO3-NO2 as N
(mg/L)Fe
(mg/L)Mn
(mg/L)Se
(μg/L)SO4
(mg/L) U
(μg/L)V
(μg/L)Sampling Method Comments
857 92 44000 857 92 41000 857 92 34000 857 94 34000 857 90 33000 857 88 31000 857 90 32000 857 93 30000 857 94 29000 857 0.44 530 110 29000 857 0.4 540 120 28000 857 0.35 490 110 28000 857 0.37 520 120 28000 857 0.33 500 100 26000 857 0.33 430 98 24000 857 0.32 400 97 23000 857 0.31 430 91 22000 857 0.3 410 90 21000 857 0.3 420 93 20000 857 0.31 420 93 21000 857 0.32 460 94 22000 857 0.47 790 56 26000 857 0.42 790 69 29000 857 0.35 770 78 26000 857 0.35 710 85 22000 857 0.34 700 110 23000 857 0.35 580 100 22000 857 0.36 500 100 23000 857 0.38 510 110 22000 857 0.46 480 120 21000 857 0.4 500 100 19000 857 0.36 470 89 19000
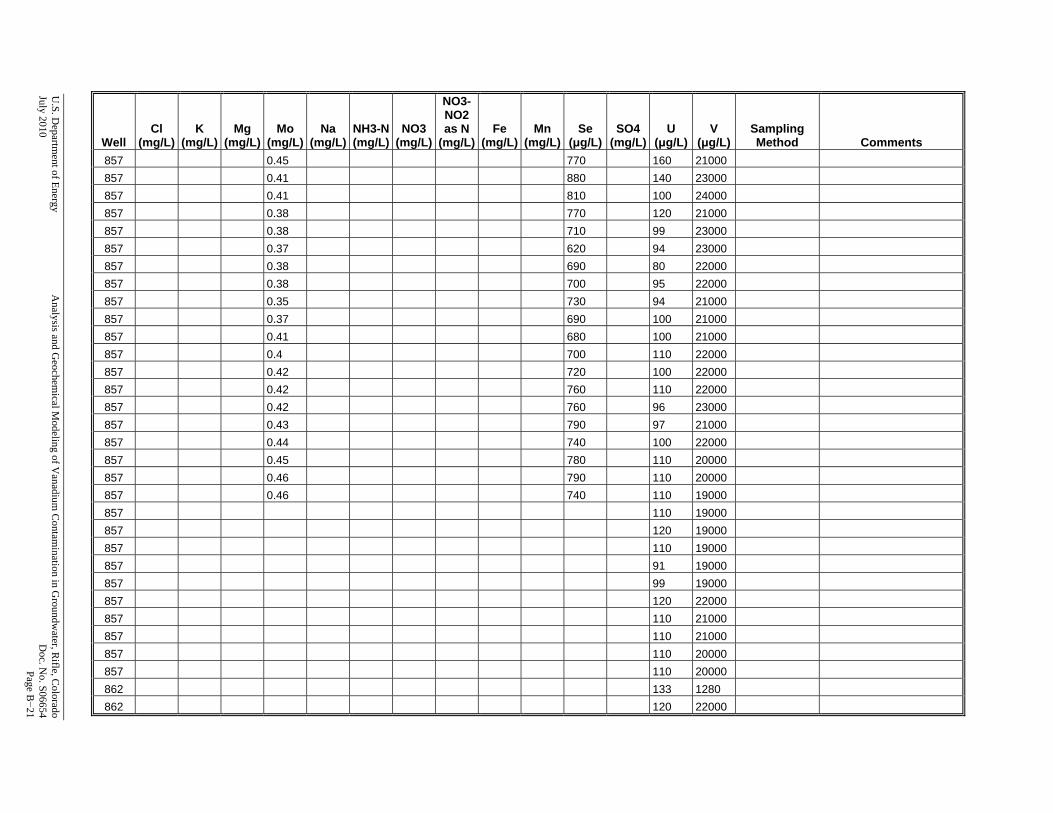
U.S. D
epartment of Energy
Analysis and G
eochemical M
odeling of Vanadium
Contam
ination in Groundw
ater, Rifle, C
olorado July 2010
D
oc. No. S06654
Page B−21
Well Cl
(mg/L) K
(mg/L) Mg
(mg/L) Mo
(mg/L) Na
(mg/L)NH3-N(mg/L)
NO3 (mg/L)
NO3-NO2 as N
(mg/L)Fe
(mg/L)Mn
(mg/L)Se
(μg/L)SO4
(mg/L) U
(μg/L)V
(μg/L)Sampling Method Comments
857 0.45 770 160 21000 857 0.41 880 140 23000 857 0.41 810 100 24000 857 0.38 770 120 21000 857 0.38 710 99 23000 857 0.37 620 94 23000 857 0.38 690 80 22000 857 0.38 700 95 22000 857 0.35 730 94 21000 857 0.37 690 100 21000 857 0.41 680 100 21000 857 0.4 700 110 22000 857 0.42 720 100 22000 857 0.42 760 110 22000 857 0.42 760 96 23000 857 0.43 790 97 21000 857 0.44 740 100 22000 857 0.45 780 110 20000 857 0.46 790 110 20000 857 0.46 740 110 19000 857 110 19000 857 120 19000 857 110 19000 857 91 19000 857 99 19000 857 120 22000 857 110 21000 857 110 21000 857 110 20000 857 110 20000 862 133 1280 862 120 22000
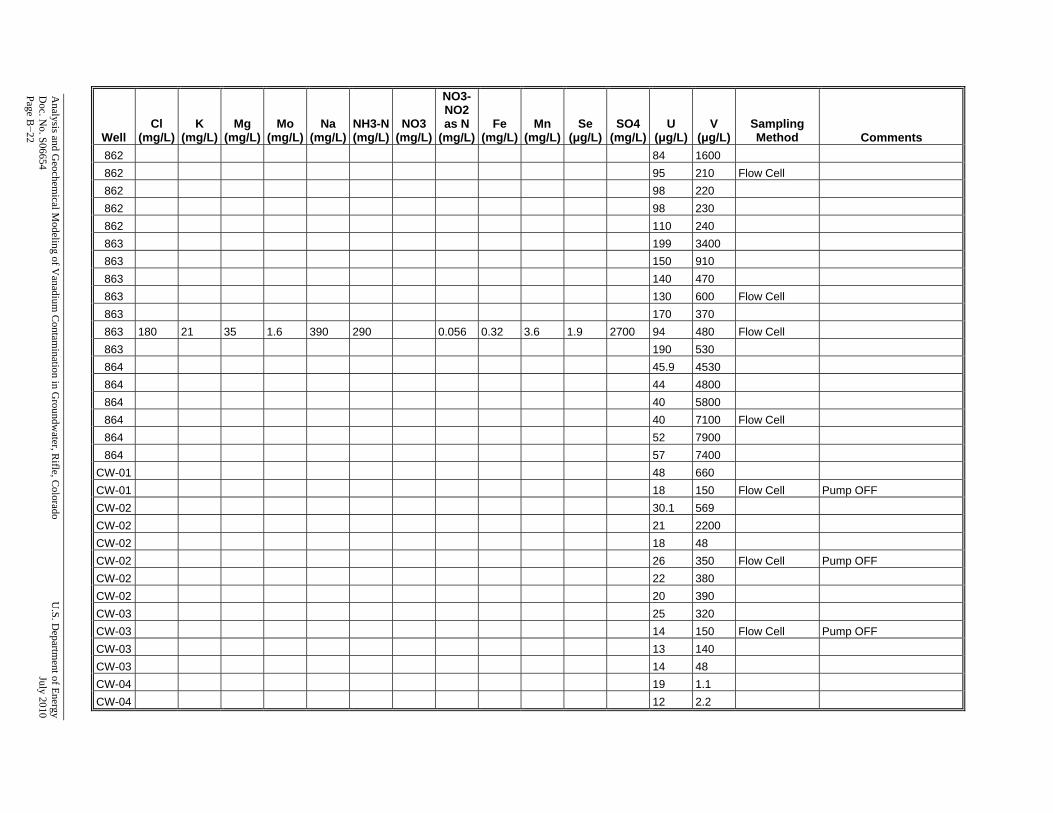
Analysis and G
eochemical M
odeling of Vanadium
Contam
ination in Groundw
ater, Rifle, C
olorado U
.S. Departm
ent of Energy D
oc. No. S06654
July 2010
Page B−22 Well
Cl (mg/L)
K (mg/L)
Mg (mg/L)
Mo (mg/L)
Na (mg/L)
NH3-N(mg/L)
NO3 (mg/L)
NO3-NO2 as N
(mg/L)Fe
(mg/L)Mn
(mg/L)Se
(μg/L)SO4
(mg/L) U
(μg/L)V
(μg/L)Sampling Method Comments
862 84 1600 862 95 210 Flow Cell 862 98 220 862 98 230 862 110 240 863 199 3400 863 150 910 863 140 470 863 130 600 Flow Cell 863 170 370 863 180 21 35 1.6 390 290 0.056 0.32 3.6 1.9 2700 94 480 Flow Cell 863 190 530 864 45.9 4530 864 44 4800 864 40 5800 864 40 7100 Flow Cell 864 52 7900 864 57 7400
CW-01 48 660 CW-01 18 150 Flow Cell Pump OFF CW-02 30.1 569 CW-02 21 2200 CW-02 18 48 CW-02 26 350 Flow Cell Pump OFF CW-02 22 380 CW-02 20 390 CW-03 25 320 CW-03 14 150 Flow Cell Pump OFF CW-03 13 140 CW-03 14 48 CW-04 19 1.1 CW-04 12 2.2
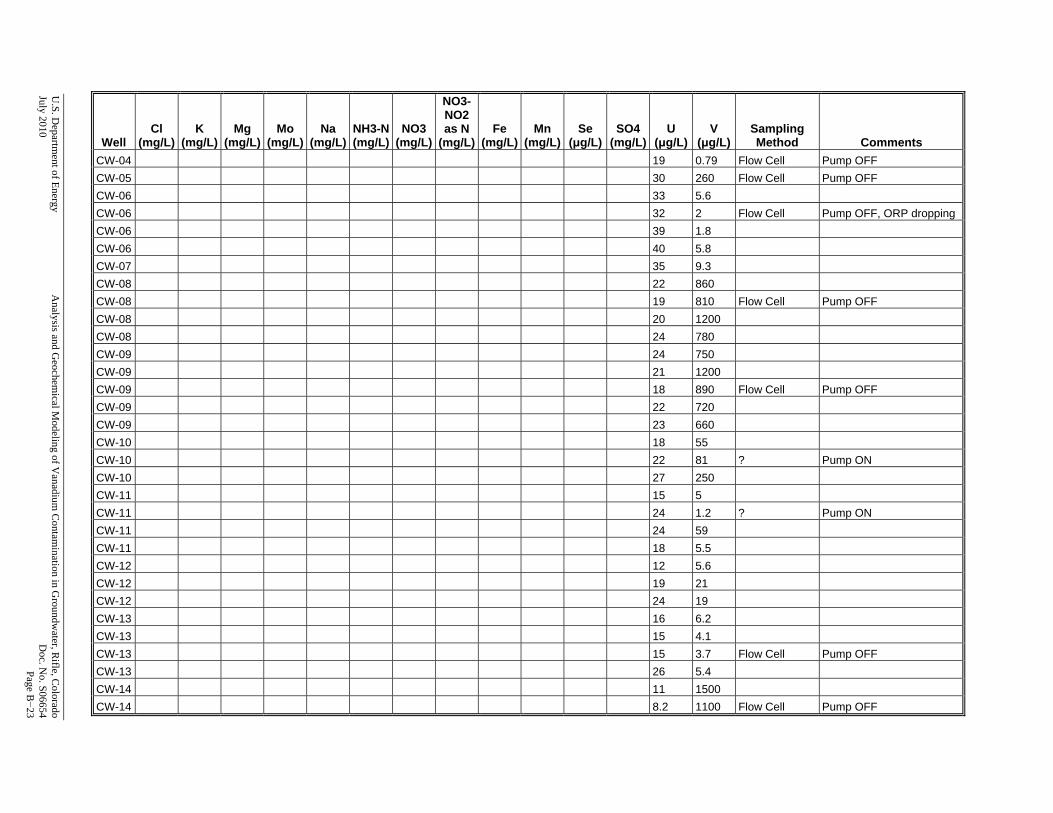
U.S. D
epartment of Energy
Analysis and G
eochemical M
odeling of Vanadium
Contam
ination in Groundw
ater, Rifle, C
olorado July 2010
D
oc. No. S06654
Page B−23
Well Cl
(mg/L) K
(mg/L) Mg
(mg/L) Mo
(mg/L) Na
(mg/L)NH3-N(mg/L)
NO3 (mg/L)
NO3-NO2 as N
(mg/L)Fe
(mg/L)Mn
(mg/L)Se
(μg/L)SO4
(mg/L) U
(μg/L)V
(μg/L)Sampling Method Comments
CW-04 19 0.79 Flow Cell Pump OFF CW-05 30 260 Flow Cell Pump OFF CW-06 33 5.6 CW-06 32 2 Flow Cell Pump OFF, ORP dropping CW-06 39 1.8 CW-06 40 5.8 CW-07 35 9.3 CW-08 22 860 CW-08 19 810 Flow Cell Pump OFF CW-08 20 1200 CW-08 24 780 CW-09 24 750 CW-09 21 1200 CW-09 18 890 Flow Cell Pump OFF CW-09 22 720 CW-09 23 660 CW-10 18 55 CW-10 22 81 ? Pump ON CW-10 27 250 CW-11 15 5 CW-11 24 1.2 ? Pump ON CW-11 24 59 CW-11 18 5.5 CW-12 12 5.6 CW-12 19 21 CW-12 24 19 CW-13 16 6.2 CW-13 15 4.1 CW-13 15 3.7 Flow Cell Pump OFF CW-13 26 5.4 CW-14 11 1500 CW-14 8.2 1100 Flow Cell Pump OFF
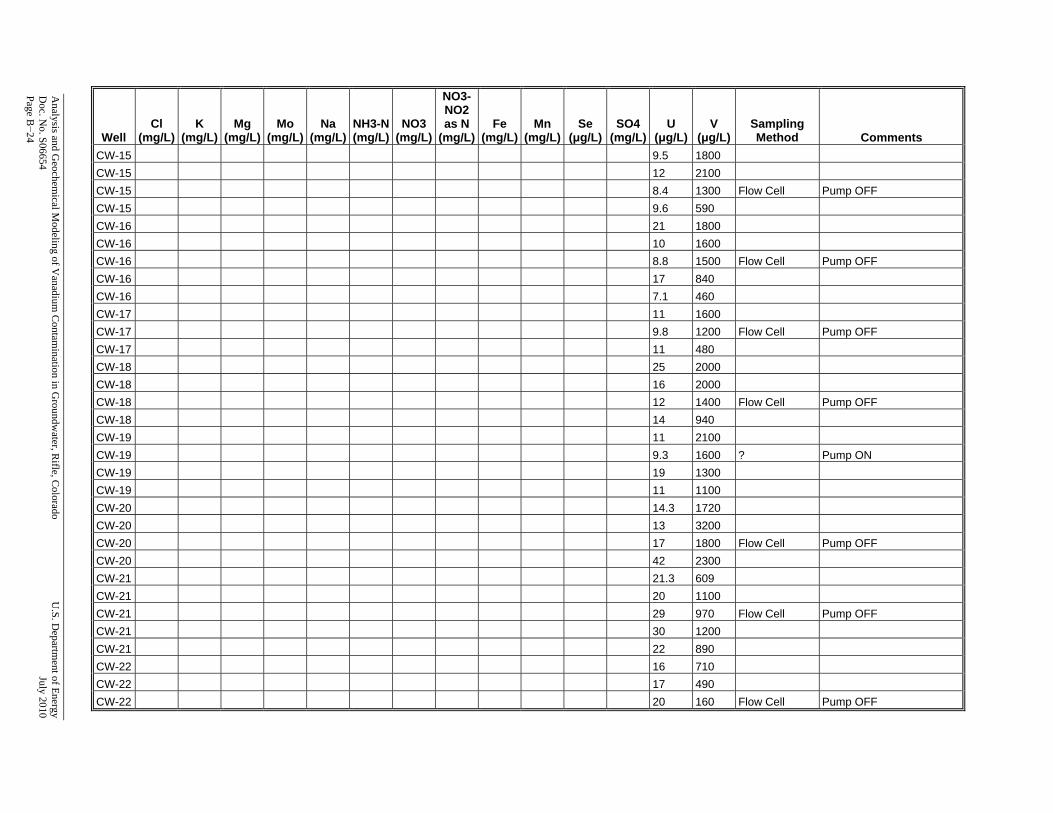
Analysis and G
eochemical M
odeling of Vanadium
Contam
ination in Groundw
ater, Rifle, C
olorado U
.S. Departm
ent of Energy D
oc. No. S06654
July 2010
Page B−24 Well
Cl (mg/L)
K (mg/L)
Mg (mg/L)
Mo (mg/L)
Na (mg/L)
NH3-N(mg/L)
NO3 (mg/L)
NO3-NO2 as N
(mg/L)Fe
(mg/L)Mn
(mg/L)Se
(μg/L)SO4
(mg/L) U
(μg/L)V
(μg/L)Sampling Method Comments
CW-15 9.5 1800 CW-15 12 2100 CW-15 8.4 1300 Flow Cell Pump OFF CW-15 9.6 590 CW-16 21 1800 CW-16 10 1600 CW-16 8.8 1500 Flow Cell Pump OFF CW-16 17 840 CW-16 7.1 460 CW-17 11 1600 CW-17 9.8 1200 Flow Cell Pump OFF CW-17 11 480 CW-18 25 2000 CW-18 16 2000 CW-18 12 1400 Flow Cell Pump OFF CW-18 14 940 CW-19 11 2100 CW-19 9.3 1600 ? Pump ON CW-19 19 1300 CW-19 11 1100 CW-20 14.3 1720 CW-20 13 3200 CW-20 17 1800 Flow Cell Pump OFF CW-20 42 2300 CW-21 21.3 609 CW-21 20 1100 CW-21 29 970 Flow Cell Pump OFF CW-21 30 1200 CW-21 22 890 CW-22 16 710 CW-22 17 490 CW-22 20 160 Flow Cell Pump OFF
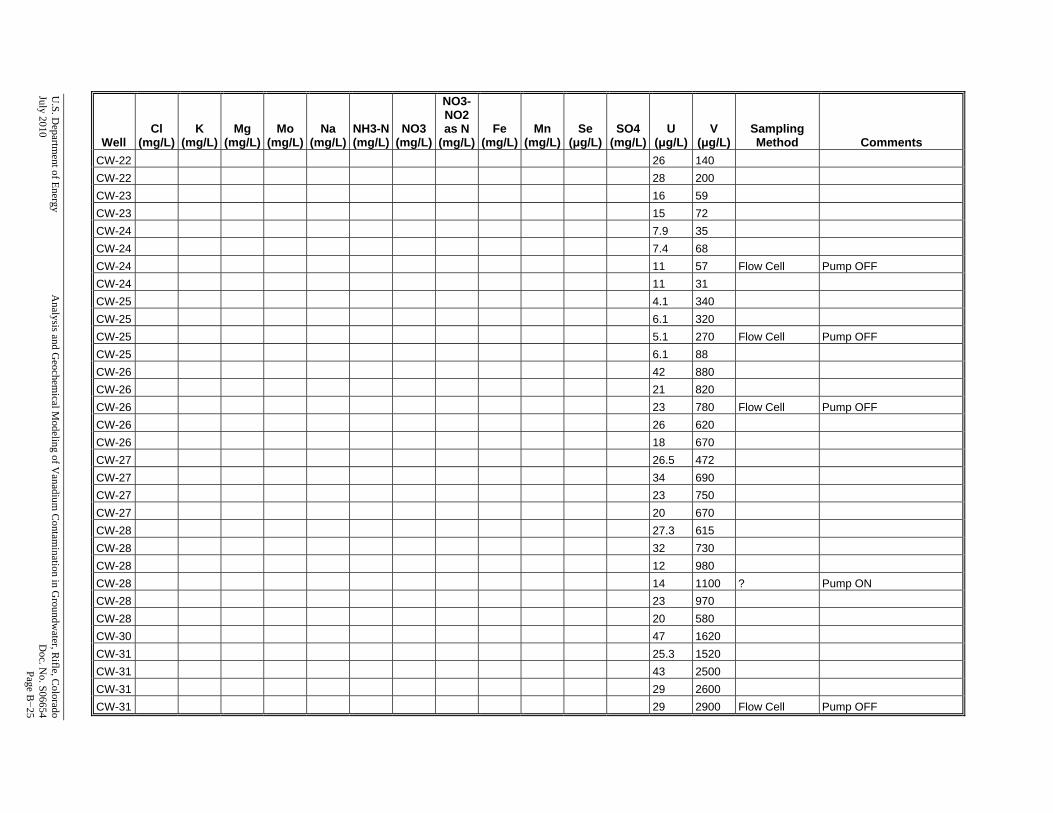
U.S. D
epartment of Energy
Analysis and G
eochemical M
odeling of Vanadium
Contam
ination in Groundw
ater, Rifle, C
olorado July 2010
D
oc. No. S06654
Page B−25
Well Cl
(mg/L) K
(mg/L) Mg
(mg/L) Mo
(mg/L) Na
(mg/L)NH3-N(mg/L)
NO3 (mg/L)
NO3-NO2 as N
(mg/L)Fe
(mg/L)Mn
(mg/L)Se
(μg/L)SO4
(mg/L) U
(μg/L)V
(μg/L)Sampling Method Comments
CW-22 26 140 CW-22 28 200 CW-23 16 59 CW-23 15 72 CW-24 7.9 35 CW-24 7.4 68 CW-24 11 57 Flow Cell Pump OFF CW-24 11 31 CW-25 4.1 340 CW-25 6.1 320 CW-25 5.1 270 Flow Cell Pump OFF CW-25 6.1 88 CW-26 42 880 CW-26 21 820 CW-26 23 780 Flow Cell Pump OFF CW-26 26 620 CW-26 18 670 CW-27 26.5 472 CW-27 34 690 CW-27 23 750 CW-27 20 670 CW-28 27.3 615 CW-28 32 730 CW-28 12 980 CW-28 14 1100 ? Pump ON CW-28 23 970 CW-28 20 580 CW-30 47 1620 CW-31 25.3 1520 CW-31 43 2500 CW-31 29 2600 CW-31 29 2900 Flow Cell Pump OFF
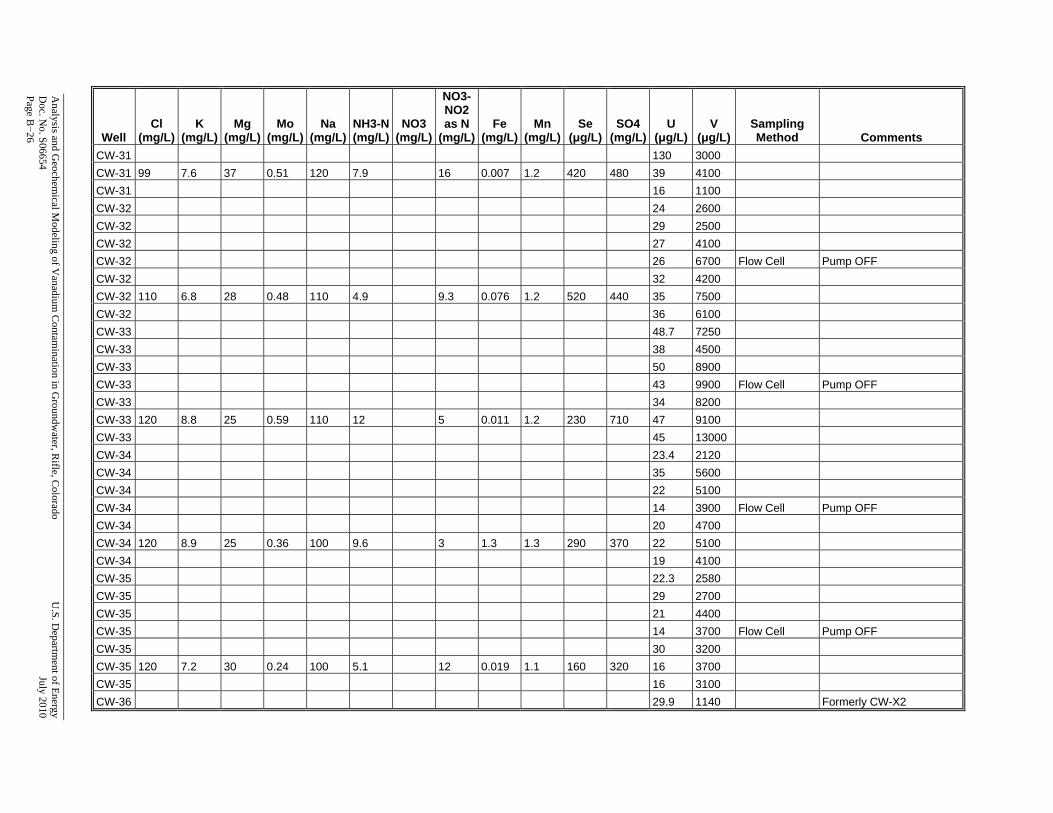
Analysis and G
eochemical M
odeling of Vanadium
Contam
ination in Groundw
ater, Rifle, C
olorado U
.S. Departm
ent of Energy D
oc. No. S06654
July 2010
Page B−26 Well
Cl (mg/L)
K (mg/L)
Mg (mg/L)
Mo (mg/L)
Na (mg/L)
NH3-N(mg/L)
NO3 (mg/L)
NO3-NO2 as N
(mg/L)Fe
(mg/L)Mn
(mg/L)Se
(μg/L)SO4
(mg/L) U
(μg/L)V
(μg/L)Sampling Method Comments
CW-31 130 3000 CW-31 99 7.6 37 0.51 120 7.9 16 0.007 1.2 420 480 39 4100 CW-31 16 1100 CW-32 24 2600 CW-32 29 2500 CW-32 27 4100 CW-32 26 6700 Flow Cell Pump OFF CW-32 32 4200 CW-32 110 6.8 28 0.48 110 4.9 9.3 0.076 1.2 520 440 35 7500 CW-32 36 6100 CW-33 48.7 7250 CW-33 38 4500 CW-33 50 8900 CW-33 43 9900 Flow Cell Pump OFF CW-33 34 8200 CW-33 120 8.8 25 0.59 110 12 5 0.011 1.2 230 710 47 9100 CW-33 45 13000 CW-34 23.4 2120 CW-34 35 5600 CW-34 22 5100 CW-34 14 3900 Flow Cell Pump OFF CW-34 20 4700 CW-34 120 8.9 25 0.36 100 9.6 3 1.3 1.3 290 370 22 5100 CW-34 19 4100 CW-35 22.3 2580 CW-35 29 2700 CW-35 21 4400 CW-35 14 3700 Flow Cell Pump OFF CW-35 30 3200 CW-35 120 7.2 30 0.24 100 5.1 12 0.019 1.1 160 320 16 3700 CW-35 16 3100 CW-36 29.9 1140 Formerly CW-X2
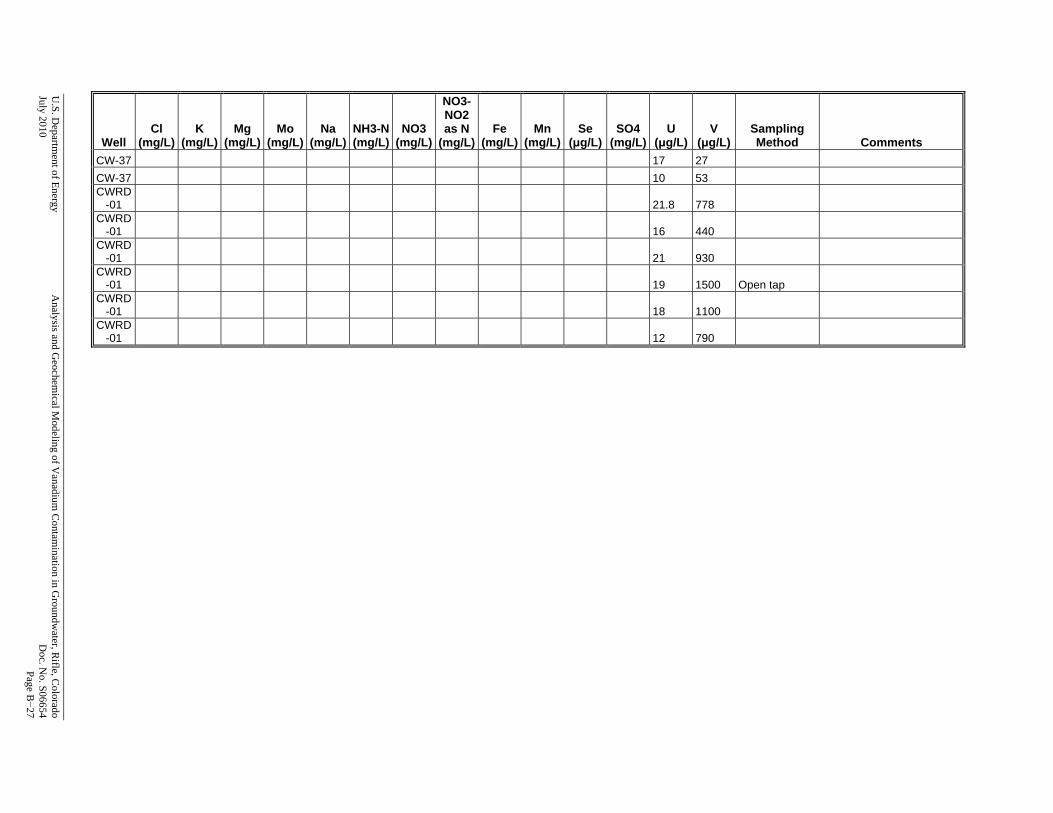
U.S. D
epartment of Energy
Analysis and G
eochemical M
odeling of Vanadium
Contam
ination in Groundw
ater, Rifle, C
olorado July 2010
D
oc. No. S06654
Page B−27
Well Cl
(mg/L) K
(mg/L) Mg
(mg/L) Mo
(mg/L) Na
(mg/L)NH3-N(mg/L)
NO3 (mg/L)
NO3-NO2 as N
(mg/L)Fe
(mg/L)Mn
(mg/L)Se
(μg/L)SO4
(mg/L) U
(μg/L)V
(μg/L)Sampling Method Comments
CW-37 17 27 CW-37 10 53 CWRD
-01 21.8 778 CWRD
-01 16 440 CWRD
-01 21 930 CWRD
-01 19 1500 Open tap CWRD
-01 18 1100 CWRD
-01 12 790

Analysis and Geochemical Modeling of Vanadium Contamination in Groundwater, Rifle, Colorado U.S. Department of Energy Doc. No. S06654 July 2010 Page B−28
This page intentionally left blank
Appendix C
Input Files for PHREEQC Simulations

This page intentionally left blank
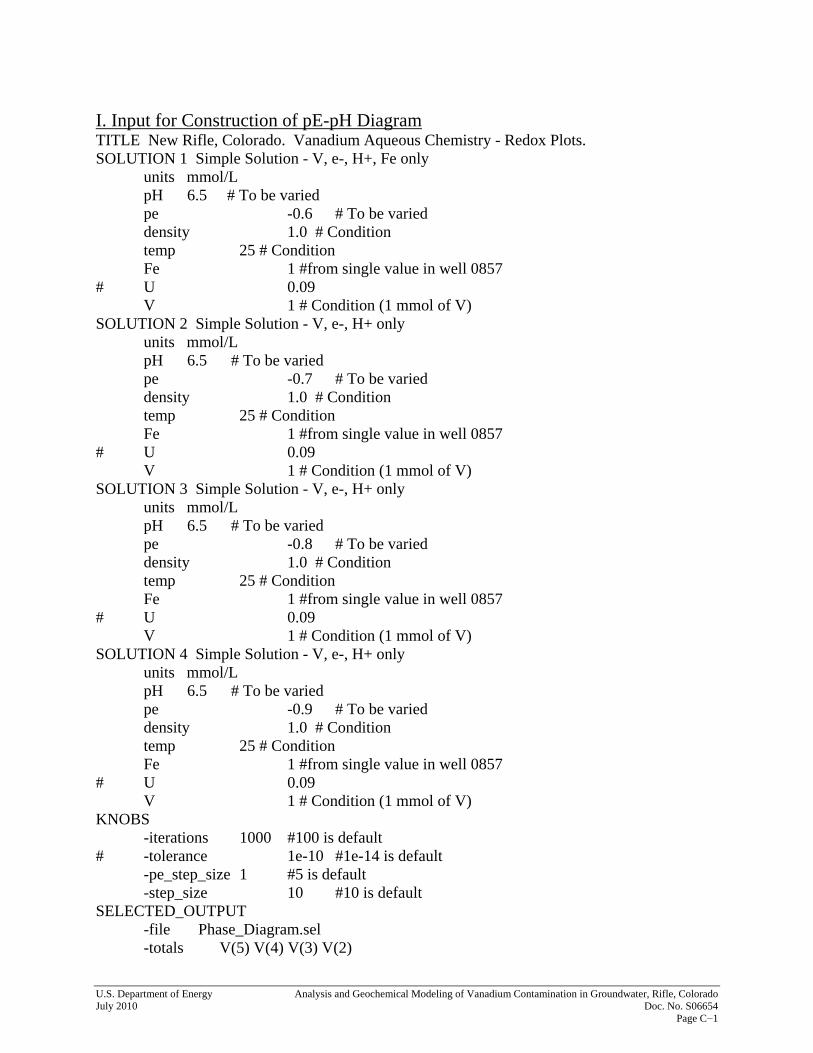
U.S. Department of Energy Analysis and Geochemical Modeling of Vanadium Contamination in Groundwater, Rifle, Colorado July 2010 Doc. No. S06654 Page C−1
I. Input for Construction of pE-pH Diagram TITLE New Rifle, Colorado. Vanadium Aqueous Chemistry - Redox Plots. SOLUTION 1 Simple Solution - V, e-, H+, Fe only units mmol/L pH 6.5 # To be varied pe -0.6 # To be varied density 1.0 # Condition temp 25 # Condition Fe 1 #from single value in well 0857 # U 0.09 V 1 # Condition (1 mmol of V) SOLUTION 2 Simple Solution - V, e-, H+ only units mmol/L pH 6.5 # To be varied pe -0.7 # To be varied density 1.0 # Condition temp 25 # Condition Fe 1 #from single value in well 0857 # U 0.09 V 1 # Condition (1 mmol of V) SOLUTION 3 Simple Solution - V, e-, H+ only units mmol/L pH 6.5 # To be varied pe -0.8 # To be varied density 1.0 # Condition temp 25 # Condition Fe 1 #from single value in well 0857 # U 0.09 V 1 # Condition (1 mmol of V) SOLUTION 4 Simple Solution - V, e-, H+ only units mmol/L pH 6.5 # To be varied pe -0.9 # To be varied density 1.0 # Condition temp 25 # Condition Fe 1 #from single value in well 0857 # U 0.09 V 1 # Condition (1 mmol of V) KNOBS -iterations 1000 #100 is default # -tolerance 1e-10 #1e-14 is default -pe_step_size 1 #5 is default -step_size 10 #10 is default SELECTED_OUTPUT -file Phase_Diagram.sel -totals V(5) V(4) V(3) V(2)
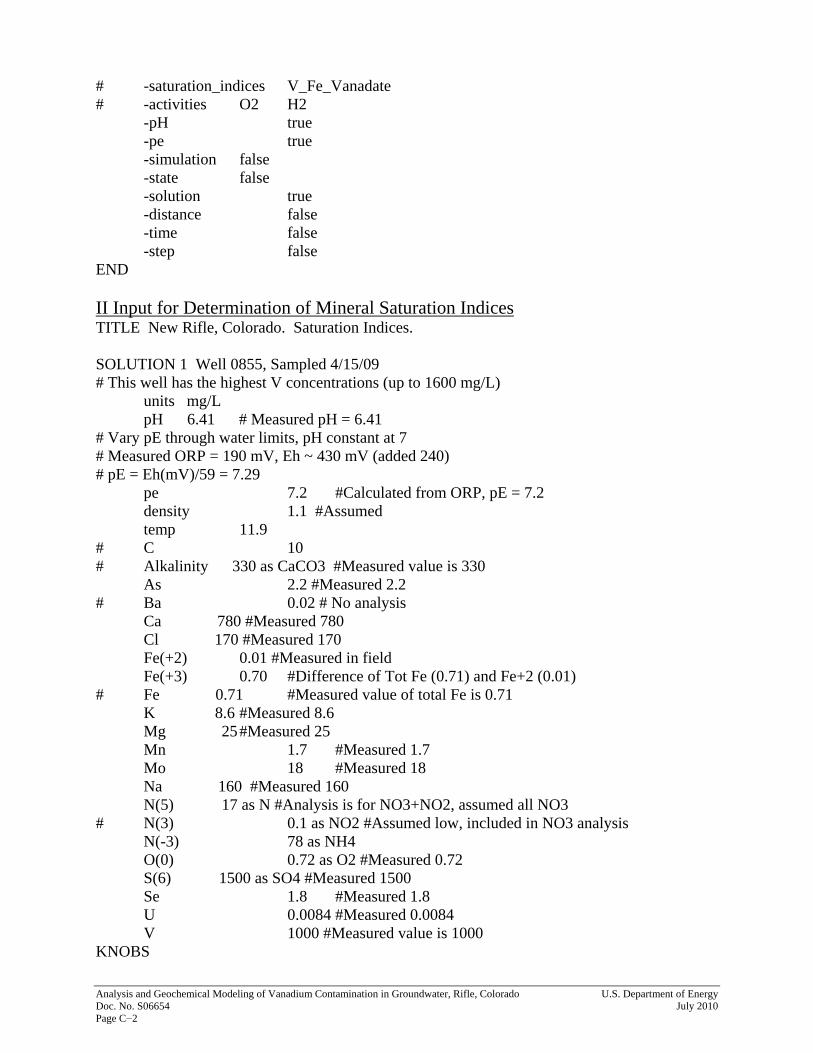
Analysis and Geochemical Modeling of Vanadium Contamination in Groundwater, Rifle, Colorado U.S. Department of Energy Doc. No. S06654 July 2010 Page C−2
# -saturation_indices V_Fe_Vanadate # -activities O2 H2 -pH true -pe true -simulation false -state false -solution true -distance false -time false -step false END II Input for Determination of Mineral Saturation Indices TITLE New Rifle, Colorado. Saturation Indices. SOLUTION 1 Well 0855, Sampled 4/15/09 # This well has the highest V concentrations (up to 1600 mg/L) units mg/L pH 6.41 # Measured pH = 6.41 # Vary pE through water limits, pH constant at 7 # Measured ORP = 190 mV, Eh ~ 430 mV (added 240) # pE = Eh(mV)/59 = 7.29 pe 7.2 #Calculated from ORP, pE = 7.2 density 1.1 #Assumed temp 11.9 # C 10 # Alkalinity 330 as CaCO3 #Measured value is 330 As 2.2 #Measured 2.2 # Ba 0.02 # No analysis Ca 780 #Measured 780 Cl 170 #Measured 170 Fe(+2) 0.01 #Measured in field Fe(+3) 0.70 #Difference of Tot Fe (0.71) and Fe+2 (0.01) # Fe 0.71 #Measured value of total Fe is 0.71 K 8.6 #Measured 8.6 Mg 25 #Measured 25 Mn 1.7 #Measured 1.7 Mo 18 #Measured 18 Na 160 #Measured 160 N(5) 17 as N #Analysis is for NO3+NO2, assumed all NO3 # N(3) 0.1 as NO2 #Assumed low, included in NO3 analysis N(-3) 78 as NH4 O(0) 0.72 as O2 #Measured 0.72 S(6) 1500 as SO4 #Measured 1500 Se 1.8 #Measured 1.8 U 0.0084 #Measured 0.0084 V 1000 #Measured value is 1000 KNOBS
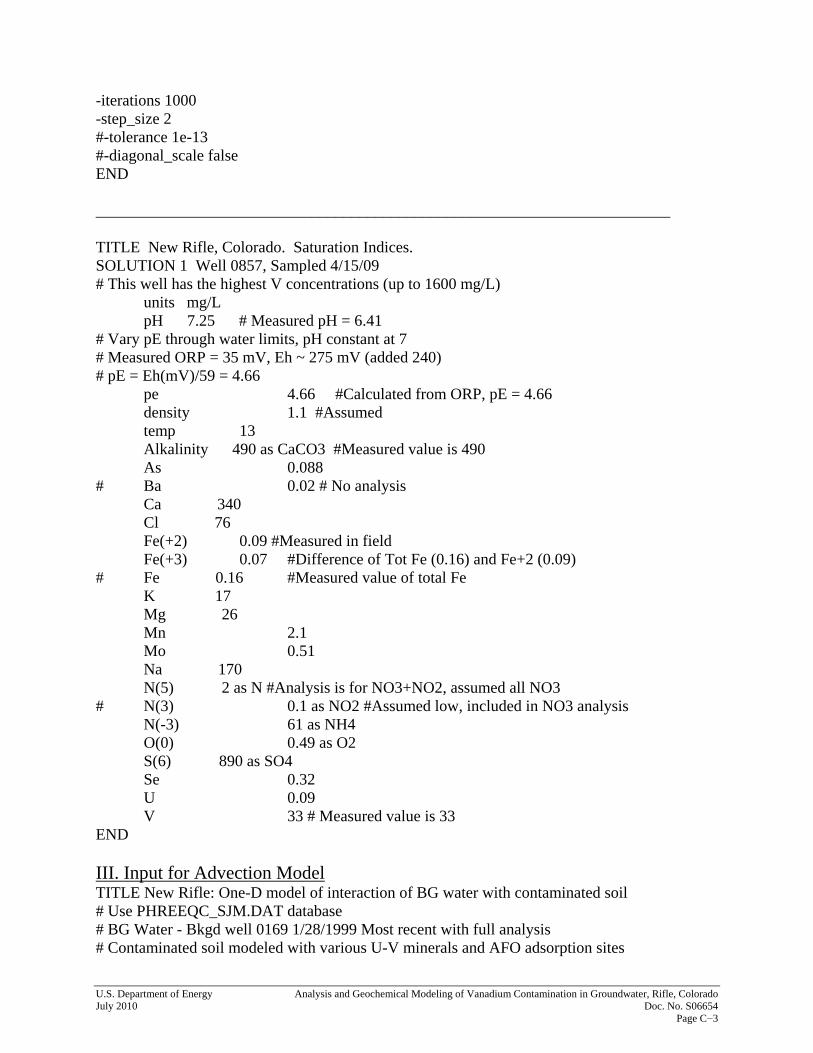
U.S. Department of Energy Analysis and Geochemical Modeling of Vanadium Contamination in Groundwater, Rifle, Colorado July 2010 Doc. No. S06654 Page C−3
-iterations 1000 -step_size 2 #-tolerance 1e-13 #-diagonal_scale false END ________________________________________________________________________ TITLE New Rifle, Colorado. Saturation Indices. SOLUTION 1 Well 0857, Sampled 4/15/09 # This well has the highest V concentrations (up to 1600 mg/L) units mg/L pH 7.25 # Measured pH = 6.41 # Vary pE through water limits, pH constant at 7 # Measured ORP = 35 mV, Eh ~ 275 mV (added 240) # pE = Eh(mV)/59 = 4.66 pe 4.66 #Calculated from ORP, pE = 4.66 density 1.1 #Assumed temp 13 Alkalinity 490 as CaCO3 #Measured value is 490 As 0.088 # Ba 0.02 # No analysis Ca 340 Cl 76 Fe(+2) 0.09 #Measured in field Fe(+3) 0.07 #Difference of Tot Fe (0.16) and Fe+2 (0.09) # Fe 0.16 #Measured value of total Fe K 17 Mg 26 Mn 2.1 Mo 0.51 Na 170 N(5) 2 as N #Analysis is for NO3+NO2, assumed all NO3 # N(3) 0.1 as NO2 #Assumed low, included in NO3 analysis N(-3) 61 as NH4 O(0) 0.49 as O2 S(6) 890 as SO4 Se 0.32 U 0.09 V 33 # Measured value is 33 END III. Input for Advection Model TITLE New Rifle: One-D model of interaction of BG water with contaminated soil # Use PHREEQC_SJM.DAT database # BG Water - Bkgd well 0169 1/28/1999 Most recent with full analysis # Contaminated soil modeled with various U-V minerals and AFO adsorption sites
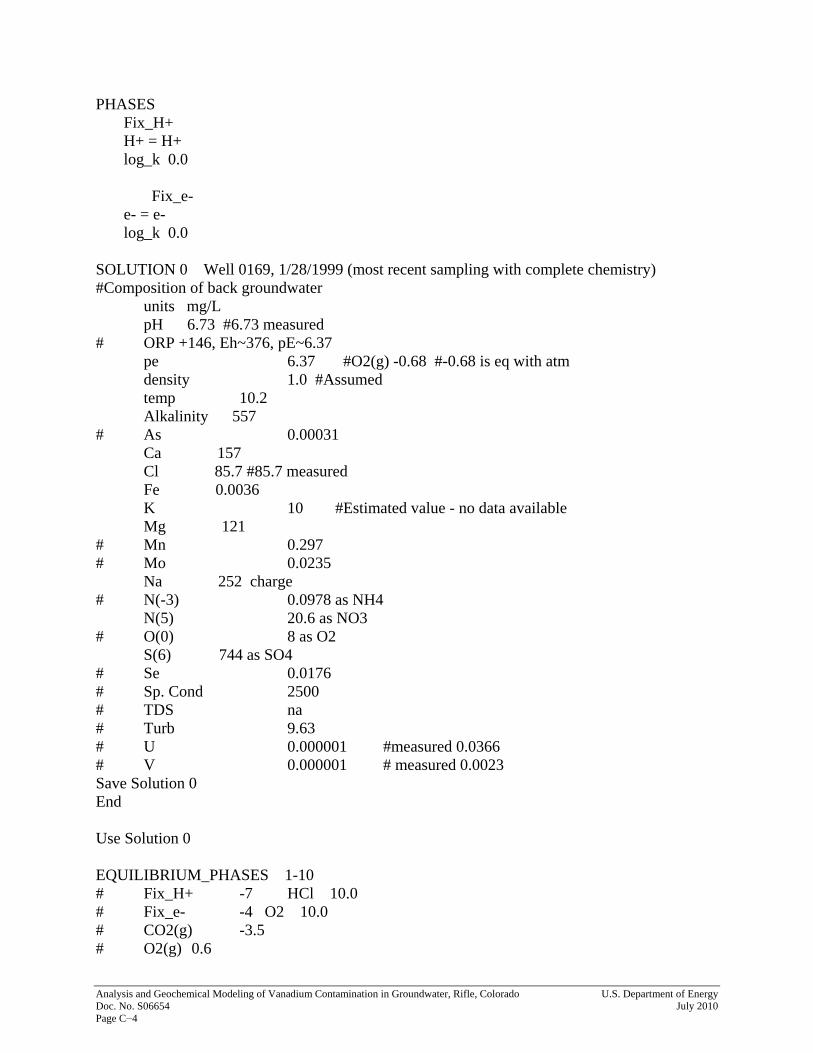
Analysis and Geochemical Modeling of Vanadium Contamination in Groundwater, Rifle, Colorado U.S. Department of Energy Doc. No. S06654 July 2010 Page C−4
PHASES Fix_H+ H+ = H+ log_k 0.0 Fix_e- e- = e- log_k 0.0 SOLUTION 0 Well 0169, 1/28/1999 (most recent sampling with complete chemistry) #Composition of back groundwater units mg/L pH 6.73 #6.73 measured # ORP +146, Eh~376, pE~6.37 pe 6.37 #O2(g) -0.68 #-0.68 is eq with atm density 1.0 #Assumed temp 10.2 Alkalinity 557 # As 0.00031 Ca 157 Cl 85.7 #85.7 measured Fe 0.0036 K 10 #Estimated value - no data available Mg 121 # Mn 0.297 # Mo 0.0235 Na 252 charge # N(-3) 0.0978 as NH4 N(5) 20.6 as NO3 # O(0) 8 as O2 S(6) 744 as SO4 # Se 0.0176 # Sp. Cond 2500 # TDS na # Turb 9.63 # U 0.000001 #measured 0.0366 # V 0.000001 # measured 0.0023 Save Solution 0 End Use Solution 0 EQUILIBRIUM_PHASES 1-10 # Fix_H+ -7 HCl 10.0 # Fix_e- -4 O2 10.0 # CO2(g) -3.5 # O2(g) 0.6
U.S. Department of Energy Analysis and Geochemical Modeling of Vanadium Contamination in Groundwater, Rifle, Colorado July 2010 Doc. No. S06654 Page C−5
V_Tyuyamunite 0.0 0.1 V_Carnotite 0.0 0.1 V_Fe_Vanadate 0.0 0.1 Calcite 0.0 10 Gypsum 0.0 10 # V2O4 0.0 10.0 # V2O5 0.0 0.1 V_Ca_Vanadate 0.0 0.3 #Ca0.5VO3 # V_Ca3(VO4)2 0.0 0.5 # V_Ca2V2O7 0.0 0.1 #CaVO3.5 # V_Na_Vanadate 0.0 1.0 #NaVO3 # V_Na3VO4 0.0 0.1 # V_Na4V2O7 0.0 0.1 Fe(OH)3(a) 0.0 10.0 # Fe_hematite SURFACE 1-10 # -equil with Solution 1 # -no_edl Hfo_sOH 4.8e-3 600. 86.4 # 0.96 mol/L, 1% TOTFe Hfo_wOH 0.192 # Hfo_sOH 5e-6 600. 0.09 #0.001 mol/L (~0.001 % TOTFe) # Hfo_wOH 2e-4 Save Solution 1-10 END SELECTED_OUTPUT -file AAfinal_model.sel -totals V U -molalities Hfo_wOHVO4-3 Hfo_wOH2UO2(OH)3 Hfo_sOHCa+2 Hfo_wOCa+ -equilibrium_phases calcite gypsum V_Fe_Vanadate V_Tyuyamunite V_Ca_Vanadate END PRINT -selected_out true ADVECTION -cells 10 #number of cells in model -shifts 500 #number of shifts, movement of fluid to next cell; time steps -punch 10 -punch_frequency 5 -print 10 -print_frequency 5 #User_Punch #Causes pore vols to be printed in selected output # -heading Pore_Vol # 10 punch (STEP_NO)/10
Analysis and Geochemical Modeling of Vanadium Contamination in Groundwater, Rifle, Colorado U.S. Department of Energy Doc. No. S06654 July 2010 Page C−6
USER_GRAPH -headings Pore_Volumes V V U Ca Fe pE pH -chart_title "Cell 10 Concentrations -axis_titles "Pore_Volumes" "Effluent Concentration (mg/L)" -axis_scale x_axis 0 50 5 -axis_scale y_axis 0 2100 200 -axis_scale sy_axis 0 20 2 -initial_solutions false -plot_concentration_vs t -start 10 GRAPH_X (STEP_NO)/10 20 GRAPH_Y TOT("V")*50942, TOT("V")*50942, TOT("U")*238029, TOT("Ca")*40080, TOT("Fe")*55847 30 GRAPH_SY -LA("e-"), -LA("H+") -end PRINT -user_graph true END
Appendix D
Well Logs

This page intentionally left blank
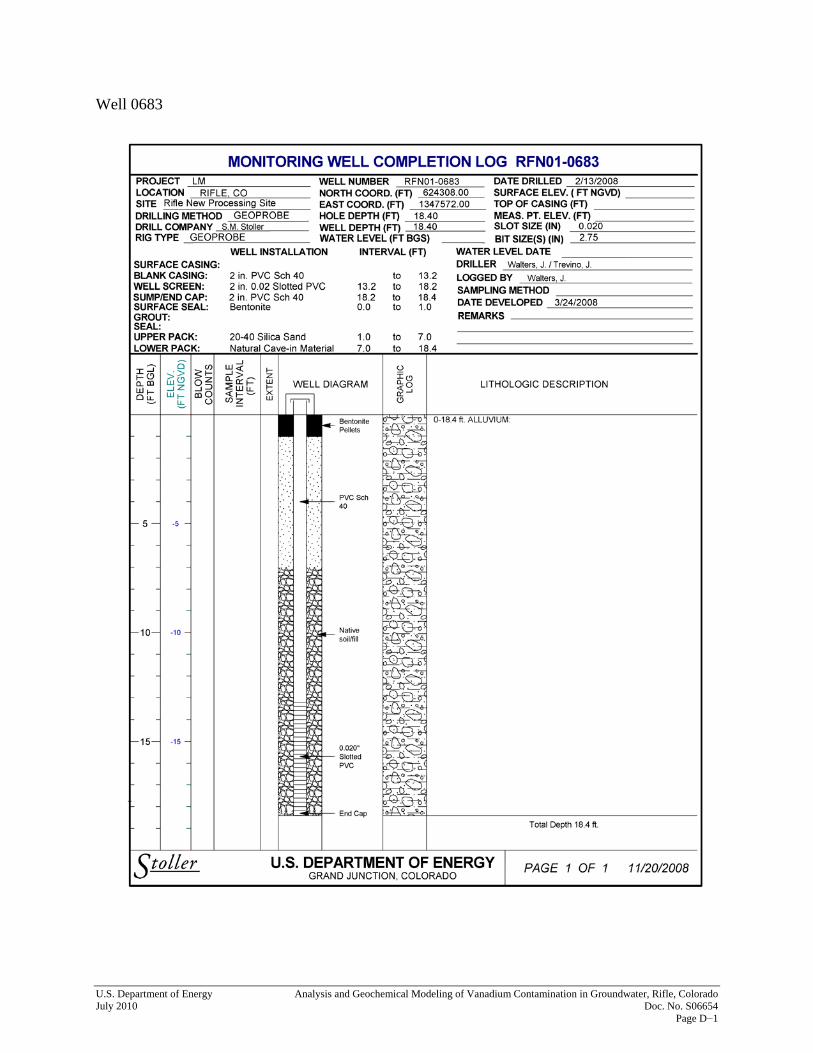
U.S. Department of Energy Analysis and Geochemical Modeling of Vanadium Contamination in Groundwater, Rifle, Colorado July 2010 Doc. No. S06654 Page D−1
Well 0683
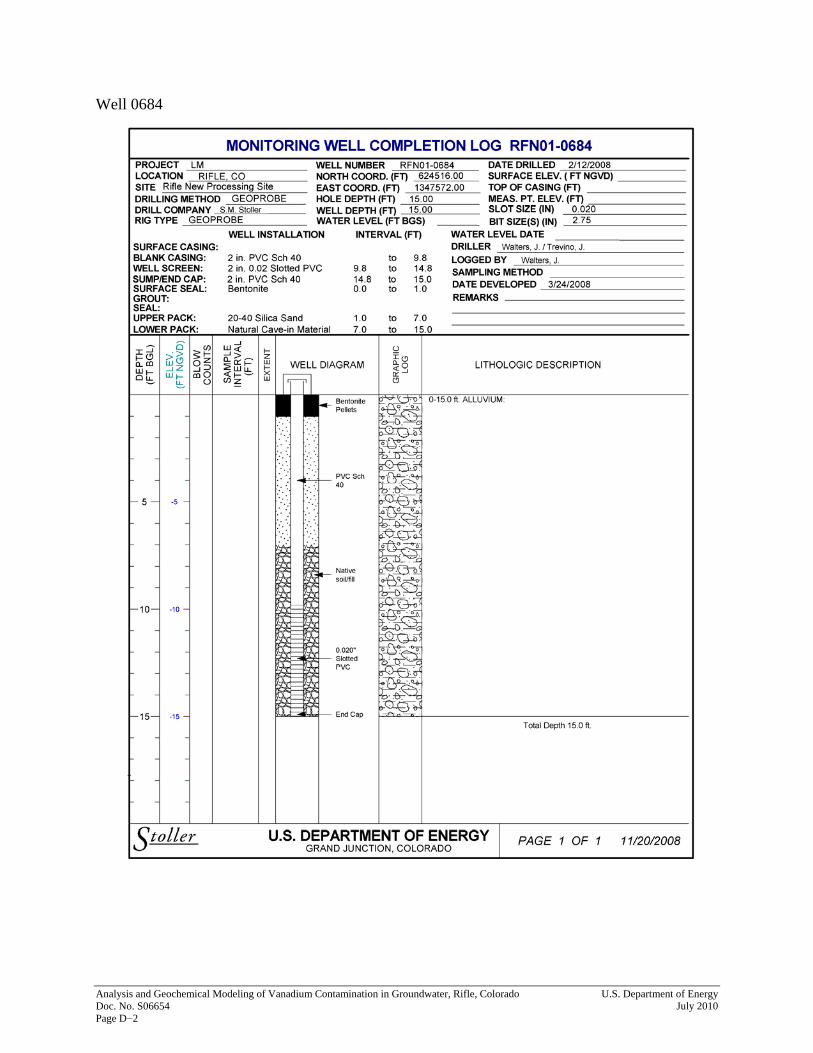
Analysis and Geochemical Modeling of Vanadium Contamination in Groundwater, Rifle, Colorado U.S. Department of Energy Doc. No. S06654 July 2010 Page D−2
Well 0684
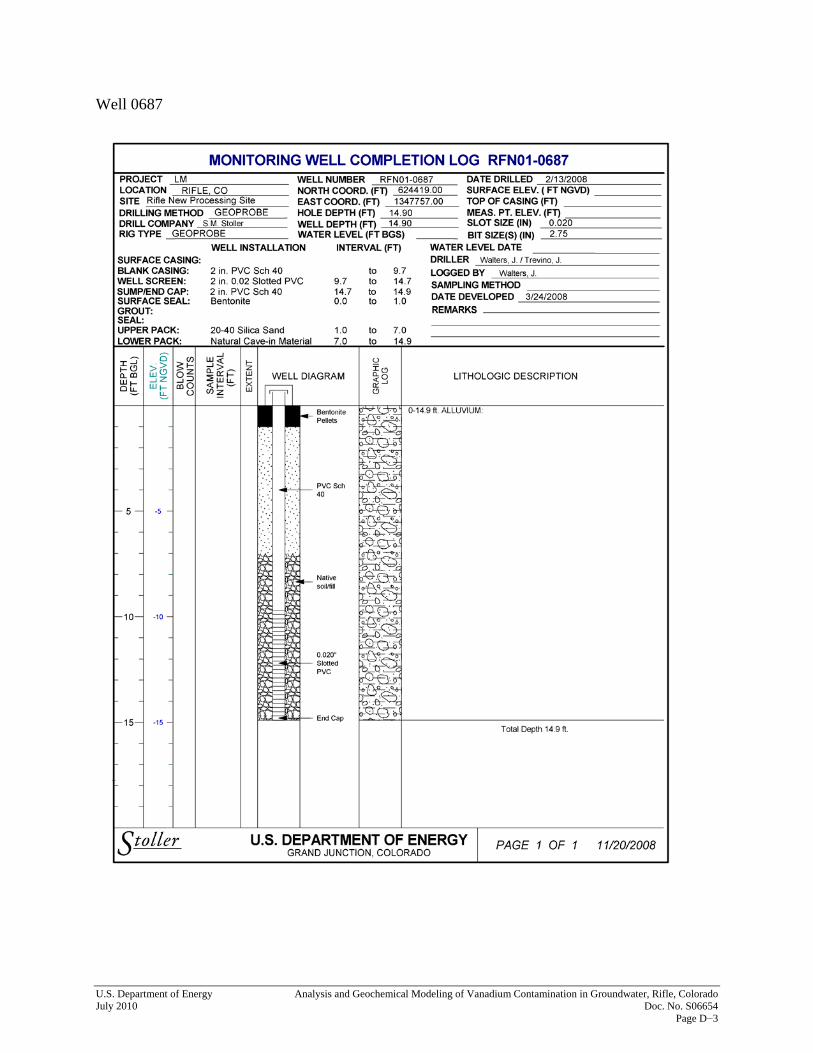
U.S. Department of Energy Analysis and Geochemical Modeling of Vanadium Contamination in Groundwater, Rifle, Colorado July 2010 Doc. No. S06654 Page D−3
Well 0687
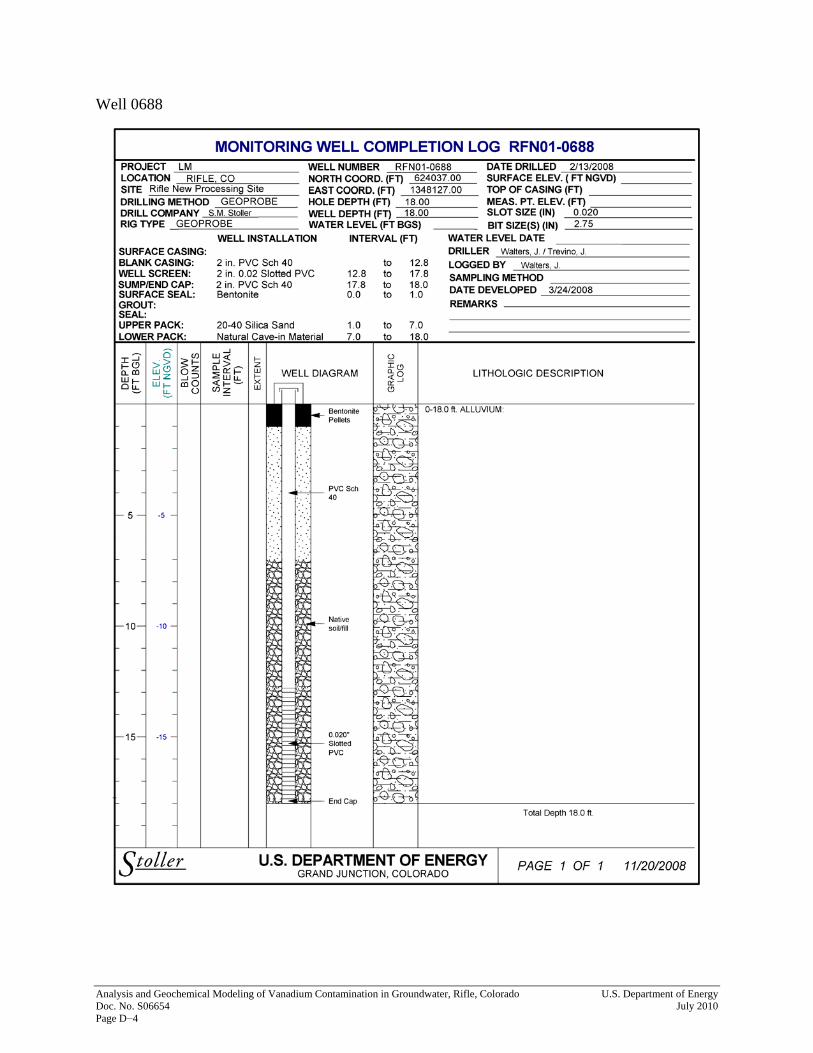
Analysis and Geochemical Modeling of Vanadium Contamination in Groundwater, Rifle, Colorado U.S. Department of Energy Doc. No. S06654 July 2010 Page D−4
Well 0688
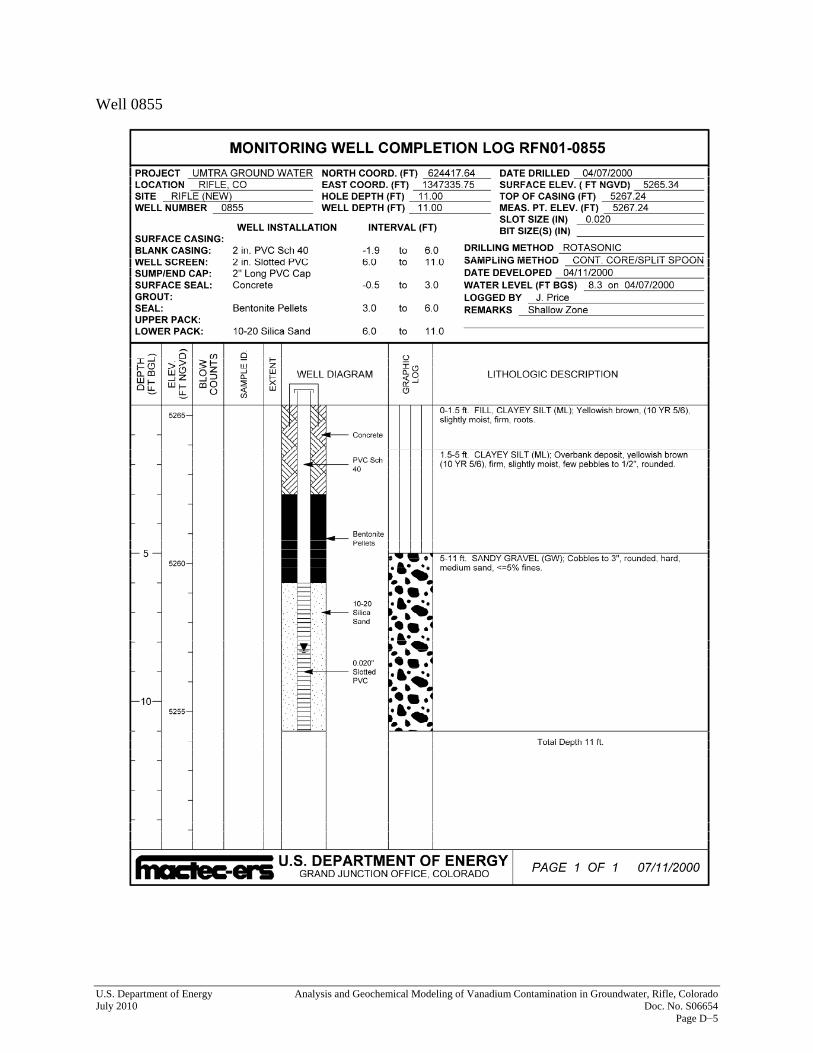
U.S. Department of Energy Analysis and Geochemical Modeling of Vanadium Contamination in Groundwater, Rifle, Colorado July 2010 Doc. No. S06654 Page D−5
Well 0855
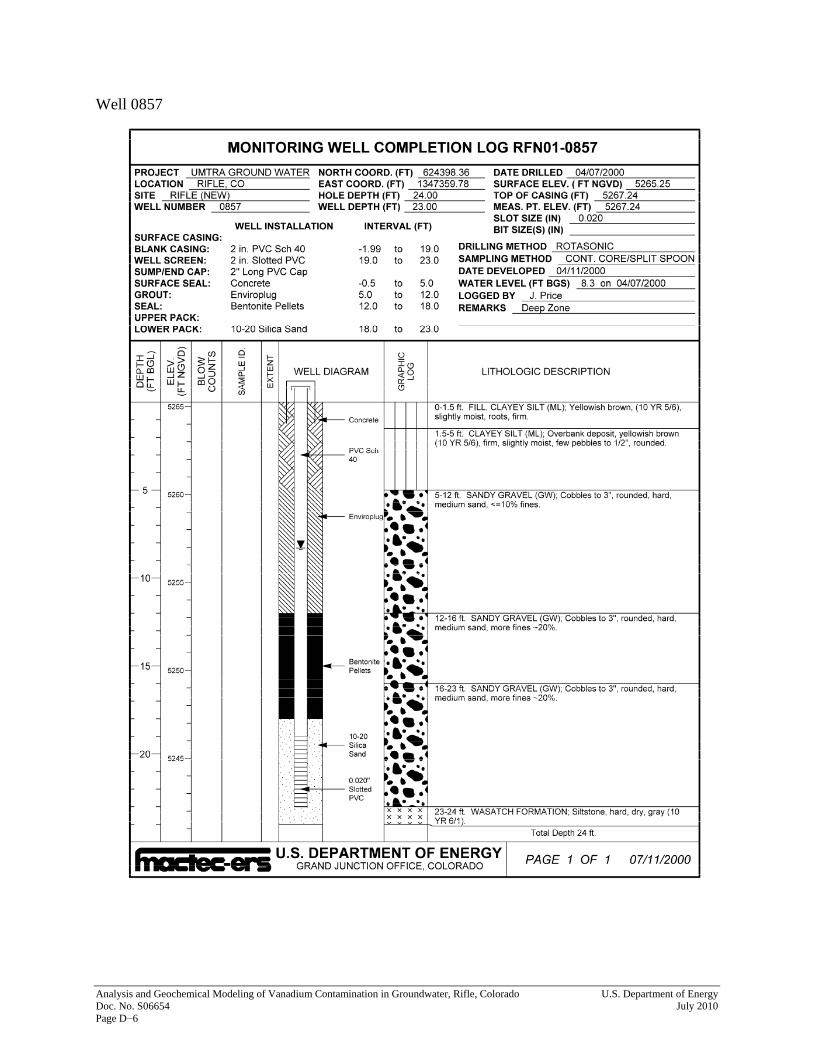
Analysis and Geochemical Modeling of Vanadium Contamination in Groundwater, Rifle, Colorado U.S. Department of Energy Doc. No. S06654 July 2010 Page D−6
Well 0857
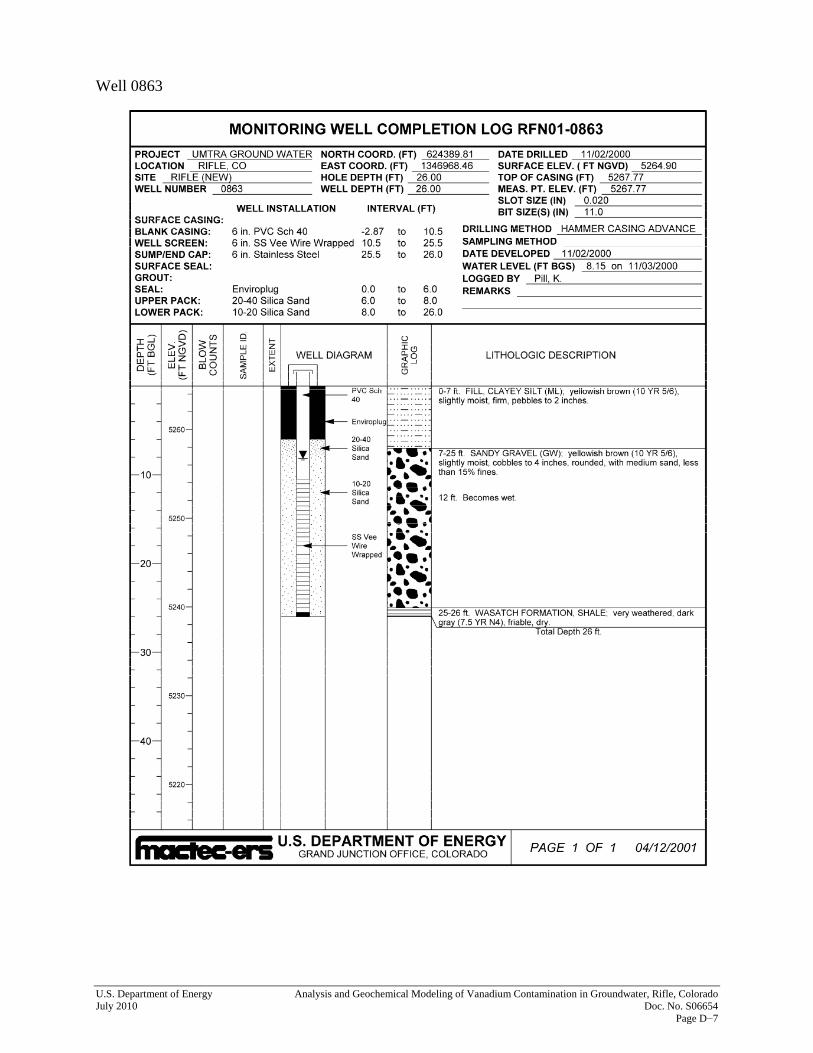
U.S. Department of Energy Analysis and Geochemical Modeling of Vanadium Contamination in Groundwater, Rifle, Colorado July 2010 Doc. No. S06654 Page D−7
Well 0863

Analysis and Geochemical Modeling of Vanadium Contamination in Groundwater, Rifle, Colorado U.S. Department of Energy Doc. No. S06654 July 2010 Page D−8
This page intentionally left blank