Embed Size (px)
Citation preview
244 IEEE TRANSACTIONS ON MICROWAVE THEORY AND TECHNIQUES, VOL. 61, NO. 1, JANUARY 2013
Analysis and Design of a Differential Sampled-LineSix-Port Reflectometer
Sakol Julrat, Mitchai Chongcheawchamnan, Senior Member, IEEE, Thanate Khaoraphapong, andIan D. Robertson, Fellow, IEEE
Abstract—The analysis and design of a differential six-portreflectometer (SPR) based on a sampled-line structure is pre-sented in this paper. The practical differential SPR is realized inCoplanar Strip (CPS) transmission line form, using two balunsfor interfacing with the RF source and device under test (DUT)and four baluns connected to the RF logarithmic detectors. Theperformance of the proposed differential SPR structure is evalu-ated with a common-mode rejection ratio analysis and impedancemeasurement. A prototype differential SPR was designed andfabricated at 1 GHz in order to verify the analysis. Measure-ment results for various load impedances are compared with themeasured results obtained from a commercial automatic vectornetwork analyzer. It is shown that the differential structure givesa significant advantage in rejecting common-mode interferencesignals.
Index Terms—Impedance measurement, microwave measure-ments, reflectometry, transmission line measurements.
I. INTRODUCTION
T HE six-port reflectometer (SPR) is well known in the fieldof microwave measurements and sensing. The technique
determines the complex reflection coefficient of a device undertest (DUT) from four signal amplitude measurements. Sincephase does not need to bemeasured directly, RF detectors can beused and a low cost measurement [1]–[3] system can be realized.There are several low-cost applications that can use SPR, suchas dielectric permittivity measurement [4], [5], moisture contentdetermination [6]–[8], breast cancer detection [9], imaging sen-sors [10] and radar systems [11]–[13], to name but a few.Previously, most SPRs have been implemented as
single-ended designs which are fundamentally sensitive toelectromagnetic interference, ground bouncing, substrate noise,etc. This will be manifested as common-mode noise in adifferential system. It is well known that the common-moderejection can be considerably improved by using a differentialmeasurement technique [14]. From a circuit implementation
Manuscript received September 07, 2012; accepted October 12, 2012. Dateof publication December 28, 2012; date of current version January 17, 2013.This work was supported in part by The Thailand Research Fund (TRF) for TheRoyal Golden Jubilee (RGJ) Ph.D Program Scholarship (PHD/0193/2551) andin part by Prince of Songkla University.S. Julrat, M. Chongcheawchamnan, and T. Khaorapapong are with the De-
partment of Computer Engineering, Faculty of Engineering, Prince of SongklaUniversity, Songkhla 90112, Thailand (e-mail: [email protected]).I. D. Robertson is with the Institute of Microwaves and Photonics, University
of Leeds, Leeds LS2 9JT, U.K.Color versions of one or more of the figures in this paper are available online
at http://ieeexplore.ieee.org.Digital Object Identifier 10.1109/TMTT.2012.2227788
viewpoint, a differential circuit outperforms the single-endedcircuit in terms of a capability to reduce common-mode noiseand offers higher dynamic range [15]. Thus, to effectivelyreduce these unwanted signals and enhance dynamic range inan SPR system, a differential technique should be applied to thedesign. The key to achieve this is to use a differential structureand develop a reflection coefficient determination algorithmbased on the differential-mode network.In this paper, mixed-mode S-parameter analysis is used to
study the concept of the differential SPR structure and estab-lish a method to determine the reflection coefficient. The SPRperformance is considered in terms of common-mode rejectionratio (CMRR). The structure proposed in [16] is used to demon-strate the feasibility of the concept since it can readily be ap-plied to a differential SPR structure with sufficient accuracy formany applications. In Section II, the differential SPR structureis analyzed with mixed-mode S-parameters and the methods fordetermining reflection coefficient and calibration are presented.An analysis of common-mode rejection ratio for the differentialSPR structure is presented and discussed in Section III. The de-sign and simulation results of the differential SPR structure aregiven in Section IV. The differential SPR structure is designedand fabricated to operate at 1 GHz on FR4 substrate. Experi-mental results of this prototype are used to validate the conceptin Section V. Finally, the paper will be concluded in Section VI.
II. DIFFERENTIAL SPR CONCEPT
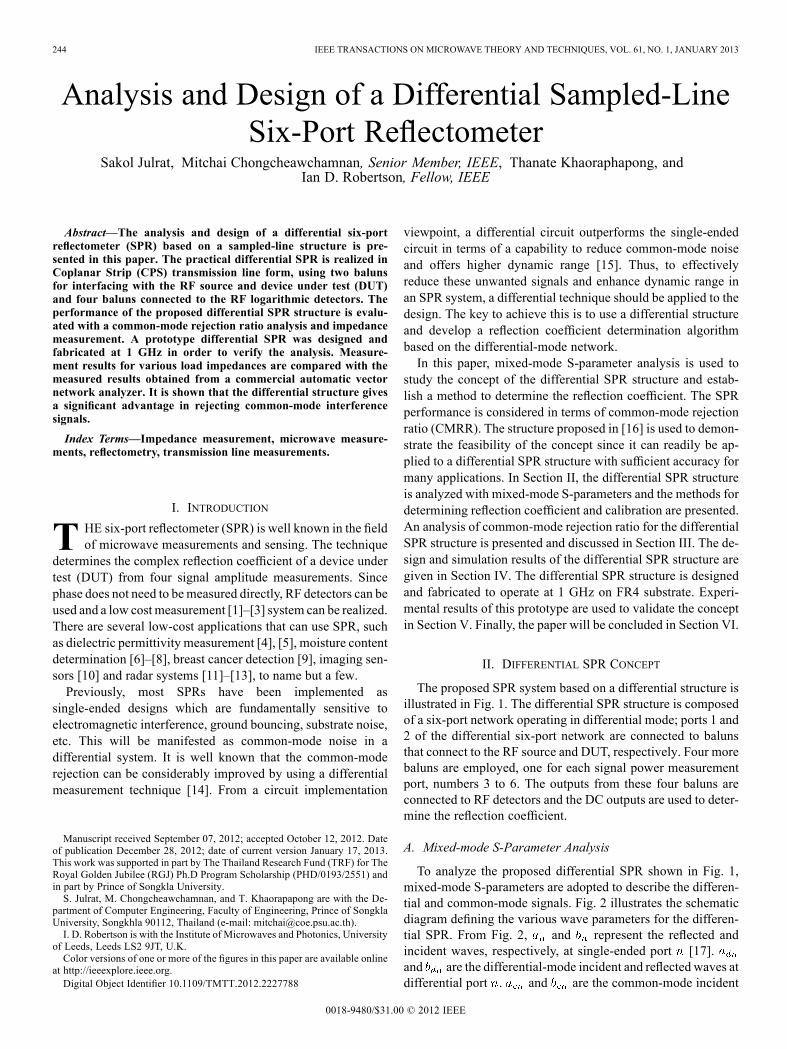
The proposed SPR system based on a differential structure isillustrated in Fig. 1. The differential SPR structure is composedof a six-port network operating in differential mode; ports 1 and2 of the differential six-port network are connected to balunsthat connect to the RF source and DUT, respectively. Four morebaluns are employed, one for each signal power measurementport, numbers 3 to 6. The outputs from these four baluns areconnected to RF detectors and the DC outputs are used to deter-mine the reflection coefficient.
A. Mixed-mode S-Parameter Analysis
To analyze the proposed differential SPR shown in Fig. 1,mixed-mode S-parameters are adopted to describe the differen-tial and common-mode signals. Fig. 2 illustrates the schematicdiagram defining the various wave parameters for the differen-tial SPR. From Fig. 2, and represent the reflected andincident waves, respectively, at single-ended port [17].and are the differential-mode incident and reflected waves atdifferential port . and are the common-mode incident
0018-9480/$31.00 © 2012 IEEE
JULRAT et al.: ANALYSIS AND DESIGN OF A DIFFERENTIAL SAMPLED-LINE SIX-PORT REFLECTOMETER 245
Fig. 1. Proposed differential six-port network structure.
Fig. 2. Conceptual schematic of the differential SPR.
and reflected waves at common-mode port [14]. The conver-sion between single-ended and differential wave variable can befound in [18]. and are differential and common modepower wave at differential port , respectively.To obtain the power wave equation of the proposed differen-
tial SPR structure in Fig. 2, the wave variable equations can bedefined as follows:
(1a)
(1b)
(1c)
(1d)
where , 4, 5 and 6 denotes the detector port number. ,, , and are single-ended S-parameters of the differ-
ential SPR. and are mixed-mode S-parameters rep-resenting the transmission coefficients from the single-endedport 1 and 2 to the differential port , respectively. and
are mixed-mode S-parameters representing the transmis-sion coefficients from the single-ended signal port 1 and 2 tothe common-mode port , respectively.Rewriting (1b) in terms of and applying this to (1c) and (1d),
we obtain
(2a)
(2b)
Since the reflection coefficient of the DUT is equal to ,(2a) and (2b) can be rewritten in the power wave equation formas follows:
(3a)
(3b)
where and are differential and common-modepower waves at port , respectively. and are thecharacteristic parameters of the differential six-port network.The differential signal is obtained through a balun while aresidual common-mode signal appears from the same balun.To determine , either (3a) or (3b) is theoretically sufficient.For a perfect balun, the common-mode signal is eliminated andthus only (3a) will be applied to the computation. In practice,since imbalance in the balun is unavoidable, the common-modenoise cannot be completely eliminated. This common-modesignal adds to the power reading which in turn effects to theperformance.
B. Calibration Method
In order to measure by using the proposed differential SPRstructure, a calibration procedure is needed to determine thecharacteristic parameters of the differential SPR. The system-atic errors caused by the non-ideal characteristics of the SPRhardware can also be removed in the calibration process. To cal-ibrate the differential SPR, the power equation shown in (3a)is applied. By substituting , 4, 5 and 6 in (3a) and per-form mathematical manipulation, we obtain a calibration equa-tion system presented in matrix form as follows:
(4)
where is the characteristic matrix for the differential SPR.is the differential-mode power that is obtained
through the balun at port , where , 4, 5, 6. In this case,can be determined with several calibration schemes; for ex-
ample five standard loads can be used for calibration [19]. Con-sequently, the real and imaginary parts of can be solved from(4) by performing matrix inversion, resulting in the followingequations:
(5a)
(5b)
where denotes the element at row and column of .denotes the differential-mode power obtained through
the balun; for –4, this leads to , , and ,respectively. The solution for in (5) is found in a similarmanner to the technique proposed by Hoer [19] and several cal-ibration algorithms [20]–[22] can also be applied for the differ-ential SPR.
III. ANALYSIS OF COMMON-MODE REJECTION RATIO (CMRR)
In the differential SPR structure shown in Fig. 1, the differ-ential-mode operation is obtained with differential transmissionlines and baluns. In practice, common-mode noise and unbal-anced effects can occur due to non-ideal behavior relating to the
246 IEEE TRANSACTIONS ON MICROWAVE THEORY AND TECHNIQUES, VOL. 61, NO. 1, JANUARY 2013
power source, grounding system, differential transmission linesand baluns used in the design. This will degrade the differen-tial SPR performance. To quantify the performance of the pro-posed differential SPR, common-mode rejection ratio (CMRR)analysis is applied. Normally, CMRR is defined by the differen-tial-mode transmission versus the common-mode signal trans-mission from the input port (port A) to output port (port B) asfollows [14]:
(6)
where CMRR is in decibels (dB). and denote thedifferential transmission coefficients and common mode trans-mission coefficients from input port A to output port B, respec-tively. Similarly, the CMRRs of the 2-port differential transmis-sion line that is used in the proposed differential SPR can be de-fined as follows:
(7a)
(7b)
where and refer to the CMRR from dif-ferential port 1 to 2 and port 2 to 1, respectively. and
are differential-mode transmission parameters from port1 to 2 and from port 2 to 1, respectively. and arecommon-mode transmission parameters from port 1 to 2 andfrom port 2 to 1, respectively.For the 3-port balun circuit that is used in the proposed dif-
ferential SPR, the CMRR is defined in a different way since thecommon-mode port is unavailable at the single-ended port ofthe balun. This can be defined as follows [14]:
(8a)
(8b)
where and refer to the single-ended todifferential ports and from differential to single-ended ports,respectively. and denote the transmission coefficientsfrom single-ended port to differential and to common modes,respectively. and are the transmission coefficientsfrom differential and common-mode to single-ended modes,respectively.By applying the CMRR definitions of differential line and
balun circuit to the proposed differential SPR shown in Fig. 1,we define its CMRR as the ratio between the differential andcommon-mode signal transmissions at power reading port (being 3, 4, 5 or 6) referred to the single-ended RF input port 1as follows:
(9)
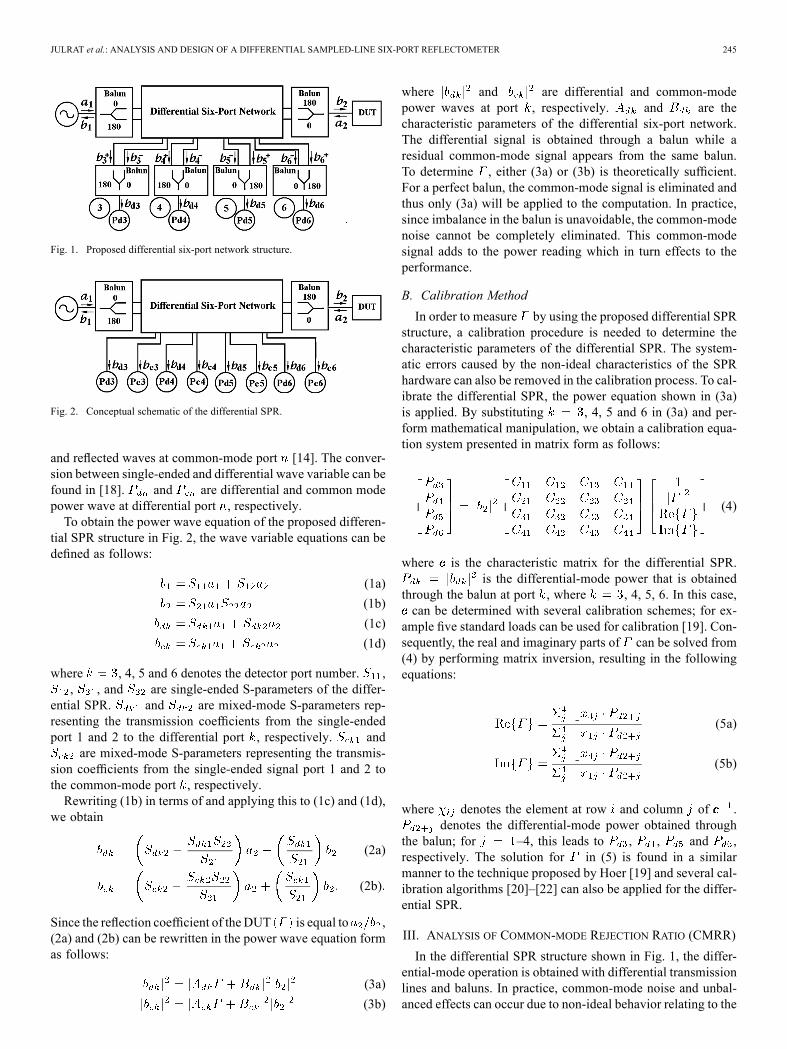
Fig. 3. Signal flow graph for calculating and .
Eliminating , by using (3b) and rewriting in term of , weobtain
(10)From (10), it is shown that the CMRR of the proposed differen-tial SPR is a function of the load, with reflection coefficient , atport 2. This means that to evaluate the CMRR of the differentialSPR, various DUT measurements are required—in particular,five standard loads of 0, 1, 1, and . However,and in (10) will not be obtained by direct measurementsince the common-mode signal is unavailable at single-endedport of the 3-port balun. In this paper, , and where iseither 1 or 2, can be obtained by the steps given below.Step 1) Measure the 3-port single-ended S-parameters of
the balun connected at power reading port . Con-vert the single-ended S-parameters of the balun tomixed-mode S-parameters.
Step 2) Measure the 3-port single-ended S-parameter of thedifferential SPR structure. These three single-endedports are port , and . Noted that port andare differential ports of differential line at power
reading port that is connected to the balun, andcan be measured by removing the balun at powerreading port .
Step 3) Convert the 3-port single-ended S-parameters ob-tained from Step 2 to mixed-mode S-parameters.
Step 4) Connect the mixed-mode S-parameters obtainedfrom Step 1 and Step 3 in the flow graph shown inFig. 3.
The above measurement procedure is based on a two-portnetwork analyzer measurement. During the measurement pro-cedure, only two ports are measured and the other ports are ter-minated by its characteristics impedance. This is similar to the3-port balun S-parameter extraction [23].In Fig. 3, the mixed-mode S-parameters obtained from Step
3 are indicated with the bar symbol. The symbol can be ei-ther 1 or 2, for port 1 or port 2 of the differential SPR and
for the power reading ports. The dark, grayand dotted lines represent the differential-mode, common-mode
JULRAT et al.: ANALYSIS AND DESIGN OF A DIFFERENTIAL SAMPLED-LINE SIX-PORT REFLECTOMETER 247
Fig. 4. Differential sampled-line six-port network for HFSS simulation.
and conversion-mode paths, respectively. From Fig. 3, we applyMason’s rule [24] to solve for and , giving the expres-sions (11a) and (11b), shown at the bottom of this page.
IV. DIFFERENTIAL SAMPLED-LINE SPR
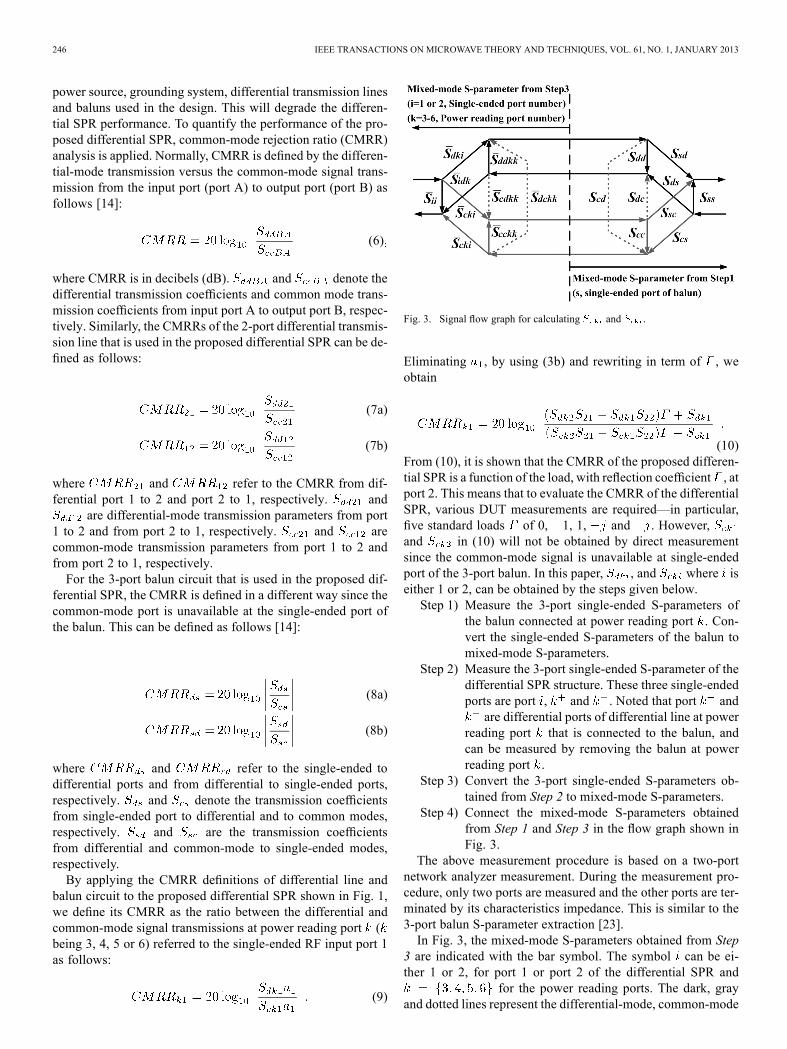
To demonstrate the differential SPR concept, a sampled-lineSPR (SL-SPR) based on a purely differential transmission linewithout reference ground plane is considered, as illustrated inFig. 4. This SL-SPR is proposed as a simple development ofthe single-ended structure [12]. The differential SPR uses a dif-ferential transmission line realized in the coplanar strip (CPS)medium [25]. The two ends of the CPS line are connected tothe baluns at port 1 and port 2, respectively. The RF signals aresampled from ports 3 to 6 using coupling resistors, as previ-ously reported for the single-ended, microstrip-based, SL-SPR[26]. The sampled RF power is subsequently converted to DCvoltages by RF detector.To validate the system operation, the CPS sampled-line six-
port network is designed and simulated with Agilent ADS andAnsoft HFSS software, as described in subsection IV-A. TheCMRR of the CPS sampled-line six-port network is then calcu-lated based on the simulated results.
A. Symmetrical CPS Design
The dimensions of the symmetrical CPS line were calculatedfor a FR-4 substrate using a recognized synthesis tool [27] andthe parameters for 50, 100 and 200 lines are given in Table I(The lower impedance of CPS line allows low insertion loss ofdifferential and common-modes). Impedances of 50 and 100
are difficult to implement practically, so the characteristicimpedance of 200 was used, with 2.54 mm width and 4.30mm gap. Commercially-available 1:4 balun transformers couldbe employed to the CPS design and allow measurement with astandard 50 network analyzer. A quarter-wavelength of theselected CPS design is 45 mm long at 1 GHz. The performanceof a CPS line with 70 mm length was verified by simulatingwith Ansoft HFSS. The differential and common-modes of theCPS line were extracted by terminating all four ports of thesymmetrical CPS line with characteristic impedance 100 toground andmeasuring single-ended S-parameters. The resultingfour-port single-ended S-parameters of the CPS line were con-verted to mixed-mode S-parameters, which are plotted in Fig. 5.Fig. 5(a) shows the differential and common-mode transmis-
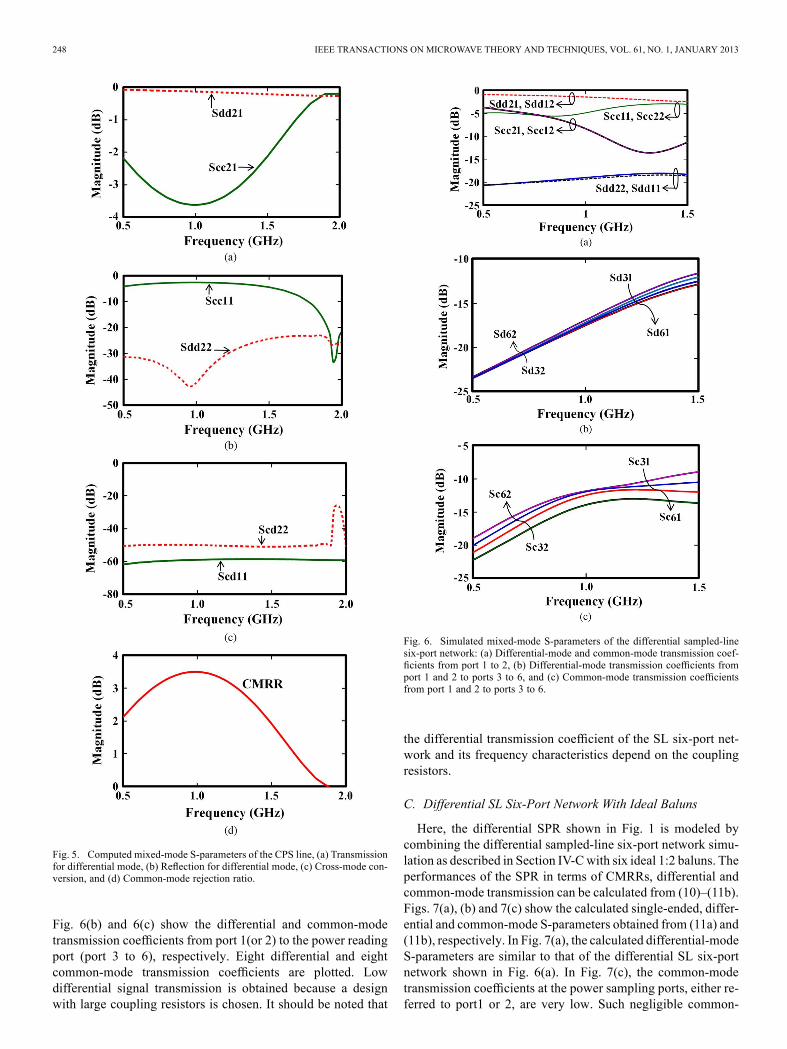
sion responses of the symmetrical CPS line. In Fig. 5(a)–5(b), itis clear that the designed CPS line can support differential-modesignals better than the common mode. Low cross-mode conver-sion is obtained as shown in Fig. 5(c). The computed CMRR ofthe CPS line is shown in Fig. 5(d). More than 3 dB CMRR at 1GHz is obtained.
B. Differential Sampled-lined Six-Port Network
Next, the complete differential sampled-line six-port net-work, as shown in Fig. 4, was modeled. The CPS line is 70mm long and each differential port is separated with a 10 mmgap. To couple the RF signal from the CPS line, a large resistorcoupling is required to minimize the insertion loss performanceof CPS line and keep the RF coupled signal within the workingrange of commercial RF detectors. A 2 lumped resistor isapplied for coupling RF signals from the CPS line, with eachsingle-ended power measurement port set to 100 impedance.The 100 is single-ended characteristic impedance of the 200differential line CPS and the differential port of balun. The
differential sampled-line six-port network was simulated withAnsoft HFSS. Twelve single-ended S-parameters are obtained.The mixed-mode S-parameters were calculated [28] and areplotted in Fig. 6.Fig. 6(a) shows the differential and common-mode transmis-
sion coefficients from port 1 to 2. In Fig. 6(a), the differentialtransmission coefficient is better than 4 dB, while the dif-ferential reflection coefficient is less than 17 dB. Around 1GHz, the common-mode transmission and reflection coeffi-cients are less than 4 and 3 dB, respectively. The minimumcommon-mode transmission coefficient is 14 dB at 1.26 GHz.This means that the differential SL six-port network achieveslow common-mode signal transmission between port 1 and 2.
(11a)
(11b)
248 IEEE TRANSACTIONS ON MICROWAVE THEORY AND TECHNIQUES, VOL. 61, NO. 1, JANUARY 2013
Fig. 5. Computed mixed-mode S-parameters of the CPS line, (a) Transmissionfor differential mode, (b) Reflection for differential mode, (c) Cross-mode con-version, and (d) Common-mode rejection ratio.
Fig. 6(b) and 6(c) show the differential and common-modetransmission coefficients from port 1(or 2) to the power readingport (port 3 to 6), respectively. Eight differential and eightcommon-mode transmission coefficients are plotted. Lowdifferential signal transmission is obtained because a designwith large coupling resistors is chosen. It should be noted that
Fig. 6. Simulated mixed-mode S-parameters of the differential sampled-linesix-port network: (a) Differential-mode and common-mode transmission coef-ficients from port 1 to 2, (b) Differential-mode transmission coefficients fromport 1 and 2 to ports 3 to 6, and (c) Common-mode transmission coefficientsfrom port 1 and 2 to ports 3 to 6.
the differential transmission coefficient of the SL six-port net-work and its frequency characteristics depend on the couplingresistors.
C. Differential SL Six-Port Network With Ideal Baluns
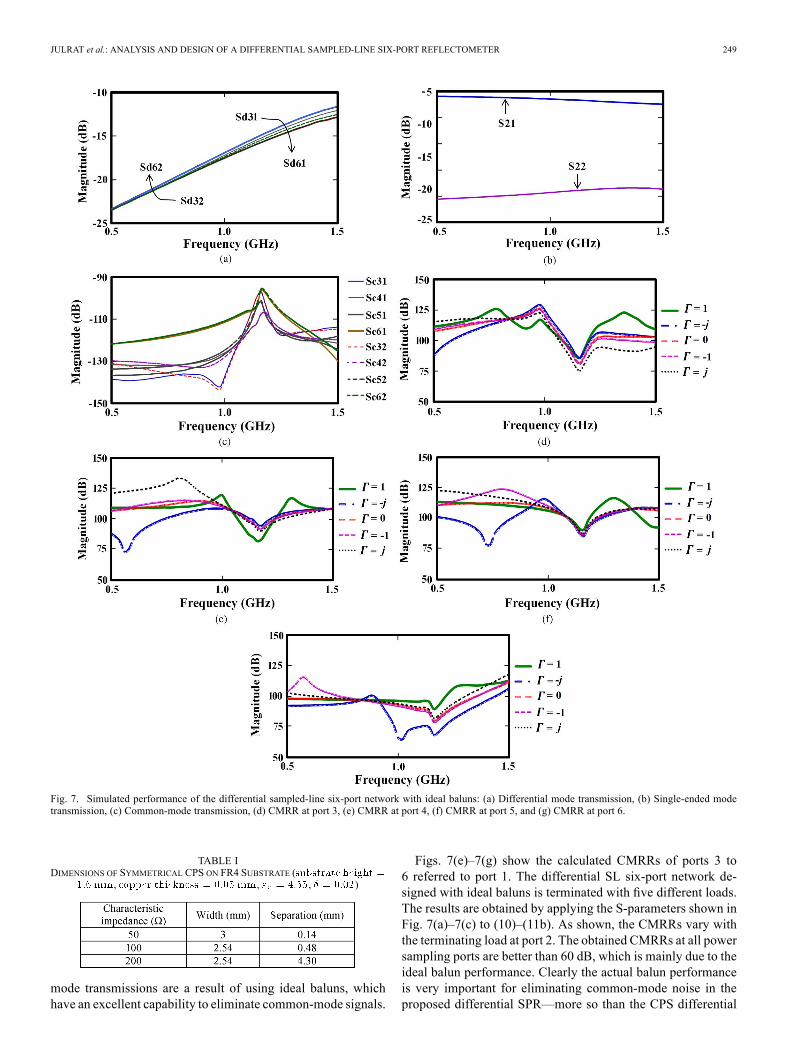
Here, the differential SPR shown in Fig. 1 is modeled bycombining the differential sampled-line six-port network simu-lation as described in Section IV-Cwith six ideal 1:2 baluns. Theperformances of the SPR in terms of CMRRs, differential andcommon-mode transmission can be calculated from (10)–(11b).Figs. 7(a), (b) and 7(c) show the calculated single-ended, differ-ential and common-mode S-parameters obtained from (11a) and(11b), respectively. In Fig. 7(a), the calculated differential-modeS-parameters are similar to that of the differential SL six-portnetwork shown in Fig. 6(a). In Fig. 7(c), the common-modetransmission coefficients at the power sampling ports, either re-ferred to port1 or 2, are very low. Such negligible common-
JULRAT et al.: ANALYSIS AND DESIGN OF A DIFFERENTIAL SAMPLED-LINE SIX-PORT REFLECTOMETER 249
Fig. 7. Simulated performance of the differential sampled-line six-port network with ideal baluns: (a) Differential mode transmission, (b) Single-ended modetransmission, (c) Common-mode transmission, (d) CMRR at port 3, (e) CMRR at port 4, (f) CMRR at port 5, and (g) CMRR at port 6.
TABLE IDIMENSIONS OF SYMMETRICAL CPS ON FR4 SUBSTRATE (
, , , )
mode transmissions are a result of using ideal baluns, whichhave an excellent capability to eliminate common-mode signals.
Figs. 7(e)–7(g) show the calculated CMRRs of ports 3 to6 referred to port 1. The differential SL six-port network de-signed with ideal baluns is terminated with five different loads.The results are obtained by applying the S-parameters shown inFig. 7(a)–7(c) to (10)–(11b). As shown, the CMRRs vary withthe terminating load at port 2. The obtained CMRRs at all powersampling ports are better than 60 dB, which is mainly due to theideal balun performance. Clearly the actual balun performanceis very important for eliminating common-mode noise in theproposed differential SPR—more so than the CPS differential
250 IEEE TRANSACTIONS ON MICROWAVE THEORY AND TECHNIQUES, VOL. 61, NO. 1, JANUARY 2013
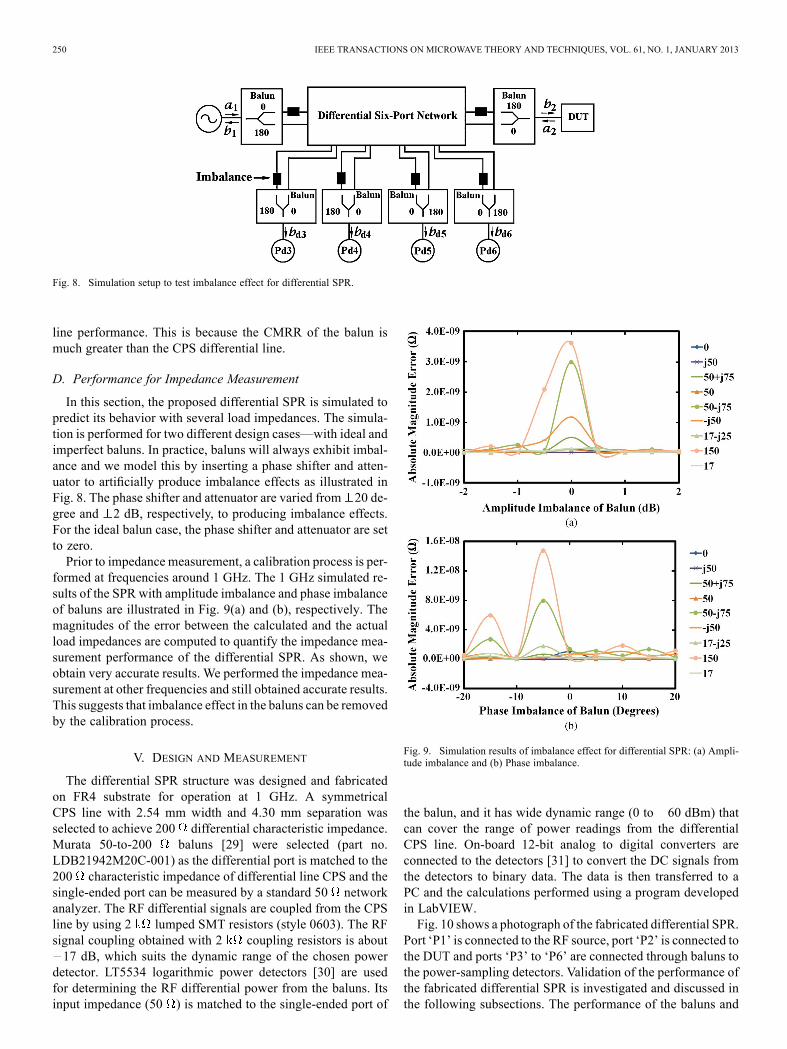
Fig. 8. Simulation setup to test imbalance effect for differential SPR.
line performance. This is because the CMRR of the balun ismuch greater than the CPS differential line.
D. Performance for Impedance Measurement
In this section, the proposed differential SPR is simulated topredict its behavior with several load impedances. The simula-tion is performed for two different design cases—with ideal andimperfect baluns. In practice, baluns will always exhibit imbal-ance and we model this by inserting a phase shifter and atten-uator to artificially produce imbalance effects as illustrated inFig. 8. The phase shifter and attenuator are varied from 20 de-gree and 2 dB, respectively, to producing imbalance effects.For the ideal balun case, the phase shifter and attenuator are setto zero.Prior to impedance measurement, a calibration process is per-
formed at frequencies around 1 GHz. The 1 GHz simulated re-sults of the SPR with amplitude imbalance and phase imbalanceof baluns are illustrated in Fig. 9(a) and (b), respectively. Themagnitudes of the error between the calculated and the actualload impedances are computed to quantify the impedance mea-surement performance of the differential SPR. As shown, weobtain very accurate results. We performed the impedance mea-surement at other frequencies and still obtained accurate results.This suggests that imbalance effect in the baluns can be removedby the calibration process.
V. DESIGN AND MEASUREMENT
The differential SPR structure was designed and fabricatedon FR4 substrate for operation at 1 GHz. A symmetricalCPS line with 2.54 mm width and 4.30 mm separation wasselected to achieve 200 differential characteristic impedance.Murata 50-to-200 baluns [29] were selected (part no.LDB21942M20C-001) as the differential port is matched to the200 characteristic impedance of differential line CPS and thesingle-ended port can be measured by a standard 50 networkanalyzer. The RF differential signals are coupled from the CPSline by using 2 lumped SMT resistors (style 0603). The RFsignal coupling obtained with 2 coupling resistors is about17 dB, which suits the dynamic range of the chosen power
detector. LT5534 logarithmic power detectors [30] are usedfor determining the RF differential power from the baluns. Itsinput impedance (50 ) is matched to the single-ended port of
Fig. 9. Simulation results of imbalance effect for differential SPR: (a) Ampli-tude imbalance and (b) Phase imbalance.
the balun, and it has wide dynamic range (0 to 60 dBm) thatcan cover the range of power readings from the differentialCPS line. On-board 12-bit analog to digital converters areconnected to the detectors [31] to convert the DC signals fromthe detectors to binary data. The data is then transferred to aPC and the calculations performed using a program developedin LabVIEW.Fig. 10 shows a photograph of the fabricated differential SPR.
Port ‘P1’ is connected to the RF source, port ‘P2’ is connected tothe DUT and ports ‘P3’ to ‘P6’ are connected through baluns tothe power-sampling detectors. Validation of the performance ofthe fabricated differential SPR is investigated and discussed inthe following subsections. The performance of the baluns and
JULRAT et al.: ANALYSIS AND DESIGN OF A DIFFERENTIAL SAMPLED-LINE SIX-PORT REFLECTOMETER 251
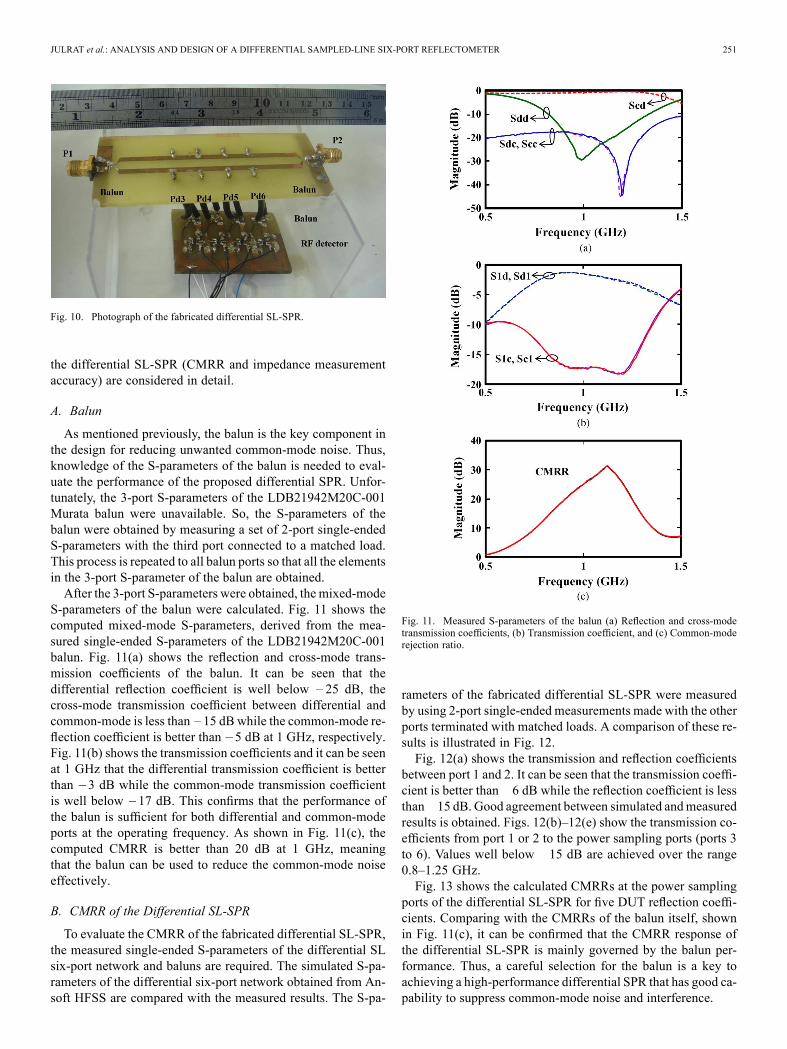
Fig. 10. Photograph of the fabricated differential SL-SPR.
the differential SL-SPR (CMRR and impedance measurementaccuracy) are considered in detail.
A. Balun
As mentioned previously, the balun is the key component inthe design for reducing unwanted common-mode noise. Thus,knowledge of the S-parameters of the balun is needed to eval-uate the performance of the proposed differential SPR. Unfor-tunately, the 3-port S-parameters of the LDB21942M20C-001Murata balun were unavailable. So, the S-parameters of thebalun were obtained by measuring a set of 2-port single-endedS-parameters with the third port connected to a matched load.This process is repeated to all balun ports so that all the elementsin the 3-port S-parameter of the balun are obtained.After the 3-port S-parameters were obtained, the mixed-mode
S-parameters of the balun were calculated. Fig. 11 shows thecomputed mixed-mode S-parameters, derived from the mea-sured single-ended S-parameters of the LDB21942M20C-001balun. Fig. 11(a) shows the reflection and cross-mode trans-mission coefficients of the balun. It can be seen that thedifferential reflection coefficient is well below 25 dB, thecross-mode transmission coefficient between differential andcommon-mode is less than 15 dB while the common-mode re-flection coefficient is better than 5 dB at 1 GHz, respectively.Fig. 11(b) shows the transmission coefficients and it can be seenat 1 GHz that the differential transmission coefficient is betterthan 3 dB while the common-mode transmission coefficientis well below 17 dB. This confirms that the performance ofthe balun is sufficient for both differential and common-modeports at the operating frequency. As shown in Fig. 11(c), thecomputed CMRR is better than 20 dB at 1 GHz, meaningthat the balun can be used to reduce the common-mode noiseeffectively.
B. CMRR of the Differential SL-SPR
To evaluate the CMRR of the fabricated differential SL-SPR,the measured single-ended S-parameters of the differential SLsix-port network and baluns are required. The simulated S-pa-rameters of the differential six-port network obtained from An-soft HFSS are compared with the measured results. The S-pa-
Fig. 11. Measured S-parameters of the balun (a) Reflection and cross-modetransmission coefficients, (b) Transmission coefficient, and (c) Common-moderejection ratio.
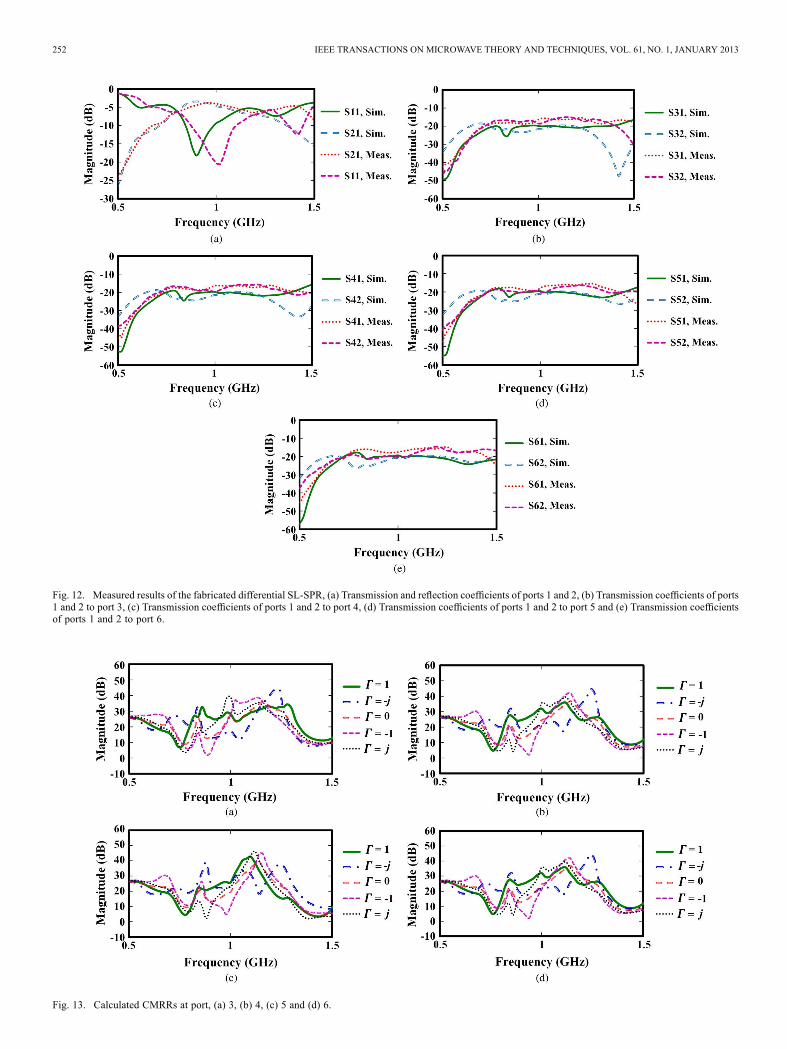
rameters of the fabricated differential SL-SPR were measuredby using 2-port single-ended measurements made with the otherports terminated with matched loads. A comparison of these re-sults is illustrated in Fig. 12.Fig. 12(a) shows the transmission and reflection coefficients
between port 1 and 2. It can be seen that the transmission coeffi-cient is better than 6 dB while the reflection coefficient is lessthan 15 dB. Good agreement between simulated andmeasuredresults is obtained. Figs. 12(b)–12(e) show the transmission co-efficients from port 1 or 2 to the power sampling ports (ports 3to 6). Values well below 15 dB are achieved over the range0.8–1.25 GHz.Fig. 13 shows the calculated CMRRs at the power sampling
ports of the differential SL-SPR for five DUT reflection coeffi-cients. Comparing with the CMRRs of the balun itself, shownin Fig. 11(c), it can be confirmed that the CMRR response ofthe differential SL-SPR is mainly governed by the balun per-formance. Thus, a careful selection for the balun is a key toachieving a high-performance differential SPR that has good ca-pability to suppress common-mode noise and interference.
252 IEEE TRANSACTIONS ON MICROWAVE THEORY AND TECHNIQUES, VOL. 61, NO. 1, JANUARY 2013
Fig. 12. Measured results of the fabricated differential SL-SPR, (a) Transmission and reflection coefficients of ports 1 and 2, (b) Transmission coefficients of ports1 and 2 to port 3, (c) Transmission coefficients of ports 1 and 2 to port 4, (d) Transmission coefficients of ports 1 and 2 to port 5 and (e) Transmission coefficientsof ports 1 and 2 to port 6.
Fig. 13. Calculated CMRRs at port, (a) 3, (b) 4, (c) 5 and (d) 6.
JULRAT et al.: ANALYSIS AND DESIGN OF A DIFFERENTIAL SAMPLED-LINE SIX-PORT REFLECTOMETER 253
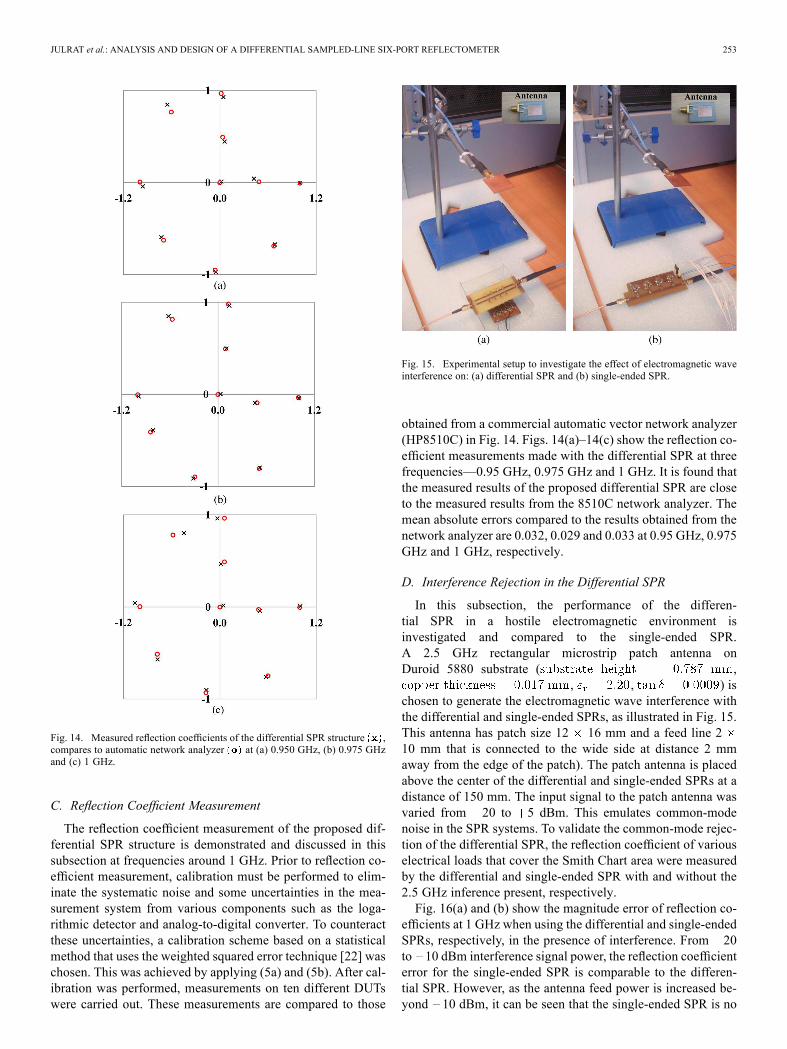
Fig. 14. Measured reflection coefficients of the differential SPR structure ,compares to automatic network analyzer at (a) 0.950 GHz, (b) 0.975 GHzand (c) 1 GHz.
C. Reflection Coefficient Measurement
The reflection coefficient measurement of the proposed dif-ferential SPR structure is demonstrated and discussed in thissubsection at frequencies around 1 GHz. Prior to reflection co-efficient measurement, calibration must be performed to elim-inate the systematic noise and some uncertainties in the mea-surement system from various components such as the loga-rithmic detector and analog-to-digital converter. To counteractthese uncertainties, a calibration scheme based on a statisticalmethod that uses the weighted squared error technique [22] waschosen. This was achieved by applying (5a) and (5b). After cal-ibration was performed, measurements on ten different DUTswere carried out. These measurements are compared to those
Fig. 15. Experimental setup to investigate the effect of electromagnetic waveinterference on: (a) differential SPR and (b) single-ended SPR.
obtained from a commercial automatic vector network analyzer(HP8510C) in Fig. 14. Figs. 14(a)–14(c) show the reflection co-efficient measurements made with the differential SPR at threefrequencies—0.95 GHz, 0.975 GHz and 1 GHz. It is found thatthe measured results of the proposed differential SPR are closeto the measured results from the 8510C network analyzer. Themean absolute errors compared to the results obtained from thenetwork analyzer are 0.032, 0.029 and 0.033 at 0.95 GHz, 0.975GHz and 1 GHz, respectively.
D. Interference Rejection in the Differential SPR
In this subsection, the performance of the differen-tial SPR in a hostile electromagnetic environment isinvestigated and compared to the single-ended SPR.A 2.5 GHz rectangular microstrip patch antenna onDuroid 5880 substrate ( ,
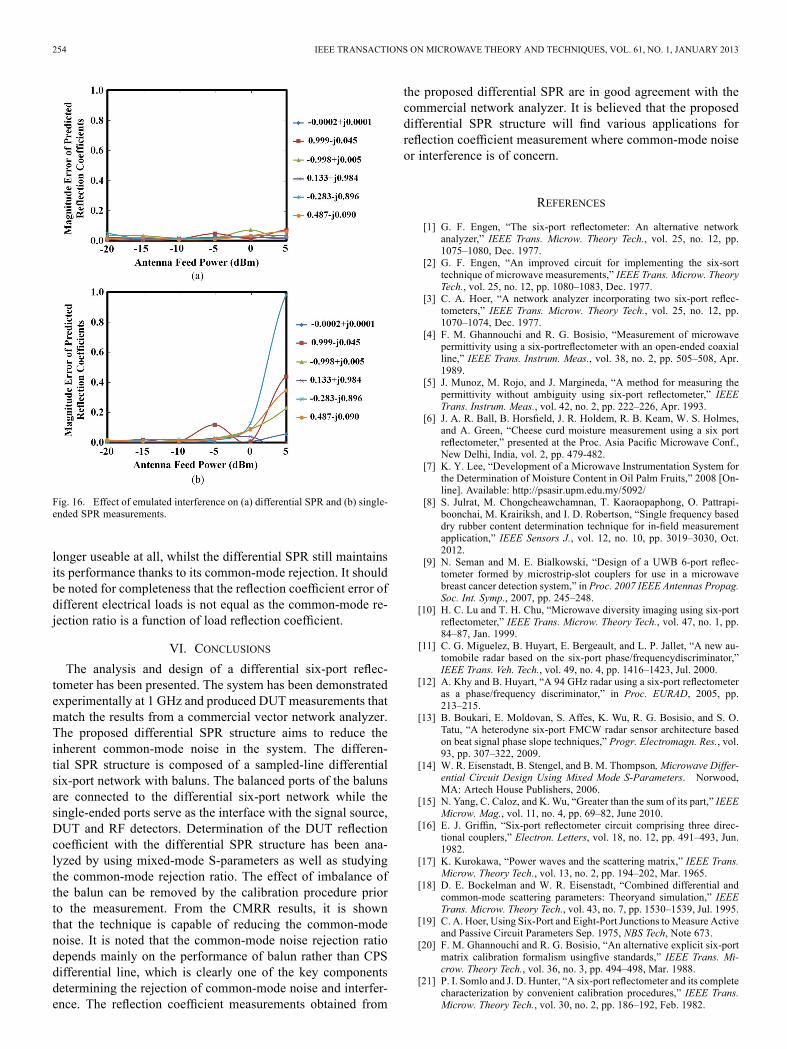
, , ) ischosen to generate the electromagnetic wave interference withthe differential and single-ended SPRs, as illustrated in Fig. 15.This antenna has patch size 12 16 mm and a feed line 210 mm that is connected to the wide side at distance 2 mmaway from the edge of the patch). The patch antenna is placedabove the center of the differential and single-ended SPRs at adistance of 150 mm. The input signal to the patch antenna wasvaried from 20 to 5 dBm. This emulates common-modenoise in the SPR systems. To validate the common-mode rejec-tion of the differential SPR, the reflection coefficient of variouselectrical loads that cover the Smith Chart area were measuredby the differential and single-ended SPR with and without the2.5 GHz inference present, respectively.Fig. 16(a) and (b) show the magnitude error of reflection co-
efficients at 1 GHz when using the differential and single-endedSPRs, respectively, in the presence of interference. From 20to 10 dBm interference signal power, the reflection coefficienterror for the single-ended SPR is comparable to the differen-tial SPR. However, as the antenna feed power is increased be-yond 10 dBm, it can be seen that the single-ended SPR is no
254 IEEE TRANSACTIONS ON MICROWAVE THEORY AND TECHNIQUES, VOL. 61, NO. 1, JANUARY 2013
Fig. 16. Effect of emulated interference on (a) differential SPR and (b) single-ended SPR measurements.
longer useable at all, whilst the differential SPR still maintainsits performance thanks to its common-mode rejection. It shouldbe noted for completeness that the reflection coefficient error ofdifferent electrical loads is not equal as the common-mode re-jection ratio is a function of load reflection coefficient.
VI. CONCLUSIONS
The analysis and design of a differential six-port reflec-tometer has been presented. The system has been demonstratedexperimentally at 1 GHz and produced DUT measurements thatmatch the results from a commercial vector network analyzer.The proposed differential SPR structure aims to reduce theinherent common-mode noise in the system. The differen-tial SPR structure is composed of a sampled-line differentialsix-port network with baluns. The balanced ports of the balunsare connected to the differential six-port network while thesingle-ended ports serve as the interface with the signal source,DUT and RF detectors. Determination of the DUT reflectioncoefficient with the differential SPR structure has been ana-lyzed by using mixed-mode S-parameters as well as studyingthe common-mode rejection ratio. The effect of imbalance ofthe balun can be removed by the calibration procedure priorto the measurement. From the CMRR results, it is shownthat the technique is capable of reducing the common-modenoise. It is noted that the common-mode noise rejection ratiodepends mainly on the performance of balun rather than CPSdifferential line, which is clearly one of the key componentsdetermining the rejection of common-mode noise and interfer-ence. The reflection coefficient measurements obtained from
the proposed differential SPR are in good agreement with thecommercial network analyzer. It is believed that the proposeddifferential SPR structure will find various applications forreflection coefficient measurement where common-mode noiseor interference is of concern.
REFERENCES
[1] G. F. Engen, “The six-port reflectometer: An alternative networkanalyzer,” IEEE Trans. Microw. Theory Tech., vol. 25, no. 12, pp.1075–1080, Dec. 1977.
[2] G. F. Engen, “An improved circuit for implementing the six-sorttechnique of microwave measurements,” IEEE Trans. Microw. TheoryTech., vol. 25, no. 12, pp. 1080–1083, Dec. 1977.
[3] C. A. Hoer, “A network analyzer incorporating two six-port reflec-tometers,” IEEE Trans. Microw. Theory Tech., vol. 25, no. 12, pp.1070–1074, Dec. 1977.
[4] F. M. Ghannouchi and R. G. Bosisio, “Measurement of microwavepermittivity using a six-portreflectometer with an open-ended coaxialline,” IEEE Trans. Instrum. Meas., vol. 38, no. 2, pp. 505–508, Apr.1989.
[5] J. Munoz, M. Rojo, and J. Margineda, “A method for measuring thepermittivity without ambiguity using six-port reflectometer,” IEEETrans. Instrum. Meas., vol. 42, no. 2, pp. 222–226, Apr. 1993.
[6] J. A. R. Ball, B. Horsfield, J. R. Holdem, R. B. Keam, W. S. Holmes,and A. Green, “Cheese curd moisture measurement using a six portreflectometer,” presented at the Proc. Asia Pacific Microwave Conf.,New Delhi, India, vol. 2, pp. 479-482.
[7] K. Y. Lee, “Development of a Microwave Instrumentation System forthe Determination of Moisture Content in Oil Palm Fruits,” 2008 [On-line]. Available: http://psasir.upm.edu.my/5092/
[8] S. Julrat, M. Chongcheawchamnan, T. Kaoraopaphong, O. Pattrapi-boonchai, M. Krairiksh, and I. D. Robertson, “Single frequency baseddry rubber content determination technique for in-field measurementapplication,” IEEE Sensors J., vol. 12, no. 10, pp. 3019–3030, Oct.2012.
[9] N. Seman and M. E. Bialkowski, “Design of a UWB 6-port reflec-tometer formed by microstrip-slot couplers for use in a microwavebreast cancer detection system,” in Proc. 2007 IEEE Antennas Propag.Soc. Int. Symp., 2007, pp. 245–248.
[10] H. C. Lu and T. H. Chu, “Microwave diversity imaging using six-portreflectometer,” IEEE Trans. Microw. Theory Tech., vol. 47, no. 1, pp.84–87, Jan. 1999.
[11] C. G. Miguelez, B. Huyart, E. Bergeault, and L. P. Jallet, “A new au-tomobile radar based on the six-port phase/frequencydiscriminator,”IEEE Trans. Veh. Tech., vol. 49, no. 4, pp. 1416–1423, Jul. 2000.
[12] A. Khy and B. Huyart, “A 94 GHz radar using a six-port reflectometeras a phase/frequency discriminator,” in Proc. EURAD, 2005, pp.213–215.
[13] B. Boukari, E. Moldovan, S. Affes, K. Wu, R. G. Bosisio, and S. O.Tatu, “A heterodyne six-port FMCW radar sensor architecture basedon beat signal phase slope techniques,” Progr. Electromagn. Res., vol.93, pp. 307–322, 2009.
[14] W. R. Eisenstadt, B. Stengel, and B. M. Thompson, Microwave Differ-ential Circuit Design Using Mixed Mode S-Parameters. Norwood,MA: Artech House Publishers, 2006.
[15] N. Yang, C. Caloz, and K. Wu, “Greater than the sum of its part,” IEEEMicrow. Mag., vol. 11, no. 4, pp. 69–82, June 2010.
[16] E. J. Griffin, “Six-port reflectometer circuit comprising three direc-tional couplers,” Electron. Letters, vol. 18, no. 12, pp. 491–493, Jun.1982.
[17] K. Kurokawa, “Power waves and the scattering matrix,” IEEE Trans.Microw. Theory Tech., vol. 13, no. 2, pp. 194–202, Mar. 1965.
[18] D. E. Bockelman and W. R. Eisenstadt, “Combined differential andcommon-mode scattering parameters: Theoryand simulation,” IEEETrans. Microw. Theory Tech., vol. 43, no. 7, pp. 1530–1539, Jul. 1995.
[19] C. A. Hoer, Using Six-Port and Eight-Port Junctions toMeasure Activeand Passive Circuit Parameters Sep. 1975, NBS Tech, Note 673.
[20] F. M. Ghannouchi and R. G. Bosisio, “An alternative explicit six-portmatrix calibration formalism usingfive standards,” IEEE Trans. Mi-crow. Theory Tech., vol. 36, no. 3, pp. 494–498, Mar. 1988.
[21] P. I. Somlo and J. D. Hunter, “A six-port reflectometer and its completecharacterization by convenient calibration procedures,” IEEE Trans.Microw. Theory Tech., vol. 30, no. 2, pp. 186–192, Feb. 1982.
JULRAT et al.: ANALYSIS AND DESIGN OF A DIFFERENTIAL SAMPLED-LINE SIX-PORT REFLECTOMETER 255
[22] S. P. Jachim and W. D. Gutscher, “A statistical method for calibratingthe six-port reflectometerusing nonideal standards,” IEEE Trans. Mi-crow. Theory Tech., vol. 37, no. 11, pp. 1825–1828, Nov. 1989.
[23] K. Jung et al., “Marchand balun embedded probe,” IEEE Trans. Mi-crow. Theory Tech., vol. 56, no. 5, pp. 1207–1214, May 2008.
[24] N. S. Nise, Control Systems Engineering, 5th ed. New Yorl: Wiley,2007.
[25] R. N. Simons, Coplanar Waveguide Circuits, Components, and Sys-tems. New York: Wiley, 2001.
[26] B. M. Altrabsheh and I. D. Robertson, “A multi-probe microwave re-flectometer using an improved calibration algorithm,” in Proc. 36thEur. Microw. Conf., 2006, pp. 979–982.
[27] J. W. P. Ng, Ascps Software Version 1.1, 1999.[28] L. B. Lok, “Balanced Microwave Circuit and Adaptive Single-Side-
band Mixers,” Ph.D. dissertation, University of Leeds, Leeds, U.K.,May 2007.
[29] Murata Manufacturing Co., Datasheet Chip Multilayer Hybrid BalunsLDB21942M20C-001.
[30] Linear technology cooperation, Data Sheet LT5534 50 MHz to 3 GHzRF Power Detector With 60 dB Dynamic Range 2004.
[31] “Cortex-M3 Technical Reference Manual,” ARM Ltd., 2005.
Sakol Julrat received the B.S. degree in mecha-tronics engineering in 2005 and the M.S. degreein electrical engineering in 2009 from Prince ofSongkla University, Thailand, where he is currentlypursing the Ph.D. degree in computer engineering.He worked in hard disk drives industry for two
years following the Bachelors degree. His researchinterests are six-port application, dielectric measure-ment, sensors and measurement systems.
Mitchai Chongcheawchamnan (SM’98) was bornin Bangkok, Thailand. He received the B.Eng.degree in telecommunication from King Mongkut’sInstitute of Technology Ladkrabang, Bangkok, in1992, the M.Sc. degree in communication and signalprocessing from Imperial College, London, U.K., in1995, and the Ph.D. degree in electrical engineeringfrom the University of Surrey, Guildford, U.K., in2001.He joined the Mahanakorn University of Tech-
nology, Bangkok, in 1992, as a Lecturer. In 2008,he joined the Faculty of Engineering, Prince of Songkla University, Songkhla,Thailand, as an Associate Professor. His current research interests include mi-crowave circuit design and microwave techniques for agricultural applications.Dr. Chongcheawchamnan is a member of the IEEE Microwave Society.
Thanate Khaoraphapong, photograph and biography not available at the timeof publication.
Ian D. Robertson (F’12) holds the University ofLeeds Centenary Chair in Microwave and Mil-limetre-Wave Circuits and is Head of the School ofElectronic and Electrical Engineering.He has published over 400 papers in the area
of microwave and millimetre-wave engineering aswell as co-editing the well-known book RFIC andMMIC Design and Technology. He currently leadsan IeMRC-funded project in 3D microwave andmillimetre-wave LTCC components with Loughbor-ough and Imperial College. Prior to joining Leeds he
was a founder member of the Advanced Technology Institute at the Universityof Surrey and led the MMIC Research Team at King’s College London.Dr. Robertson was elected Fellow of the IEEE in 2012 for contributions
to MMIC design and millimetre-wave system-in-package technology. Hewas General Technical Programme Committee Chair for the 2011 EuropeanMicrowave Week—the premier European event in microwave and mil-limetre-wave engineering. He has held over £3M in grants as PI and led 5major EPSRC-funded collaborative projects.