Embed Size (px)
Citation preview
Software Engineering
Anuradha Bhatia
Analysis and Design
Modelling CONTENTS
I. Analysis Modelling 11.. Concept and need of Analysis Modelling
22.. Objectives of Analysis Modelling
II. Analysis Modelling approaches 11.. Structured Analysis (Concept)
22.. Object Oriented Analysis (Concept)
III. Domain Analysis 11.. Concept of Technical Domain of the software
22.. Concept of Application Domain of the Software
33.. Inputs and Output of Domain analysis
IV. Building the Analysis Model 11.. Data Modelling Concepts
22.. Flow- Oriented Modelling
ii.. DFD iiii.. Data Dictionary
iiiiii.. Creating a Control Flow Model iivv.. Creating Control Specifications (CSPEC) vv.. Creating Process Specifications (PSPEC)
33.. Scenario- Based Modelling
ii.. Developing Use Cases iiii.. What is a Use Case?
iiiiii.. Purpose of a Use Case iivv.. Use Case Diagram
Software Engineering
Anuradha Bhatia
I. Analysis Modelling (Question: Define Analysis modelling and the analysis principles – 3 Marks each)
1. Definition
i. The development process starts with the analysis phase.
ii. This phase results in a specification document that shows what the
software will do without specifying how it will be done.
iii. The analysis phase can use two separate approaches, depending on
whether the implementation phase is done using a procedural
programming language or an object-oriented language.
2. Analysis Principles
i. The information domain must be represented and understood. ii. Models should be developed to give emphasis on system information,
function and behavior. iii. Models should uncover and give details of all the layers of the
development process. iv. The function and the problem statement must be defined. v. The various analysis models are flow oriented modelling, scenario based
modelling, class based modelling, and behavioral modelling.
3. Need
(Question: Explain the need of analysis modelling- 4 Marks)
i. Analysis modelling describes the operational and behavioral
characteristics.
ii. Shows the relationship between software interface and other software
elements.
iii. Provides the software developer the representation of the information,
function, and behavior.
iv. Coverts the design into the more descriptive models like use case, ER
diagram.
v. Provides the customer and the developer the means to maintain the
quality.
4. Objective
i. Describe what the customer requires.
ii. Establish a basis for the creation of a software design.
iii. Devise a set of requirements that can be validated once the software is
built.
iv. Analysis model bridges the gap between system level description and the
overall system functionality.
Software Engineering
Anuradha Bhatia
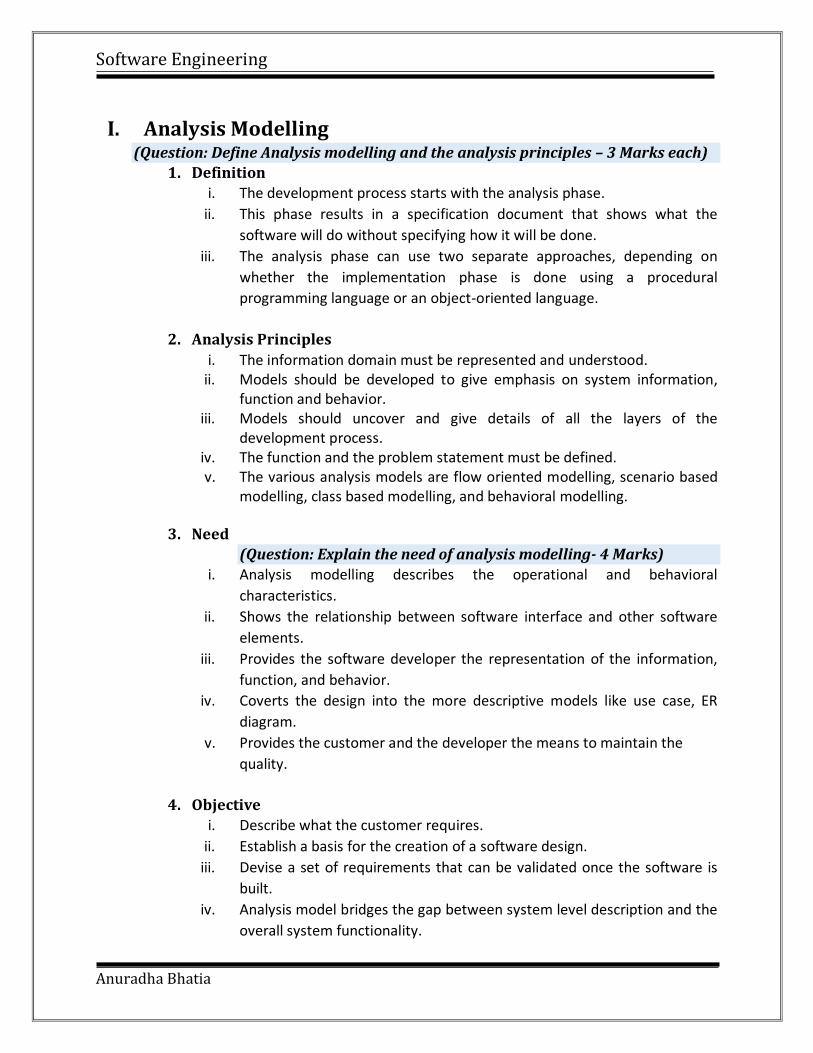
Figure 1. Analysis Model
5. Analysis Rules Of Thumb
(Question: Explain with diagram the structure of analysis modelling
Or
Explain the rules of thumb for analysis modelling – 6 Marks)
i. The model should focus on requirements that are visible within the
problem or business domain and be written as a relatively high level of
abstraction.
ii. Each element of the analysis model should add to the understanding of the
requirements and provide insight into the information domain, function,
and behavior of the system.
iii. Delay consideration of infrastructure and other non-functional models
until design.
iv. Minimize coupling throughout the system.
v. Be certain the analysis model provides value to all stakeholders.
vi. Keep the model as simple as possible.
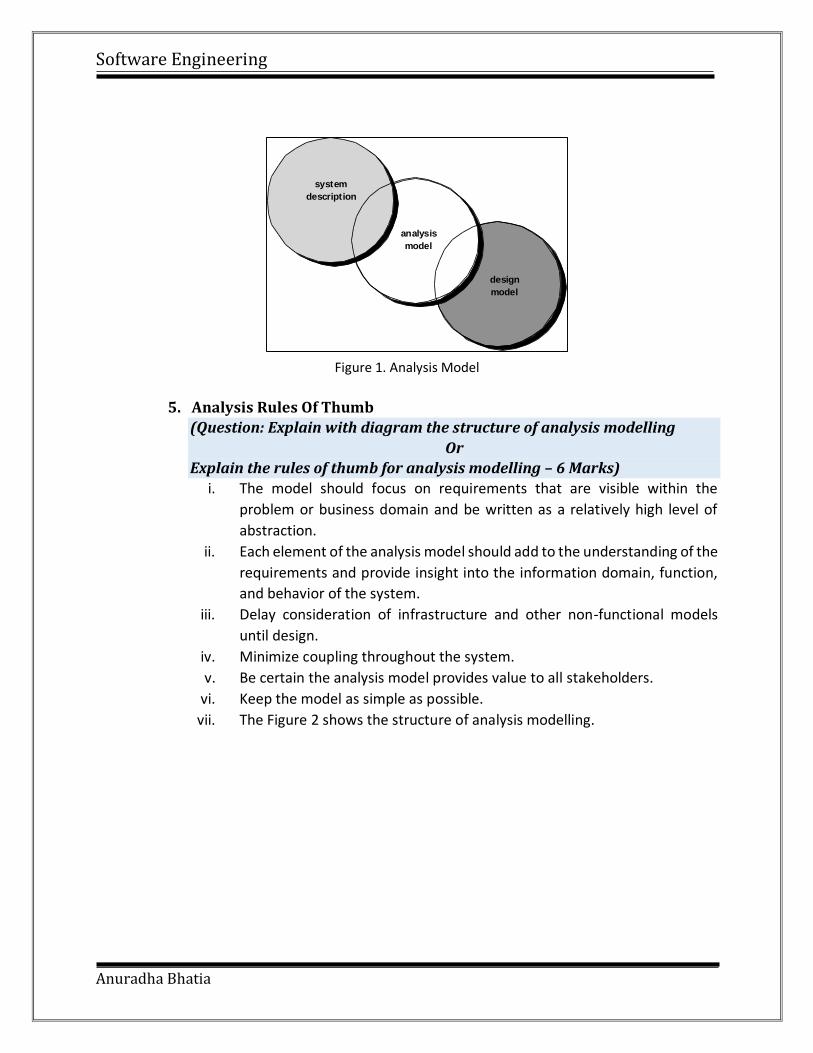
vii. The Figure 2 shows the structure of analysis modelling.
system
description
analysis
model
design
model
Software Engineering
Anuradha Bhatia
Figure 2.Structure of analysis modelling
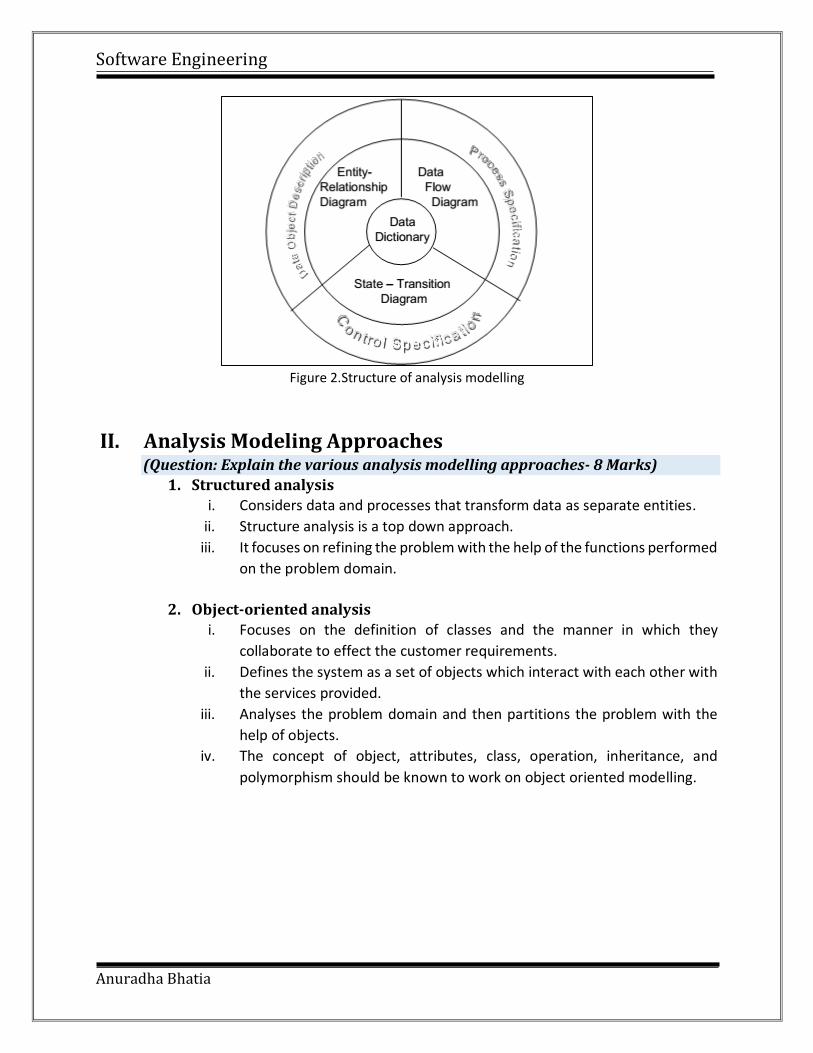
II. Analysis Modeling Approaches (Question: Explain the various analysis modelling approaches- 8 Marks)
1. Structured analysis
i. Considers data and processes that transform data as separate entities.
ii. Structure analysis is a top down approach.
iii. It focuses on refining the problem with the help of the functions performed
on the problem domain.
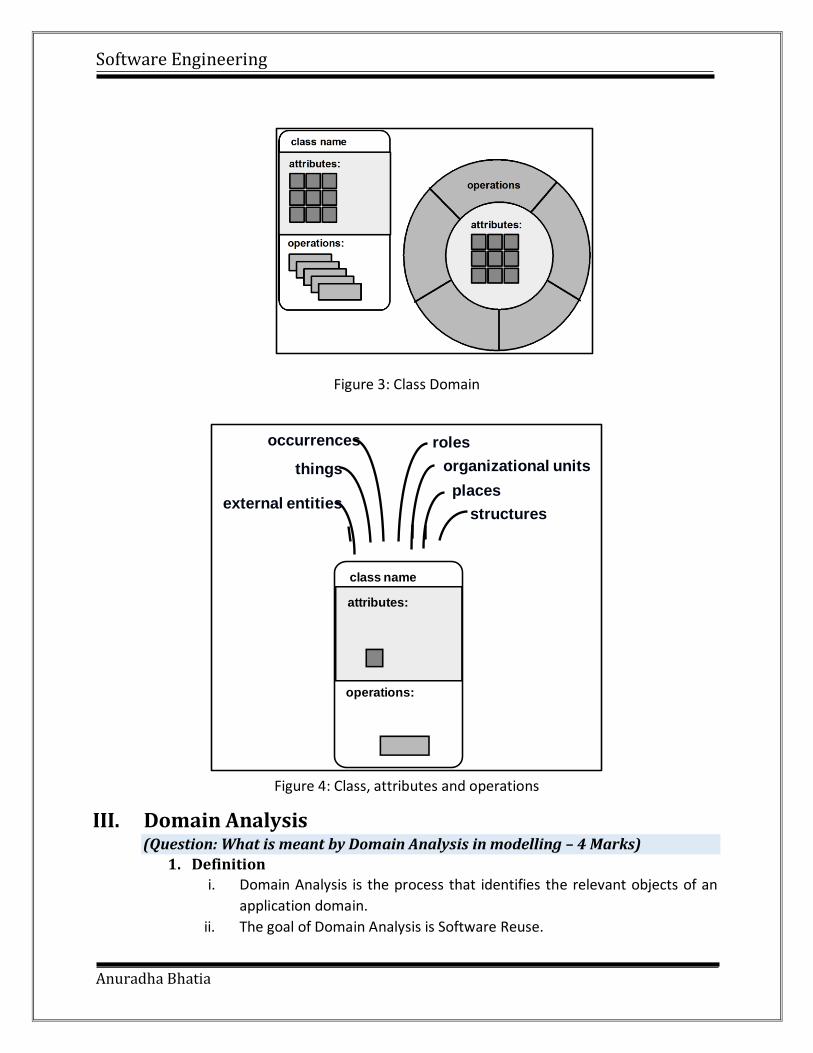
2. Object-oriented analysis
i. Focuses on the definition of classes and the manner in which they
collaborate to effect the customer requirements.
ii. Defines the system as a set of objects which interact with each other with
the services provided.
iii. Analyses the problem domain and then partitions the problem with the
help of objects.
iv. The concept of object, attributes, class, operation, inheritance, and
polymorphism should be known to work on object oriented modelling.
Software Engineering
Anuradha Bhatia
Figure 3: Class Domain
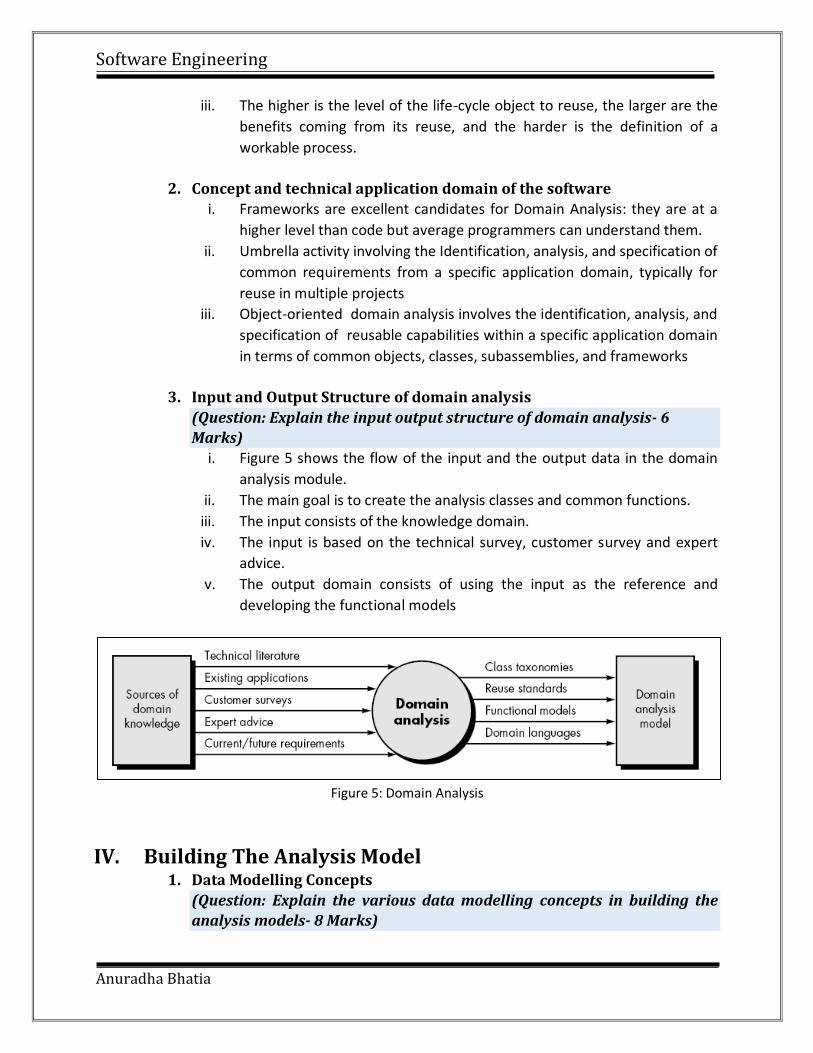
Figure 4: Class, attributes and operations
III. Domain Analysis (Question: What is meant by Domain Analysis in modelling – 4 Marks)
1. Definition
i. Domain Analysis is the process that identifies the relevant objects of an
application domain.
ii. The goal of Domain Analysis is Software Reuse.
external entities
things
occurrences roles
organizational units
places
structures
class name
attributes:
operations:
Software Engineering
Anuradha Bhatia
iii. The higher is the level of the life-cycle object to reuse, the larger are the
benefits coming from its reuse, and the harder is the definition of a
workable process.
2. Concept and technical application domain of the software
i. Frameworks are excellent candidates for Domain Analysis: they are at a
higher level than code but average programmers can understand them.
ii. Umbrella activity involving the Identification, analysis, and specification of
common requirements from a specific application domain, typically for
reuse in multiple projects
iii. Object-oriented domain analysis involves the identification, analysis, and
specification of reusable capabilities within a specific application domain
in terms of common objects, classes, subassemblies, and frameworks
3. Input and Output Structure of domain analysis
(Question: Explain the input output structure of domain analysis- 6
Marks)
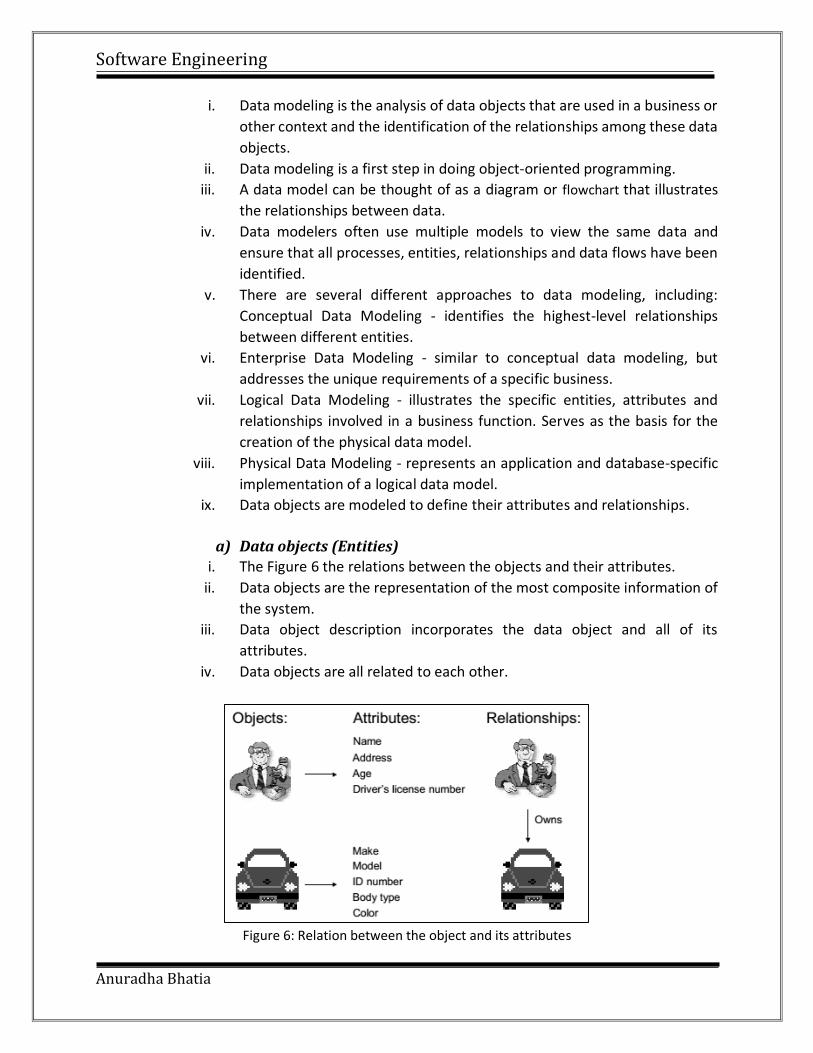
i. Figure 5 shows the flow of the input and the output data in the domain
analysis module.
ii. The main goal is to create the analysis classes and common functions.
iii. The input consists of the knowledge domain.
iv. The input is based on the technical survey, customer survey and expert
advice.
v. The output domain consists of using the input as the reference and
developing the functional models
Figure 5: Domain Analysis
IV. Building The Analysis Model 1. Data Modelling Concepts
(Question: Explain the various data modelling concepts in building the
analysis models- 8 Marks)
Software Engineering
Anuradha Bhatia
i. Data modeling is the analysis of data objects that are used in a business or
other context and the identification of the relationships among these data
objects.
ii. Data modeling is a first step in doing object-oriented programming.
iii. A data model can be thought of as a diagram or flowchart that illustrates
the relationships between data.
iv. Data modelers often use multiple models to view the same data and
ensure that all processes, entities, relationships and data flows have been
identified.
v. There are several different approaches to data modeling, including:
Conceptual Data Modeling - identifies the highest-level relationships
between different entities.
vi. Enterprise Data Modeling - similar to conceptual data modeling, but
addresses the unique requirements of a specific business.
vii. Logical Data Modeling - illustrates the specific entities, attributes and
relationships involved in a business function. Serves as the basis for the
creation of the physical data model.
viii. Physical Data Modeling - represents an application and database-specific
implementation of a logical data model.
ix. Data objects are modeled to define their attributes and relationships.
a) Data objects (Entities)
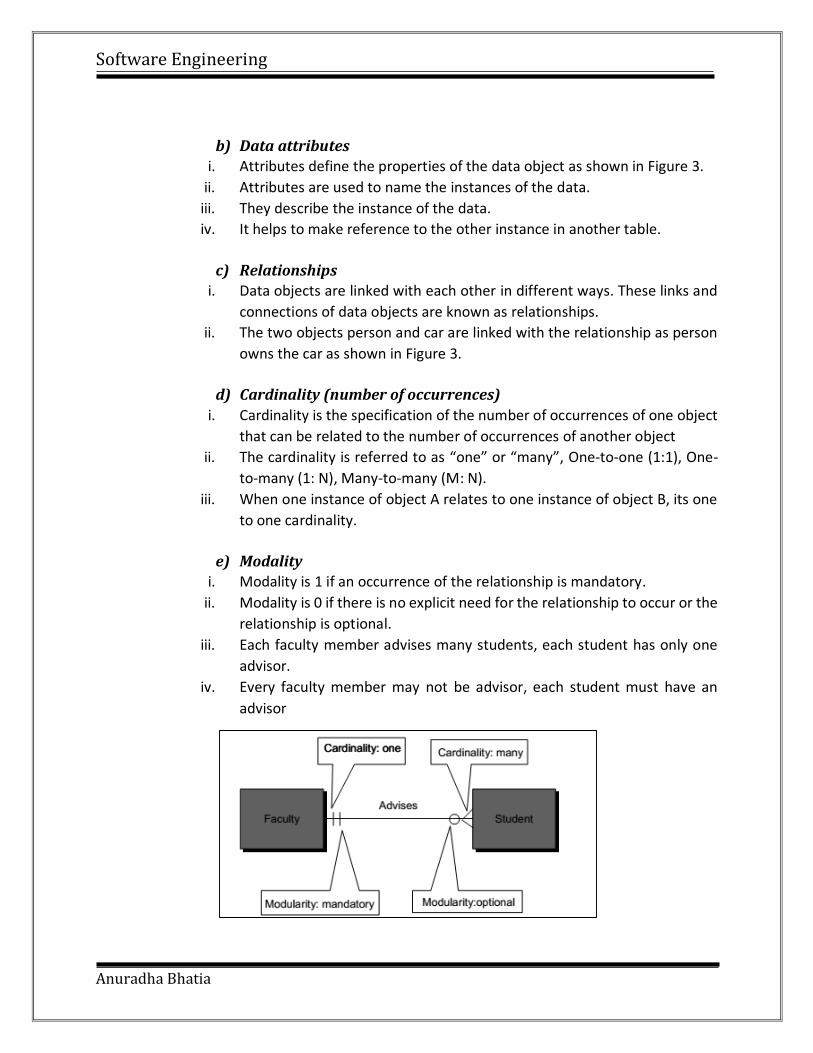
i. The Figure 6 the relations between the objects and their attributes.
ii. Data objects are the representation of the most composite information of
the system.
iii. Data object description incorporates the data object and all of its
attributes.
iv. Data objects are all related to each other.
Figure 6: Relation between the object and its attributes
Software Engineering
Anuradha Bhatia
b) Data attributes
i. Attributes define the properties of the data object as shown in Figure 3.
ii. Attributes are used to name the instances of the data.
iii. They describe the instance of the data.
iv. It helps to make reference to the other instance in another table.
c) Relationships
i. Data objects are linked with each other in different ways. These links and
connections of data objects are known as relationships.
ii. The two objects person and car are linked with the relationship as person
owns the car as shown in Figure 3.
d) Cardinality (number of occurrences)
i. Cardinality is the specification of the number of occurrences of one object
that can be related to the number of occurrences of another object
ii. The cardinality is referred to as “one” or “many”, One-to-one (1:1), One-
to-many (1: N), Many-to-many (M: N).
iii. When one instance of object A relates to one instance of object B, its one
to one cardinality.
e) Modality
i. Modality is 1 if an occurrence of the relationship is mandatory.
ii. Modality is 0 if there is no explicit need for the relationship to occur or the
relationship is optional.
iii. Each faculty member advises many students, each student has only one
advisor.
iv. Every faculty member may not be advisor, each student must have an
advisor
Software Engineering
Anuradha Bhatia
Figure 7: Cardinality and modularity.
2. Flow oriented modelling
This represents how the data objects are transformed as they move
through the system. The flow modelling provides the view of the system in the
graphical approach.
1. DFD
(Question: Explain the concept of DFD- 8 Marks)
i. The Data Flow Diagram is a graphical technique that depicts information
flow and the transforms that are applied as data move from input to
output.
ii. Can be used at any level of abstraction.
iii. A level 0 DFD, also called a fundamental system model or context diagrams
represents the entire software system as a single bubble with input and
output data indicated by incoming and outgoing arrows respectively
iv. A level 1 DFD might contain five or six bubbles with interconnecting
arrows; each of the processes represented at level 1 are sub functions of
the overall system depicted in the context model.
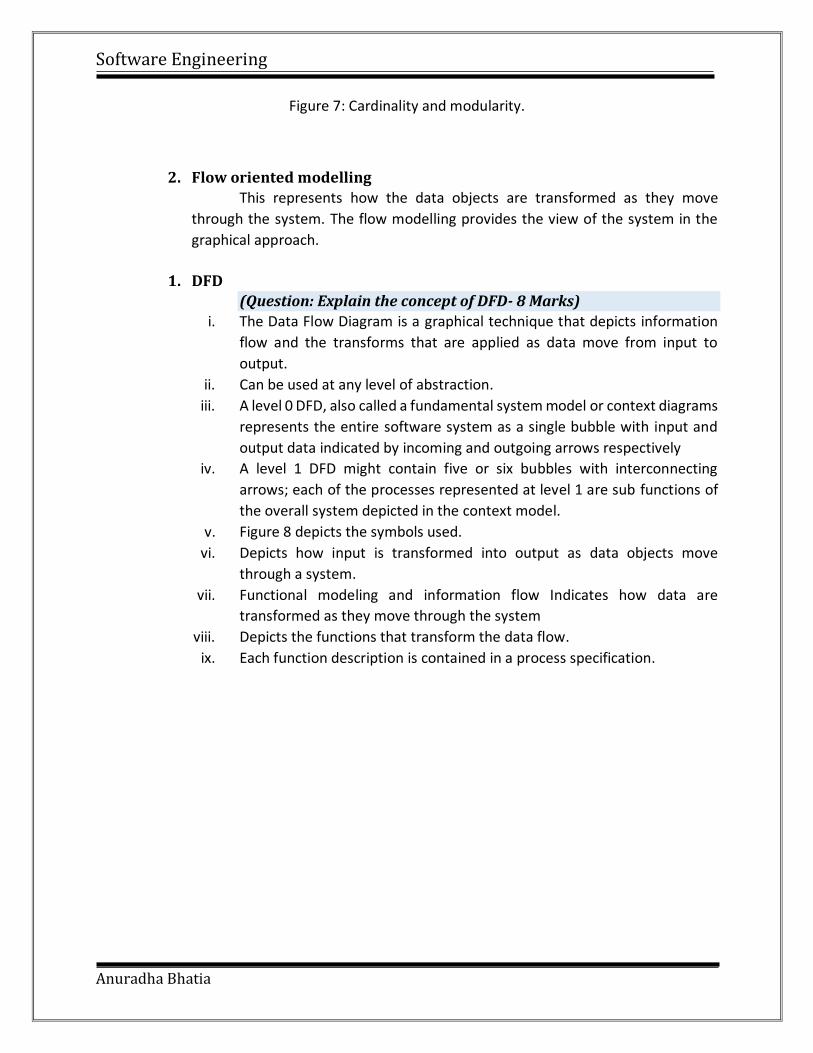
v. Figure 8 depicts the symbols used.
vi. Depicts how input is transformed into output as data objects move
through a system.
vii. Functional modeling and information flow Indicates how data are
transformed as they move through the system
viii. Depicts the functions that transform the data flow.
ix. Each function description is contained in a process specification.
Software Engineering
Anuradha Bhatia
Figure 8: Symbols of DFD
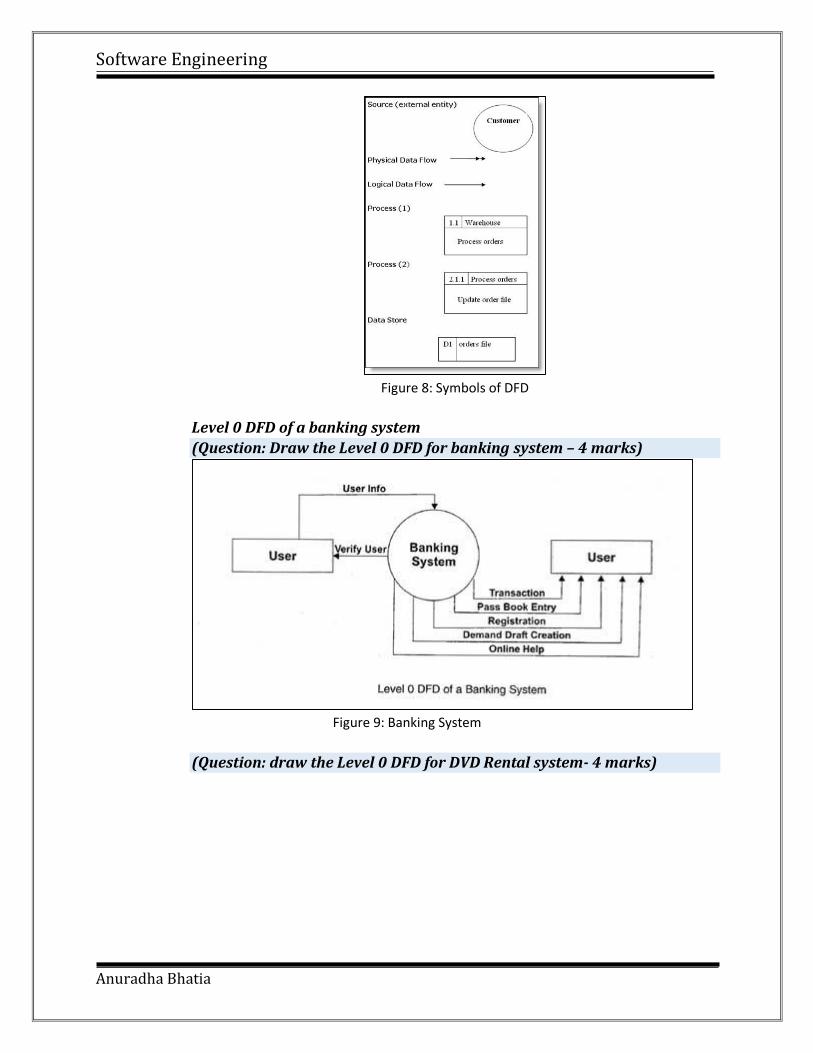
Level 0 DFD of a banking system
(Question: Draw the Level 0 DFD for banking system – 4 marks)
Figure 9: Banking System
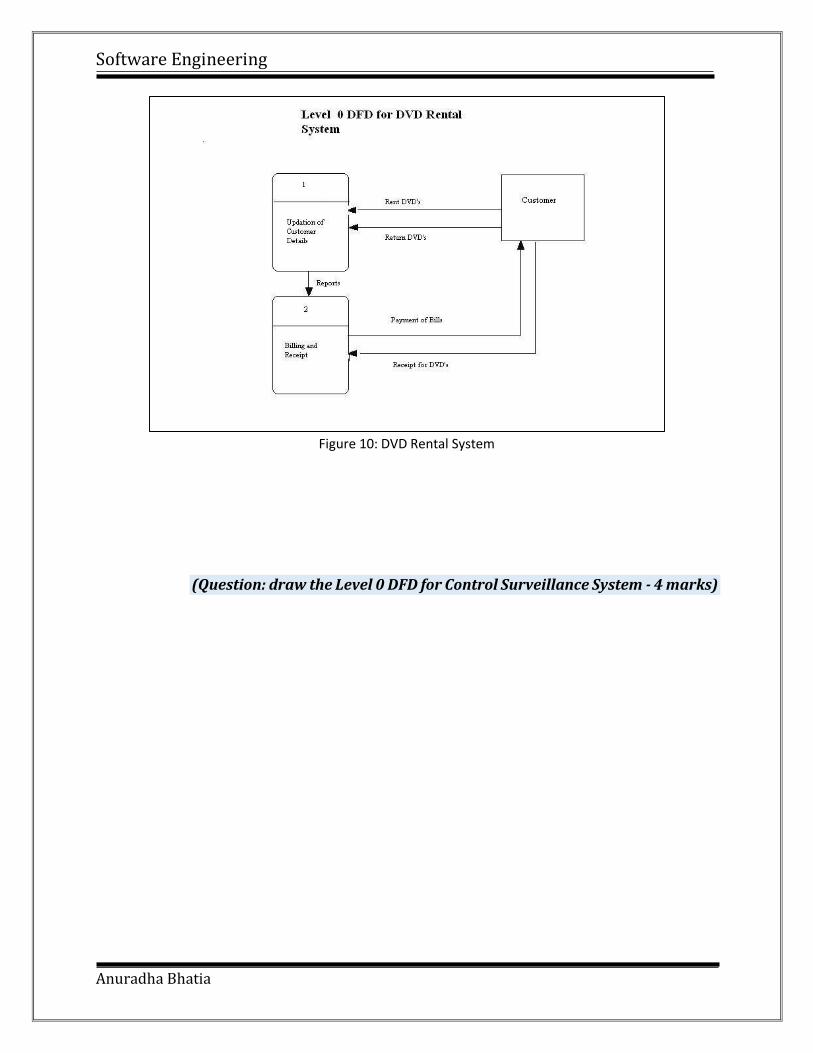
(Question: draw the Level 0 DFD for DVD Rental system- 4 marks)
Software Engineering
Anuradha Bhatia
Figure 10: DVD Rental System
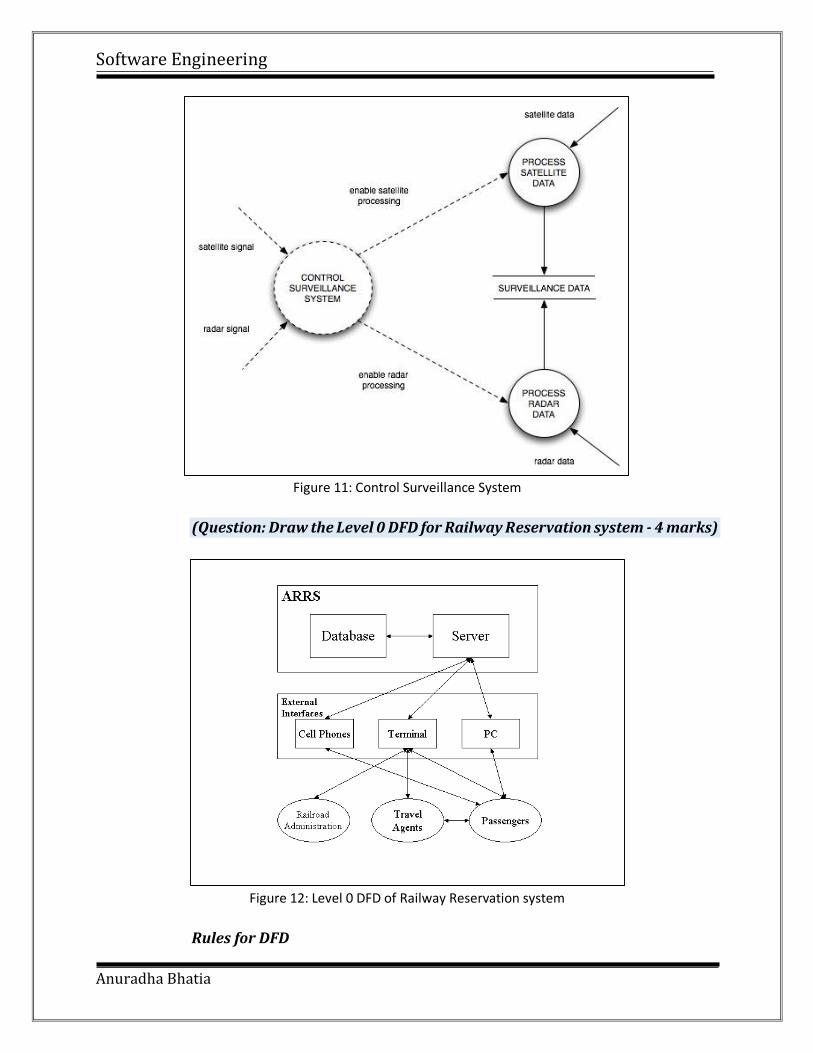
(Question: draw the Level 0 DFD for Control Surveillance System - 4 marks)
Software Engineering
Anuradha Bhatia
Figure 11: Control Surveillance System
(Question: Draw the Level 0 DFD for Railway Reservation system - 4 marks)
Figure 12: Level 0 DFD of Railway Reservation system
Rules for DFD
Software Engineering
Anuradha Bhatia
1. Rule 1 - Does each function have input and output? 2. Rule 2 - Does each function have all the information it needs in order to produce
its output? 3. Rule 3 - If not, then what information does it need and where will it get that
information from?
LEVEL 1 DFD
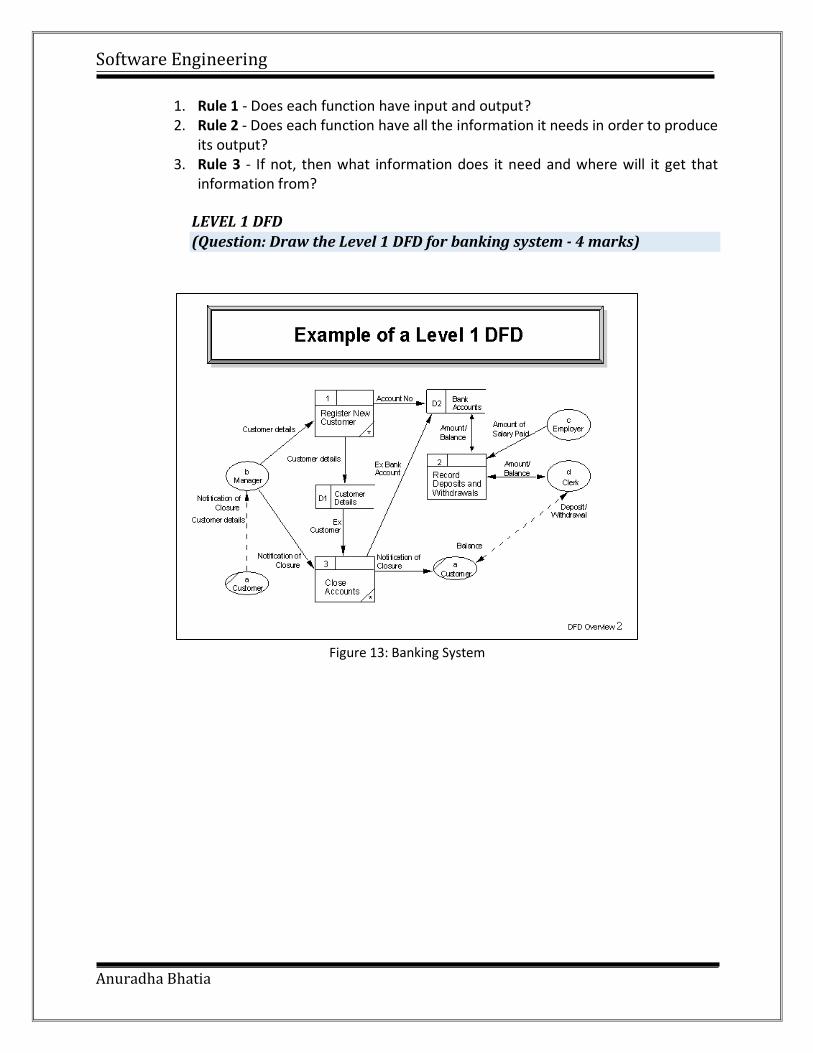
(Question: Draw the Level 1 DFD for banking system - 4 marks)
Figure 13: Banking System
Software Engineering
Anuradha Bhatia
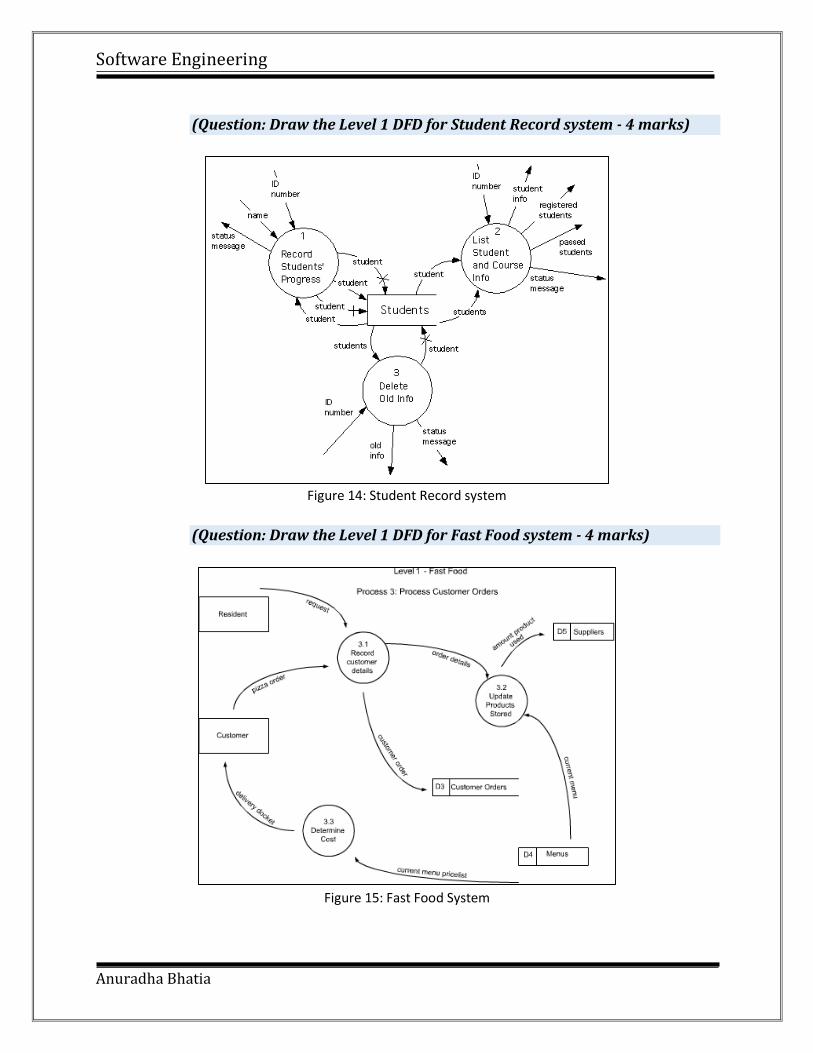
(Question: Draw the Level 1 DFD for Student Record system - 4 marks)
Figure 14: Student Record system
(Question: Draw the Level 1 DFD for Fast Food system - 4 marks)
Figure 15: Fast Food System
Software Engineering
Anuradha Bhatia
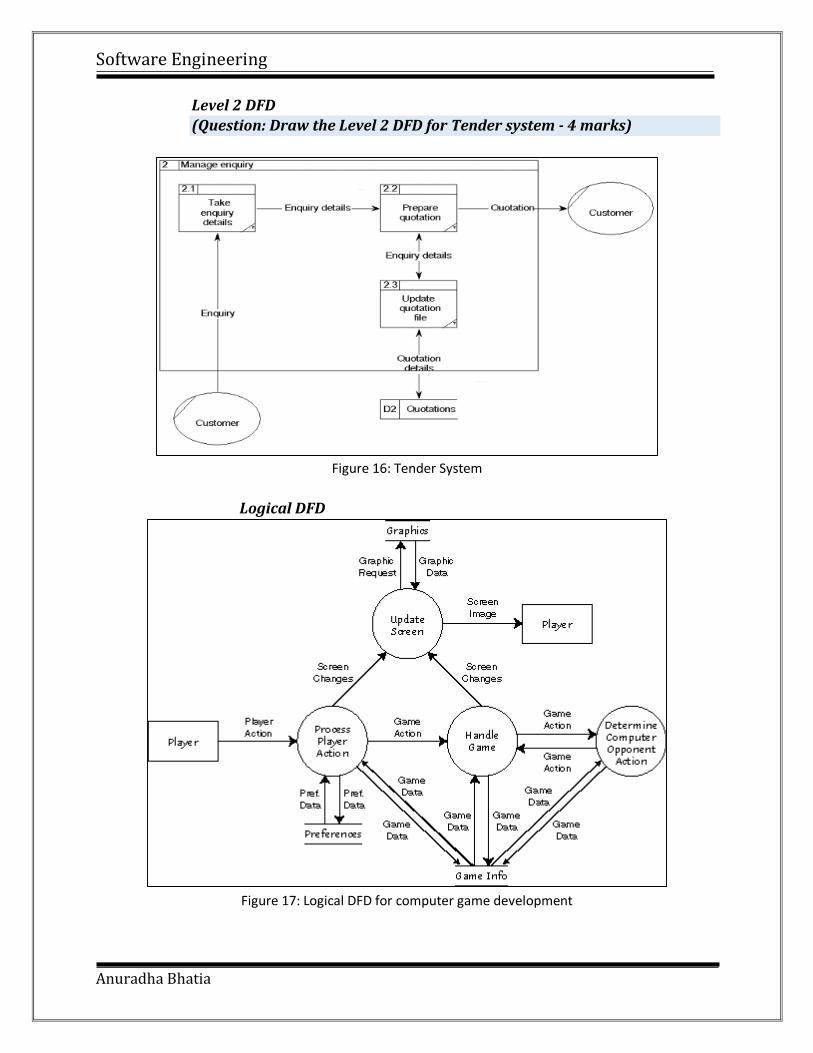
Level 2 DFD
(Question: Draw the Level 2 DFD for Tender system - 4 marks)
Figure 16: Tender System
Logical DFD
Figure 17: Logical DFD for computer game development
Software Engineering
Anuradha Bhatia
The difference between a logical and a physical data flow diagram, typically referred to as a
DFD, lies primarily in how the data is identified and represented.
i. A data flow diagram in general represents the movement of data within an
organization, concentrating on its information system.
ii. A logical DFD focuses more on the organization itself and identifies the data-
generating events that take place.
iii. A physical DFD instead is concerned with how that data is represented.
iv. Both types of DFDs are valuable tools for allowing users to monitor the flow of
information from its entry point to its movement throughout the organization,
and eventually to its exit point. Interpretation of the data along the way relies
partially on recognizing whether the information is processed sequentially or
in a parallel fashion.
v. The benefits of a logical DFD include easy communication between employees,
the potential for more stable systems, better understanding of the data and
the system by analysts, and an overall flexibility.
vi. It is also easy to maintain and to remove redundancies as they accumulate.
vii. A physical DFD, on the other hand, has a clear distinction between manual
and automated processes, provides more controls over the system, and
identifies temporary data stores.
2. Data Dictionary
(Question: Explain data dictionary with diagram - 4 marks)
i. Data dictionary is a set of meta-data which contains the definition and
representation of data elements.
ii. It gives a single point of reference of data repository of an organization. Data
dictionary lists all data elements but does not say anything about relationships
between data elements.
iii. A data dictionary or database dictionary is a file that defines the basic
organization of a database.
iv. A database dictionary contains a list of all files in the database, the number of
records in each file, and the names and types of each data field.
v. Most database management systems keep the data dictionary hidden from
users to prevent them from accidentally destroying its contents.
Software Engineering
Anuradha Bhatia
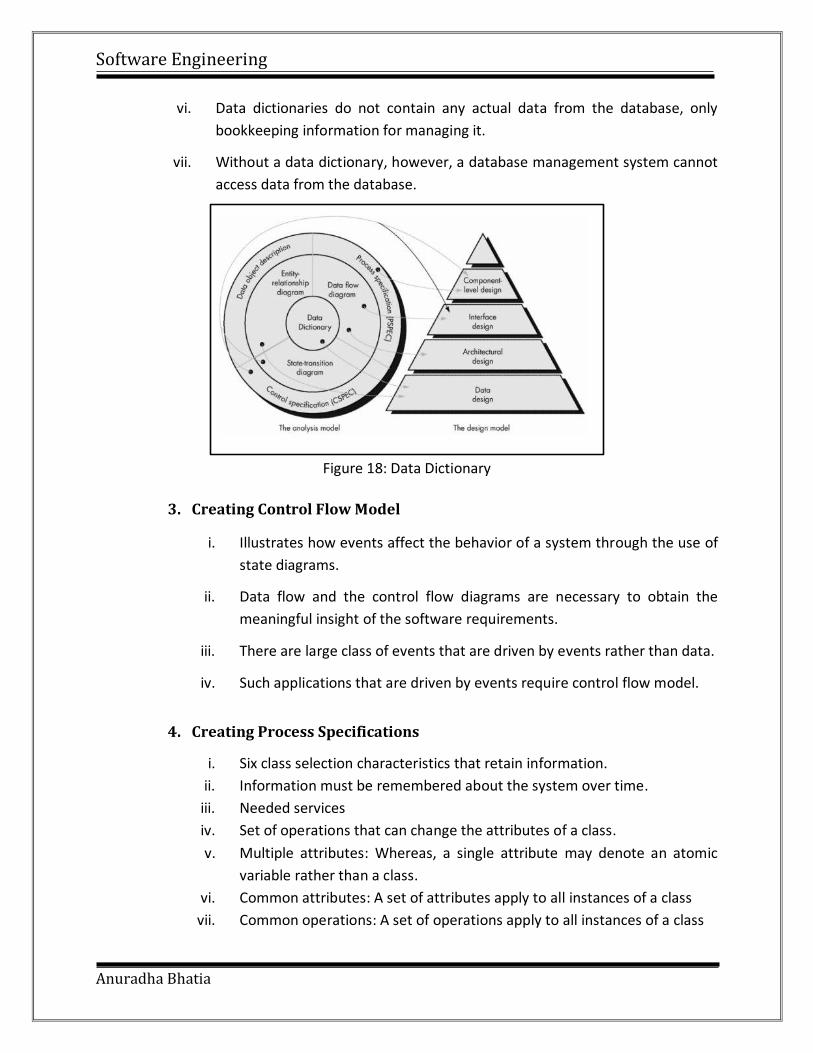
vi. Data dictionaries do not contain any actual data from the database, only
bookkeeping information for managing it.
vii. Without a data dictionary, however, a database management system cannot
access data from the database.
Figure 18: Data Dictionary
3. Creating Control Flow Model
i. Illustrates how events affect the behavior of a system through the use of
state diagrams.
ii. Data flow and the control flow diagrams are necessary to obtain the
meaningful insight of the software requirements.
iii. There are large class of events that are driven by events rather than data.
iv. Such applications that are driven by events require control flow model.
4. Creating Process Specifications
i. Six class selection characteristics that retain information.
ii. Information must be remembered about the system over time.
iii. Needed services
iv. Set of operations that can change the attributes of a class.
v. Multiple attributes: Whereas, a single attribute may denote an atomic
variable rather than a class.
vi. Common attributes: A set of attributes apply to all instances of a class
vii. Common operations: A set of operations apply to all instances of a class
Software Engineering
Anuradha Bhatia
viii. Essential requirements: Entities that produce or consume information.
3. Scenario Based modelling
1. Use case
i. “[Use-cases] are simply an aid to defining what exists outside the system (actors) and what should be performed by the system (use-cases).” Ivar Jacobson
ii. The concept is relatively easy to understand- describe a specific usage scenario in straightforward language from the point of view of a defined actor.
2. Writing Use-Cases
i. What should we write about? ii. Inception and elicitation provide us the information we need to begin
writing use cases. iii. How much should we write about it? iv. How detailed should we make our description? v. How should we organize the description?
Software Engineering
Anuradha Bhatia
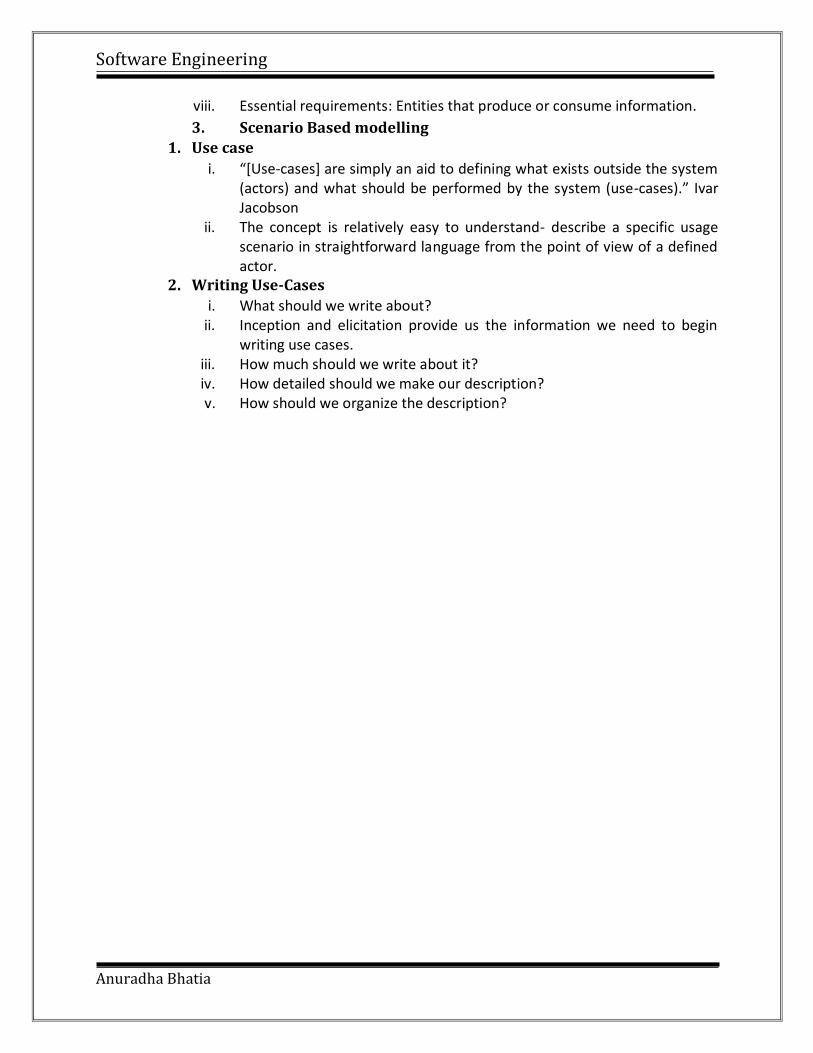
3. Developing an Activity Diagram
i. What are the main tasks or functions that are performed by the actor? ii. What system information will the actor acquire, produce or change?
iii. Will the actor have to inform the system about changes in the external environment?
iv. What information does the actor desire from the system? v. Does the actor wish to be informed about unexpected changes?
Figure 19: Activity Diagram
enter password
and user ID
select major funct ion
valid passwor ds/ ID
prompt for reent ry
invalid passwor ds/ ID
input t r ies r em ain
no input
t r ies r em ain
select surveillance
ot her f unct ions
m ay also be
select ed
t hum bnail views select a specif ic cam er a
select camera icon
prompt for
another v iew
select specif ic
camera - thumbnails
exit t his f unct ionsee anot her cam er a
view camera output
in labelled window
Software Engineering
Anuradha Bhatia
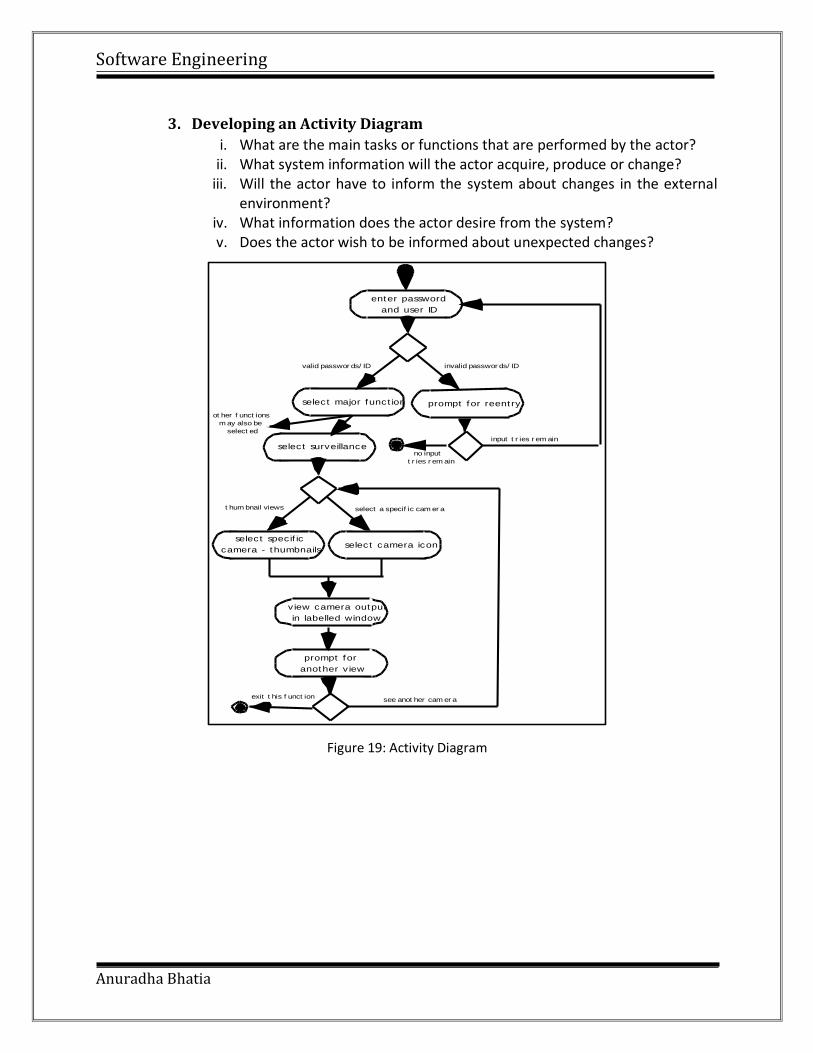
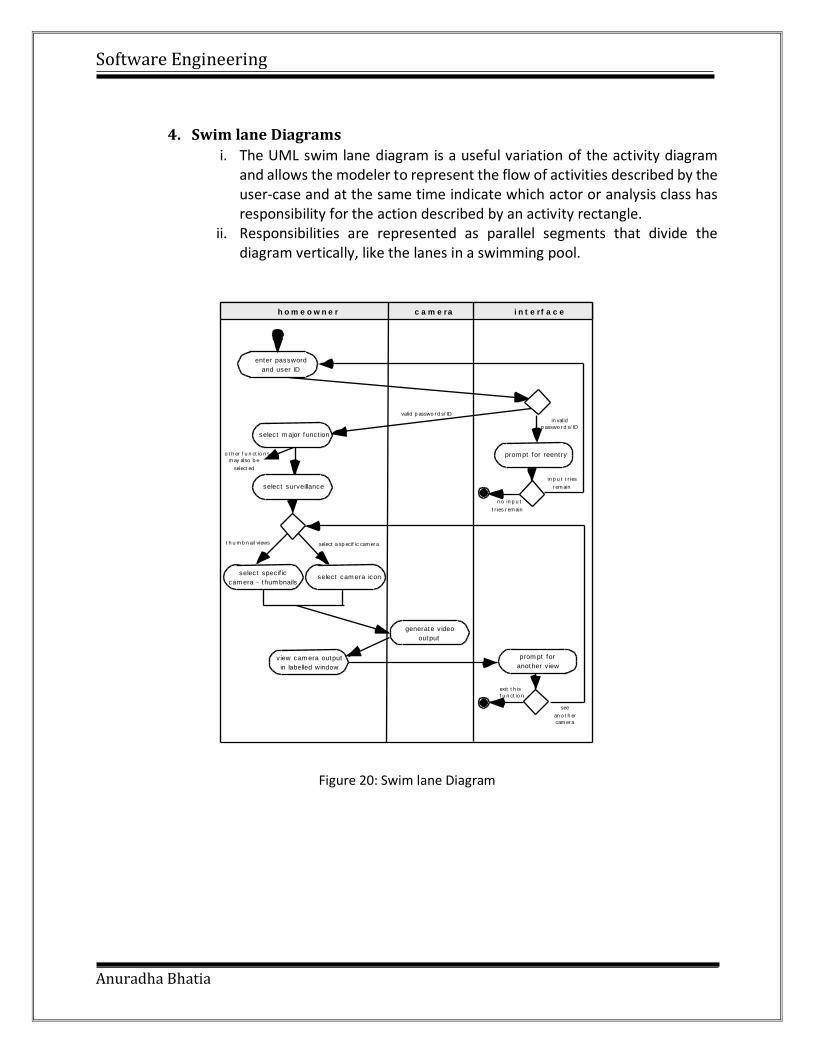
4. Swim lane Diagrams
i. The UML swim lane diagram is a useful variation of the activity diagram and allows the modeler to represent the flow of activities described by the user-case and at the same time indicate which actor or analysis class has responsibility for the action described by an activity rectangle.
ii. Responsibilities are represented as parallel segments that divide the diagram vertically, like the lanes in a swimming pool.
Figure 20: Swim lane Diagram
enter password
and user ID
select m ajor funct ion
valid p asswo r d s/ ID
prom pt for reent ry
in valid
p asswo r d s/ ID
in p u t t r ies
r em ain
n o in p u t
t r ies r em ain
select surveillance
o t h er f u n ct io n s
m ay also b e
select ed
t h u m b n ail views select a sp ecif ic cam er a
select cam era icon
generate v ideo
output
select specif ic
cam era - thum bnails
exit t h is
f u n ct io n
see
an o t h er
cam er a
h o m e o w n e r c a m e ra i n t e rf a c e
prom pt for
another v iew
view cam era output
in labelled window