Embed Size (px)
Citation preview
ISSN 1198-6727
ANALYSING ECOSYSTEM EFFECTS OF SELECTED
MARINE PROTECTED AREAS WITH ECOSPACE SPATIAL ECOSYSTEM MODELS
Fisheries Centre Research Reports
2008 Volume 16 Number 2

ISSN 1198-6727
Fisheries Centre
Research Reports 2008 Volume 16 Number 2
Analysing ecosystem effects of
selected marine protected areas
with Ecospace spatial
ecosystem models
Fisheries Centre, University of British Columbia, Canada

Analysing ecosystem effects of selected marine protected areas with Ecospace spatial ecosystem models by Will J.F. Le Quesne1*, Francisco Arreguín-Sánchez2, Mirtha Albañez-Lucero2, He-Qin Cheng3, Victor H. Cruz Escalona2, Georgi Daskalov4, Hui Ding5, Eduardo González Rodríguez2, Johanna J. (Sheila) Heymans6, Hong Jiang3, Diego Lercari7, Cesar López-Ferreira2, Jorge A. López-Rocha2, Steve Mackinson4, John K. Pinnegar4, Nicholas V.C. Polunin1, Jun Wu5, Hai-Gen Xu5 and Manuel J. Zetina-Rejón2 1 School of Marine Science and Technology, Newcastle University, Newcastle upon Tyne, UK * Contact email: [email protected] 2 Centro Interdisciplinario de Ciencias Marinas del IPN, La Paz, Mexico 3 State Key Laboratory of Estuarine & Coastal Research, East China Normal University, Shanghai, China 4 CEFAS Lowestoft Laboratory, Pakefield Road, Lowestoft, UK 5 Nanjing Institute of Environmental Sciences under State Environmental Protection, Administration of China, Nanjing, China 6 Scottish Association for Marine Science, Dunstaffnage Marine Laboratory, Oban, Scotland 7 UNDECIMAR, Facultad de Ciencias, Montevideo, Uruguay
Fisheries Centre Research Reports 16(2) 67 pages © published 2008 by The Fisheries Centre, University of British Columbia 2202 Main Mall Vancouver, B.C., Canada, V6T 1Z4 ISSN 1198-6727 °
Cite as: Le Quesne, W.J.F., Arreguín-Sánchez, F., Albañez-Lucero, M., Cheng, H., Cruz Escalona, V.H., Daskalov, G., Ding, H., González Rodríguez, E., Heymans, J.J., Jiang, H., Lercari, D., López-Ferreira, C., López-Rocha, J.A., Mackinson, S., Pinnegar, J.K., Polunin, N.V.C., Wu, J., Xu, H. and Zetina-Rejón, M.J. 2008. Analysing ecosystem effects of selected marine protected areas with Ecospace spatial ecosystem models. Fisheries Centre Research Reports 16(2). Fisheries Centre, University of British Columbia [ISSN 1198-6727]

Fisheries Centre Research Reports 16(2) 2008
ANALYSING ECOSYSTEM EFFECTS OF SELECTED MARINE PROTECTED AREAS WITH ECOSPACE SPATIAL ECOSYSTEM MODELS
by
Will J.F. Le Quesne, Francisco Arreguín-Sánchez, Mirtha Albañez-Lucero, He-Qin Cheng, Victor H. Cruz Escalona, Georgi Daskalov, Hui Ding, Eduardo González Rodríguez,
Johanna J. (Sheila) Heymans, Hong Jiang, Diego Lercari, Cesar López-Ferreira, Jorge A. López-Rocha, Steve Mackinson, John K. Pinnegar, Nicholas V.C. Polunin, Jun Wu,
Hai-Gen Xu and Manuel J. Zetina-Rejón
CONTENTS
Page
DIRECTOR’S FOREWORD ................................................................................................................................... 1 EXECUTIVE SUMMARY ......................................................................................................................................2 1. INTRODUCTION.............................................................................................................................................3 2. METHODS. ...................................................................................................................................................5
2.1 Ecopath, Ecosim and Ecospace......................................................................................................5 2.2 Study areas and simulations ........................................................................................................ 6 2.3 Analysis of results........................................................................................................................ 13
3. RESULTS .................................................................................................................................................... 16 3.1 Campeche Bank ........................................................................................................................... 16 3.2 East China Sea............................................................................................................................ 24 3.3 North Sea.....................................................................................................................................32 3.4 Northern Benguela Current........................................................................................................ 46 3.5 Northern Gulf of California .........................................................................................................54
4. DISCUSSION ...............................................................................................................................................59 4.1 Fishery effects of MPAs ...............................................................................................................59 4.2 Ecosystem effects of MPAs......................................................................................................... 60 4.3 Conclusions ................................................................................................................................ 64
ACKNOWLEDGEMENTS....................................................................................................................................65 REFERENCES ................................................................................................................................................ 66
A Research Report from the Fisheries Centre at UBC 67 pages © Fisheries Centre, University of British Columbia, 2008
FISHERIES CENTRE RESEARCH REPORTS ARE ABSTRACTED IN THE FAO AQUATIC SCIENCES AND FISHERIES ABSTRACTS (ASFA)
ISSN 1198-6727
LIST OF FIGURES Page FIGURE 1. Location of the study regions ....................................................................................................... .6
FIGURE 2. Campeche Bank: base map, fleet allocations and simulated MPAs ...............................................7
FIGURE 3. East China Sea: base map, fleet allocations and simulated MPAs ................................................ 8
FIGURE 4. North Sea: base map, fleet allocations and simulated MPAs.......................................................10
FIGURE 5. Northern Benguela Current: base map, fleet allocations and simulated MPAs........................... 11
FIGURE 6. Northern Gulf of California: base map, fleet allocations and simulated MPAs ...........................12
FIGURE 7. Campeche Bank: MPA 1, change in biomass per group across the whole system........................ 17
FIGURE 8. Campeche Bank: MPA 1, change in catch by groups and fleets ...................................................18
FIGURE 9. Campeche Bank: MPA 2, change in biomass per group across the whole system .......................19
FIGURE 10. Campeche Bank: MPA 2, change in catch by groups and fleets ................................................ 20
FIGURE 11. Campeche Bank: MPA 3, change in biomass per group across the whole system ......................21
FIGURE 12. Campeche Bank: MPA 3, change in catch by groups and fleets ................................................ 22
FIGURE 13. Campeche Bank: ecosystem metrics of MPA effects ................................................................. 23
FIGURE 14. East China Sea: Inshore Closed Line, change in biomass per group across whole system ....... 25
FIGURE 15. East China Sea: Inshore Closed Line, change in catch by groups and fleets ............................. 26
FIGURE 16. East China Sea: FPAs, change in biomass per group across the whole system ..........................27
FIGURE 17. East China Sea: FPAs, change in catch by groups and fleets..................................................... 28
FIGURE 18. East China Sea: Summer Closure, change in biomass per group across the whole system....... 29
FIGURE 19. East China Sea: Summer Closure, change in catch by groups and fleets .................................. 30
FIGURE 20. East China Sea: ecosystem metrics of MPA effects....................................................................31
FIGURE 21. North Sea: Cod Box, change in biomass per group across the whole system............................ 33
FIGURE 22. North Sea: Cod Box, change in biomass per group inside and outside the MPA..................... 34
FIGURE 23. North Sea: Cod Box, change in catch per group ....................................................................... 35
FIGURE 24. North Sea: Cod Box, change in catch and profit per fleet ......................................................... 36
FIGURE 25. North Sea: Sandeel Box, change in biomass per group across the whole system ......................37
FIGURE 26. North Sea: Sandeel Box, change in biomass per group inside and outside the MPA .............. 38
FIGURE 27. North Sea: Sandeel Box, change in catch per group ................................................................. 39
FIGURE 28. North Sea: Sandeel Box, change in catch and profit per fleet................................................... 40
FIGURE 29. North Sea: Plaice Box, change in biomass per group across the whole system .........................41
FIGURE 30. North Sea: Plaice Box, change in biomass per group inside and outside the MPA .................. 42
FIGURE 31. North Sea: Plaice Box, change in catch per group..................................................................... 43
FIGURE 32. North Sea: Plaice Box, change in catch and profit per fleet ...................................................... 44
FIGURE 33. North Sea: ecosystem metrics of MPA effects........................................................................... 45
FIGURE 34. Northern Benguela Current: Juvenile Hake MPA, change in biomass per group across the whole system and inside and outside the MPA ..................................................................... 47
FIGURE 35. Northern Benguela Current: Juvenile Hake MPA, change in catch by group and fleet ............ 48
FIGURE 36. Northern Benguela Current: Habitat MPA, change in biomass per group across the whole system and inside and outside the MPA...................................................................................... 49
FIGURE 37. Northern Benguela Current: Habitat MPA, change in catch by group and fleet....................... 50
FIGURE 38. Northern Benguela Current: Central MPA, change in biomass per group across the whole system and inside and outside the MPA....................................................................................... 51
FIGURE 39. Northern Benguela Current: Central MPA, change in catch by group and fleet........................52
FIGURE 40. Northern Benguela Current: ecosystem metrics of MPA effects ...............................................53
FIGURE 41. Northern Gulf of California: Biosphere Reserve, change in biomass and catch per group ........55
FIGURE 42. Northern Gulf of California: Biosphere Reserve and Vaquita Refuge, change in biomass and catch per group.............................................................................................................................56
FIGURE 43. Northern Gulf of California: Shallow Water Closure, change in biomass and catch per group ......................................................................................................................................57
FIGURE 44. Northern Gulf of California: ecosystem metrics of MPA effects............................................... 58
FIGURE 45. Change in total biomass and catch against MPA size for all simulations .................................. 61
FIGURE 46. Qualitative response of indicators to MPA establishment for all MPA simulations................. 62
FIGURE 47. Change in catch and biomass of focal species for MPAs designed for 1 or 2 specific focal species................................................................................................................................. 63

Analysing Ecosystem Effects of Selected MPAs, Le Quesne et al. 1
DIRECTOR’S FOREWORD
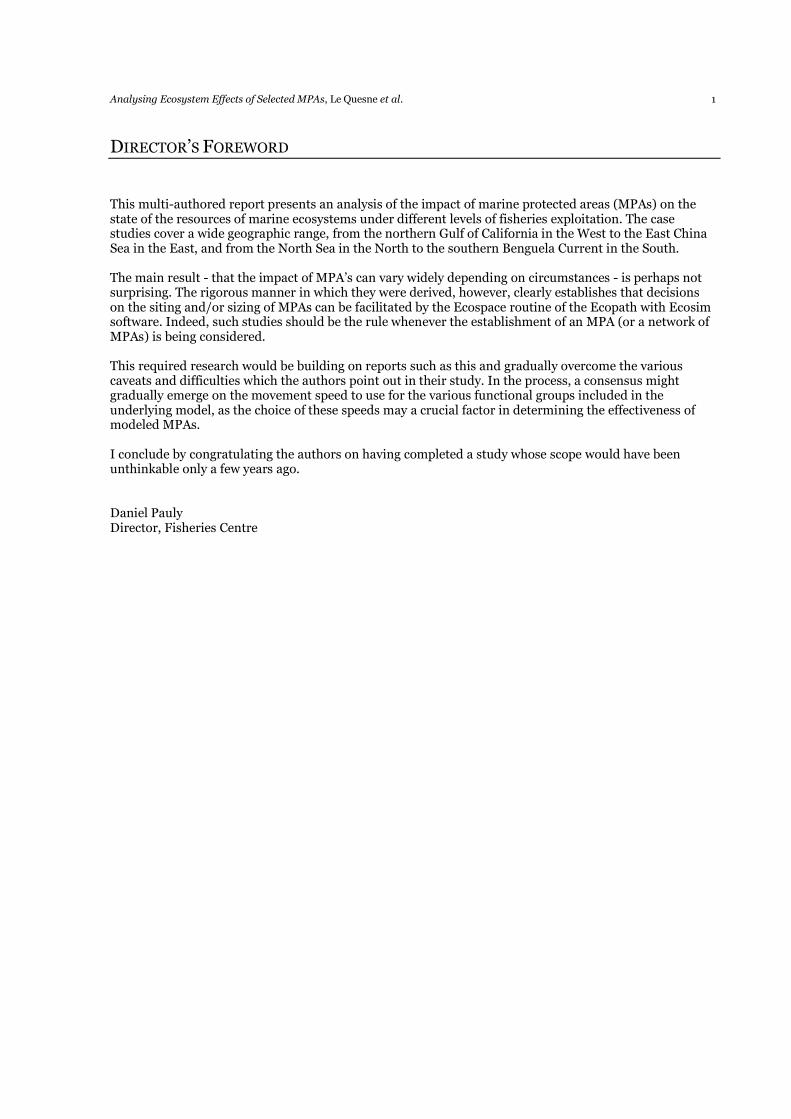
This multi-authored report presents an analysis of the impact of marine protected areas (MPAs) on the state of the resources of marine ecosystems under different levels of fisheries exploitation. The case studies cover a wide geographic range, from the northern Gulf of California in the West to the East China Sea in the East, and from the North Sea in the North to the southern Benguela Current in the South. The main result - that the impact of MPA’s can vary widely depending on circumstances - is perhaps not surprising. The rigorous manner in which they were derived, however, clearly establishes that decisions on the siting and/or sizing of MPAs can be facilitated by the Ecospace routine of the Ecopath with Ecosim software. Indeed, such studies should be the rule whenever the establishment of an MPA (or a network of MPAs) is being considered. This required research would be building on reports such as this and gradually overcome the various caveats and difficulties which the authors point out in their study. In the process, a consensus might gradually emerge on the movement speed to use for the various functional groups included in the underlying model, as the choice of these speeds may a crucial factor in determining the effectiveness of modeled MPAs. I conclude by congratulating the authors on having completed a study whose scope would have been unthinkable only a few years ago. Daniel Pauly Director, Fisheries Centre
2 Analysing Ecosystem Effects of Selected MPAs, Le Quesne et al.
EXECUTIVE SUMMARY
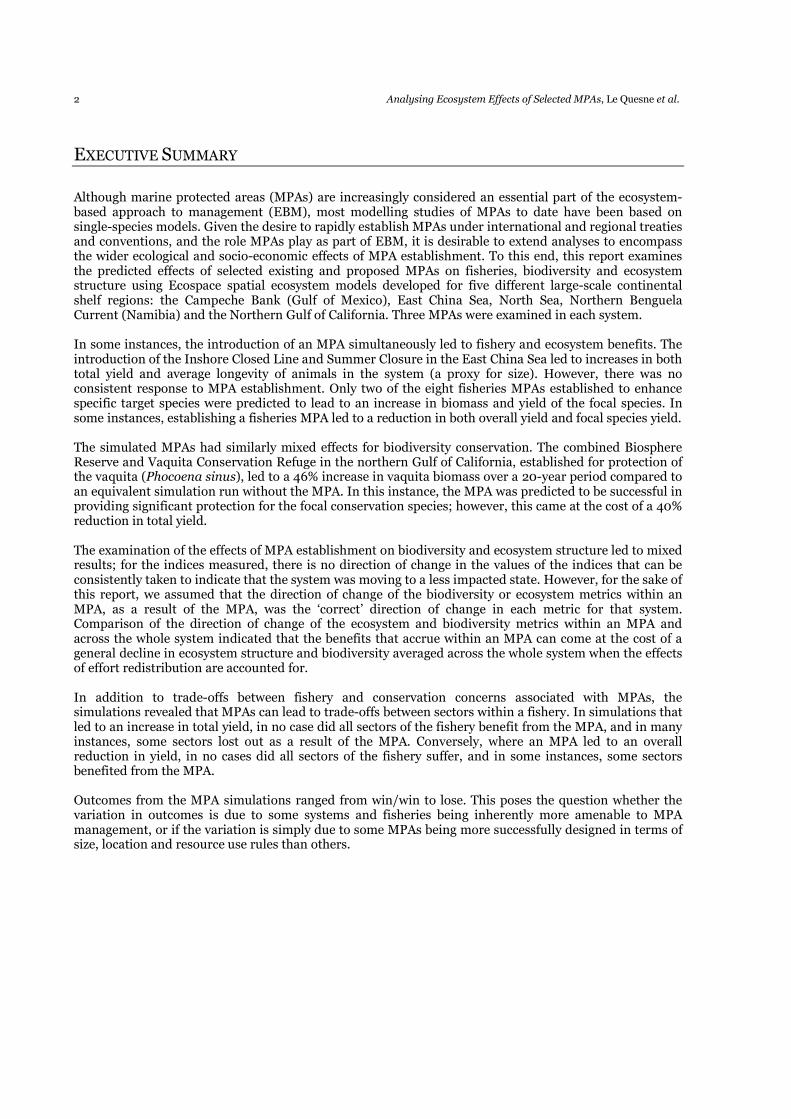
Although marine protected areas (MPAs) are increasingly considered an essential part of the ecosystem-based approach to management (EBM), most modelling studies of MPAs to date have been based on single-species models. Given the desire to rapidly establish MPAs under international and regional treaties and conventions, and the role MPAs play as part of EBM, it is desirable to extend analyses to encompass the wider ecological and socio-economic effects of MPA establishment. To this end, this report examines the predicted effects of selected existing and proposed MPAs on fisheries, biodiversity and ecosystem structure using Ecospace spatial ecosystem models developed for five different large-scale continental shelf regions: the Campeche Bank (Gulf of Mexico), East China Sea, North Sea, Northern Benguela Current (Namibia) and the Northern Gulf of California. Three MPAs were examined in each system. In some instances, the introduction of an MPA simultaneously led to fishery and ecosystem benefits. The introduction of the Inshore Closed Line and Summer Closure in the East China Sea led to increases in both total yield and average longevity of animals in the system (a proxy for size). However, there was no consistent response to MPA establishment. Only two of the eight fisheries MPAs established to enhance specific target species were predicted to lead to an increase in biomass and yield of the focal species. In some instances, establishing a fisheries MPA led to a reduction in both overall yield and focal species yield. The simulated MPAs had similarly mixed effects for biodiversity conservation. The combined Biosphere Reserve and Vaquita Conservation Refuge in the northern Gulf of California, established for protection of the vaquita (Phocoena sinus), led to a 46% increase in vaquita biomass over a 20-year period compared to an equivalent simulation run without the MPA. In this instance, the MPA was predicted to be successful in providing significant protection for the focal conservation species; however, this came at the cost of a 40% reduction in total yield. The examination of the effects of MPA establishment on biodiversity and ecosystem structure led to mixed results; for the indices measured, there is no direction of change in the values of the indices that can be consistently taken to indicate that the system was moving to a less impacted state. However, for the sake of this report, we assumed that the direction of change of the biodiversity or ecosystem metrics within an MPA, as a result of the MPA, was the ‘correct’ direction of change in each metric for that system. Comparison of the direction of change of the ecosystem and biodiversity metrics within an MPA and across the whole system indicated that the benefits that accrue within an MPA can come at the cost of a general decline in ecosystem structure and biodiversity averaged across the whole system when the effects of effort redistribution are accounted for. In addition to trade-offs between fishery and conservation concerns associated with MPAs, the simulations revealed that MPAs can lead to trade-offs between sectors within a fishery. In simulations that led to an increase in total yield, in no case did all sectors of the fishery benefit from the MPA, and in many instances, some sectors lost out as a result of the MPA. Conversely, where an MPA led to an overall reduction in yield, in no cases did all sectors of the fishery suffer, and in some instances, some sectors benefited from the MPA. Outcomes from the MPA simulations ranged from win/win to lose. This poses the question whether the variation in outcomes is due to some systems and fisheries being inherently more amenable to MPA management, or if the variation is simply due to some MPAs being more successfully designed in terms of size, location and resource use rules than others.
Analysing Ecosystem Effects of Selected MPAs, Le Quesne et al. 3
1. INTRODUCTION
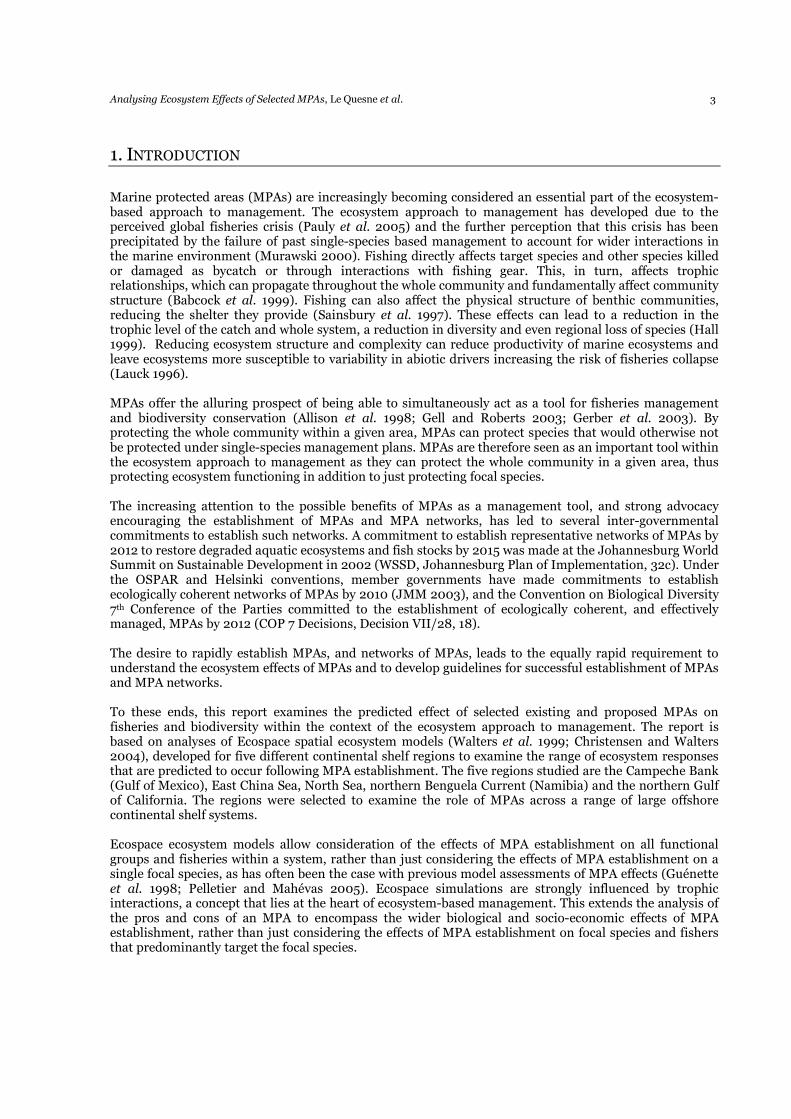
Marine protected areas (MPAs) are increasingly becoming considered an essential part of the ecosystem-based approach to management. The ecosystem approach to management has developed due to the perceived global fisheries crisis (Pauly et al. 2005) and the further perception that this crisis has been precipitated by the failure of past single-species based management to account for wider interactions in the marine environment (Murawski 2000). Fishing directly affects target species and other species killed or damaged as bycatch or through interactions with fishing gear. This, in turn, affects trophic relationships, which can propagate throughout the whole community and fundamentally affect community structure (Babcock et al. 1999). Fishing can also affect the physical structure of benthic communities, reducing the shelter they provide (Sainsbury et al. 1997). These effects can lead to a reduction in the trophic level of the catch and whole system, a reduction in diversity and even regional loss of species (Hall 1999). Reducing ecosystem structure and complexity can reduce productivity of marine ecosystems and leave ecosystems more susceptible to variability in abiotic drivers increasing the risk of fisheries collapse (Lauck 1996). MPAs offer the alluring prospect of being able to simultaneously act as a tool for fisheries management and biodiversity conservation (Allison et al. 1998; Gell and Roberts 2003; Gerber et al. 2003). By protecting the whole community within a given area, MPAs can protect species that would otherwise not be protected under single-species management plans. MPAs are therefore seen as an important tool within the ecosystem approach to management as they can protect the whole community in a given area, thus protecting ecosystem functioning in addition to just protecting focal species. The increasing attention to the possible benefits of MPAs as a management tool, and strong advocacy encouraging the establishment of MPAs and MPA networks, has led to several inter-governmental commitments to establish such networks. A commitment to establish representative networks of MPAs by 2012 to restore degraded aquatic ecosystems and fish stocks by 2015 was made at the Johannesburg World Summit on Sustainable Development in 2002 (WSSD, Johannesburg Plan of Implementation, 32c). Under the OSPAR and Helsinki conventions, member governments have made commitments to establish ecologically coherent networks of MPAs by 2010 (JMM 2003), and the Convention on Biological Diversity 7th Conference of the Parties committed to the establishment of ecologically coherent, and effectively managed, MPAs by 2012 (COP 7 Decisions, Decision VII/28, 18). The desire to rapidly establish MPAs, and networks of MPAs, leads to the equally rapid requirement to understand the ecosystem effects of MPAs and to develop guidelines for successful establishment of MPAs and MPA networks. To these ends, this report examines the predicted effect of selected existing and proposed MPAs on fisheries and biodiversity within the context of the ecosystem approach to management. The report is based on analyses of Ecospace spatial ecosystem models (Walters et al. 1999; Christensen and Walters 2004), developed for five different continental shelf regions to examine the range of ecosystem responses that are predicted to occur following MPA establishment. The five regions studied are the Campeche Bank (Gulf of Mexico), East China Sea, North Sea, northern Benguela Current (Namibia) and the northern Gulf of California. The regions were selected to examine the role of MPAs across a range of large offshore continental shelf systems. Ecospace ecosystem models allow consideration of the effects of MPA establishment on all functional groups and fisheries within a system, rather than just considering the effects of MPA establishment on a single focal species, as has often been the case with previous model assessments of MPA effects (Guénette et al. 1998; Pelletier and Mahévas 2005). Ecospace simulations are strongly influenced by trophic interactions, a concept that lies at the heart of ecosystem-based management. This extends the analysis of the pros and cons of an MPA to encompass the wider biological and socio-economic effects of MPA establishment, rather than just considering the effects of MPA establishment on focal species and fishers that predominantly target the focal species.
4 Analysing Ecosystem Effects of Selected MPAs, Le Quesne et al.
A caveat: no model can provide a perfect representation of the modelled system. To understand the reliability of a model, it is essential to test, and validate, it against empirical data. Due to the recent development of the Ecospace modelling framework, validation of Ecospace models has yet to occur, although efforts to do so are commencing. The outputs of Ecospace models must therefore, at present, be treated with caution, and more emphasis should be placed on qualitative results than quantitative results. With this in mind, the analyses in this report were conducted in comparative mode: the outputs of simulations including an MPA were compared with an otherwise identical simulation without the inclusion of the MPA. The results should be viewed as predictions of the effect of the simulated MPAs assuming the ecosystems function according to how the interactions are formulated within the specific implementations of the Ecospace models used within this report. This report examines the effects of selected simulated MPAs on fishery yield, profitability in different sectors of the fisheries, and ecosystem structure. The effects on ecosystem structure are examined in terms of the total biomass, average trophic level of the community and catch, biodiversity (measured with Kempton’s biomass diversity index, and Shannon’s diversity index [see section 2.3.2 Ecosystem metrics]) and ecosystem maturity (measured by average longevity [see section 2.3.2 Ecosystem metrics]).
Analysing Ecosystem Effects of Selected MPAs, Le Quesne et al. 5
2. METHODS
2.1 ECOPATH, ECOSIM AND ECOSPACE
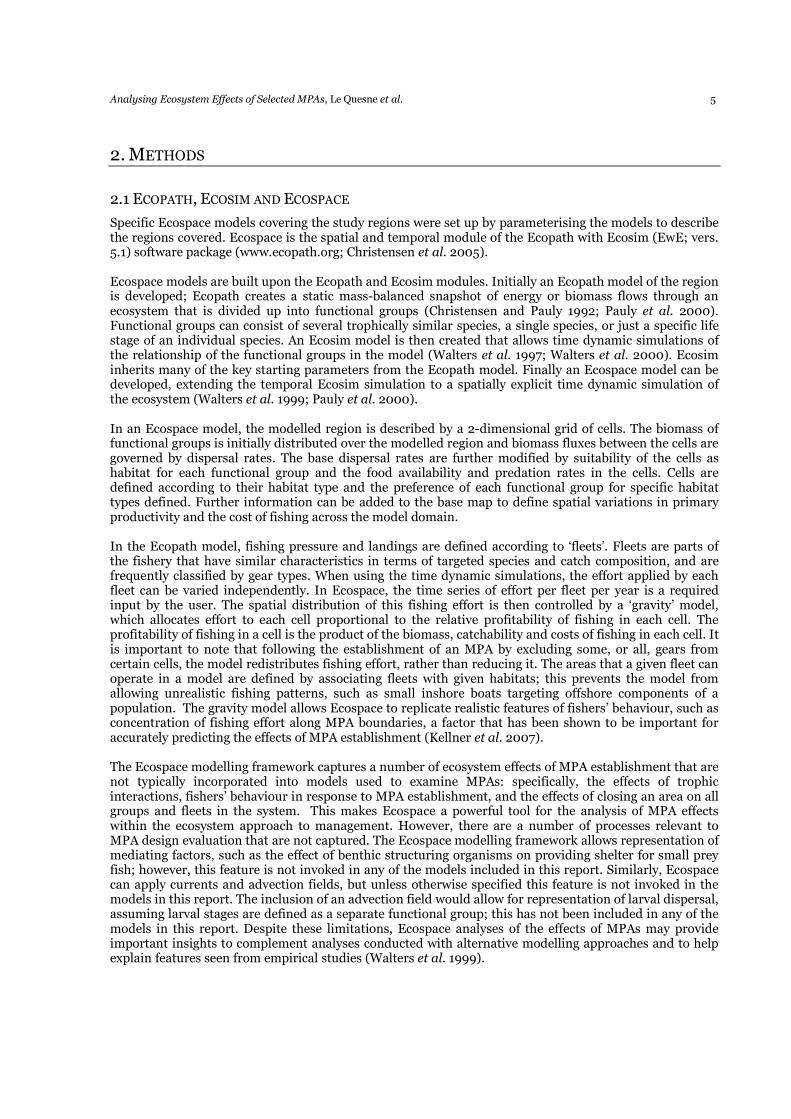
Specific Ecospace models covering the study regions were set up by parameterising the models to describe the regions covered. Ecospace is the spatial and temporal module of the Ecopath with Ecosim (EwE; vers. 5.1) software package (www.ecopath.org; Christensen et al. 2005). Ecospace models are built upon the Ecopath and Ecosim modules. Initially an Ecopath model of the region is developed; Ecopath creates a static mass-balanced snapshot of energy or biomass flows through an ecosystem that is divided up into functional groups (Christensen and Pauly 1992; Pauly et al. 2000). Functional groups can consist of several trophically similar species, a single species, or just a specific life stage of an individual species. An Ecosim model is then created that allows time dynamic simulations of the relationship of the functional groups in the model (Walters et al. 1997; Walters et al. 2000). Ecosim inherits many of the key starting parameters from the Ecopath model. Finally an Ecospace model can be developed, extending the temporal Ecosim simulation to a spatially explicit time dynamic simulation of the ecosystem (Walters et al. 1999; Pauly et al. 2000). In an Ecospace model, the modelled region is described by a 2-dimensional grid of cells. The biomass of functional groups is initially distributed over the modelled region and biomass fluxes between the cells are governed by dispersal rates. The base dispersal rates are further modified by suitability of the cells as habitat for each functional group and the food availability and predation rates in the cells. Cells are defined according to their habitat type and the preference of each functional group for specific habitat types defined. Further information can be added to the base map to define spatial variations in primary productivity and the cost of fishing across the model domain. In the Ecopath model, fishing pressure and landings are defined according to ‘fleets’. Fleets are parts of the fishery that have similar characteristics in terms of targeted species and catch composition, and are frequently classified by gear types. When using the time dynamic simulations, the effort applied by each fleet can be varied independently. In Ecospace, the time series of effort per fleet per year is a required input by the user. The spatial distribution of this fishing effort is then controlled by a ‘gravity’ model, which allocates effort to each cell proportional to the relative profitability of fishing in each cell. The profitability of fishing in a cell is the product of the biomass, catchability and costs of fishing in each cell. It is important to note that following the establishment of an MPA by excluding some, or all, gears from certain cells, the model redistributes fishing effort, rather than reducing it. The areas that a given fleet can operate in a model are defined by associating fleets with given habitats; this prevents the model from allowing unrealistic fishing patterns, such as small inshore boats targeting offshore components of a population. The gravity model allows Ecospace to replicate realistic features of fishers’ behaviour, such as concentration of fishing effort along MPA boundaries, a factor that has been shown to be important for accurately predicting the effects of MPA establishment (Kellner et al. 2007). The Ecospace modelling framework captures a number of ecosystem effects of MPA establishment that are not typically incorporated into models used to examine MPAs: specifically, the effects of trophic interactions, fishers’ behaviour in response to MPA establishment, and the effects of closing an area on all groups and fleets in the system. This makes Ecospace a powerful tool for the analysis of MPA effects within the ecosystem approach to management. However, there are a number of processes relevant to MPA design evaluation that are not captured. The Ecospace modelling framework allows representation of mediating factors, such as the effect of benthic structuring organisms on providing shelter for small prey fish; however, this feature is not invoked in any of the models included in this report. Similarly, Ecospace can apply currents and advection fields, but unless otherwise specified this feature is not invoked in the models in this report. The inclusion of an advection field would allow for representation of larval dispersal, assuming larval stages are defined as a separate functional group; this has not been included in any of the models in this report. Despite these limitations, Ecospace analyses of the effects of MPAs may provide important insights to complement analyses conducted with alternative modelling approaches and to help explain features seen from empirical studies (Walters et al. 1999).
6 Analysing Ecosystem Effects of Selected MPAs, Le Quesne et al.
East China Sea
Northern Benguela Current
Northern Gulf of California
Campeche Bank
North Sea
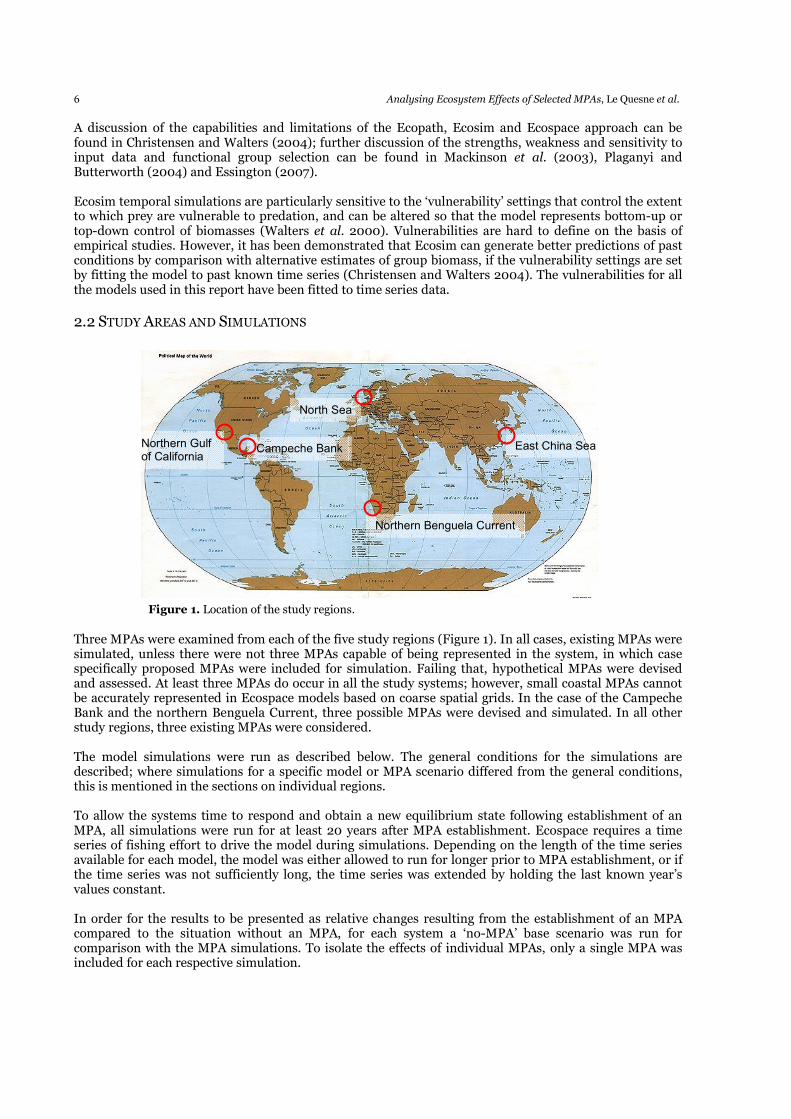
Figure 1. Location of the study regions.
A discussion of the capabilities and limitations of the Ecopath, Ecosim and Ecospace approach can be found in Christensen and Walters (2004); further discussion of the strengths, weakness and sensitivity to input data and functional group selection can be found in Mackinson et al. (2003), Plaganyi and Butterworth (2004) and Essington (2007). Ecosim temporal simulations are particularly sensitive to the ‘vulnerability’ settings that control the extent to which prey are vulnerable to predation, and can be altered so that the model represents bottom-up or top-down control of biomasses (Walters et al. 2000). Vulnerabilities are hard to define on the basis of empirical studies. However, it has been demonstrated that Ecosim can generate better predictions of past conditions by comparison with alternative estimates of group biomass, if the vulnerability settings are set by fitting the model to past known time series (Christensen and Walters 2004). The vulnerabilities for all the models used in this report have been fitted to time series data.
2.2 STUDY AREAS AND SIMULATIONS
Three MPAs were examined from each of the five study regions (Figure 1). In all cases, existing MPAs were simulated, unless there were not three MPAs capable of being represented in the system, in which case specifically proposed MPAs were included for simulation. Failing that, hypothetical MPAs were devised and assessed. At least three MPAs do occur in all the study systems; however, small coastal MPAs cannot be accurately represented in Ecospace models based on coarse spatial grids. In the case of the Campeche Bank and the northern Benguela Current, three possible MPAs were devised and simulated. In all other study regions, three existing MPAs were considered. The model simulations were run as described below. The general conditions for the simulations are described; where simulations for a specific model or MPA scenario differed from the general conditions, this is mentioned in the sections on individual regions. To allow the systems time to respond and obtain a new equilibrium state following establishment of an MPA, all simulations were run for at least 20 years after MPA establishment. Ecospace requires a time series of fishing effort to drive the model during simulations. Depending on the length of the time series available for each model, the model was either allowed to run for longer prior to MPA establishment, or if the time series was not sufficiently long, the time series was extended by holding the last known year’s values constant. In order for the results to be presented as relative changes resulting from the establishment of an MPA compared to the situation without an MPA, for each system a ‘no-MPA’ base scenario was run for comparison with the MPA simulations. To isolate the effects of individual MPAs, only a single MPA was included for each respective simulation.
Analysing Ecosystem Effects of Selected MPAs, Le Quesne et al. 7
2.2.1 Campeche Bank
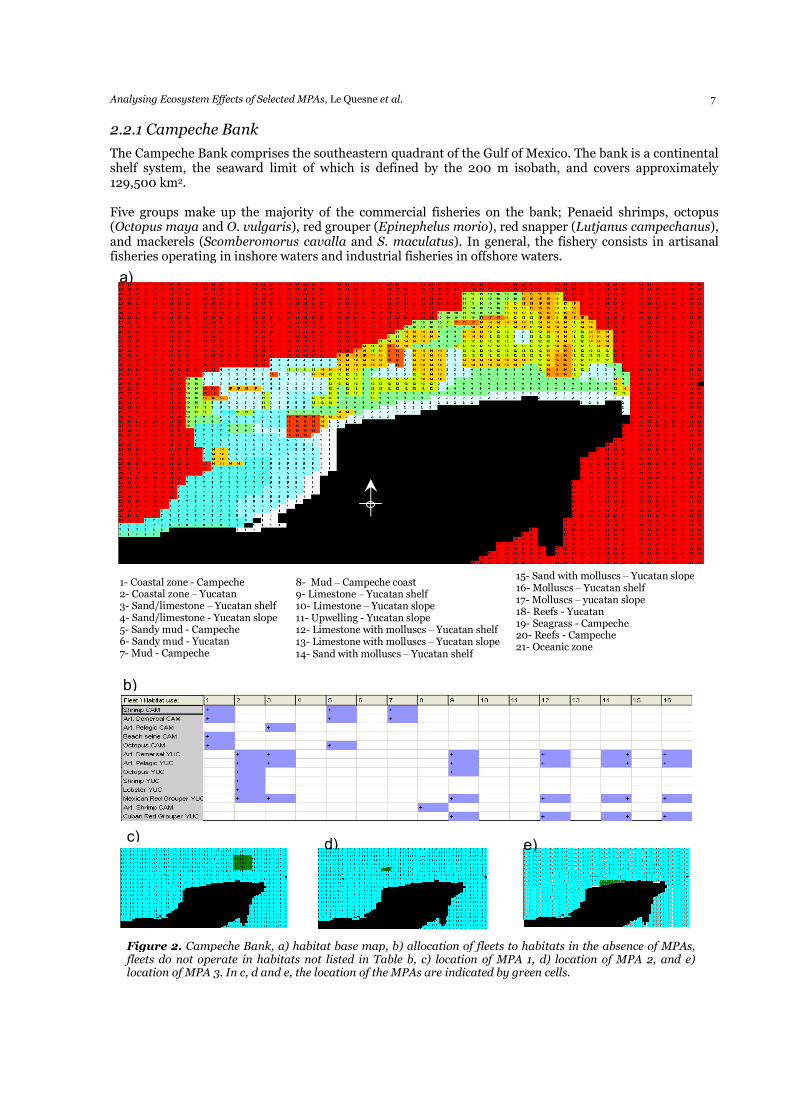
The Campeche Bank comprises the southeastern quadrant of the Gulf of Mexico. The bank is a continental shelf system, the seaward limit of which is defined by the 200 m isobath, and covers approximately 129,500 km2. Five groups make up the majority of the commercial fisheries on the bank; Penaeid shrimps, octopus (Octopus maya and O. vulgaris), red grouper (Epinephelus morio), red snapper (Lutjanus campechanus), and mackerels (Scomberomorus cavalla and S. maculatus). In general, the fishery consists in artisanal fisheries operating in inshore waters and industrial fisheries in offshore waters.
1- Coastal zone - Campeche 2- Coastal zone – Yucatan 3- Sand/limestone – Yucatan shelf 4- Sand/limestone - Yucatan slope 5- Sandy mud - Campeche 6- Sandy mud - Yucatan 7- Mud - Campeche
8- Mud – Campeche coast 9- Limestone – Yucatan shelf 10- Limestone – Yucatan slope 11- Upwelling - Yucatan slope 12- Limestone with molluscs – Yucatan shelf 13- Limestone with molluscs – Yucatan slope 14- Sand with molluscs – Yucatan shelf
15- Sand with molluscs – Yucatan slope 16- Molluscs – Yucatan shelf 17- Molluscs – yucatan slope 18- Reefs - Yucatan 19- Seagrass - Campeche 20- Reefs - Campeche 21- Oceanic zone
Figure 2. Campeche Bank, a) habitat base map, b) allocation of fleets to habitats in the absence of MPAs, fleets do not operate in habitats not listed in Table b, c) location of MPA 1, d) location of MPA 2, and e) location of MPA 3. In c, d and e, the location of the MPAs are indicated by green cells.
a)
b)
c) d) e)
8 Analysing Ecosystem Effects of Selected MPAs, Le Quesne et al.
Three hypothetical MPAs are considered in the Campeche Bank region (Figure 2). The main fishery in the region targets red grouper, which has been showing signs of overexploitation. The simulated MPAs are all designed to protect and increase red grouper stock biomass. MPA 1 is a 2,200 km2 closure covering an area of adult aggregation that is intensely exploited. MPA 2 is a 250 km2 closure covering the region where adults have the highest catchability. MPA 3 is an 825 km2 closure that covers the main area for juvenile red grouper. The three simulated MPAs cover 1.7, 0.2, and 0.6% of the modelled area respectively.
2.2.2 East China Sea
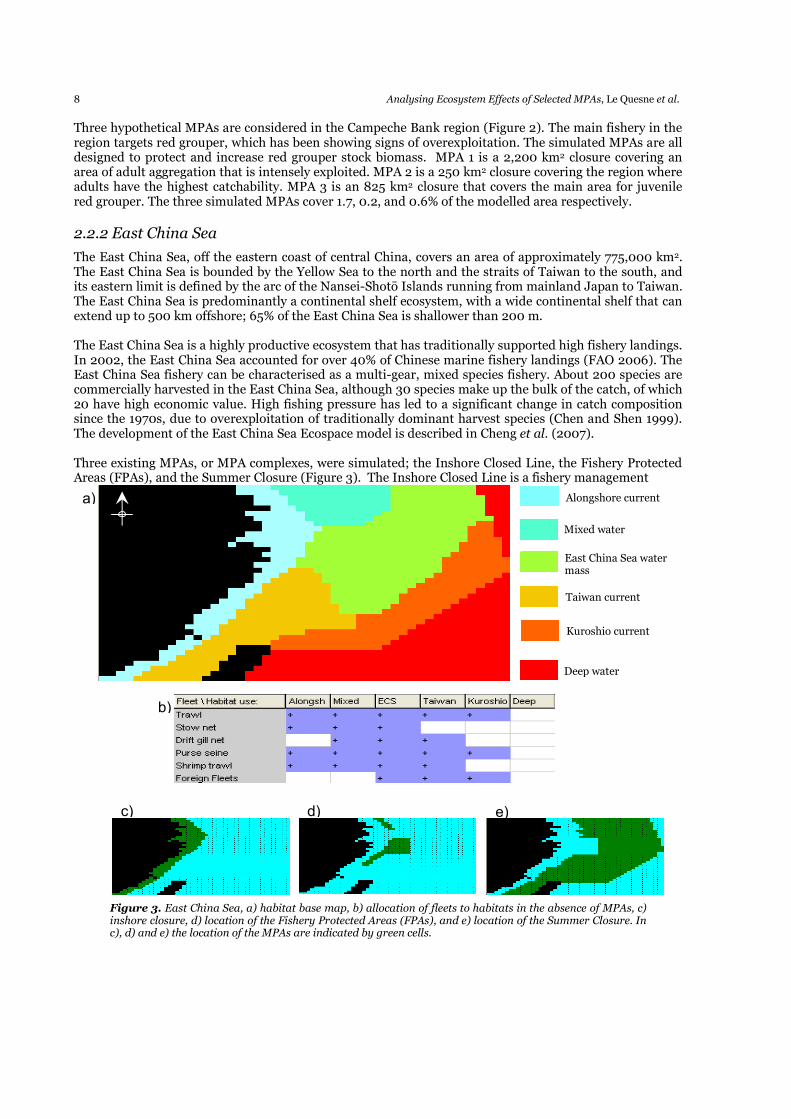
The East China Sea, off the eastern coast of central China, covers an area of approximately 775,000 km2. The East China Sea is bounded by the Yellow Sea to the north and the straits of Taiwan to the south, and its eastern limit is defined by the arc of the Nansei-Shotō Islands running from mainland Japan to Taiwan. The East China Sea is predominantly a continental shelf ecosystem, with a wide continental shelf that can extend up to 500 km offshore; 65% of the East China Sea is shallower than 200 m. The East China Sea is a highly productive ecosystem that has traditionally supported high fishery landings. In 2002, the East China Sea accounted for over 40% of Chinese marine fishery landings (FAO 2006). The East China Sea fishery can be characterised as a multi-gear, mixed species fishery. About 200 species are commercially harvested in the East China Sea, although 30 species make up the bulk of the catch, of which 20 have high economic value. High fishing pressure has led to a significant change in catch composition since the 1970s, due to overexploitation of traditionally dominant harvest species (Chen and Shen 1999). The development of the East China Sea Ecospace model is described in Cheng et al. (2007). Three existing MPAs, or MPA complexes, were simulated; the Inshore Closed Line, the Fishery Protected Areas (FPAs), and the Summer Closure (Figure 3). The Inshore Closed Line is a fishery management
Alongshore current
East China Sea water mass
Mixed water
Taiwan current
Kuroshio current
Deep water
a)
b)
c) d) e)
Figure 3. East China Sea, a) habitat base map, b) allocation of fleets to habitats in the absence of MPAs, c) inshore closure, d) location of the Fishery Protected Areas (FPAs), and e) location of the Summer Closure. In c), d) and e) the location of the MPAs are indicated by green cells.
Analysing Ecosystem Effects of Selected MPAs, Le Quesne et al. 9
closure. The coastal region is considered to be an important spawning area, although the Inshore Closed Line was originally established to reduce conflict between motorised and sail fleets. The Inshore Closed Line runs approximately along the 50 m isobath, about 75 km offshore, and is a year-round closure to the trawl, shrimp trawl and stow net fleets. The Inshore Closed Line covers 12.4% of the modelled area. The FPAs are seasonal gear restrictions that were established to protect spawning and juvenile hairtail (Trichiurus lepturus) and large yellow croaker (Larimichtys crocea). The FPAs cover a combined area of 58,135 km2, 6.5% of the modelled area. The Summer Closure is a seasonal spatial gear restriction that closes most of the ECS continental shelf to most gears during the main spawning period of the key commercial species, the Summer Closure covers 55% of the modelled area. The East China Sea model was based on a 6-year time series covering the period 1997–2002. This was extended to a 22-year time series for the simulations by holding the values for the last year of the 10-year time series constant for the final 16 years of the simulation period.
2.2.3 North Sea
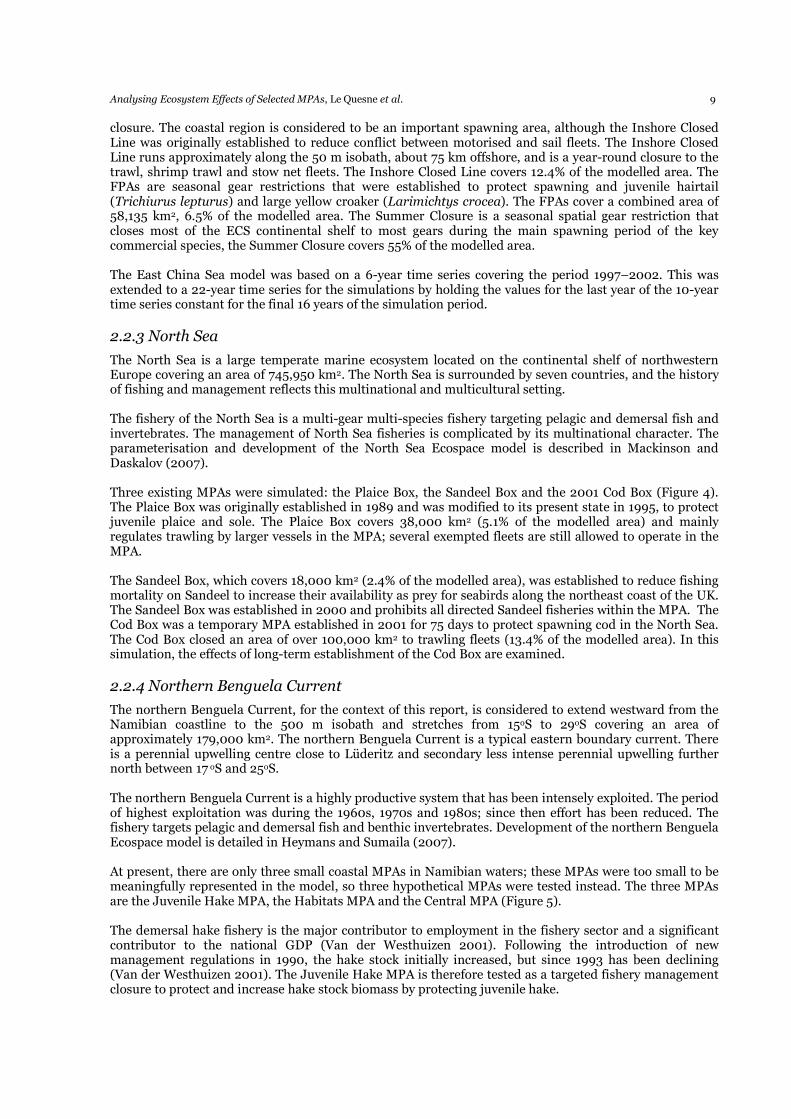
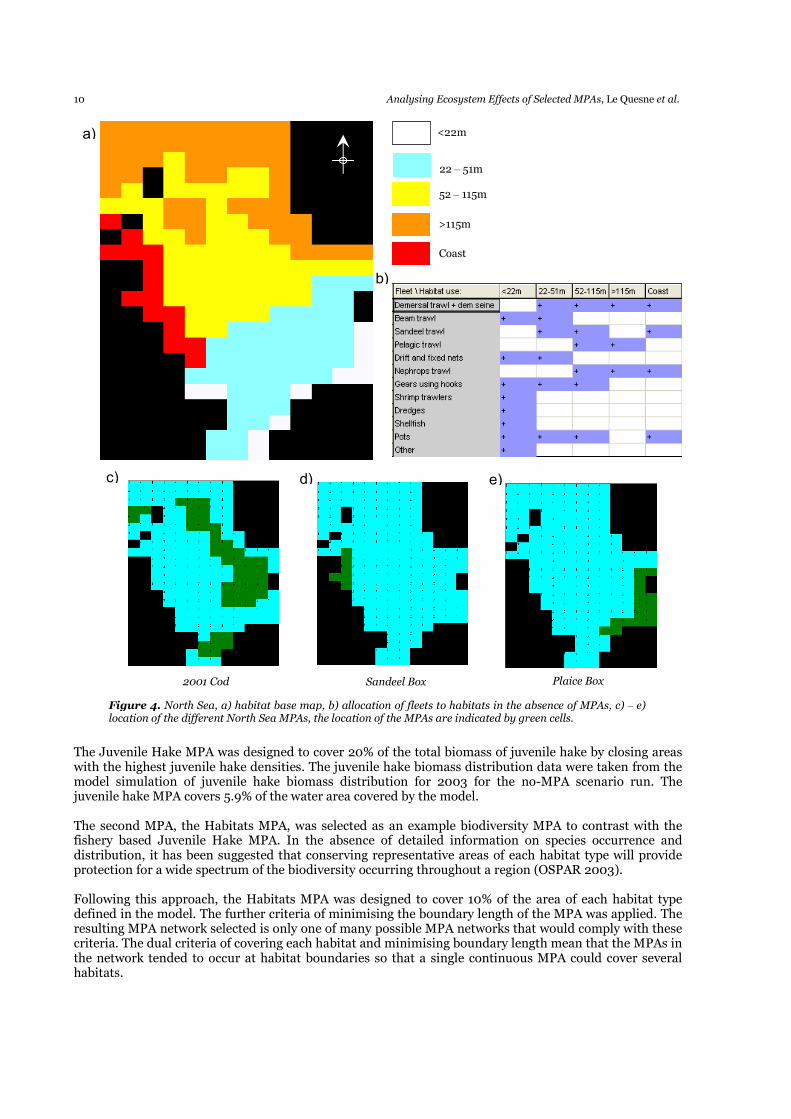
The North Sea is a large temperate marine ecosystem located on the continental shelf of northwestern Europe covering an area of 745,950 km2. The North Sea is surrounded by seven countries, and the history of fishing and management reflects this multinational and multicultural setting. The fishery of the North Sea is a multi-gear multi-species fishery targeting pelagic and demersal fish and invertebrates. The management of North Sea fisheries is complicated by its multinational character. The parameterisation and development of the North Sea Ecospace model is described in Mackinson and Daskalov (2007). Three existing MPAs were simulated: the Plaice Box, the Sandeel Box and the 2001 Cod Box (Figure 4). The Plaice Box was originally established in 1989 and was modified to its present state in 1995, to protect juvenile plaice and sole. The Plaice Box covers 38,000 km2 (5.1% of the modelled area) and mainly regulates trawling by larger vessels in the MPA; several exempted fleets are still allowed to operate in the MPA. The Sandeel Box, which covers 18,000 km2 (2.4% of the modelled area), was established to reduce fishing mortality on Sandeel to increase their availability as prey for seabirds along the northeast coast of the UK. The Sandeel Box was established in 2000 and prohibits all directed Sandeel fisheries within the MPA. The Cod Box was a temporary MPA established in 2001 for 75 days to protect spawning cod in the North Sea. The Cod Box closed an area of over 100,000 km2 to trawling fleets (13.4% of the modelled area). In this simulation, the effects of long-term establishment of the Cod Box are examined.
2.2.4 Northern Benguela Current
The northern Benguela Current, for the context of this report, is considered to extend westward from the Namibian coastline to the 500 m isobath and stretches from 15oS to 29oS covering an area of approximately 179,000 km2. The northern Benguela Current is a typical eastern boundary current. There is a perennial upwelling centre close to Lüderitz and secondary less intense perennial upwelling further north between 17 oS and 25oS. The northern Benguela Current is a highly productive system that has been intensely exploited. The period of highest exploitation was during the 1960s, 1970s and 1980s; since then effort has been reduced. The fishery targets pelagic and demersal fish and benthic invertebrates. Development of the northern Benguela Ecospace model is detailed in Heymans and Sumaila (2007). At present, there are only three small coastal MPAs in Namibian waters; these MPAs were too small to be meaningfully represented in the model, so three hypothetical MPAs were tested instead. The three MPAs are the Juvenile Hake MPA, the Habitats MPA and the Central MPA (Figure 5). The demersal hake fishery is the major contributor to employment in the fishery sector and a significant contributor to the national GDP (Van der Westhuizen 2001). Following the introduction of new management regulations in 1990, the hake stock initially increased, but since 1993 has been declining (Van der Westhuizen 2001). The Juvenile Hake MPA is therefore tested as a targeted fishery management closure to protect and increase hake stock biomass by protecting juvenile hake.
10 Analysing Ecosystem Effects of Selected MPAs, Le Quesne et al.
The Juvenile Hake MPA was designed to cover 20% of the total biomass of juvenile hake by closing areas with the highest juvenile hake densities. The juvenile hake biomass distribution data were taken from the model simulation of juvenile hake biomass distribution for 2003 for the no-MPA scenario run. The juvenile hake MPA covers 5.9% of the water area covered by the model. The second MPA, the Habitats MPA, was selected as an example biodiversity MPA to contrast with the fishery based Juvenile Hake MPA. In the absence of detailed information on species occurrence and distribution, it has been suggested that conserving representative areas of each habitat type will provide protection for a wide spectrum of the biodiversity occurring throughout a region (OSPAR 2003). Following this approach, the Habitats MPA was designed to cover 10% of the area of each habitat type defined in the model. The further criteria of minimising the boundary length of the MPA was applied. The resulting MPA network selected is only one of many possible MPA networks that would comply with these criteria. The dual criteria of covering each habitat and minimising boundary length mean that the MPAs in the network tended to occur at habitat boundaries so that a single continuous MPA could cover several habitats.
2001 Cod Plaice Box Sandeel Box
<22m
22 – 51m
52 – 115m
>115m
a)
b)
c) d) e)
Figure 4. North Sea, a) habitat base map, b) allocation of fleets to habitats in the absence of MPAs, c) – e) location of the different North Sea MPAs, the location of the MPAs are indicated by green cells.
Coast
Analysing Ecosystem Effects of Selected MPAs, Le Quesne et al. 11
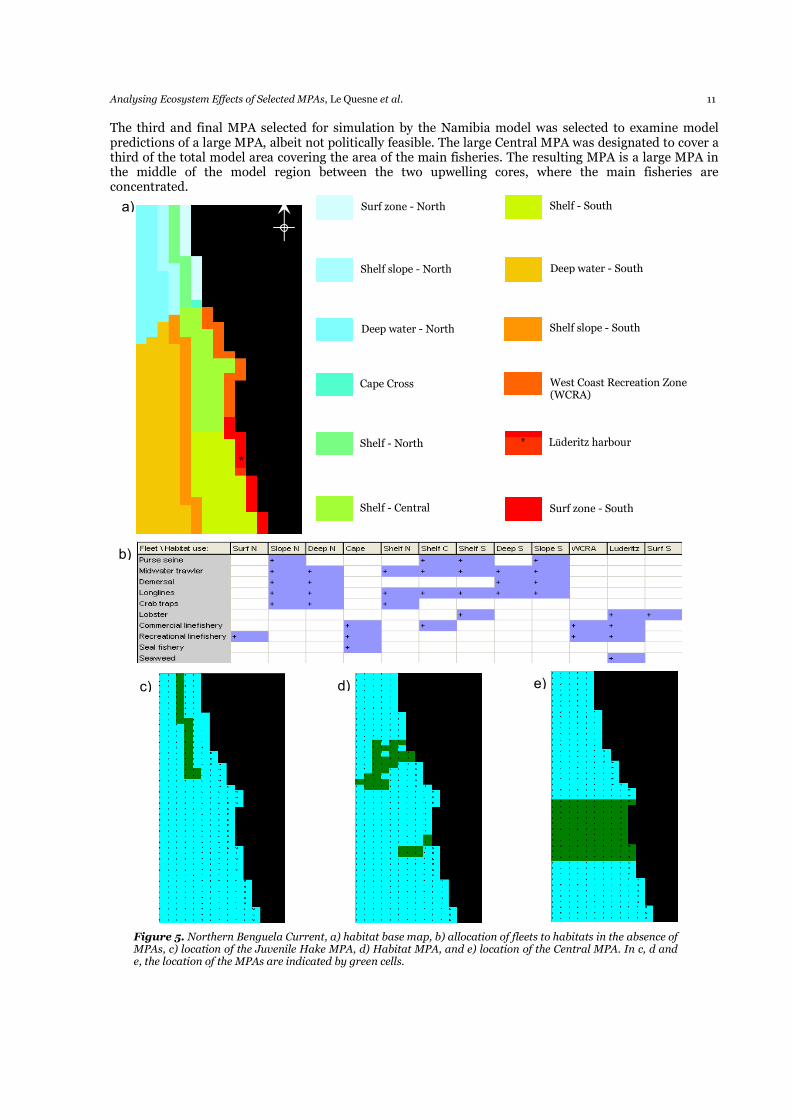
The third and final MPA selected for simulation by the Namibia model was selected to examine model predictions of a large MPA, albeit not politically feasible. The large Central MPA was designated to cover a third of the total model area covering the area of the main fisheries. The resulting MPA is a large MPA in the middle of the model region between the two upwelling cores, where the main fisheries are concentrated.
*
*
Surf zone - North
Shelf slope - North
Deep water - North
Cape Cross
Shelf - North
Shelf - Central
Shelf - South
Deep water - South
Shelf slope - South
West Coast Recreation Zone (WCRA)
Surf zone - South
Lüderitz harbour
a)
b)
c) d) e)
Figure 5. Northern Benguela Current, a) habitat base map, b) allocation of fleets to habitats in the absence of MPAs, c) location of the Juvenile Hake MPA, d) Habitat MPA, and e) location of the Central MPA. In c, d and e, the location of the MPAs are indicated by green cells.
12 Analysing Ecosystem Effects of Selected MPAs, Le Quesne et al.
For all of the northern Benguela Current MPA simulations, the MPAs were considered to be year-round closures to all gears. The northern Benguela Current model was based on a 47-year time series covering the period 1956–2003. For the MPA simulations the MPAs were introduced into the model in 1983.
2.2.5 Northern Gulf of California
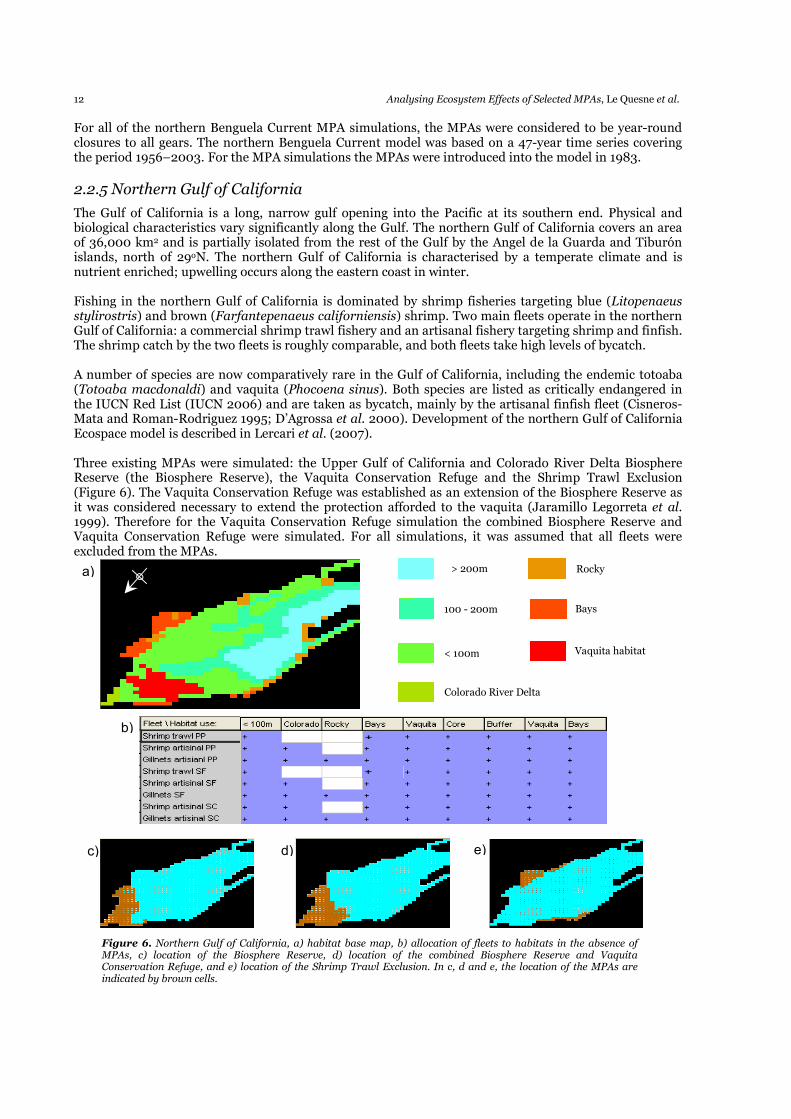
The Gulf of California is a long, narrow gulf opening into the Pacific at its southern end. Physical and biological characteristics vary significantly along the Gulf. The northern Gulf of California covers an area of 36,000 km2 and is partially isolated from the rest of the Gulf by the Angel de la Guarda and Tiburón islands, north of 29oN. The northern Gulf of California is characterised by a temperate climate and is nutrient enriched; upwelling occurs along the eastern coast in winter. Fishing in the northern Gulf of California is dominated by shrimp fisheries targeting blue (Litopenaeus stylirostris) and brown (Farfantepenaeus californiensis) shrimp. Two main fleets operate in the northern Gulf of California: a commercial shrimp trawl fishery and an artisanal fishery targeting shrimp and finfish. The shrimp catch by the two fleets is roughly comparable, and both fleets take high levels of bycatch. A number of species are now comparatively rare in the Gulf of California, including the endemic totoaba (Totoaba macdonaldi) and vaquita (Phocoena sinus). Both species are listed as critically endangered in the IUCN Red List (IUCN 2006) and are taken as bycatch, mainly by the artisanal finfish fleet (Cisneros-Mata and Roman-Rodriguez 1995; D’Agrossa et al. 2000). Development of the northern Gulf of California Ecospace model is described in Lercari et al. (2007). Three existing MPAs were simulated: the Upper Gulf of California and Colorado River Delta Biosphere Reserve (the Biosphere Reserve), the Vaquita Conservation Refuge and the Shrimp Trawl Exclusion (Figure 6). The Vaquita Conservation Refuge was established as an extension of the Biosphere Reserve as it was considered necessary to extend the protection afforded to the vaquita (Jaramillo Legorreta et al. 1999). Therefore for the Vaquita Conservation Refuge simulation the combined Biosphere Reserve and Vaquita Conservation Refuge were simulated. For all simulations, it was assumed that all fleets were excluded from the MPAs.
Colorado River Delta
> 200m
100 - 200m
< 100m Vaquita habitat
Rocky
Bays
a)
b)
c) d) e)
Figure 6. Northern Gulf of California, a) habitat base map, b) allocation of fleets to habitats in the absence of MPAs, c) location of the Biosphere Reserve, d) location of the combined Biosphere Reserve and Vaquita Conservation Refuge, and e) location of the Shrimp Trawl Exclusion. In c, d and e, the location of the MPAs are indicated by brown cells.
Analysing Ecosystem Effects of Selected MPAs, Le Quesne et al. 13
The marine sections of the Biosphere Reserve were established to protect the endangered vaquita, conserve biodiversity and to assist fisheries management. The Biosphere Reserve MPA covers 8.4% of the modelled area. The Vaquita Conservation Refuge was established as an extension of the Biosphere Reserve to increase protection of the vaquita; the combined Biosphere reserve and Vaquita Conservation Refuge covers 18.3% of the modelled area. The Shrimp Trawl Exclusion was established as a fishery management measure to protect key shallow water shrimp spawning and nursery areas. The shrimp trawl exclusion covers 9% of the modelled area. The northern Gulf of California model was based on a 10-year time series covering the period 1993–2003. This was extended to a 22-year time series for the simulations by holding the values for the last year of the 10-year time series constant for the final 12 years of the simulation period.
2.3 ANALYSIS OF RESULTS
Understanding the precise causes of the ecosystem responses to MPA establishment in all the simulations conducted is beyond the scope of this report. Instead, it focuses on examining the main overarching effects of MPA establishment on fisheries and ecosystem structure predicted by the simulations as a guide to planning future MPA networks. To understand the ecosystem effects of MPAs, it is first necessary to understand the ecosystem effects of fishing and how they can be measured. At present, there is no consensus on what constitutes ecosystem overfishing, nor on the biological parameters that should be monitored to measure this (Murawski 2000). Several ideas such as ‘ecosystem health’ and ‘ecosystem integrity’ have developed along with the concept of ecosystem-based management. However these ideas have been considered not “readily translated into operational language for resource management. These and similar expressions are best assessed as rhetorical devices” (Larkin 1996). Despite this, several metrics have been proposed that provide a measure of aspects of ecosystem functioning that can be seen to be pertinent to describing the ‘condition’ of an ecosystem. Examples of this are system attributes such as total biomass, average trophic level of the catch or whole system (Rochet and Trenkel 2003), indices of community structure such as species diversity indices (Magurran 1988), and Odum’s attributes of ecosystem maturity (Odum 1971). Although many of these indices are thought to contain useful information about the state of a system, interpretation of these indices is beset with difficulties as the indices are not always able to discriminate between different conditions, and the desired direction of change in the indices can vary between situations (Bianchi et al. 2000; Rice 2000; Piet and Jennings 2005). However, for this study we assume that the direction of change in ecosystem metric measured within an MPA (where these measures were available) are the ‘desired’ direction of change for the system to revert to a less impacted state. Therefore, the effects of the MPAs included in the simulations are analysed in terms of two ideas that stand at the heart of the ecosystem-based approach to fisheries management: sustainable yield and maintenance of biodiversity. Additional system indices are calculated and assessed where they are considered pertinent to the analysis.
2.3.1 Fisheries
It may seem that examining the effect of MPAs on sustainability of yield is just the simple task of comparing whether greater total yields are predicted under an MPA simulation or its comparative no-MPA base simulation. However, there has been debate over whether the total yield should be sustained, regardless of the species mix that makes up this yield, or whether the composition of the yield needs to be taken into account (Larkin 1996). Further, as the ecosystem approach includes human activities, the profitability of the fishery and the proportion of yield taken by different fleets or different sectors of the fishing community also need to be taken into account to examine whether the costs of MPA establishment lie disproportionately on one section of the fishing community. To examine how establishment of the selected MPAs affects the yield, composition of the yield and the fisheries, the following results were calculated:
14 Analysing Ecosystem Effects of Selected MPAs, Le Quesne et al.
• Percent change in total yield;
• Percent change in yield per functional group;
• Percent change in yield per fleet;
• Percent change in profit per fleet;
• Average trophic level of the fishery. The percent change is measured as the percent change in the MPA scenario compared with the no-MPA base scenario for that region. Thus, a positive value indicates that there was an increase in the metric as a result of MPA establishment. During discussion of the change in yield of individual groups and fleets, changes of <±5% were considered insignificant and not discussed except for when the effects of an MPA on specific focal species were examined. The average trophic level of the fishery was calculated according to:
average trophic level = Σ { (TLi . Yi) / Σ Yi } ….1)
where TLi and Yi refer to the trophic level and yield of group i, respectively.
2.3.2 Ecosystem metrics
To examine how the establishment of the selected MPAs affects ecosystem functioning and biodiversity the following results were calculated:
• Percent change in biomass for all groups, and for all groups with a trophic level greater than 1;
• Percent change in biomass per functional group;
• Average trophic level of the system;
• Average longevity of the system;
• Shannon’s diversity index calculated for the system;
• Kempton’s biomass diversity index of the system. As with the fishery metrics, the percent change in biomass of the functional groups, or whole system biomass is calculated as the percent change in the MPA scenario compared to the no-MPA base scenario for that system. As with the fishery metrics, changes in individual group biomass of <±5% were omitted from discussion except when the effects of an MPA on specific focal species were examined. The average trophic level of the systems, and sub-areas, excluded groups with a trophic level of 1 (primary producers and detritus), to focus on the exploited sections of the communities. Average longevity is an index based on one of Odum’s indices of ecosystem maturity. The assumption is that as an ecosystem matures it will contain a greater proportion of long-lived organisms, and this will lead to an increase in the index of average longevity. The average longevity of a group can be expressed in terms of the reciprocal of total mortality (Z). Within the Ecopath modelling framework Z is expressed as production/biomass, the inverse of which (biomass/production) expresses average longevity (years). The average longevity is calculated according to:
average longevity = Σ { ([B/P]i x Bi) / Σ Bi } ….2) where [B/P]i and Bi are the biomass to production ratio, and biomass of group i respectively. The average longevity was calculated excluding groups with a trophic level of 1. Two different diversity indices are calculated, Shannon’s diversity index and what we refer to as Kempton’s biomass diversity index (Kempton’s BDI). Strictly, these are indices of species evenness (Magurran 1988). Indices of species richness are not appropriate due to the functional group aggregation employed in Ecopath model construction. Two different evenness indices are applied to due to the differing benefits of the two approaches. Shannon’s diversity index is widely used, and has been shown to discriminate between communities experiencing different levels of impact (Magurran 1988); however, it has been criticised for being insensitive to some changes in community composition and for having no meaningful biological interpretation (Magurran 1988). It has also been shown to be unduly sensitive to changes in the abundance of the most abundant groups (Kempton and Taylor 1976).
Analysing Ecosystem Effects of Selected MPAs, Le Quesne et al. 15
Due to the perceived shortcomings of Shannon’s diversity index, a second evenness index was calculated to complement the interpretation of Shannon’s index. Kempton’s BDI (Christensen and Walters 2004) is based upon Kempton’s Q index (Kempton and Taylor 1976). Kempton’s Q index is the gradient of the slope of the cumulative abundance curve between the highest and lowest quartiles in a ranked species abundance plot. Kempton’s Q index is calculated as:
Q = S / 2.log (R0.25 S/R0.75 S) ….3) where S is the number of species (in this case functional groups) and RiS is the abundance of the ith most common species. In the case that i is not an integer, RiS is the weighted average abundance of the two closest groups. In Kempton and Taylor’s original formulation, abundance was expressed as numbers, whereas for our calculations abundance was expressed as biomass. An increase in diversity, in terms of a more even community biomass distribution, will lead to a decline in Q. Kempton’s BDI was developed to express diversity relative to a base run, and to inverse the index so that an increase in the value indicates an increase in diversity (evenness). Kempton’s biomass diversity index (Christensen and Walters 2004) is calculated according to:
Kempton’s BDI = 2 – Qrun / Qbaserun ….4)
where Qrun is the Q statistic for the simulation of interest (in this case an MPA simulation) and Qbaserun is the comparative base run (in this case the no-MPA run for the modelled system). A BDI of greater than 1 indicates that there is a greater evenness in the trial simulation compared to the base run. Kempton’s BDI is sensitive to the number of functional groups in a model, thus quantitative comparisons of Kempton’s BDI between models is not appropriate (Christensen and Walters 2004). Both Shannon’s diversity index and Kempton’s BDI were calculated excluding groups with a trophic level of one. It should be noted, when interpreting Ecospace outputs, that trends in aggregated groups may mask greater fluctuations in the component species of aggregate groups. The biomass of an aggregated group may show general stability even if component members of the group are lost from the system (Dulvy et al. 2000).
16 Analysing Ecosystem Effects of Selected MPAs, Le Quesne et al.
3. RESULTS
3.1 CAMPECHE BANK
3.1.1 MPA 1
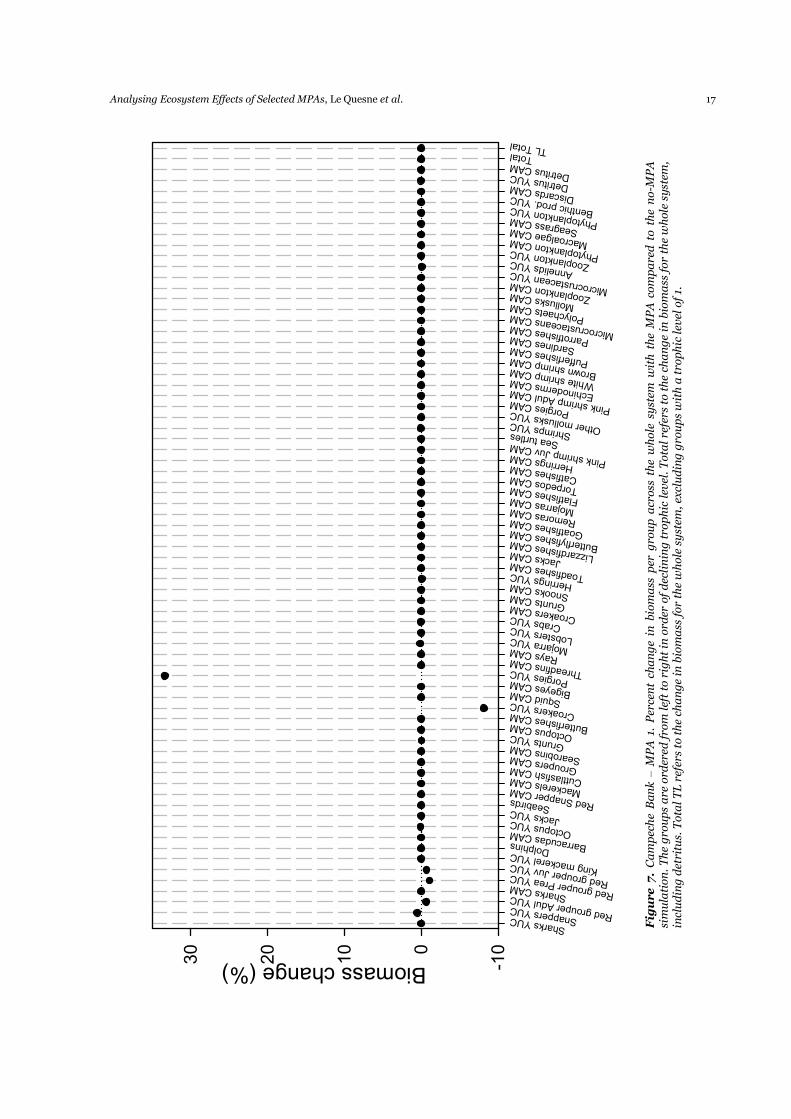
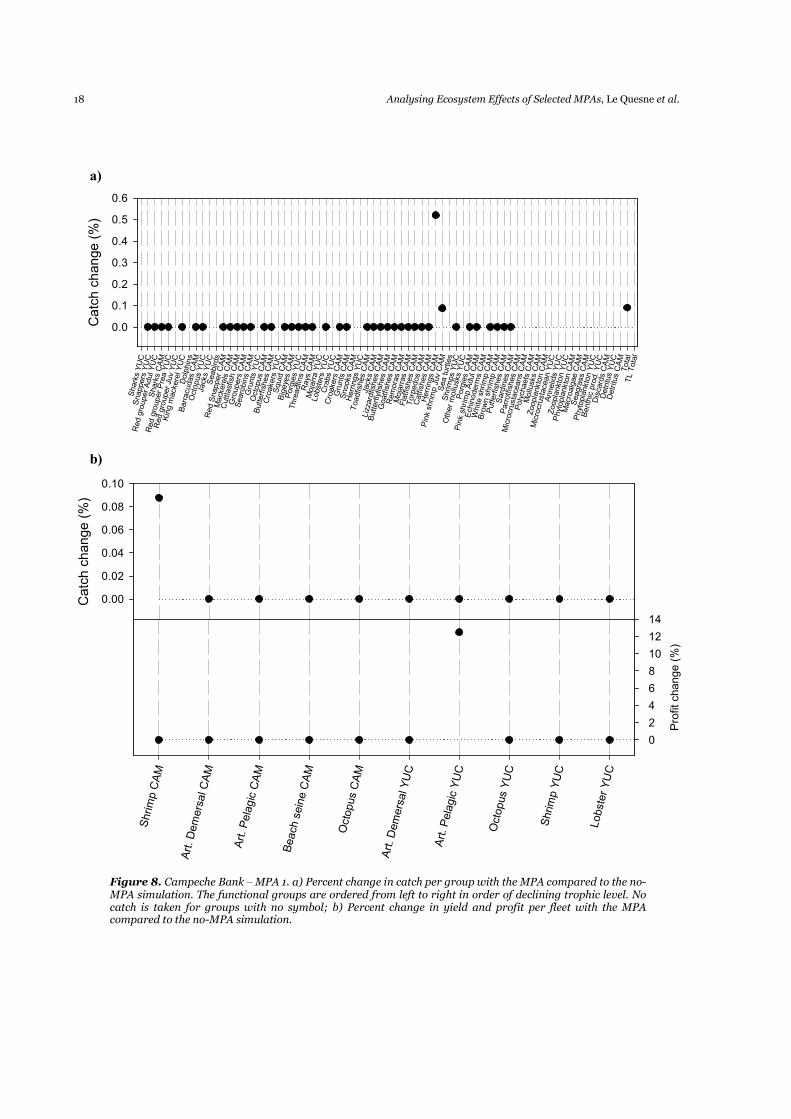
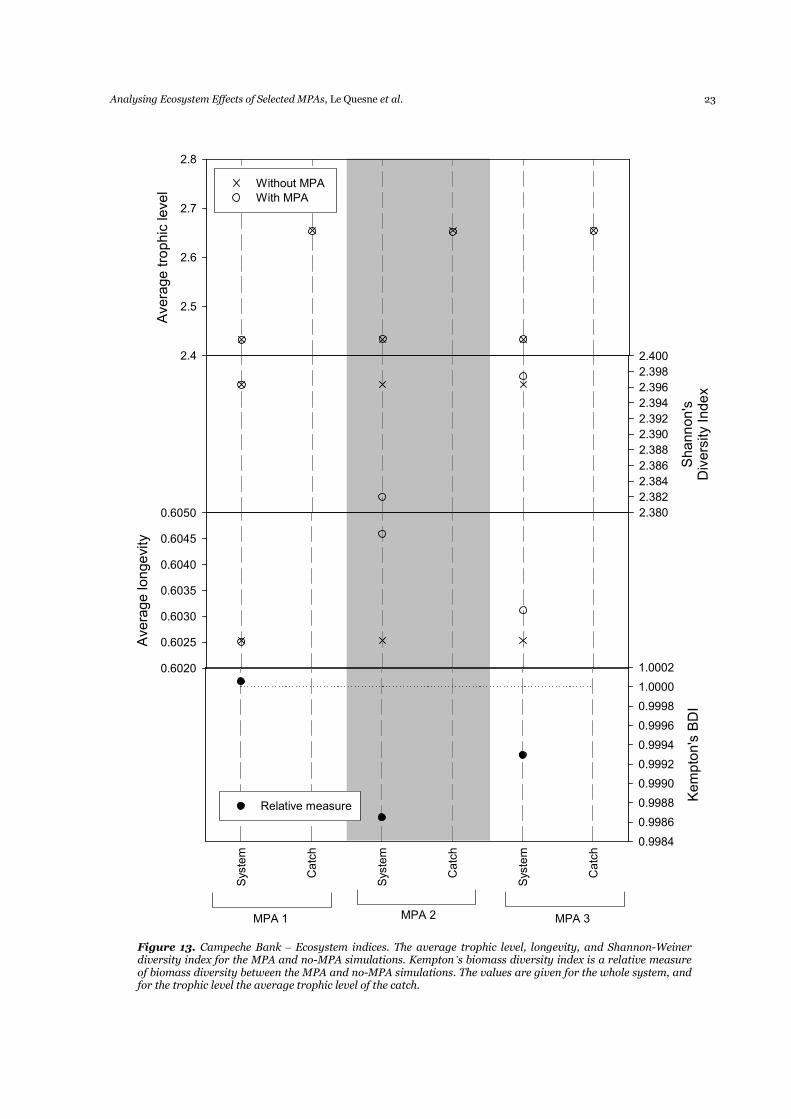
The establishment of Campeche Bank MPA 1, based around an area of adult red grouper aggregation, had little effect on the fishery (Figure 8). The total catch increased by less than 0.1% and a result of slight (>0.5%) increases in the herring and juvenile pink shrimp catches. The MPA did not have an effect on the catch of any of the other groups. When examined by fleets, the only one that showed any variation in catch following MPA establishment was the Shrimp CAM fleet, which had a less than 0.1% increase in catch. The establishment of MPA 1 had very little effect on the total biomass of the system or of the individual groups (Figure 7). The Porgies (YUC) increased in biomass by over 30%, and the Croakers (YUC) decreased by 8%; no other groups displayed a significant change in biomass. The establishment of MPA 1 had very little effect on the ecosystem indices (Figure 13). The average trophic level of the system and catch, and the average longevity and Shannon’s diversity index of the total system were unaffected by the MPA. Kempton’s BDI indicated that there was a very slight increase in species evenness resulting from the establishment of Campeche Bank MPA 1.
3.1.2 MPA 2
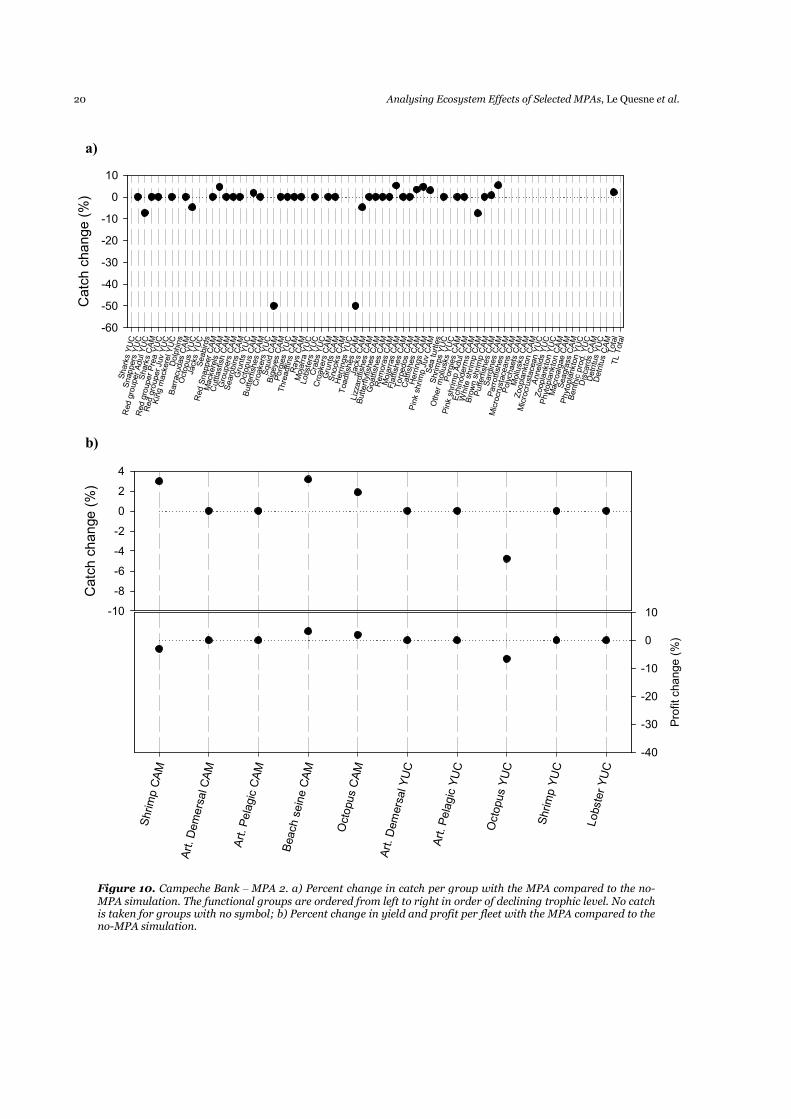
Establishment of Campeche Bank MPA 2 led to a 2% increase in overall yield (Figure 10). Squid (CAM) and Toadfish (CAM) both showed a decline in catch of 50%; no other groups showed a greater than ±10% change in catch. Adult red grouper (YUC) catch declined by 7%. The only fleet that had a decline in yield as a result of MPA establishment was the octopus (YUC) fleet. The shrimp (CAM), beach seine (CAM) and octopus (CAM) fleets all had about a 2% increase in catch as a result of MPA establishment; there was no change in catch for the other fleets. The overall biomass of the whole system increased by 1.6%, and the overall biomass of groups with a trophic level >1 increased by 2.6% as a result of MPA establishment (Figure 9). The biomass of individual groups showed a range of responses to MPA establishment, varying between an increase of 17% for seabirds to a 50% decline in butterflyfish (CAM) biomass. In general, the mid-trophic level groups showed the greatest response to MPA establishment. Adult red grouper (YUC) biomass declined by over 3%. The average trophic level of the system and the catch showed no change following establishment of Campeche Bank MPA 2 (Figure 13). The average longevity increased following MPA establishment, but both Shannon’s diversity index and Kempton’s BDI indicate a decrease in species evenness resulting from MPA establishment.
3.1.3 MPA 3
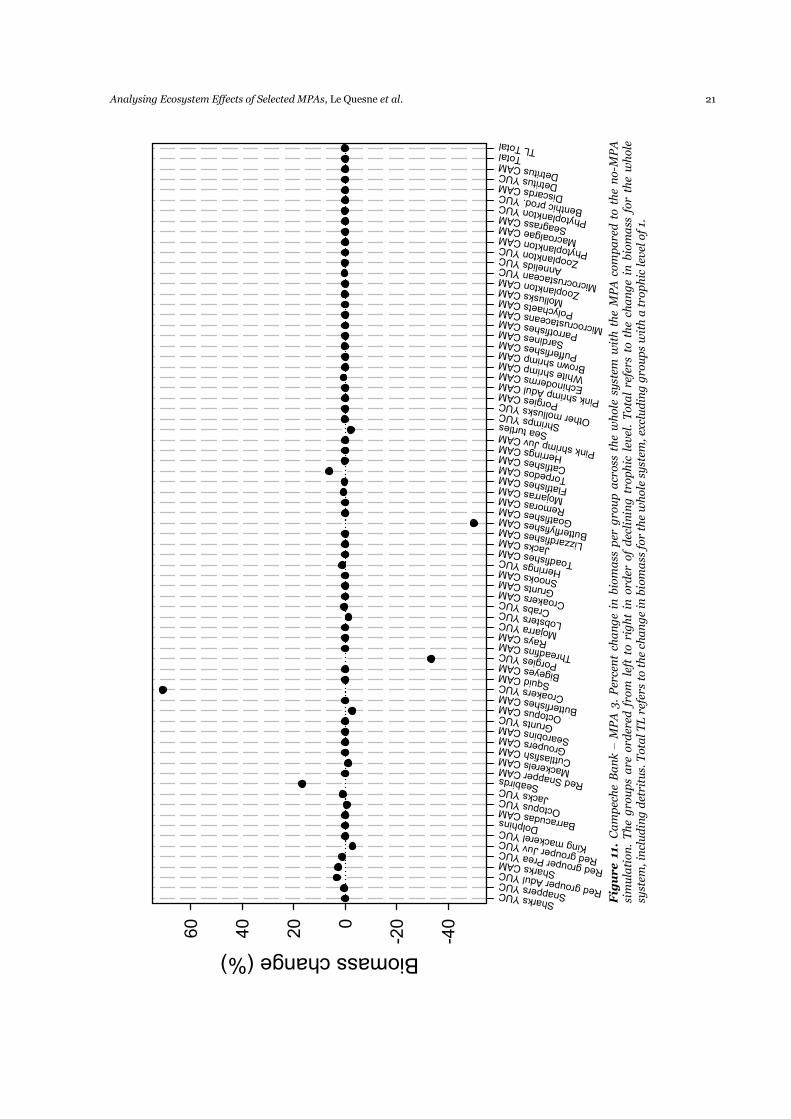
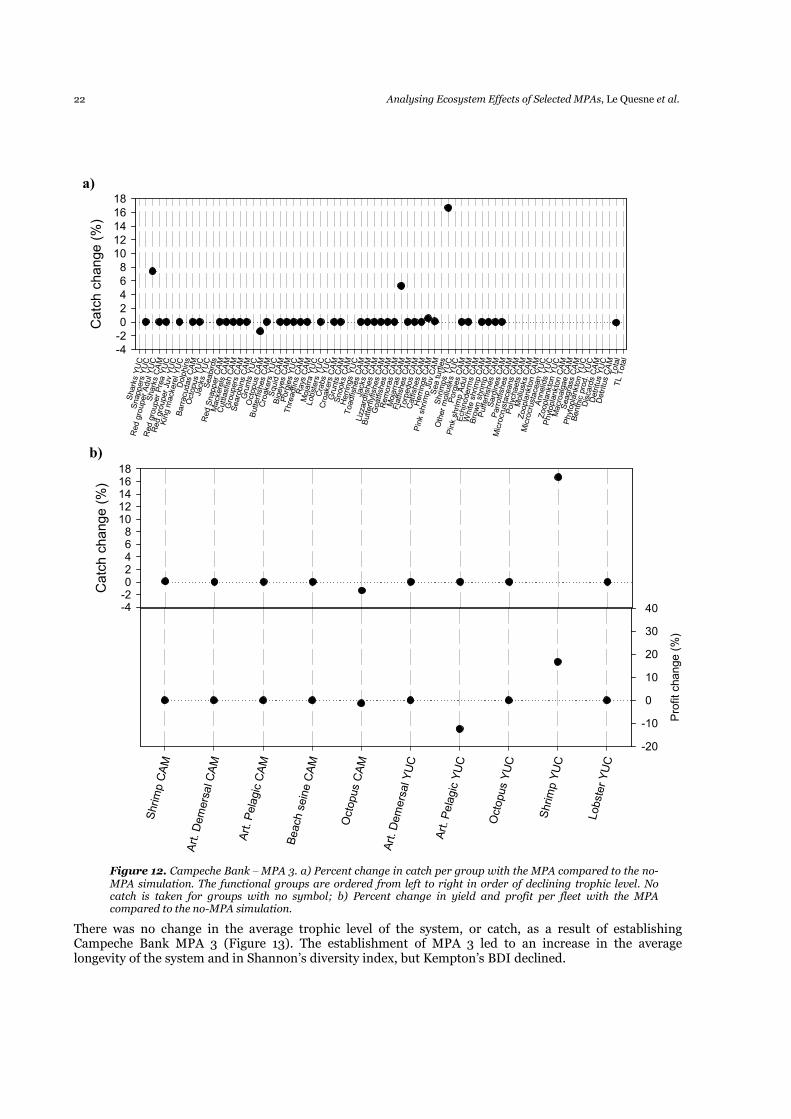
There was a very slight decline in total catch (>0.01%) following establishment of Campeche Bank MPA 3 (Figure 12). The catch of most groups showed very limited or no change as a result of MPA establishment, apart from the red grouper adults (YUC), mojarras (CAM) and shrimps (YUC) catch which increased by 7.5, 5 and 17% respectively. The fleets showed no significant change in catch as a result of MPA establishment apart from the shrimp (YUC) fleet that had a 17% increase in catch. The total biomass of the system increased by <0.1% following MPA establishment and the overall biomass of groups with a trophic level greater than 1 increased by 0.13%. The biomass of individual groups generally showed a limited (>±3.5%) response to MPA establishment. The seabirds, croakers (YUC) and torpedos (CAM) increased their biomass by 17, 71 and 6%, respectively, as a result of MPA establishment. The porgies (YUC) and butterflyfishes (CAM) declined by 33 and 50% respectively. Adult red groupers (YUC) increased by 3% and the juvenile red groupers (YUC) declined in biomass by 3% as a result of MPA establishment.
Analysing Ecosystem Effects of Selected MPAs, Le Quesne et al. 17
Figure 7.
Ca
mp
ech
e B
an
k –
MP
A 1
. P
erce
nt
cha
ng
e in
bio
ma
ss p
er g
rou
p a
cross
th
e w
hole
sy
stem
wit
h t
he
MP
A c
om
pa
red
to t
he
no-M
PA
si
mu
lati
on
. T
he
gro
up
s a
re o
rder
ed f
rom
lef
t to
rig
ht
in o
rder
of
dec
lin
ing
tro
ph
ic l
evel
. T
ota
l re
fers
to t
he
cha
ng
e in
bio
ma
ss f
or
the
wh
ole
syst
em,
incl
ud
ing
det
ritu
s. T
ota
l T
L r
efer
s to
th
e ch
an
ge
in b
iom
ass
for
the
wh
ole
sy
stem
, ex
clu
din
g g
rou
ps
wit
h a
tro
ph
ic lev
el o
f 1.
Sharks YUC Snapp
ers YUC
Red grouper
Adul YUC Sharks
CAM Red grouper
Prea YUC Red gr
ouper Juv YU
C King mackere
l YUCDolphi
ns Barracudas C
AM Octopus YUC
Jacks YUC
Seabirds Red S
napper CAM Macke
rels CAM Cuttlas
fish CAM Group
ers CAM Searob
ins CAM Grunts
YUC Octopus CAM Butterf
ishes CAM Croake
rs YUCSquid
CAM Bigeyes CAM
Porgies YUC Thread
fins CAM Rays CAM Mojarr
a YUCLobste
rs YUCCrabs
YUC Croakers CAM
Grunts CAM
Snooks CAM
Herrings YUC Toadfi
shes CAM Jacks
CAM Lizzardfishes
CAM Butterflyfishe
s CAM Goatfishes CA
M Remoras CA
M Mojarras CAM
Flatfishes CA
M Torpedos CAM
Catfishes CAM
Herrings CAM Pink sh
rimp Juv CAM
Sea turtles Shrimp
s YUC Other mollus
ks YUCPorgie
s CAM Pink shrimp
Adul CAM Echino
derms CAM White
shrimp CAM Brown
shrimp CAM Pufferf
ishes CAM Sardin
es CAM Parrotfishes C
AMMicroc
rustaceans CA
M Polychaets C
AM Mollusks CAM Zoopla
nkton CAM Microc
rustacean YU
C Annelids YUC Zoopla
nkton YUC Phytop
lankton CAM Macro
algae CAM Seagra
ss CAM Phytoplankton
YUC Benthic prod
. YUC Discards CA
M Detritus YUC
Detritus CAMTotal
TL Total
Biomass change (%) -100
10
20
30
18 Analysing Ecosystem Effects of Selected MPAs, Le Quesne et al.
Sharks YUC
Snappers YUC
Red grouper Adul YUC
Sharks CAM
Red grouper Prea YUC
Red grouper Juv YUC
King mackerel YUC
Dolphins
Barracudas CAM
Octopus YUC
Jacks YUC
Seabirds
Red Snapper CAM
Mackerels CAM
Cuttlasfish CAM
Groupers CAM
Searobins CAM
Grunts YUC
Octopus CAM
Butterfishes CAM
Croakers YUC
Squid CAM
Bigeyes CAM
Porgies YUC
Threadfins CAM
Rays CAM
Mojarra YUC
Lobsters YUC
Crabs YUC
Croakers CAM
Grunts CAM
Snooks CAM
Herrings YUC
Toadfishes CAM
Jacks CAM
Lizzardfishes CAM
Butterflyfishes CAM
Goatfishes CAM
Remoras CAM
Mojarras CAM
Flatfishes CAM
Torpedos CAM
Catfishes CAM
Herrings CAM
Pink shrimp Juv CAM
Sea turtles
Shrimps YUC
Other mollusks YUC
Porgies CAM
Pink shrimp Adul CAM
Echinoderms CAM
White shrimp CAM
Brown shrimp CAM
Pufferfishes CAM
Sardines CAM
Parrotfishes CAM
Microcrustaceans CAM
Polychaets CAM
Mollusks CAM
Zooplankton CAM
Microcrustacean YUC
Annelids YUC
Zooplankton YUC
Phytoplankton CAM
Macroalgae CAM
Seagrass CAM
Phytoplankton YUC
Benthic prod. YUC
Discards CAM
Detritus YUC
Detritus CAM
Total
TL Total
Catch change (%)
0.0
0.1
0.2
0.3
0.4
0.5
0.6
Catch change (%)
0.00
0.02
0.04
0.06
0.08
0.10
Shrimp CAM
Art. Demersal CAM
Art. Pelagic CAM
Beach seine CAM
Octopus CAM
Art. Demersal YUC
Art. Pelagic YUC
Octopus YUC
Shrimp YUC
Lobster YUC
Profit change (%)
0
2
4
6
8
10
12
14
Figure 8. Campeche Bank – MPA 1. a) Percent change in catch per group with the MPA compared to the no-MPA simulation. The functional groups are ordered from left to right in order of declining trophic level. No catch is taken for groups with no symbol; b) Percent change in yield and profit per fleet with the MPA compared to the no-MPA simulation.
a)
b)
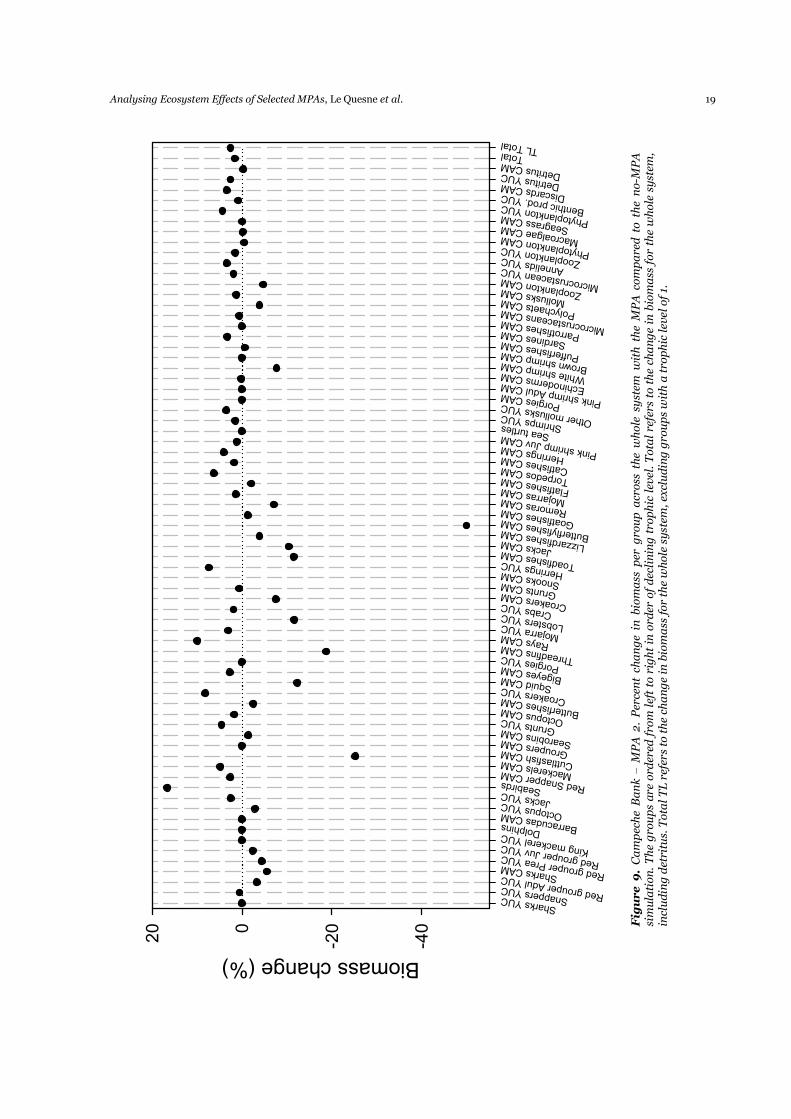
Analysing Ecosystem Effects of Selected MPAs, Le Quesne et al. 19
Figure 9.
Ca
mp
ech
e B
an
k –
MP
A 2
. P
erce
nt
cha
ng
e in
bio
ma
ss p
er g
rou
p a
cross
th
e w
hole
sy
stem
wit
h t
he
MP
A c
om
pa
red
to t
he
no-M
PA
si
mu
lati
on
. T
he
gro
up
s a
re o
rder
ed f
rom
lef
t to
rig
ht
in o
rder
of
dec
lin
ing
tro
ph
ic l
evel
. T
ota
l re
fers
to t
he
cha
ng
e in
bio
ma
ss f
or
the
wh
ole
sy
stem
, in
clu
din
g d
etri
tus.
Tota
l T
L r
efer
s to
th
e ch
an
ge
in b
iom
ass
for
the
wh
ole
sy
stem
, ex
clu
din
g g
rou
ps
wit
h a
tro
ph
ic lev
el o
f 1.
Sharks YUC Snapp
ers YUC
Red grouper
Adul YUC Sharks
CAM Red grouper
Prea YUC Red gr
ouper Juv YU
C King mackere
l YUCDolphi
ns Barracudas C
AM Octopus YUC
Jacks YUC
Seabirds Red S
napper CAM Macke
rels CAM Cuttlas
fish CAM Group
ers CAM Searob
ins CAM Grunts
YUC Octopus CAM Butterf
ishes CAM Croake
rs YUCSquid
CAM Bigeyes CAM
Porgies YUC Thread
fins CAM Rays CAM Mojarr
a YUC Lobsters YUC
Crabs YUC Croake
rs CAMGrunts
CAM Snooks CAM Herrings YUC Toadfi
shes CAM Jacks
CAM Lizzardfishes
CAM Butterflyfishe
s CAM Goatfishes CA
M Remoras CA
M Mojarras CA
M Flatfishes CA
M Torpedos CA
M Catfishes CAM
Herrings CAM Pink sh
rimp Juv CAM
Sea turtles Shrimp
s YUC Other mollus
ks YUCPorgie
s CAM Pink shrimp
Adul CAM Echino
derms CAM White
shrimp CAM Brown
shrimp CAM Pufferf
ishes CAM Sardin
es CAM Parrotfishes C
AMMicroc
rustaceans CA
M Polychaets C
AM Mollusks CAM Zoopla
nkton CAM Microc
rustacean YU
C Annelids YUC Zoopla
nkton YUC Phytop
lankton CAM Macro
algae CAM Seagra
ss CAM Phytoplankton
YUC Benthic prod
. YUC Discards CAM
Detritus YUC
Detritus CAMTotal
TL Total
Biomass change (%)
-40
-200
20
20 Analysing Ecosystem Effects of Selected MPAs, Le Quesne et al.
Sharks YUC
Snappers YUC
Red grouper Adul YUC
Sharks CAM
Red grouper Prea YUC
Red grouper Juv YUC
King mackerel YUC
Dolphins
Barracudas CAM
Octopus YUC
Jacks YUC
Seabirds
Red Snapper CAM
Mackerels CAM
Cuttlasfish CAM
Groupers CAM
Searobins CAM
Grunts YUC
Octopus CAM
Butterfishes CAM
Croakers YUC
Squid CAM
Bigeyes CAM
Porgies YUC
Threadfins CAM
Rays CAM
Mojarra YUC
Lobsters YUC
Crabs YUC
Croakers CAM
Grunts CAM
Snooks CAM
Herrings YUC
Toadfishes CAM
Jacks CAM
Lizzardfishes CAM
Butterflyfishes CAM
Goatfishes CAM
Remoras CAM
Mojarras CAM
Flatfishes CAM
Torpedos CAM
Catfishes CAM
Herrings CAM
Pink shrimp Juv CAM
Sea turtles
Shrimps YUC
Other mollusks YUC
Porgies CAM
Pink shrimp Adul CAM
Echinoderms CAM
White shrimp CAM
Brown shrimp CAM
Pufferfishes CAM
Sardines CAM
Parrotfishes CAM
Microcrustaceans CAM
Polychaets CAM
Mollusks CAM
Zooplankton CAM
Microcrustacean YUC
Annelids YUC
Zooplankton YUC
Phytoplankton CAM
Macroalgae CAM
Seagrass CAM
Phytoplankton YUC
Benthic prod. YUC
Discards CAM
Detritus YUC
Detritus CAM
Total
TL Total
Catch change (%)
-60
-50
-40
-30
-20
-10
0
10
Catch change (%)
-10
-8
-6
-4
-2
0
2
4
Shrimp CAM
Art. Demersal CAM
Art. Pelagic CAM
Beach seine CAM
Octopus CAM
Art. Demersal YUC
Art. Pelagic YUC
Octopus YUC
Shrimp YUC
Lobster YUC
Profit change (%)
-40
-30
-20
-10
0
10
a)
b)
Figure 10. Campeche Bank – MPA 2. a) Percent change in catch per group with the MPA compared to the no-MPA simulation. The functional groups are ordered from left to right in order of declining trophic level. No catch is taken for groups with no symbol; b) Percent change in yield and profit per fleet with the MPA compared to the no-MPA simulation.
Analysing Ecosystem Effects of Selected MPAs, Le Quesne et al. 21
Sharks YUC Snapp
ers YUC
Red grouper
Adul YUC Sharks
CAM Red grouper
Prea YUC Red g
rouper Juv Y
UC King mackere
l YUCDolphi
ns Barracudas C
AM Octopus YUC
Jacks YUC
Seabirds Red S
napper CAM Macke
rels CAM Cuttlas
fish CAM Group
ers CAM Searob
ins CAM Grunts
YUC Octopus CAM Butterf
ishes CAM Croake
rs YUCSquid
CAM Bigeyes CAM
Porgies YUC Thread
fins CAM Rays CAM Mojarr
a YUC Lobsters YUC
Crabs YUC Croak
ers CAM Grunts
CAM Snooks CAM Herrings YU
C Toadfishes C
AM Jacks CAM Lizzar
dfishes CAM Butterf
lyfishes CAM Goatfis
hes CAM Remor
as CAM Mojarr
as CAM Flatfish
es CAM Torped
os CAMCatfish
es CAM Herrin
gs CAM Pink shrimp
Juv CAM Sea tu
rtles Shrimps YUC Other
mollusks YUC
Porgies CAM Pink s
hrimp Adul C
AM Echinoderms
CAM White shrimp
CAM Brown shrimp
CAM Pufferfishes C
AM Sardines CA
M Parrotfishes
CAM Microcrustac
eans CAM Polych
aets CAM Mollus
ks CAM Zooplankton
CAM Microcrustac
ean YUC Anneli
ds YUC Zoopla
nkton YUC Phytop
lankton CAM Macro
algae CAM Seagr
ass CAM Phytop
lankton YUC Benthi
c prod. YUC Discar
ds CAM Detritu
s YUCDetritu
s CAMTotal
TL Total
Biomass change (%)
-40
-200
20
40
60
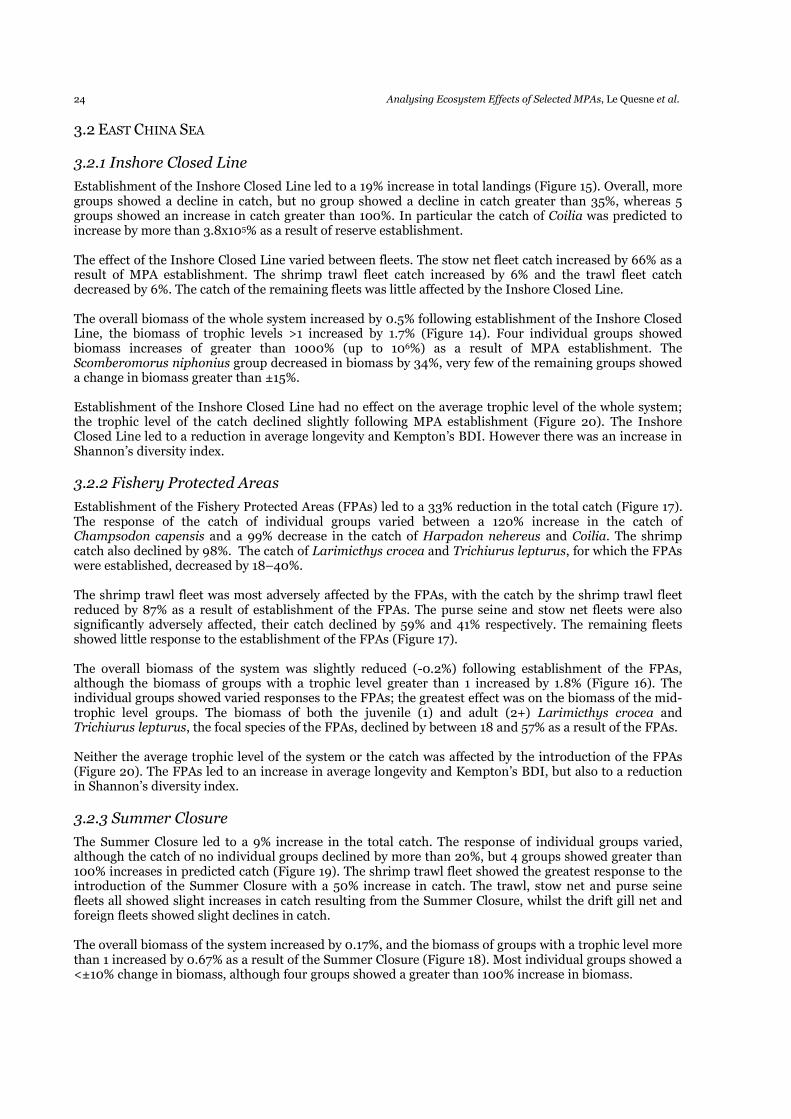
Figure 11.
Ca
mp
ech
e B
an
k –
MP
A 3
. P
erce
nt
cha
ng
e in
bio
ma
ss p
er g
rou
p a
cross
th
e w
hole
sy
stem
wit
h t
he
MP
A c
om
pa
red
to t
he
no-M
PA
si
mu
lati
on
. T
he
gro
up
s a
re o
rder
ed f
rom
lef
t to
rig
ht
in o
rder
of
dec
lin
ing
tro
ph
ic l
evel
. T
ota
l re
fers
to t
he
cha
ng
e in
bio
ma
ss f
or
the
wh
ole
sy
stem
, in
clu
din
g d
etri
tus.
Tota
l T
L r
efer
s to
th
e ch
an
ge
in b
iom
ass
for
the
wh
ole
sy
stem
, ex
clu
din
g g
rou
ps
wit
h a
tro
ph
ic lev
el o
f 1.
22 Analysing Ecosystem Effects of Selected MPAs, Le Quesne et al.
There was no change in the average trophic level of the system, or catch, as a result of establishing Campeche Bank MPA 3 (Figure 13). The establishment of MPA 3 led to an increase in the average longevity of the system and in Shannon’s diversity index, but Kempton’s BDI declined.
Sharks YUC
Snappers YUC
Red grouper Adul YUC
Sharks CAM
Red grouper Prea YUC
Red grouper Juv YUC
King mackerel YUC
Dolphins
Barracudas CAM
Octopus YUC
Jacks YUC
Seabirds
Red Snapper CAM
Mackerels CAM
Cuttlasfish CAM
Groupers CAM
Searobins CAM
Grunts YUC
Octopus CAM
Butterfishes CAM
Croakers YUC
Squid CAM
Bigeyes CAM
Porgies YUC
Threadfins CAM
Rays CAM
Mojarra YUC
Lobsters YUC
Crabs YUC
Croakers CAM
Grunts CAM
Snooks CAM
Herrings YUC
Toadfishes CAM
Jacks CAM
Lizzardfishes CAM
Butterflyfishes CAM
Goatfishes CAM
Remoras CAM
Mojarras CAM
Flatfishes CAM
Torpedos CAM
Catfishes CAM
Herrings CAM
Pink shrimp Juv CAM
Sea turtles
Shrimps YUC
Other mollusks YUC
Porgies CAM
Pink shrimp Adul CAM
Echinoderms CAM
White shrimp CAM
Brown shrimp CAM
Pufferfishes CAM
Sardines CAM
Parrotfishes CAM
Microcrustaceans CAM
Polychaets CAM
Mollusks CAM
Zooplankton CAM
Microcrustacean YUC
Annelids YUC
Zooplankton YUC
Phytoplankton CAM
Macroalgae CAM
Seagrass CAM
Phytoplankton YUC
Benthic prod. YUC
Discards CAM
Detritus YUC
Detritus CAM
Total
TL Total
Catch change (%)
-4
-2
0
2
4
6
8
10
12
14
16
18
Catch change (%)
-4-2024681012141618
Shrimp CAM
Art. Demersal CAM
Art. Pelagic CAM
Beach seine CAM
Octopus CAM
Art. Demersal YUC
Art. Pelagic YUC
Octopus YUC
Shrimp YUC
Lobster YUC
Profit change (%)
-20
-10
0
10
20
30
40
a)
b)
Figure 12. Campeche Bank – MPA 3. a) Percent change in catch per group with the MPA compared to the no-MPA simulation. The functional groups are ordered from left to right in order of declining trophic level. No catch is taken for groups with no symbol; b) Percent change in yield and profit per fleet with the MPA compared to the no-MPA simulation.
Analysing Ecosystem Effects of Selected MPAs, Le Quesne et al. 23
Figure 13. Campeche Bank – Ecosystem indices. The average trophic level, longevity, and Shannon-Weiner diversity index for the MPA and no-MPA simulations. Kempton’s biomass diversity index is a relative measure of biomass diversity between the MPA and no-MPA simulations. The values are given for the whole system, and for the trophic level the average trophic level of the catch.
Average trophic level
2.4
2.5
2.6
2.7
2.8
Without MPA
With MPA
Shannon's
Diversity Index
2.380
2.382
2.384
2.386
2.388
2.390
2.392
2.394
2.396
2.398
2.400
Average longevity
0.6020
0.6025
0.6030
0.6035
0.6040
0.6045
0.6050
MPA 1 MPA 2 MPA 3
System
Catch
System
Catch
System
Catch
Kempton's BDI
0.9984
0.9986
0.9988
0.9990
0.9992
0.9994
0.9996
0.9998
1.0000
1.0002
Relative measure
24 Analysing Ecosystem Effects of Selected MPAs, Le Quesne et al.
3.2 EAST CHINA SEA
3.2.1 Inshore Closed Line
Establishment of the Inshore Closed Line led to a 19% increase in total landings (Figure 15). Overall, more groups showed a decline in catch, but no group showed a decline in catch greater than 35%, whereas 5 groups showed an increase in catch greater than 100%. In particular the catch of Coilia was predicted to increase by more than 3.8x10⁵% as a result of reserve establishment. The effect of the Inshore Closed Line varied between fleets. The stow net fleet catch increased by 66% as a result of MPA establishment. The shrimp trawl fleet catch increased by 6% and the trawl fleet catch decreased by 6%. The catch of the remaining fleets was little affected by the Inshore Closed Line. The overall biomass of the whole system increased by 0.5% following establishment of the Inshore Closed Line, the biomass of trophic levels >1 increased by 1.7% (Figure 14). Four individual groups showed biomass increases of greater than 1000% (up to 106%) as a result of MPA establishment. The Scomberomorus niphonius group decreased in biomass by 34%, very few of the remaining groups showed a change in biomass greater than ±15%. Establishment of the Inshore Closed Line had no effect on the average trophic level of the whole system; the trophic level of the catch declined slightly following MPA establishment (Figure 20). The Inshore Closed Line led to a reduction in average longevity and Kempton’s BDI. However there was an increase in Shannon’s diversity index.
3.2.2 Fishery Protected Areas
Establishment of the Fishery Protected Areas (FPAs) led to a 33% reduction in the total catch (Figure 17). The response of the catch of individual groups varied between a 120% increase in the catch of Champsodon capensis and a 99% decrease in the catch of Harpadon nehereus and Coilia. The shrimp catch also declined by 98%. The catch of Larimicthys crocea and Trichiurus lepturus, for which the FPAs were established, decreased by 18–40%. The shrimp trawl fleet was most adversely affected by the FPAs, with the catch by the shrimp trawl fleet reduced by 87% as a result of establishment of the FPAs. The purse seine and stow net fleets were also significantly adversely affected, their catch declined by 59% and 41% respectively. The remaining fleets showed little response to the establishment of the FPAs (Figure 17). The overall biomass of the system was slightly reduced (-0.2%) following establishment of the FPAs, although the biomass of groups with a trophic level greater than 1 increased by 1.8% (Figure 16). The individual groups showed varied responses to the FPAs; the greatest effect was on the biomass of the mid-trophic level groups. The biomass of both the juvenile (1) and adult (2+) Larimicthys crocea and Trichiurus lepturus, the focal species of the FPAs, declined by between 18 and 57% as a result of the FPAs. Neither the average trophic level of the system or the catch was affected by the introduction of the FPAs (Figure 20). The FPAs led to an increase in average longevity and Kempton’s BDI, but also to a reduction in Shannon’s diversity index.
3.2.3 Summer Closure
The Summer Closure led to a 9% increase in the total catch. The response of individual groups varied, although the catch of no individual groups declined by more than 20%, but 4 groups showed greater than 100% increases in predicted catch (Figure 19). The shrimp trawl fleet showed the greatest response to the introduction of the Summer Closure with a 50% increase in catch. The trawl, stow net and purse seine fleets all showed slight increases in catch resulting from the Summer Closure, whilst the drift gill net and foreign fleets showed slight declines in catch. The overall biomass of the system increased by 0.17%, and the biomass of groups with a trophic level more than 1 increased by 0.67% as a result of the Summer Closure (Figure 18). Most individual groups showed a <±10% change in biomass, although four groups showed a greater than 100% increase in biomass.
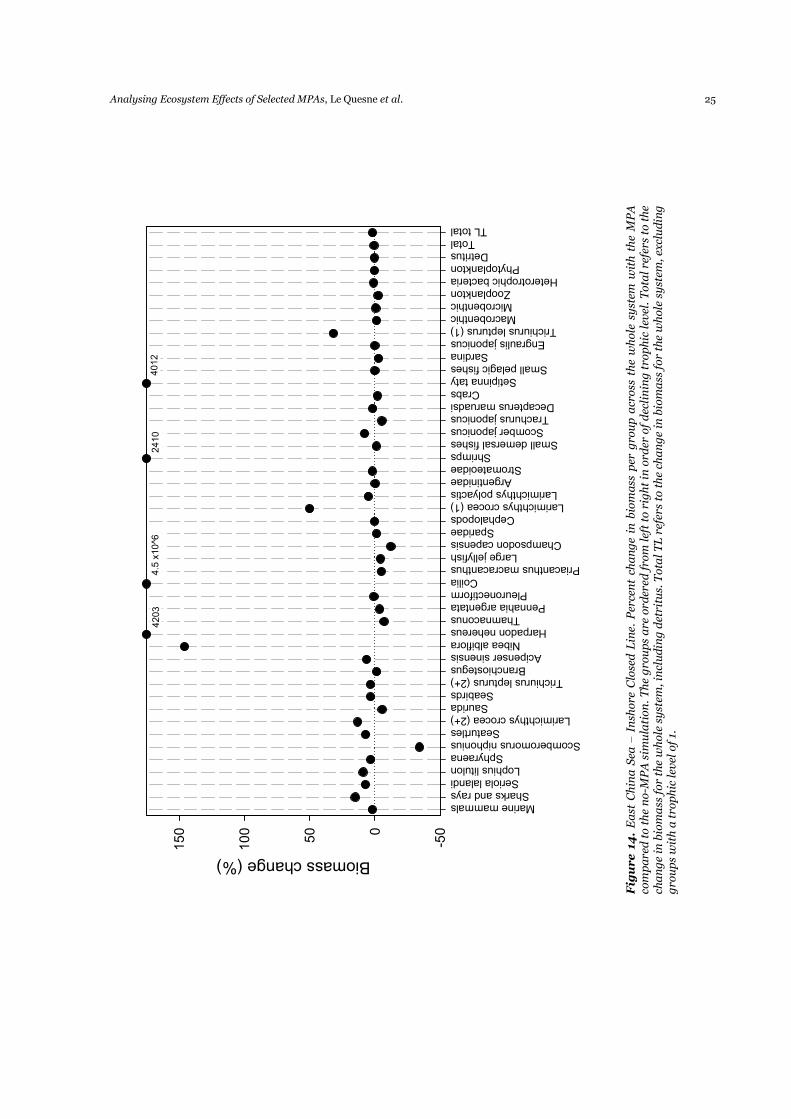
Analysing Ecosystem Effects of Selected MPAs, Le Quesne et al. 25
Figure 14.
Ea
st C
hin
a S
ea –
In
shore
Clo
sed
Lin
e. P
erce
nt
cha
ng
e in
bio
ma
ss p
er g
rou
p a
cross
th
e w
hole
sy
stem
wit
h t
he
MP
A
com
pa
red
to
th
e n
o-M
PA
sim
ula
tion
. T
he
gro
up
s a
re o
rder
ed f
rom
lef
t to
rig
ht
in o
rder
of
dec
lin
ing
tro
ph
ic l
evel
. T
ota
l re
fers
to t
he
cha
ng
e in
bio
ma
ss f
or
the
wh
ole
sy
stem
, in
clu
din
g d
etri
tus.
Tota
l T
L r
efer
s to
th
e ch
an
ge
in b
iom
ass
for
the
wh
ole
sy
stem
, ex
clu
din
g
gro
up
s w
ith
a t
rop
hic
lev
el o
f 1.
Marine mammalsSharks and raysSeriola lalandiLophius litulon
SphyraenaScomberomorus niphonius
SeaturtlesLarimichthys crocea (2+)
SauridaSeabirds
Trichiurus lepturus (2+)Branchiostegus
Acipenser sinensisNibea albiflora
Harpadon nehereusThamnaconus
Pennahia argentataPleuronectiform
CoiliaPriacanthus macracanthus
Large jellyfishChampsodon capensis
SparidaeCephalopods
Larimichthys crocea (1)Larimichthys polyactis
ArgentinidaeStromateoidae
ShrimpsSmall demersal fishesScomber japonicusTrachurus japonicusDecapterus maruadsi
CrabsSetipinna taty
Small pelagic fishesSardina
Engraulis japonicusTrichiurus lepturus (1)
MacrobenthicMicrobenthicZooplankton
Heterotrophic bacteriaPhytoplankton
DetritusTotal
TL total
Biomass change (%)
-500
50
100
150
4.5 x10^6
4012
4203
2410
26 Analysing Ecosystem Effects of Selected MPAs, Le Quesne et al.
Marine mammals
Sharks and rays
Seriola lalandi
Lophius litulon
Sphyraena
Scomberomorus niphonius
Seaturtles
Larimichthys crocea (2+)
Saurida
Seabirds
Trichiurus lepturus (2+)
Branchiostegus
Acipenser sinensis
Nibea albiflora
Harpadon nehereus
Thamnaconus
Pennahia argentata
Pleuronectiform
Coilia
Priacanthus macracanthus
Large jellyfish
Champsodon capensis
Sparidae
Cephalopods
Larimichthys crocea (1)
Larimichthys polyactis
Argentinidae
Stromateoidae
Shrimps
Small demersal fishes
Scomber japonicus
Trachurus japonicus
Decapterus maruadsi
Crabs
Setipinna taty
Small pelagic fishes
Sardina
Engraulis japonicus
Trichiurus lepturus (1)
Macrobenthic
Microbenthic
Zooplankton
Heterotrophic bacteria
Phytoplankton
Detritus
Total
Catch change (%)
-40
-20
0
20
40
60
80
100 3.8x10^5
Trawl Stow net Drift gill net Purse seine Shrimp trawl Foreign Vessels
Catch change (%)
-20
0
20
40
60
80
5475 2849378
Figure 15. East China Sea – Inshore Closed Line. a) Percent change in catch per group with the MPA compared to the no-MPA simulation. The functional groups are ordered from left to right in order of declining trophic level. No catch is taken for groups with no symbol; b) Percent change in yield per fleet with the MPA compared to the no-MPA simulation.
a)
b)
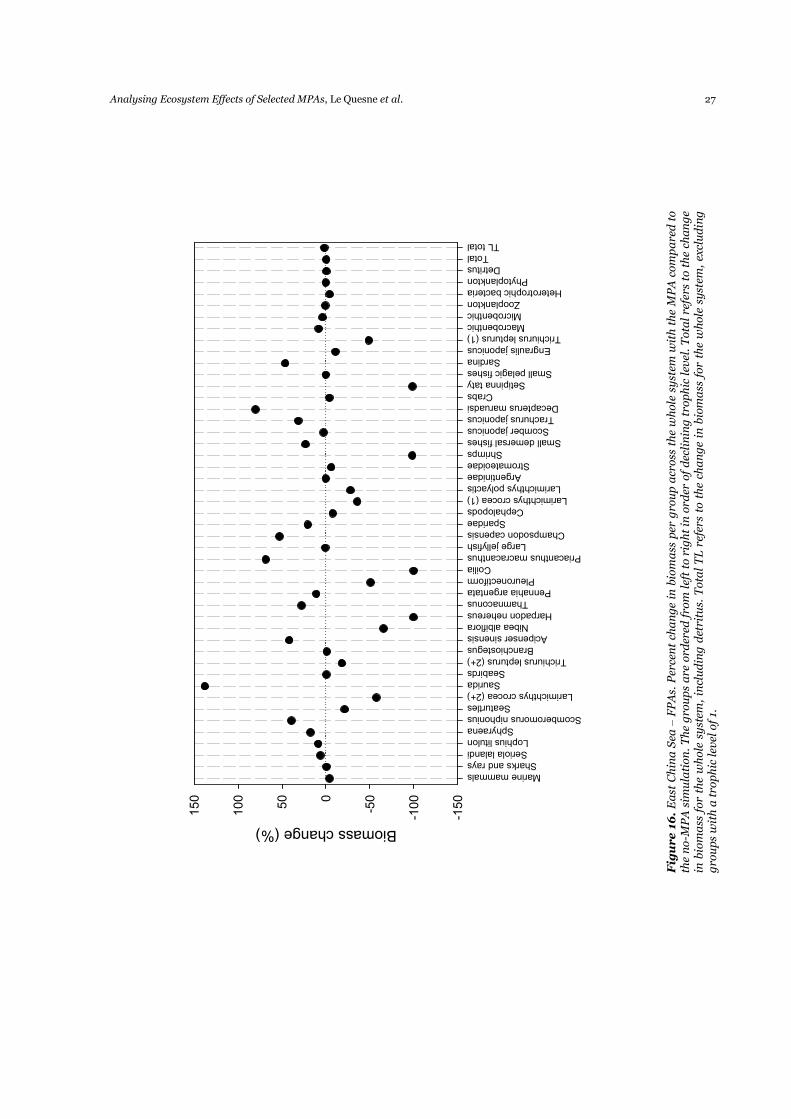
Analysing Ecosystem Effects of Selected MPAs, Le Quesne et al. 27
Figure 16.
Ea
st C
hin
a S
ea –
FP
As.
Per
cen
t ch
an
ge
in b
iom
ass
per
gro
up
acr
oss
th
e w
hole
sy
stem
wit
h t
he
MP
A c
om
pa
red
to
the
no-M
PA
sim
ula
tion
. T
he
gro
up
s a
re o
rder
ed f
rom
lef
t to
rig
ht
in o
rder
of
dec
lin
ing
tro
ph
ic l
evel
. T
ota
l re
fers
to t
he
cha
ng
e in
bio
ma
ss f
or
the
wh
ole
sy
stem
, in
clu
din
g d
etri
tus.
Tota
l T
L r
efer
s to
th
e ch
an
ge
in b
iom
ass
for
the
wh
ole
sy
stem
, ex
clu
din
g
gro
up
s w
ith
a t
rop
hic
lev
el o
f 1.
Marine mammals
Sharks and rays
Seriola lalandi
Lophius litulon
Sphyraena
Scomberomorus niphonius
Seaturtles
Larimichthys crocea (2+)
Saurida
Seabirds
Trichiurus lepturus (2+)
Branchiostegus
Acipenser sinensis
Nibea albiflora
Harpadon nehereus
Thamnaconus
Pennahia argentata
Pleuronectiform
Coilia
Priacanthus macracanthus
Large jellyfish
Champsodon capensis
Sparidae
Cephalopods
Larimichthys crocea (1)
Larimichthys polyactis
Argentinidae
Stromateoidae
Shrimps
Small demersal fishes
Scomber japonicus
Trachurus japonicus
Decapterus maruadsi
Crabs
Setipinna taty
Small pelagic fishes
Sardina
Engraulis japonicus
Trichiurus lepturus (1)
Macrobenthic
Microbenthic
Zooplankton
Heterotrophic bacteria
Phytoplankton
Detritus
Total
TL total
Biomass change (%)
-150
-100
-500
50
100
150
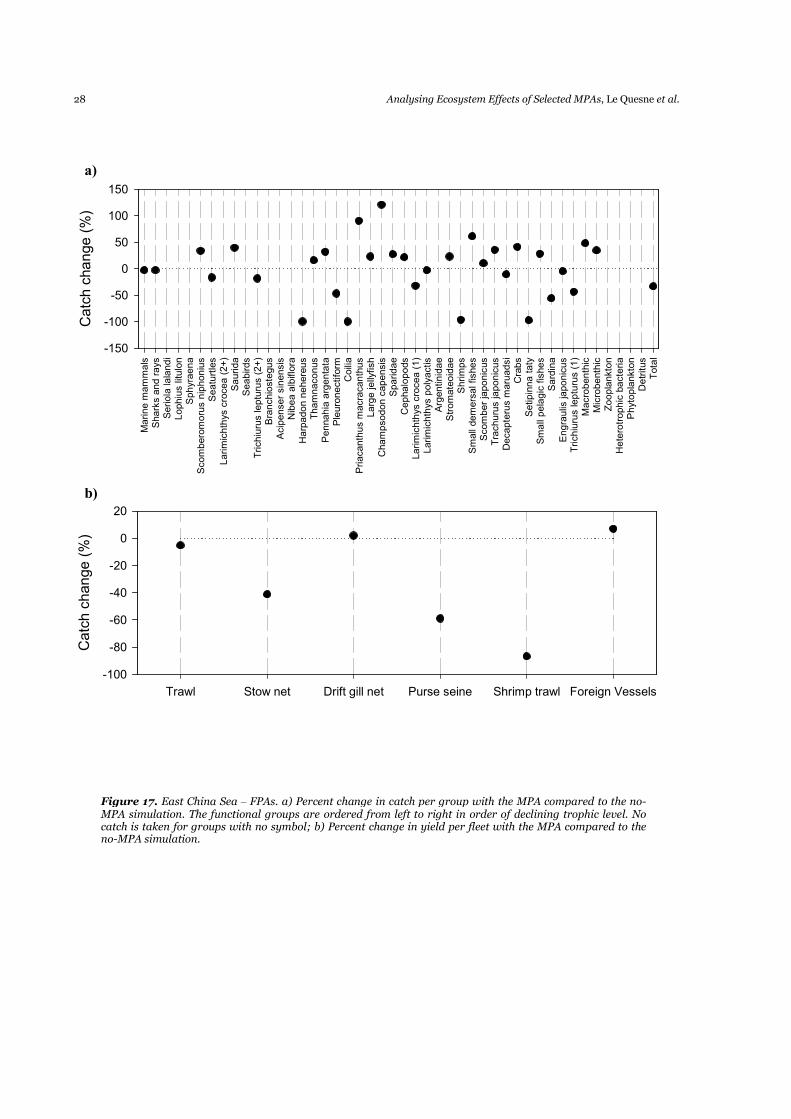
28 Analysing Ecosystem Effects of Selected MPAs, Le Quesne et al.
Marine mammals
Sharks and rays
Seriola lalandi
Lophius litulon
Sphyraena
Scomberomorus niphonius
Seaturtles
Larimichthys crocea (2+)
Saurida
Seabirds
Trichiurus lepturus (2+)
Branchiostegus
Acipenser sinensis
Nibea albiflora
Harpadon nehereus
Thamnaconus
Pennahia argentata
Pleuronectiform
Coilia
Priacanthus macracanthus
Large jellyfish
Champsodon capensis
Sparidae
Cephalopods
Larimichthys crocea (1)
Larimichthys polyactis
Argentinidae
Stromateoidae
Shrimps
Small demersal fishes
Scomber japonicus
Trachurus japonicus
Decapterus maruadsi
Crabs
Setipinna taty
Small pelagic fishes
Sardina
Engraulis japonicus
Trichiurus lepturus (1)
Macrobenthic
Microbenthic
Zooplankton
Heterotrophic bacteria
Phytoplankton
Detritus
Total
Catch change (%)
-150
-100
-50
0
50
100
150
Trawl Stow net Drift gill net Purse seine Shrimp trawl Foreign Vessels
Catch change (%)
-100
-80
-60
-40
-20
0
20
a)
b)
Figure 17. East China Sea – FPAs. a) Percent change in catch per group with the MPA compared to the no-MPA simulation. The functional groups are ordered from left to right in order of declining trophic level. No catch is taken for groups with no symbol; b) Percent change in yield per fleet with the MPA compared to the no-MPA simulation.
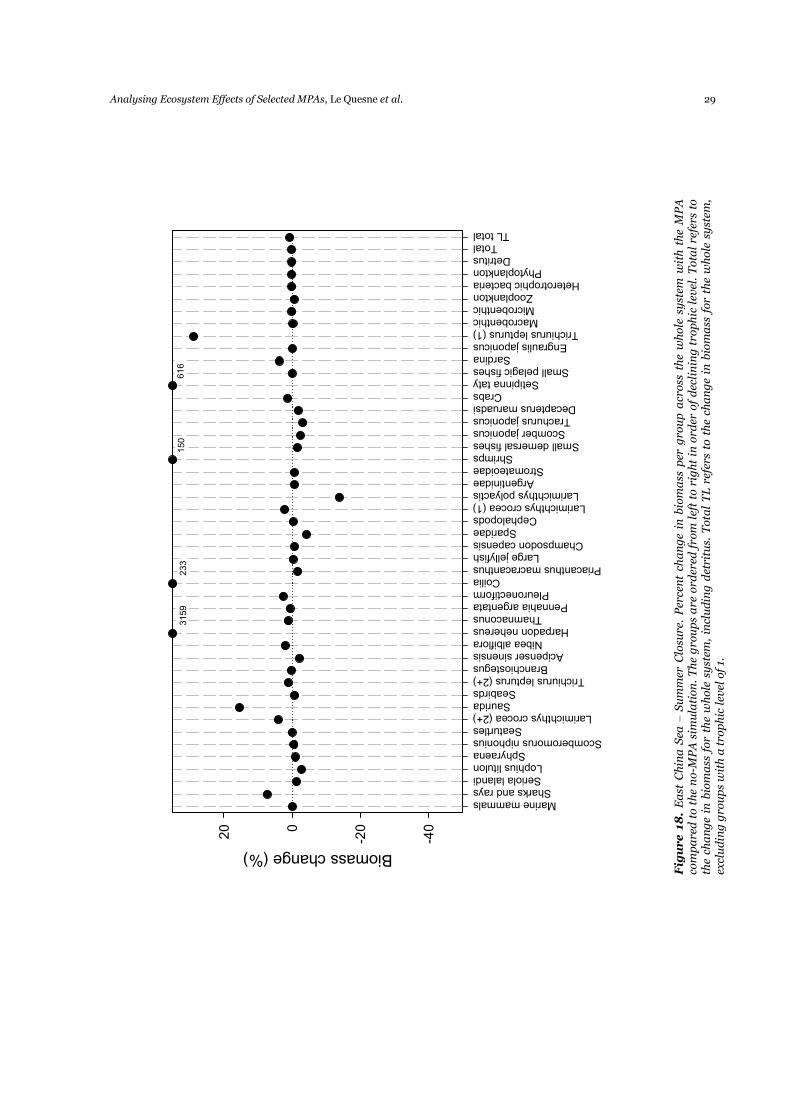
Analysing Ecosystem Effects of Selected MPAs, Le Quesne et al. 29
Figure 18.
Ea
st C
hin
a S
ea –
Su
mm
er C
losu
re.
Per
cen
t ch
an
ge
in b
iom
ass
per
gro
up
acr
oss
th
e w
hole
sy
stem
wit
h t
he
MP
A
com
pa
red
to t
he
no-M
PA
sim
ula
tion
. T
he
gro
up
s a
re o
rder
ed f
rom
lef
t to
rig
ht
in o
rder
of
dec
lin
ing
tro
ph
ic l
evel
. T
ota
l re
fers
to
the
cha
ng
e in
bio
ma
ss f
or
the
wh
ole
sy
stem
, in
clu
din
g d
etri
tus.
Tota
l T
L r
efer
s to
th
e ch
an
ge
in b
iom
ass
for
the
wh
ole
sy
stem
, ex
clu
din
g g
rou
ps
wit
h a
tro
ph
ic lev
el o
f 1.
Marine mammalsSharks and raysSeriola lalandiLophius litulon
SphyraenaScomberomorus niphonius
SeaturtlesLarimichthys crocea (2+)
SauridaSeabirds
Trichiurus lepturus (2+)Branchiostegus
Acipenser sinensisNibea albiflora
Harpadon nehereusThamnaconus
Pennahia argentataPleuronectiform
CoiliaPriacanthus macracanthus
Large jellyfishChampsodon capensis
SparidaeCephalopods
Larimichthys crocea (1)Larimichthys polyactis
ArgentinidaeStromateoidae
ShrimpsSmall demersal fishesScomber japonicusTrachurus japonicusDecapterus maruadsi
CrabsSetipinna taty
Small pelagic fishesSardina
Engraulis japonicusTrichiurus lepturus (1)
MacrobenthicMicrobenthicZooplankton
Heterotrophic bacteriaPhytoplankton
DetritusTotal
TL total
Biomass change (%)
-40
-200
20
233
616
3159
150
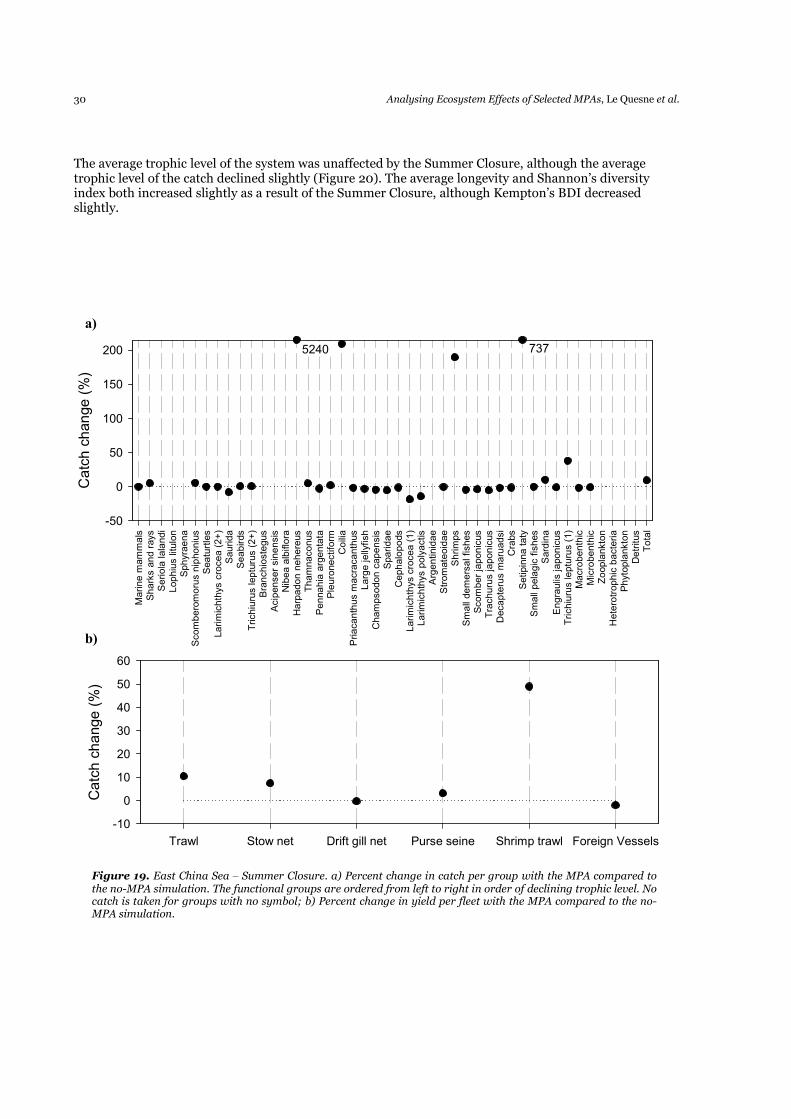
30 Analysing Ecosystem Effects of Selected MPAs, Le Quesne et al.
The average trophic level of the system was unaffected by the Summer Closure, although the average trophic level of the catch declined slightly (Figure 20). The average longevity and Shannon’s diversity index both increased slightly as a result of the Summer Closure, although Kempton’s BDI decreased slightly.
Marine mammals
Sharks and rays
Seriola lalandi
Lophius litulon
Sphyraena
Scomberomorus niphonius
Seaturtles
Larimichthys crocea (2+)
Saurida
Seabirds
Trichiurus lepturus (2+)
Branchiostegus
Acipenser sinensis
Nibea albiflora
Harpadon nehereus
Thamnaconus
Pennahia argentata
Pleuronectiform
Coilia
Priacanthus macracanthus
Large jellyfish
Champsodon capensis
Sparidae
Cephalopods
Larimichthys crocea (1)
Larimichthys polyactis
Argentinidae
Stromateoidae
Shrimps
Small demersal fishes
Scomber japonicus
Trachurus japonicus
Decapterus maruadsi
Crabs
Setipinna taty
Small pelagic fishes
Sardina
Engraulis japonicus
Trichiurus lepturus (1)
Macrobenthic
Microbenthic
Zooplankton
Heterotrophic bacteria
Phytoplankton
Detritus
Total
Catch change (%)
-50
0
50
100
150
200
Trawl Stow net Drift gill net Purse seine Shrimp trawl Foreign Vessels
Catch change (%)
-10
0
10
20
30
40
50
60
5240 737
a)
b)
Figure 19. East China Sea – Summer Closure. a) Percent change in catch per group with the MPA compared to the no-MPA simulation. The functional groups are ordered from left to right in order of declining trophic level. No catch is taken for groups with no symbol; b) Percent change in yield per fleet with the MPA compared to the no-MPA simulation.
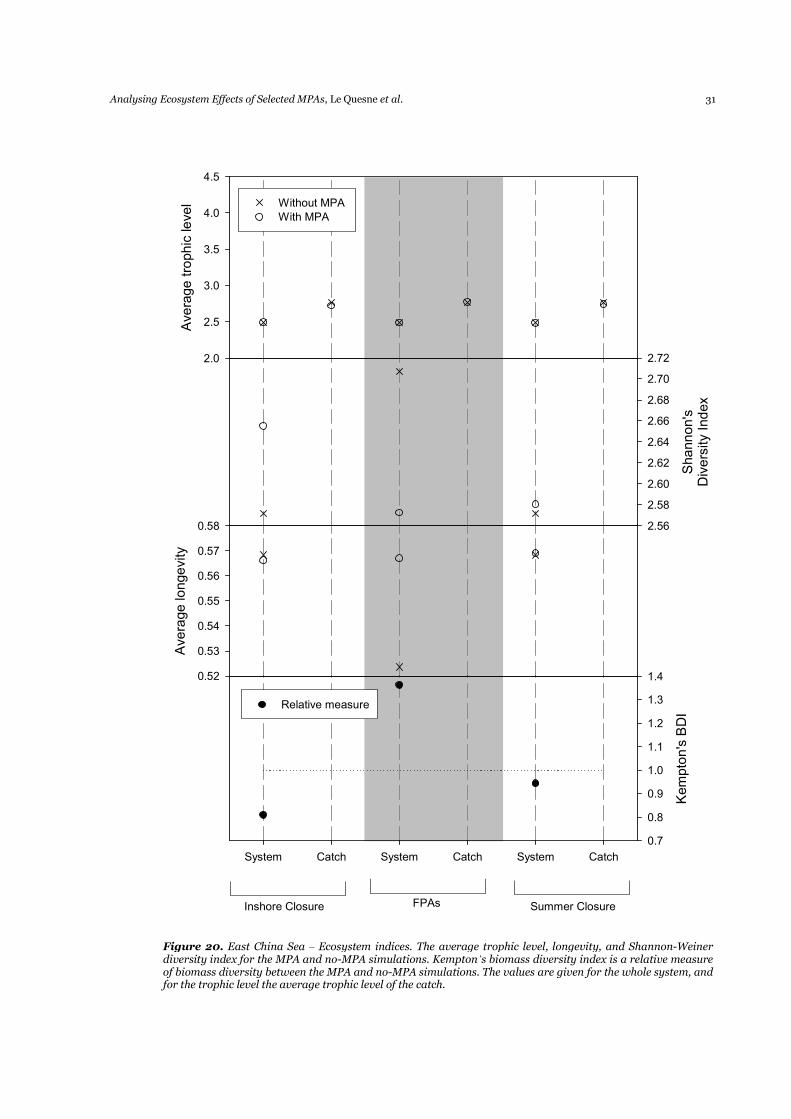
Analysing Ecosystem Effects of Selected MPAs, Le Quesne et al. 31
Figure 20. East China Sea – Ecosystem indices. The average trophic level, longevity, and Shannon-Weiner diversity index for the MPA and no-MPA simulations. Kempton’s biomass diversity index is a relative measure of biomass diversity between the MPA and no-MPA simulations. The values are given for the whole system, and for the trophic level the average trophic level of the catch.
Average trophic level
2.0
2.5
3.0
3.5
4.0
4.5
Without MPA
With MPA
Shannon's
Diversity Index
2.56
2.58
2.60
2.62
2.64
2.66
2.68
2.70
2.72
Average longevity
0.52
0.53
0.54
0.55
0.56
0.57
0.58
Inshore Closure FPAs Summer Closure
System Catch System Catch System Catch
Kempton's BDI
0.7
0.8
0.9
1.0
1.1
1.2
1.3
1.4
Relative measure
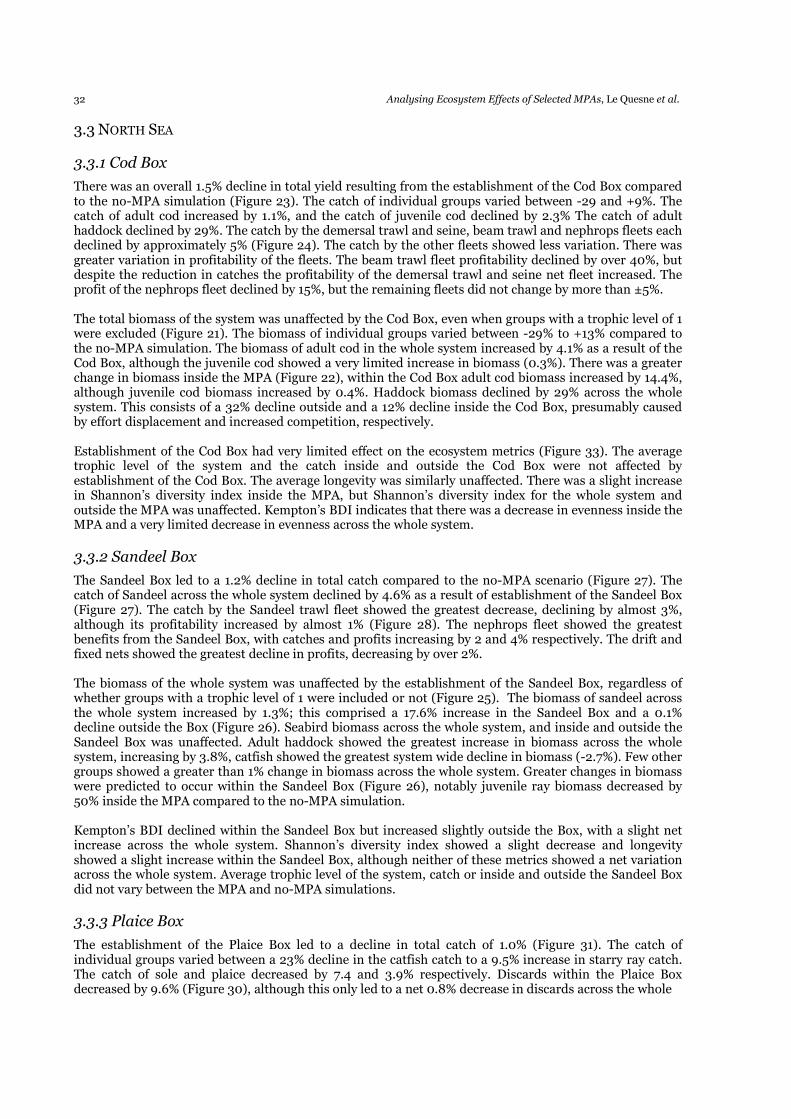
32 Analysing Ecosystem Effects of Selected MPAs, Le Quesne et al.
3.3 NORTH SEA
3.3.1 Cod Box
There was an overall 1.5% decline in total yield resulting from the establishment of the Cod Box compared to the no-MPA simulation (Figure 23). The catch of individual groups varied between -29 and +9%. The catch of adult cod increased by 1.1%, and the catch of juvenile cod declined by 2.3% The catch of adult haddock declined by 29%. The catch by the demersal trawl and seine, beam trawl and nephrops fleets each declined by approximately 5% (Figure 24). The catch by the other fleets showed less variation. There was greater variation in profitability of the fleets. The beam trawl fleet profitability declined by over 40%, but despite the reduction in catches the profitability of the demersal trawl and seine net fleet increased. The profit of the nephrops fleet declined by 15%, but the remaining fleets did not change by more than ±5%. The total biomass of the system was unaffected by the Cod Box, even when groups with a trophic level of 1 were excluded (Figure 21). The biomass of individual groups varied between -29% to +13% compared to the no-MPA simulation. The biomass of adult cod in the whole system increased by 4.1% as a result of the Cod Box, although the juvenile cod showed a very limited increase in biomass (0.3%). There was a greater change in biomass inside the MPA (Figure 22), within the Cod Box adult cod biomass increased by 14.4%, although juvenile cod biomass increased by 0.4%. Haddock biomass declined by 29% across the whole system. This consists of a 32% decline outside and a 12% decline inside the Cod Box, presumably caused by effort displacement and increased competition, respectively. Establishment of the Cod Box had very limited effect on the ecosystem metrics (Figure 33). The average trophic level of the system and the catch inside and outside the Cod Box were not affected by establishment of the Cod Box. The average longevity was similarly unaffected. There was a slight increase in Shannon’s diversity index inside the MPA, but Shannon’s diversity index for the whole system and outside the MPA was unaffected. Kempton’s BDI indicates that there was a decrease in evenness inside the MPA and a very limited decrease in evenness across the whole system.
3.3.2 Sandeel Box
The Sandeel Box led to a 1.2% decline in total catch compared to the no-MPA scenario (Figure 27). The catch of Sandeel across the whole system declined by 4.6% as a result of establishment of the Sandeel Box (Figure 27). The catch by the Sandeel trawl fleet showed the greatest decrease, declining by almost 3%, although its profitability increased by almost 1% (Figure 28). The nephrops fleet showed the greatest benefits from the Sandeel Box, with catches and profits increasing by 2 and 4% respectively. The drift and fixed nets showed the greatest decline in profits, decreasing by over 2%. The biomass of the whole system was unaffected by the establishment of the Sandeel Box, regardless of whether groups with a trophic level of 1 were included or not (Figure 25). The biomass of sandeel across the whole system increased by 1.3%; this comprised a 17.6% increase in the Sandeel Box and a 0.1% decline outside the Box (Figure 26). Seabird biomass across the whole system, and inside and outside the Sandeel Box was unaffected. Adult haddock showed the greatest increase in biomass across the whole system, increasing by 3.8%, catfish showed the greatest system wide decline in biomass (-2.7%). Few other groups showed a greater than 1% change in biomass across the whole system. Greater changes in biomass were predicted to occur within the Sandeel Box (Figure 26), notably juvenile ray biomass decreased by 50% inside the MPA compared to the no-MPA simulation. Kempton’s BDI declined within the Sandeel Box but increased slightly outside the Box, with a slight net increase across the whole system. Shannon’s diversity index showed a slight decrease and longevity showed a slight increase within the Sandeel Box, although neither of these metrics showed a net variation across the whole system. Average trophic level of the system, catch or inside and outside the Sandeel Box did not vary between the MPA and no-MPA simulations.
3.3.3 Plaice Box
The establishment of the Plaice Box led to a decline in total catch of 1.0% (Figure 31). The catch of individual groups varied between a 23% decline in the catfish catch to a 9.5% increase in starry ray catch. The catch of sole and plaice decreased by 7.4 and 3.9% respectively. Discards within the Plaice Box decreased by 9.6% (Figure 30), although this only led to a net 0.8% decrease in discards across the whole
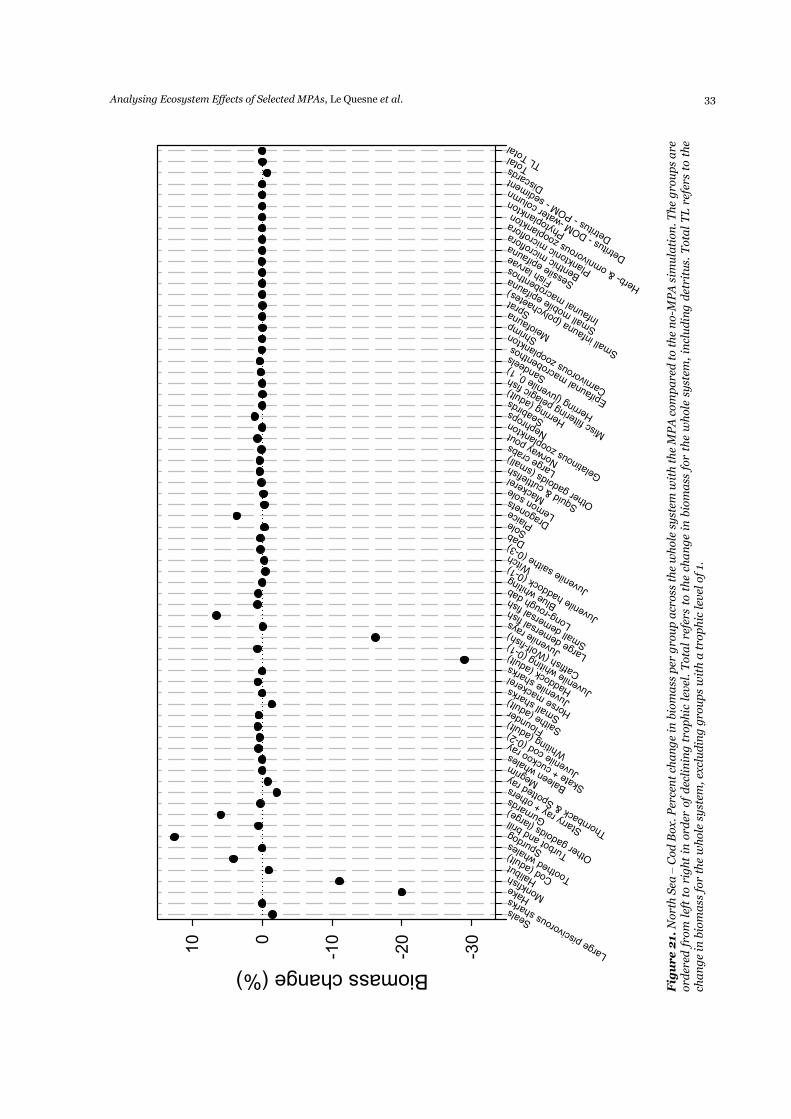
Analysing Ecosystem Effects of Selected MPAs, Le Quesne et al. 33
Seals
Large piscivorous sharks
Hake Mo
nkfish Ha
libut
Cod (adult)
Toothed whales Sp
urdog
Turbot and brill
Other gadoids (large)
Gurnards
Starry ray + others
Thornback & Spotted ray Me
grim
Baleen w
hales
Skate + cuckoo ray
Juvenile cod (0-2)
Whiting (adult)
Flounder
Saithe (adult)
Small sharks
Horse mackerel
Juvenile sharks
Haddock (adult)
Juvenile w
hiting (0-1)
Catfish (Wolf-fish)
Juvenile rays
Large demersal fish
Small demersal fish
Long-rough dab
Blue w
hiting
Juvenile haddock (0-1) Witch
Juvenile saithe (0-3)Dab Sole Plaice
Dragonets
Lemon sole Ma
ckerel
Squid & cuttlefish
Other gadoids (small)
Large crabs
Norway pout
Gelatinous zooplankton
Nephrops
Seabirds
Herring (adult)
Misc filtering pelagic fish
Herring (juvenile 0, 1) Sa
ndeels
Epifaunal macrobenthos
Carnivorous zooplankton Shrimp
Meiofauna Sprat
Small infauna (polychaetes)
Small mobile epifauna
Infaunal macrobenthos
Fish larvae
Sessile epifauna
Benthic microflora
Planktonic microflora
Herb- & om
nivorous zooplankton
Phytoplankton
Detritus - D
OM -water column
Detritus - P
OM - sediment
Discards Total TL
Total
Biomass change (%)
-30
-20
-100
10
Figure 21.
Nort
h S
ea –
Cod
Box. P
erce
nt
cha
ng
e in
bio
ma
ss p
er g
rou
p a
cross
th
e w
hole
sy
stem
wit
h t
he
MP
A c
om
pa
red
to t
he
no-M
PA
sim
ula
tion
. T
he
gro
up
s a
re
ord
ered
fro
m l
eft
to r
igh
t in
ord
er o
f d
ecli
nin
g t
rop
hic
lev
el.
Tota
l re
fers
to t
he
cha
ng
e in
bio
ma
ss f
or
the
wh
ole
sy
stem
, in
clu
din
g d
etri
tus.
Tota
l T
L r
efer
s to
th
e ch
an
ge
in b
iom
ass
for
the
wh
ole
sy
stem
, ex
clu
din
g g
rou
ps
wit
h a
tro
ph
ic lev
el o
f 1.
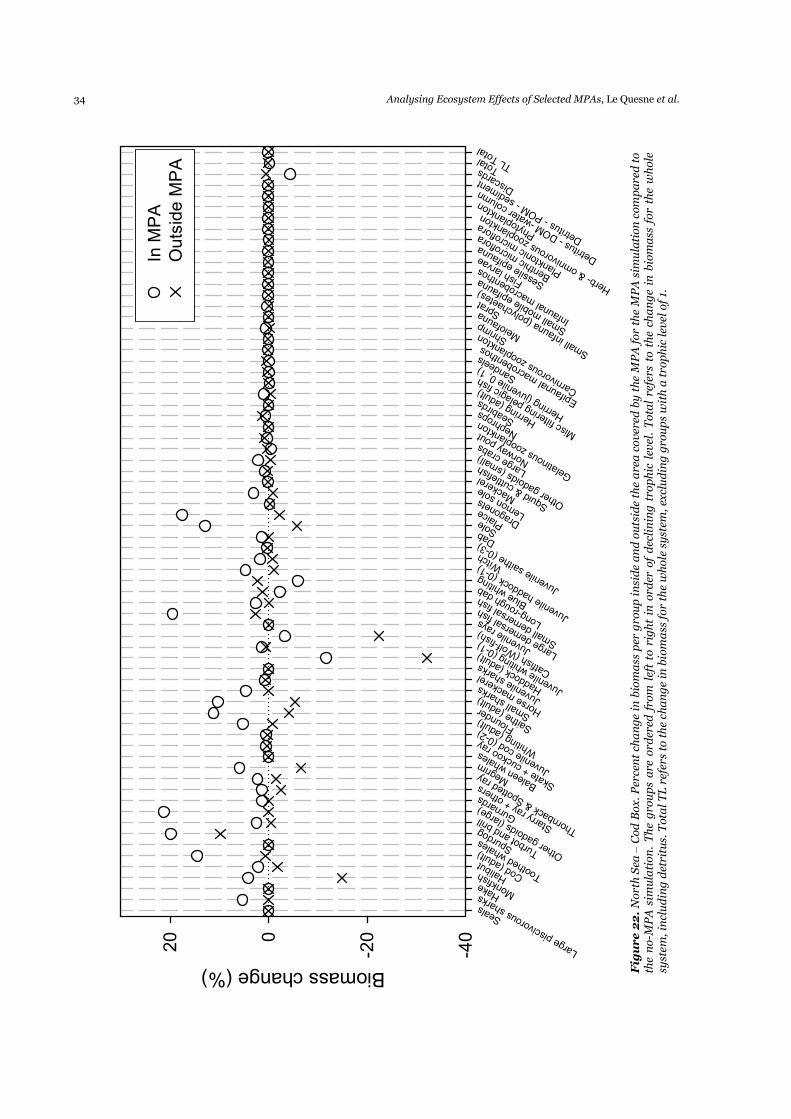
34 Analysing Ecosystem Effects of Selected MPAs, Le Quesne et al.
Seals
Large piscivorous sharks
Hake Mo
nkfish Ha
libut
Cod (adult)
Toothed whales Sp
urdog
Turbot and brill
Other gadoids (large)
Gurnards
Starry ray + others
Thornback & Spotted ray Me
grim
Baleen w
hales
Skate + cuckoo ray
Juvenile cod (0-2)
Whiting (adult) Flo
under
Saithe (adult)
Small sharks
Horse mackerel
Juvenile sharks
Haddock (adult)
Juvenile w
hiting (0-1)
Catfish (Wolf-fish)
Juvenile rays
Large demersal fish
Small demersal fish
Long-rough dab
Blue w
hiting
Juvenile haddock (0-1) Witch
Juvenile saithe (0-3)Dab Sole Plaice
Dragonets
Lemon sole Ma
ckerel
Squid & cuttlefish
Other gadoids (small)
Large crabs
Norway pout
Gelatinous zooplankton
Nephrops
Seabirds
Herring (adult)
Misc filtering pelagic fish
Herring (juvenile 0, 1) Sa
ndeels
Epifaunal macrobenthos
Carnivorous zooplankton Shrimp
Meiofauna Sprat
Small infauna (polychaetes)
Small mobile epifauna
Infaunal macrobenthos
Fish larvae
Sessile epifauna
Benthic microflora
Planktonic microflora
Herb- & omnivorous zooplankton
Phytoplankton
Detritus - D
OM -water column
Detritus - P
OM - sediment
Discards Total TL
Total
Biomass change (%)
-40
-200
20
In MPA
Outside MPA
Figure 22.
Nort
h S
ea –
Cod
Box. P
erce
nt
cha
ng
e in
bio
ma
ss p
er g
rou
p i
nsi
de
an
d o
uts
ide
the
are
a c
over
ed b
y t
he
MP
A f
or
the
MP
A s
imu
lati
on
com
pa
red
to
th
e n
o-M
PA
sim
ula
tion
. T
he
gro
up
s a
re o
rder
ed f
rom
lef
t to
rig
ht
in o
rder
of
dec
lin
ing
tro
ph
ic l
evel
. T
ota
l re
fers
to t
he
cha
ng
e in
bio
ma
ss f
or
the
wh
ole
sy
stem
, in
clu
din
g d
etri
tus.
Tota
l T
L r
efer
s to
th
e ch
an
ge
in b
iom
ass
for
the
wh
ole
sy
stem
, ex
clu
din
g g
rou
ps
wit
h a
tro
ph
ic lev
el o
f 1.
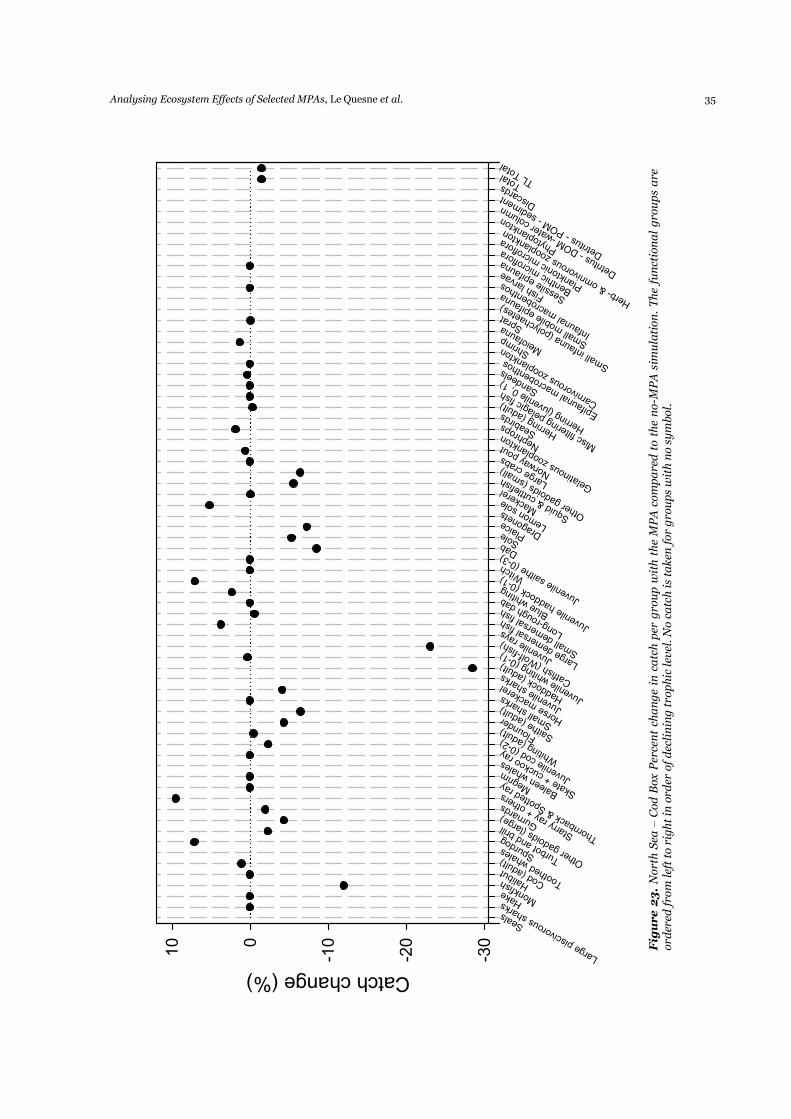
Analysing Ecosystem Effects of Selected MPAs, Le Quesne et al. 35
Seals
Large piscivorous sharks
Hake Mo
nkfish Ha
libut
Cod (adult)
Toothed whales Sp
urdog
Turbot and brill
Other gadoids (large)
Gurnards
Starry ray + others
Thornback & Spotted ray Me
grim
Baleen w
hales
Skate + cuckoo ray
Juvenile cod (0-2)
Whiting (adult)
Flounder
Saithe (adult)
Small sharks
Horse mackerel
Juvenile sharks
Haddock (adult)
Juvenile w
hiting (0-1)
Catfish (Wolf-fish)
Juvenile rays
Large demersal fish
Small demersal fish
Long-rough dab
Blue w
hiting
Juvenile haddock (0-1) Witch
Juvenile saithe (0-3)Dab Sole Plaice
Dragonets
Lemon sole Ma
ckerel
Squid & cuttlefish
Other gadoids (small)
Large crabs
Norway pout
Gelatinous zooplankton
Nephrops
Seabirds
Herring (adult)
Misc filtering pelagic fish
Herring (juvenile 0, 1) Sa
ndeels
Epifaunal macrobenthos
Carnivorous zooplankton Shrimp
Meiofauna Sprat
Small infauna (polychaetes)
Small mobile epifauna
Infaunal macrobenthos
Fish larvae
Sessile epifauna
Benthic microflora
Planktonic microflora
Herb- & om
nivorous zooplankton
Phytoplankton
Detritus - D
OM -water column
Detritus - P
OM - sediment
Discards Total TL
Total
Catch change (%)
-30
-20
-100
10 Figure 23.
Nort
h S
ea –
Cod
Box P
erce
nt
cha
ng
e in
ca
tch
per
gro
up
wit
h t
he
MP
A c
om
pa
red
to t
he
no-M
PA
sim
ula
tion
. T
he
fun
ctio
na
l g
rou
ps
are
ord
ered
fro
m lef
t to
rig
ht
in o
rder
of
dec
lin
ing
tro
ph
ic lev
el. N
o c
atc
h i
s ta
ken
for
gro
up
s w
ith
no s
ym
bol.
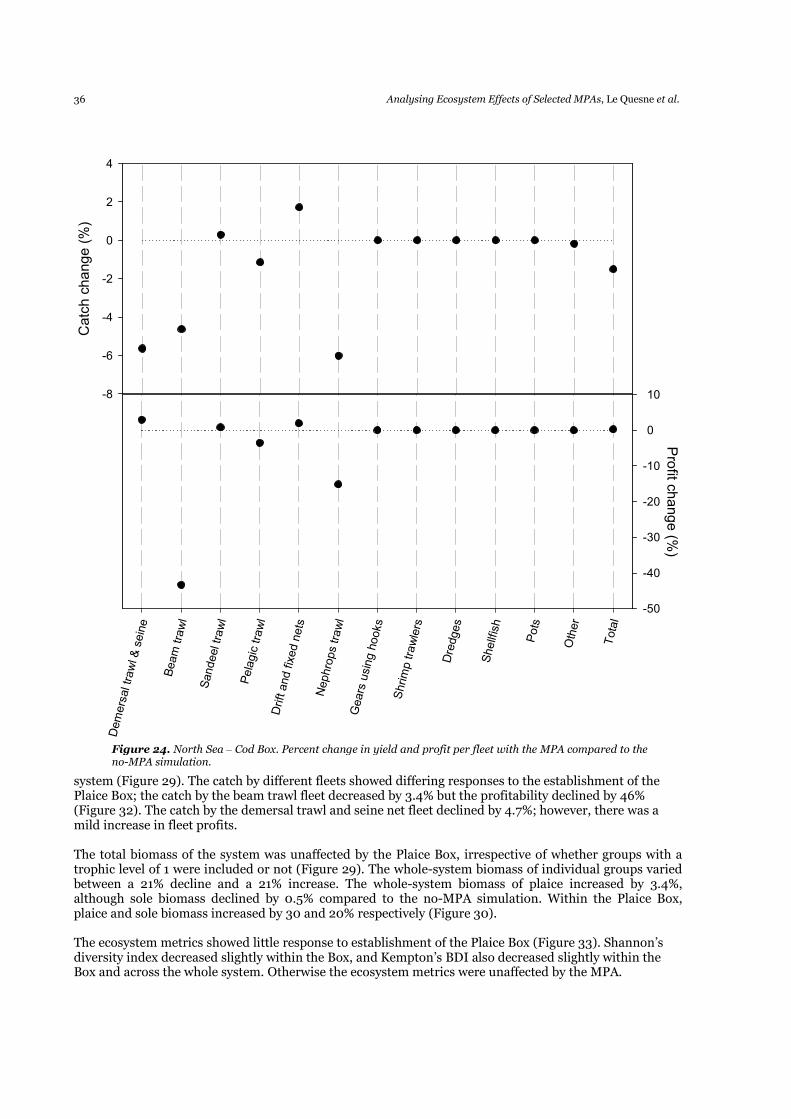
36 Analysing Ecosystem Effects of Selected MPAs, Le Quesne et al.
system (Figure 29). The catch by different fleets showed differing responses to the establishment of the Plaice Box; the catch by the beam trawl fleet decreased by 3.4% but the profitability declined by 46% (Figure 32). The catch by the demersal trawl and seine net fleet declined by 4.7%; however, there was a mild increase in fleet profits. The total biomass of the system was unaffected by the Plaice Box, irrespective of whether groups with a trophic level of 1 were included or not (Figure 29). The whole-system biomass of individual groups varied between a 21% decline and a 21% increase. The whole-system biomass of plaice increased by 3.4%, although sole biomass declined by 0.5% compared to the no-MPA simulation. Within the Plaice Box, plaice and sole biomass increased by 30 and 20% respectively (Figure 30). The ecosystem metrics showed little response to establishment of the Plaice Box (Figure 33). Shannon’s diversity index decreased slightly within the Box, and Kempton’s BDI also decreased slightly within the Box and across the whole system. Otherwise the ecosystem metrics were unaffected by the MPA.
Catch change (%)
-8
-6
-4
-2
0
2
4
Demersal trawl & seine
Beam trawl
Sandeel trawl
Pelagic trawl
Drift and fixed nets
Nephrops trawl
Gears using hooks
Shrimp trawlers
Dredges
Shellfish
Pots
Other
Total
Profit c
hange (%
)
-50
-40
-30
-20
-10
0
10
Figure 24. North Sea – Cod Box. Percent change in yield and profit per fleet with the MPA compared to the no-MPA simulation.
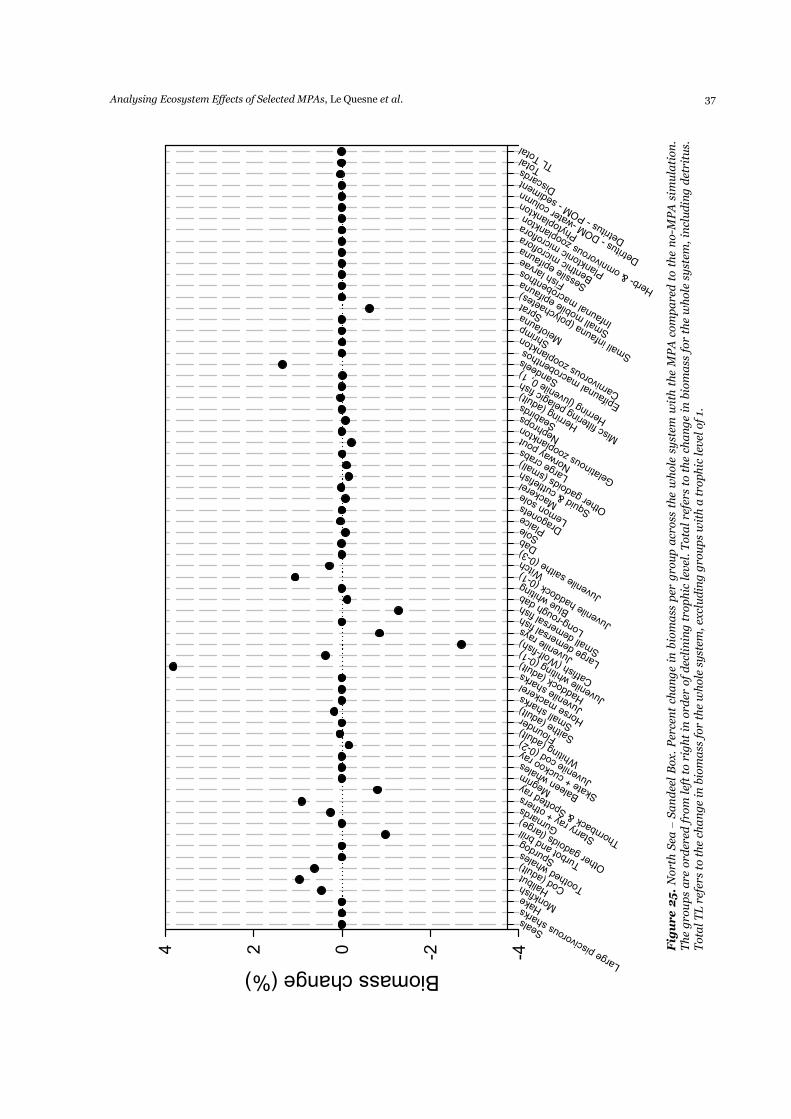
Analysing Ecosystem Effects of Selected MPAs, Le Quesne et al. 37
Seals
Large piscivorous sharks
Hake Mo
nkfish Ha
libut
Cod (adult)
Toothed whales Sp
urdog
Turbot and brill
Other gadoids (large)
Gurnards
Starry ray + others
Thornback & Spotted ray Me
grim
Baleen w
hales
Skate + cuckoo ray
Juvenile cod (0-2)
Whiting (adult) Flo
under
Saithe (adult)
Small sharks
Horse mackerel
Juvenile sharks
Haddock (adult)
Juvenile w
hiting (0-1)
Catfish (Wolf-fish)
Juvenile rays
Large demersal fish
Small demersal fish
Long-rough dab
Blue w
hiting
Juvenile haddock (0-1) Witch
Juvenile saithe (0-3)Dab Sole Plaice
Dragonets
Lemon sole Ma
ckerel
Squid & cuttlefish
Other gadoids (small)
Large crabs
Norway pout
Gelatinous zooplankton
Nephrops
Seabirds
Herring (adult)
Misc filtering pelagic fish
Herring (juvenile 0, 1) Sa
ndeels
Epifaunal macrobenthos
Carnivorous zooplankton Shrimp
Meiofauna Sprat
Small infauna (polychaetes)
Small mobile epifauna
Infaunal macrobenthos
Fish larvae
Sessile epifauna
Benthic microflora
Planktonic microflora
Herb- & om
nivorous zooplankton
Phytoplankton
Detritus - D
OM -water column
Detritus - P
OM - sediment
Discards Total TL
Total
Biomass change (%)
-4-2024 Figure 25.
Nort
h S
ea –
Sa
nd
eel
Box.
Per
cen
t ch
an
ge
in b
iom
ass
per
gro
up
acr
oss
th
e w
hole
sy
stem
wit
h t
he
MP
A c
om
pa
red
to t
he
no-M
PA
sim
ula
tion
. T
he
gro
up
s a
re o
rder
ed f
rom
lef
t to
rig
ht
in o
rder
of
dec
lin
ing
tro
ph
ic l
evel
. T
ota
l re
fers
to t
he
cha
ng
e in
bio
ma
ss f
or
the
wh
ole
sy
stem
, in
clu
din
g d
etri
tus.
T
ota
l T
L r
efer
s to
th
e ch
an
ge
in b
iom
ass
for
the
wh
ole
sy
stem
, ex
clu
din
g g
rou
ps
wit
h a
tro
ph
ic lev
el o
f 1.
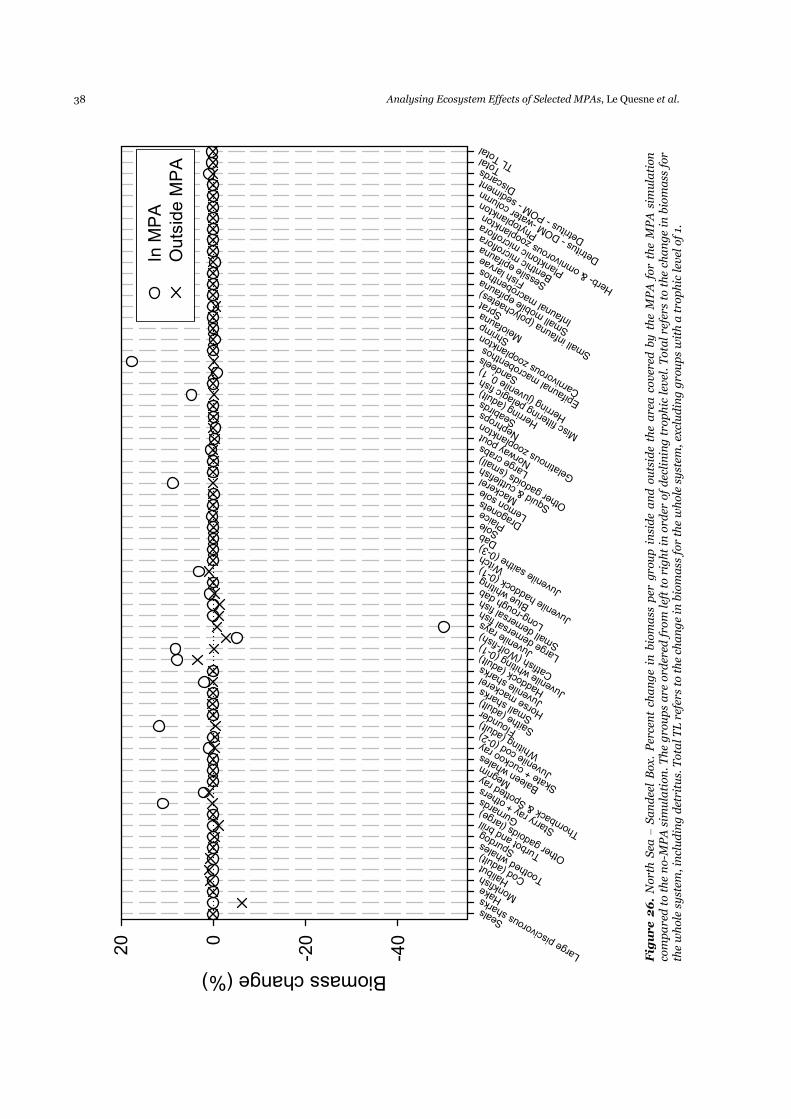
38 Analysing Ecosystem Effects of Selected MPAs, Le Quesne et al.
Seals
Large piscivorous sharks
Hake Mo
nkfish Ha
libut
Cod (adult)
Toothed whales Sp
urdog
Turbot and brill
Other gadoids (large)
Gurnards
Starry ray + others
Thornback & Spotted ray Me
grim
Baleen w
hales
Skate + cuckoo ray
Juvenile cod (0-2)
Whiting (adult)
Flounder
Saithe (adult)
Small sharks
Horse mackerel
Juvenile sharks
Haddock (adult)
Juvenile w
hiting (0-1)
Catfish (Wolf-fish)
Juvenile rays
Large demersal fish
Small demersal fish
Long-rough dab
Blue w
hiting
Juvenile haddock (0-1) Witch
Juvenile saithe (0-3)Dab Sole Plaice
Dragonets
Lemon sole Ma
ckerel
Squid & cuttlefish
Other gadoids (small)
Large crabs
Norway pout
Gelatinous zooplankton
Nephrops
Seabirds
Herring (adult)
Misc filtering pelagic fish
Herring (juvenile 0, 1) Sa
ndeels
Epifaunal macrobenthos
Carnivorous zooplankton Shrimp
Meiofauna Sprat
Small infauna (polychaetes)
Small mobile epifauna
Infaunal macrobenthos
Fish larvae
Sessile epifauna
Benthic microflora
Planktonic microflora
Herb- & omnivorous zooplankton
Phytoplankton
Detritus - D
OM -water column
Detritus - P
OM - sediment
Discards Total TL
Total
Biomass change (%)
-40
-200
20
In MPA
Outside MPA
Figure 26.
Nort
h S
ea –
Sa
nd
eel
Box.
Per
cen
t ch
an
ge
in b
iom
ass
per
gro
up
in
sid
e a
nd
ou
tsid
e th
e a
rea
cover
ed b
y t
he
MP
A f
or
the
MP
A s
imu
lati
on
co
mp
are
d t
o t
he
no-M
PA
sim
ula
tion
. T
he
gro
up
s a
re o
rder
ed f
rom
lef
t to
rig
ht
in o
rder
of
dec
lin
ing
tro
ph
ic l
evel
. T
ota
l re
fers
to t
he
cha
ng
e in
bio
ma
ss f
or
the
wh
ole
sy
stem
, in
clu
din
g d
etri
tus.
Tota
l T
L r
efer
s to
th
e ch
an
ge
in b
iom
ass
for
the
wh
ole
sy
stem
, ex
clu
din
g g
rou
ps
wit
h a
tro
ph
ic lev
el o
f 1.
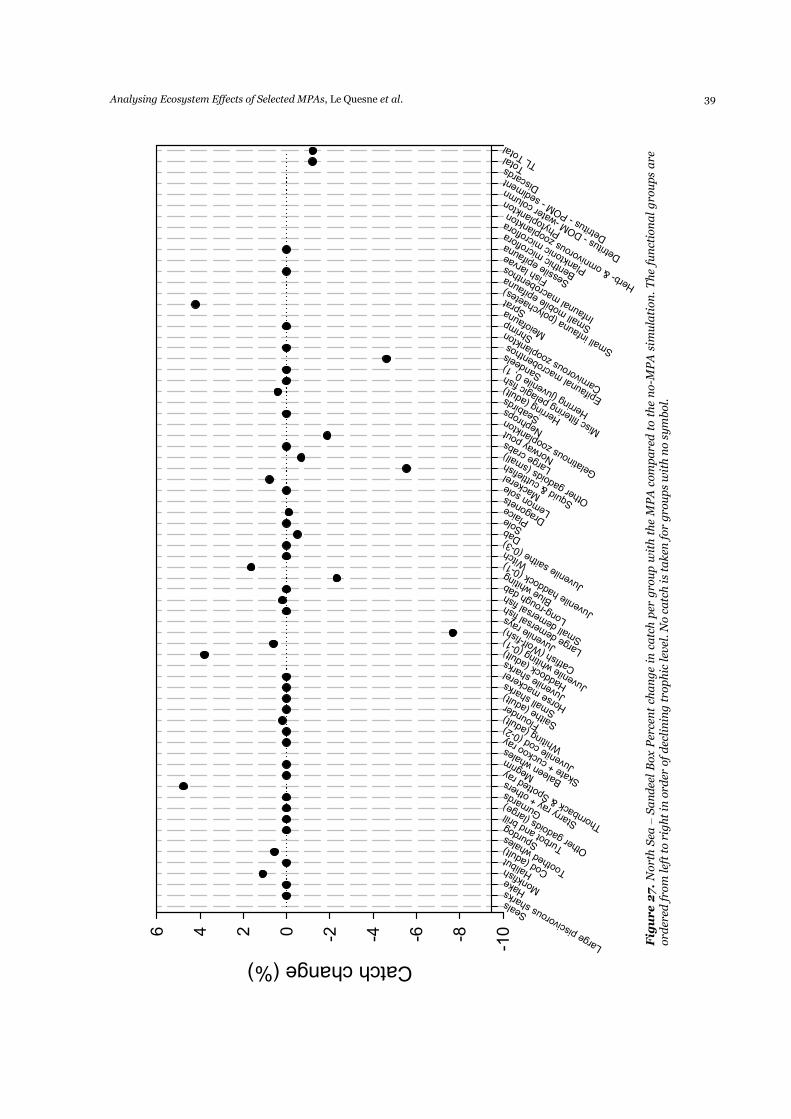
Analysing Ecosystem Effects of Selected MPAs, Le Quesne et al. 39
Seals
Large piscivorous sharks
Hake Mo
nkfish Ha
libut
Cod (adult)
Toothed whales Sp
urdog
Turbot and brill
Other gadoids (large)
Gurnards
Starry ray + others
Thornback & Spotted ray Me
grim
Baleen w
hales
Skate + cuckoo ray
Juvenile cod (0-2)
Whiting (adult) Flo
under
Saithe (adult)
Small sharks
Horse mackerel
Juvenile sharks
Haddock (adult)
Juvenile w
hiting (0-1)
Catfish (Wolf-fish)
Juvenile rays
Large demersal fish
Small demersal fish
Long-rough dab
Blue w
hiting
Juvenile haddock (0-1) Witch
Juvenile saithe (0-3)Dab Sole Plaice
Dragonets
Lemon sole Ma
ckerel
Squid & cuttlefish
Other gadoids (small)
Large crabs
Norway pout
Gelatinous zooplankton
Nephrops
Seabirds
Herring (adult)
Misc filtering pelagic fish
Herring (juvenile 0, 1) Sa
ndeels
Epifaunal macrobenthos
Carnivorous zooplankton Shrimp
Meiofauna Sprat
Small infauna (polychaetes)
Small mobile epifauna
Infaunal macrobenthos
Fish larvae
Sessile epifauna
Benthic microflora
Planktonic microflora
Herb- & om
nivorous zooplankton
Phytoplankton
Detritus - D
OM -water column
Detritus - P
OM - sediment
Discards
Total TL
Total
Catch change (%)
-10-8-6-4-20246
Figure 27.
Nort
h S
ea –
Sa
nd
eel
Box P
erce
nt
cha
ng
e in
ca
tch
per
gro
up
wit
h t
he
MP
A c
om
pa
red
to t
he
no-M
PA
sim
ula
tion
. T
he
fun
ctio
na
l g
rou
ps
are
ord
ered
fro
m lef
t to
rig
ht
in o
rder
of
dec
lin
ing
tro
ph
ic lev
el. N
o c
atc
h i
s ta
ken
for
gro
up
s w
ith
no s
ym
bol.
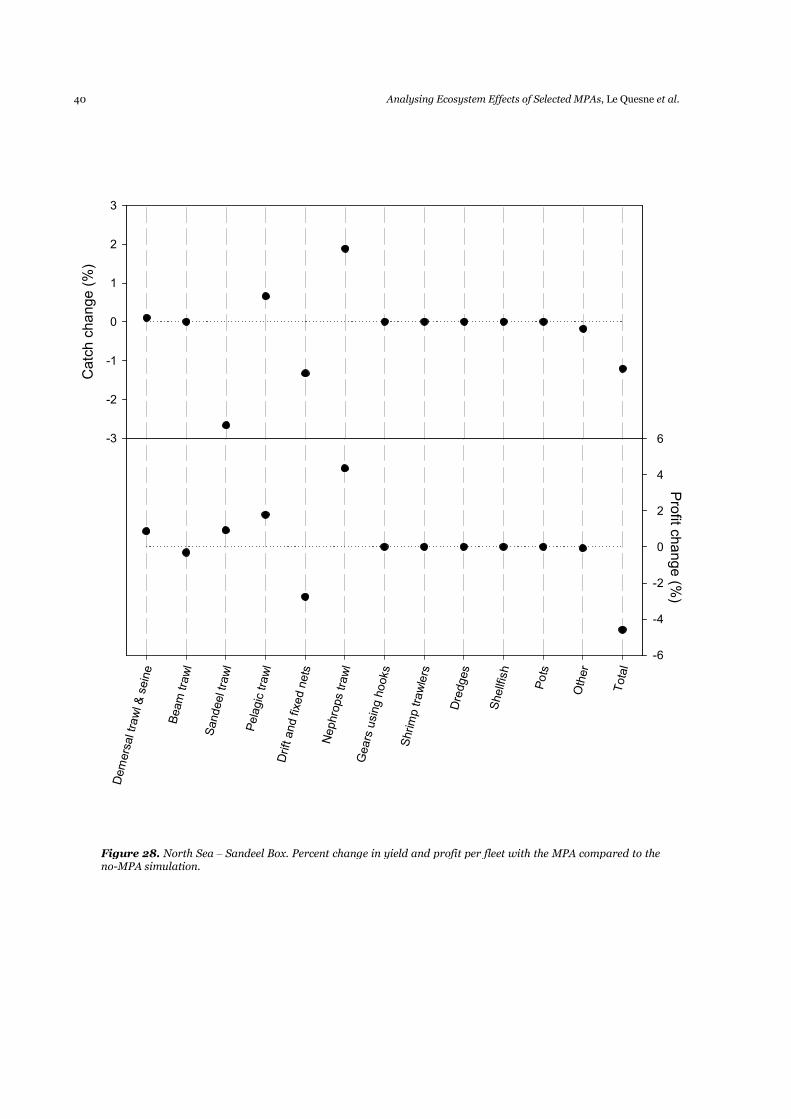
40 Analysing Ecosystem Effects of Selected MPAs, Le Quesne et al.
Catch change (%)
-3
-2
-1
0
1
2
3
Demersal trawl & seine
Beam trawl
Sandeel trawl
Pelagic trawl
Drift and fixed nets
Nephrops trawl
Gears using hooks
Shrimp trawlers
Dredges
Shellfish
Pots
Other
Total
Profit c
hange (%
)
-6
-4
-2
0
2
4
6
Figure 28. North Sea – Sandeel Box. Percent change in yield and profit per fleet with the MPA compared to the no-MPA simulation.
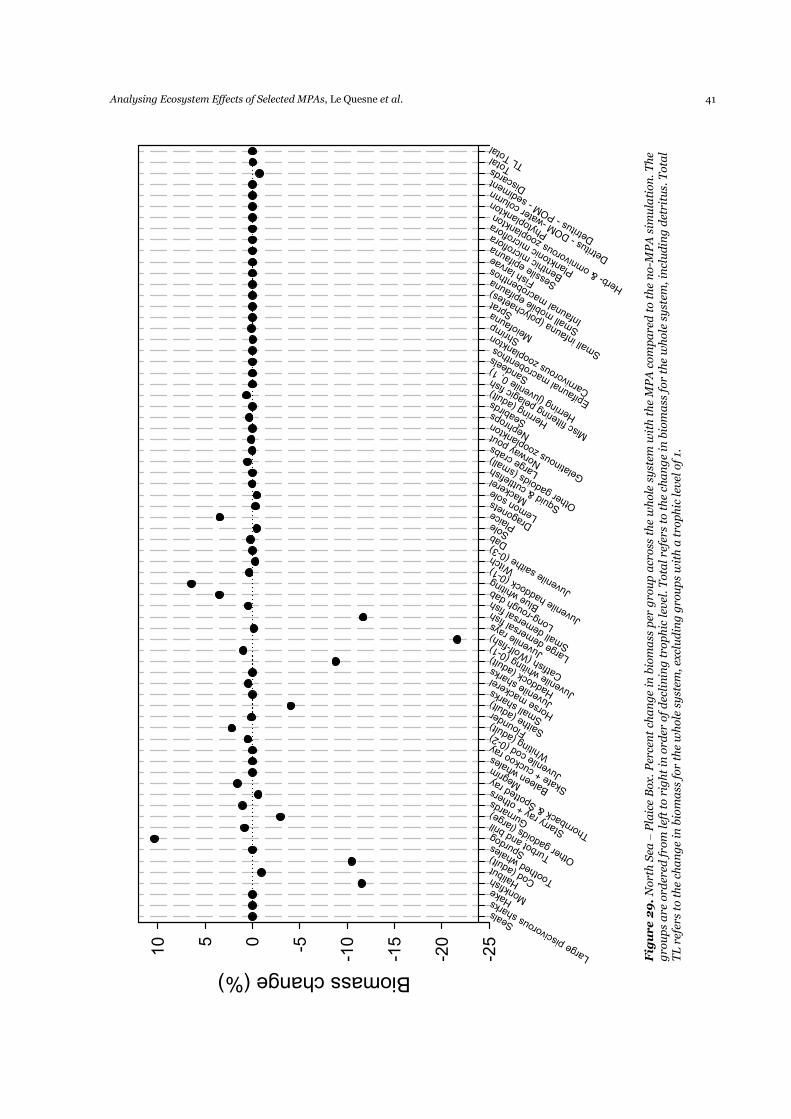
Analysing Ecosystem Effects of Selected MPAs, Le Quesne et al. 41
Figure 29.
Nort
h S
ea –
Pla
ice
Box.
Per
cen
t ch
an
ge
in b
iom
ass
per
gro
up
acr
oss
th
e w
hole
sy
stem
wit
h t
he
MP
A c
om
pa
red
to t
he
no-M
PA
sim
ula
tion
. T
he
gro
up
s a
re o
rder
ed f
rom
lef
t to
rig
ht
in o
rder
of
dec
lin
ing
tro
ph
ic lev
el. T
ota
l re
fers
to t
he
cha
ng
e in
bio
ma
ss f
or
the
wh
ole
sy
stem
, in
clu
din
g d
etri
tus.
Tota
l T
L r
efer
s to
th
e ch
an
ge
in b
iom
ass
for
the
wh
ole
sy
stem
, ex
clu
din
g g
rou
ps
wit
h a
tro
ph
ic lev
el o
f 1.
Seals
Large piscivorous sharks
Hake Mo
nkfish Ha
libut
Cod (adult)
Toothed whales Sp
urdog
Turbot and brill
Other gadoids (large)
Gurnards
Starry ray + others
Thornback & Spotted ray Me
grim
Baleen whales
Skate + cuckoo ray
Juvenile cod (0-2)
Whiting (adult) Flo
under
Saithe (adult)
Small sharks
Horse mackerel
Juvenile sharks
Haddock (adult)
Juvenile w
hiting (0-1)
Catfish (Wolf-fish)
Juvenile rays
Large demersal fish
Small demersal fish
Long-rough dab
Blue w
hiting
Juvenile haddock (0-1) Witch
Juvenile saithe (0-3)Dab Sole Plaice
Dragonets
Lemon sole Ma
ckerel
Squid & cuttlefish
Other gadoids (small)
Large crabs
Norway pout
Gelatinous zooplankton
Nephrops
Seabirds
Herring (adult)
Misc filtering pelagic fish
Herring (juvenile 0, 1) Sa
ndeels
Epifaunal macrobenthos
Carnivorous zooplankton Shrimp
Meiofauna Sprat
Small infauna (polychaetes)
Small mobile epifauna
Infaunal macrobenthos
Fish larvae
Sessile epifauna
Benthic microflora
Planktonic microflora
Herb- & om
nivorous zooplankton
Phytoplankton
Detritus - D
OM -water column
Detritus - P
OM - sediment
Discards Total TL
Total
Biomass change (%)
-25
-20
-15
-10-505
10
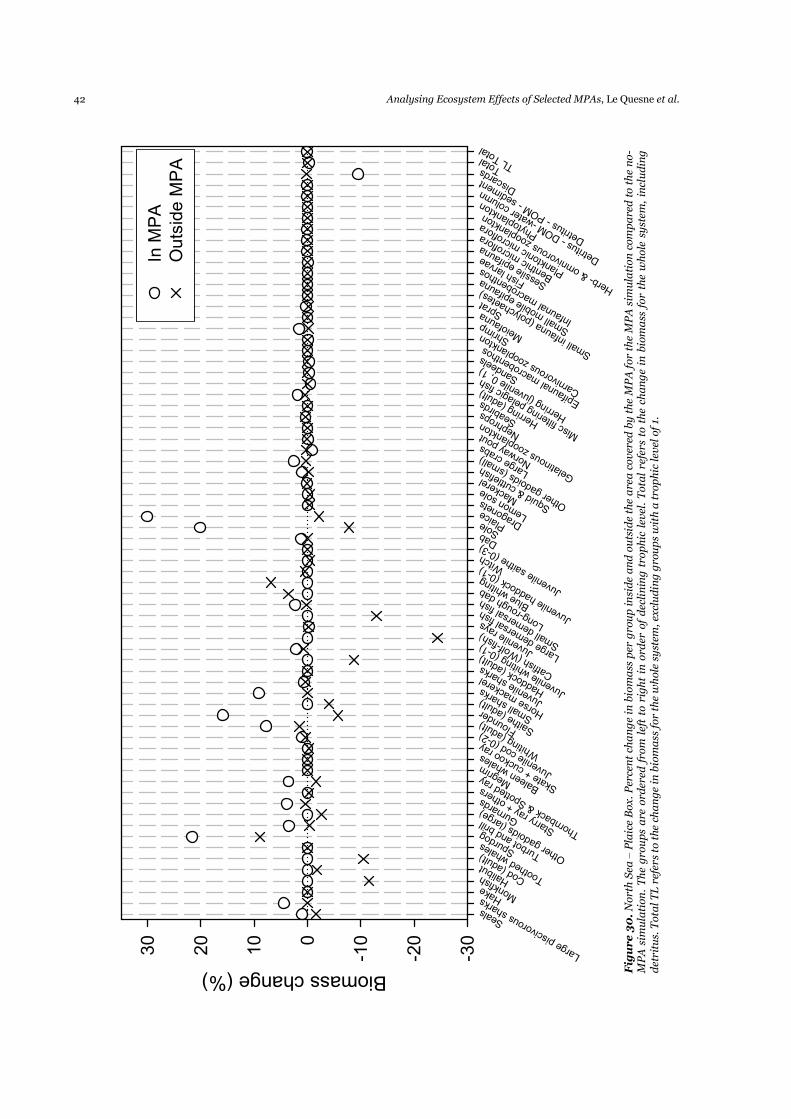
42 Analysing Ecosystem Effects of Selected MPAs, Le Quesne et al.
Seals
Large piscivorous sharks
Hake Mo
nkfish Ha
libut
Cod (adult)
Toothed whales Sp
urdog
Turbot and brill
Other gadoids (large)
Gurnards
Starry ray + others
Thornback & Spotted ray Me
grim
Baleen w
hales
Skate + cuckoo ray
Juvenile cod (0-2)
Whiting (adult)
Flounder
Saithe (adult)
Small sharks
Horse mackerel
Juvenile sharks
Haddock (adult)
Juvenile w
hiting (0-1)
Catfish (Wolf-fish)
Juvenile rays
Large demersal fish
Small demersal fish
Long-rough dab
Blue w
hiting
Juvenile haddock (0-1) Witch
Juvenile saithe (0-3)Dab Sole Plaice
Dragonets
Lemon sole Ma
ckerel
Squid & cuttlefish
Other gadoids (small)
Large crabs
Norway pout
Gelatinous zooplankton
Nephrops
Seabirds
Herring (adult)
Misc filtering pelagic fish
Herring (juvenile 0, 1) Sa
ndeels
Epifaunal macrobenthos
Carnivorous zooplankton Shrimp
Meiofauna Sprat
Small infauna (polychaetes)
Small mobile epifauna
Infaunal macrobenthos
Fish larvae
Sessile epifauna
Benthic microflora
Planktonic microflora
Herb- & omnivorous zooplankton
Phytoplankton
Detritus - D
OM -water column
Detritus - P
OM - sediment
Discards Total TL
Total
Biomass change (%)
-30
-20
-100
10
20
30
In MPA
Outside MPA
Figure 30.
Nort
h S
ea –
Pla
ice
Box. P
erce
nt
cha
ng
e in
bio
ma
ss p
er g
rou
p in
sid
e a
nd
ou
tsid
e th
e a
rea
cover
ed b
y t
he
MP
A f
or
the
MP
A s
imu
lati
on
com
pa
red
to t
he
no-
MP
A s
imu
lati
on
. T
he
gro
up
s a
re o
rder
ed f
rom
lef
t to
rig
ht
in o
rder
of
dec
lin
ing
tro
ph
ic l
evel
. T
ota
l re
fers
to t
he
cha
ng
e in
bio
ma
ss f
or
the
wh
ole
sy
stem
, in
clu
din
g
det
ritu
s. T
ota
l T
L r
efer
s to
the c
ha
ng
e in
bio
ma
ss f
or
the
wh
ole
sy
stem
, ex
clu
din
g g
rou
ps
wit
h a
tro
ph
ic lev
el o
f 1.
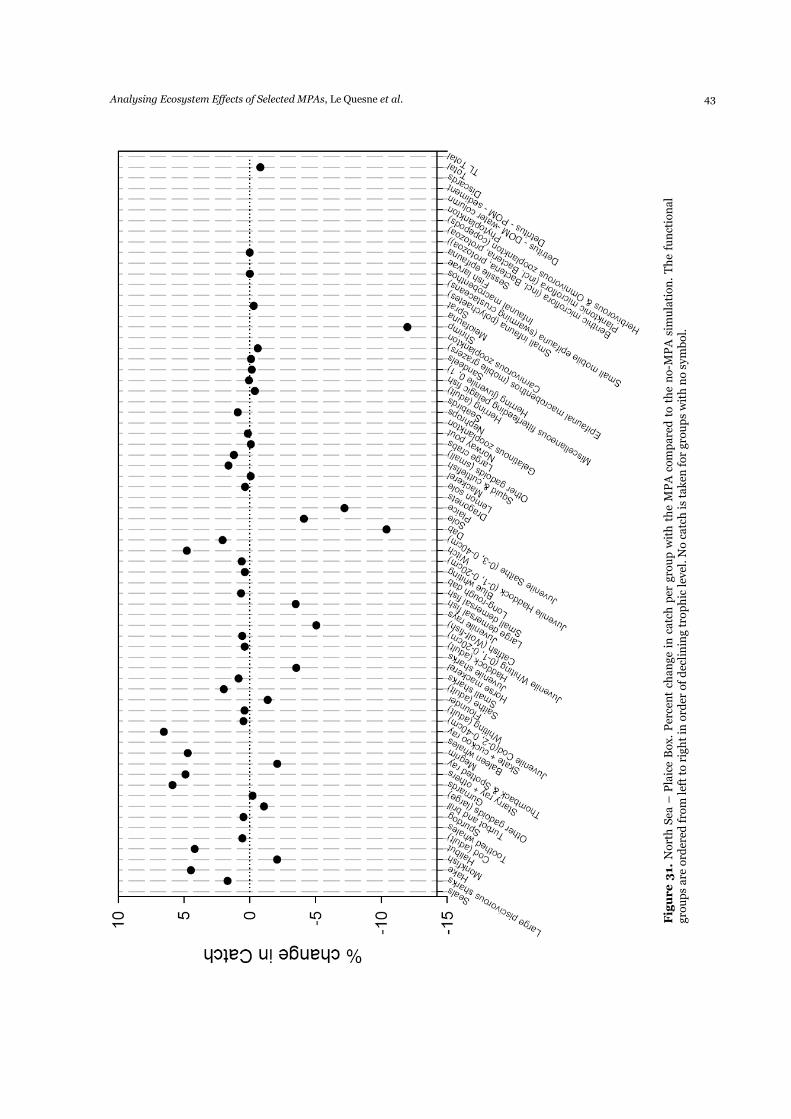
Analysing Ecosystem Effects of Selected MPAs, Le Quesne et al. 43
Figure 31.
Nort
h S
ea –
Pla
ice
Box.
Per
cen
t ch
an
ge
in c
atc
h p
er g
rou
p w
ith
th
e M
PA
com
pare
d t
o t
he
no-M
PA
sim
ula
tion
. T
he
fun
ctio
nal
gro
up
s are
ord
ered
fro
m lef
t to
rig
ht
in o
rder
of
dec
lin
ing t
rop
hic
lev
el. N
o c
atc
h is
taken
for
gro
up
s w
ith
no s
ym
bol.
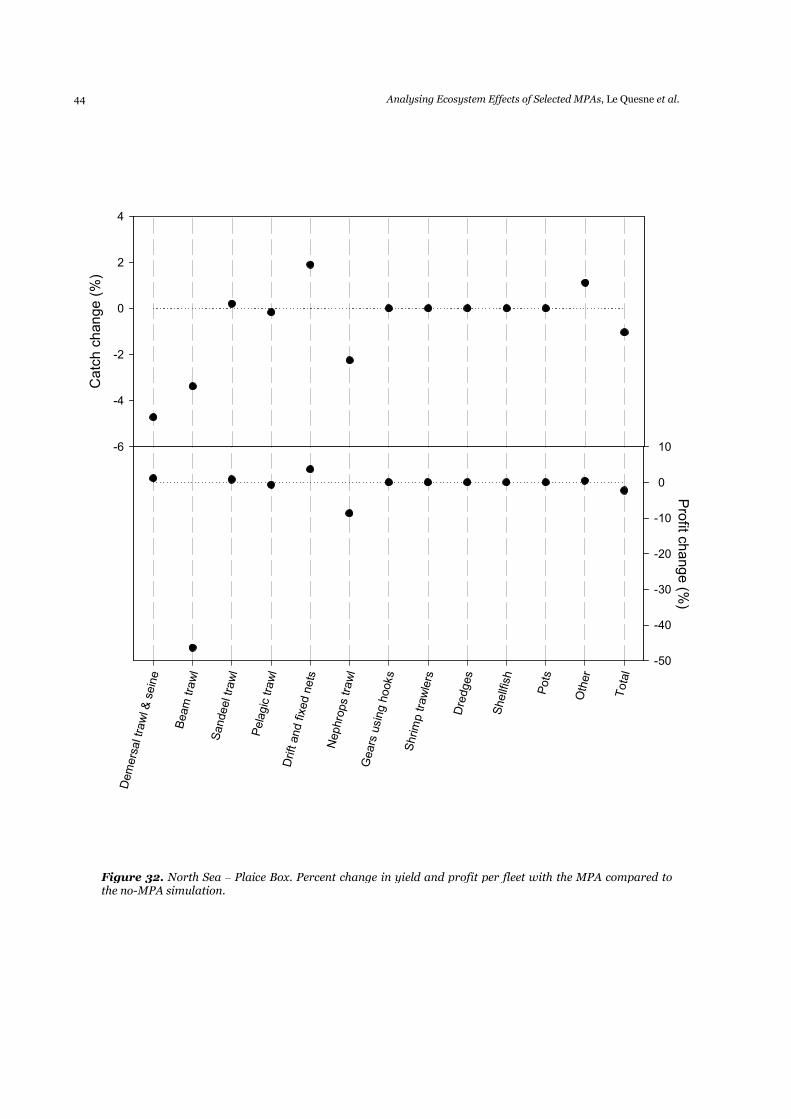
44 Analysing Ecosystem Effects of Selected MPAs, Le Quesne et al.
Figure 32. North Sea – Plaice Box. Percent change in yield and profit per fleet with the MPA compared to the no-MPA simulation.
Catch change (%)
-6
-4
-2
0
2
4
Demersal trawl & seine
Beam trawl
Sandeel trawl
Pelagic trawl
Drift and fixed nets
Nephrops trawl
Gears using hooks
Shrimp trawlers
Dredges
Shellfish
Pots
Other
Total
Profit c
hange (%
)
-50
-40
-30
-20
-10
0
10
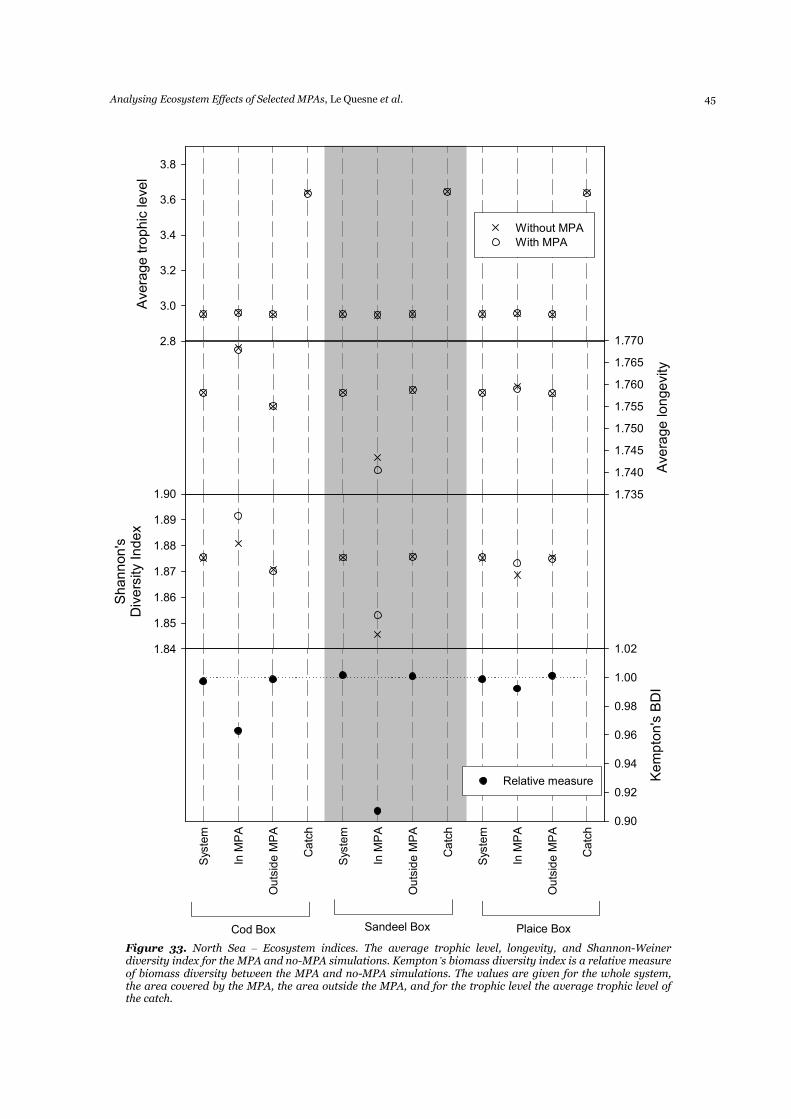
Analysing Ecosystem Effects of Selected MPAs, Le Quesne et al. 45
Figure 33. North Sea – Ecosystem indices. The average trophic level, longevity, and Shannon-Weiner diversity index for the MPA and no-MPA simulations. Kempton’s biomass diversity index is a relative measure of biomass diversity between the MPA and no-MPA simulations. The values are given for the whole system, the area covered by the MPA, the area outside the MPA, and for the trophic level the average trophic level of the catch.
Average trophic level
2.8
3.0
3.2
3.4
3.6
3.8
Without MPA
With MPA
Shannon's
Diversity Index
1.84
1.85
1.86
1.87
1.88
1.89
1.90
Average longevity
1.735
1.740
1.745
1.750
1.755
1.760
1.765
1.770
Cod Box Sandeel Box Plaice Box
System
In MPA
Outside MPA
Catch
System
In MPA
Outside MPA
Catch
System
In MPA
Outside MPA
Catch
Kempton's BDI
0.90
0.92
0.94
0.96
0.98
1.00
1.02
Relative measure
46 Analysing Ecosystem Effects of Selected MPAs, Le Quesne et al.
3.4 NORTHERN BENGUELA CURRENT
3.4.1 Juvenile Hake MPA
Establishment of the MPA led to a decline in the total catch (Figure 35); individual groups displayed both increases and decreases in catch. Juvenile hake showed the largest decline in catch. The different fleets also showed differing responses to MPA establishment, with the midwater trawlers showing the largest percent decline in catch. The profitability of the fleets did not always reflect the change in catch. The purse seine fleet showed a slight decline in catch but a greater than 20% increase in profits. The demersal fleet exhibited a modest decline in catch but an increase in profit. The midwater trawlers showed an almost 10% decline in catch following MPA establishment, but this did not impact upon the profits of the fleet (Figure 35). The overall biomass of the system increased as a result of MPA establishment, and this effect was more pronounced when groups with a trophic level of 1 were excluded (Figure 34). The biomass of individual groups showed a range of responses, although the greatest changes in biomass occurred for the mid-trophic level groups. Crabs and juvenile hake showed the largest percent increase in biomass across the whole system. Most groups showed a larger percent change in biomass in the area covered by the MPA than in the area outside the MPA. The average longevity and trophic level within the area covered by the MPA showed moderate increases as a result of MPA establishment; however, there was a slight decline in these metric in the area outside the MPA (Figure 40). When assessed across the whole system, there was no change in average longevity or trophic level as a result of MPA establishment. The trophic level of the catch showed a negligible decline following MPA establishment. Kempton’s BDI and Shannon’s diversity index both showed very slight increases across the whole system as a result of MPA establishment. Within the MPA, Kempton’s BDI indicates a slight increase in evenness resulting from MPA establishment, but Shannon’s diversity index indicates a decrease in evenness.
3.4.2 Habitats MPA
There was a greater than 5% decline in the total catch as a result of establishing the Habitats MPA (Figure 37). Individual groups showed varying responses to the MPA: juvenile horse mackerel showed the largest increase in catch (+6%) and adult sardines the largest decrease in catch (-18%). Most of the fleets showed a decline in catch as a result of the Habitats MPA, although the commercial line fishery, seal fishery and seaweed collection all showed slight increases in catch of less than 2%. The largest declines in catch were for the purse seine (-15%) and lobster (-13%) fleets. The change in profits by fleet generally reflected the change in catch, although the purse seine fleet had an 84% decrease in profits resulting from the MPA. The overall biomass of the system increased as a result of introduction of the Habitats MPA, and this was more pronounced when groups with a trophic level of 1 were excluded from the analysis (Figure 36). Individual group biomass showed a limited response to the MPA; only one group showed a >5% change in biomass. The total biomass and biomass of individual groups showed a greater percent change in the area covered by the MPA than in the area outside the MPA. Generally most groups that showed an increase inside the MPA showed a decline outside the MPA, and vice versa. However, tuna and juvenile and adult hake showed increases both inside and outside the MPA, although the increases were greater inside the MPA. Conversely, marine mammals and other small pelagics both showed declines inside and outside the MPA, and again the percent changes inside the MPA were greater than the changes outside the MPA. The diversity and ecosystem metrics generally showed little change in response to the MPA (Figure 40). The average trophic level, longevity, Shannon’s diversity index and Kempton’s BDI all showed slight increases inside the MPA. Kempton’s BDI and Shannon’s diversity index indicated different responses of evenness in the whole system to the MPA. Kempton’s BDI indicated a slight decrease in evenness, whilst Shannon’s diversity index indicated a very slight increase in evenness.
3.4.3 Central MPA
There was a 25% decline in the total catch as a result of the large Central MPA (Figure 39). Catches of individual groups showed a wider range of responses to the MPA; however, no groups showed an increase
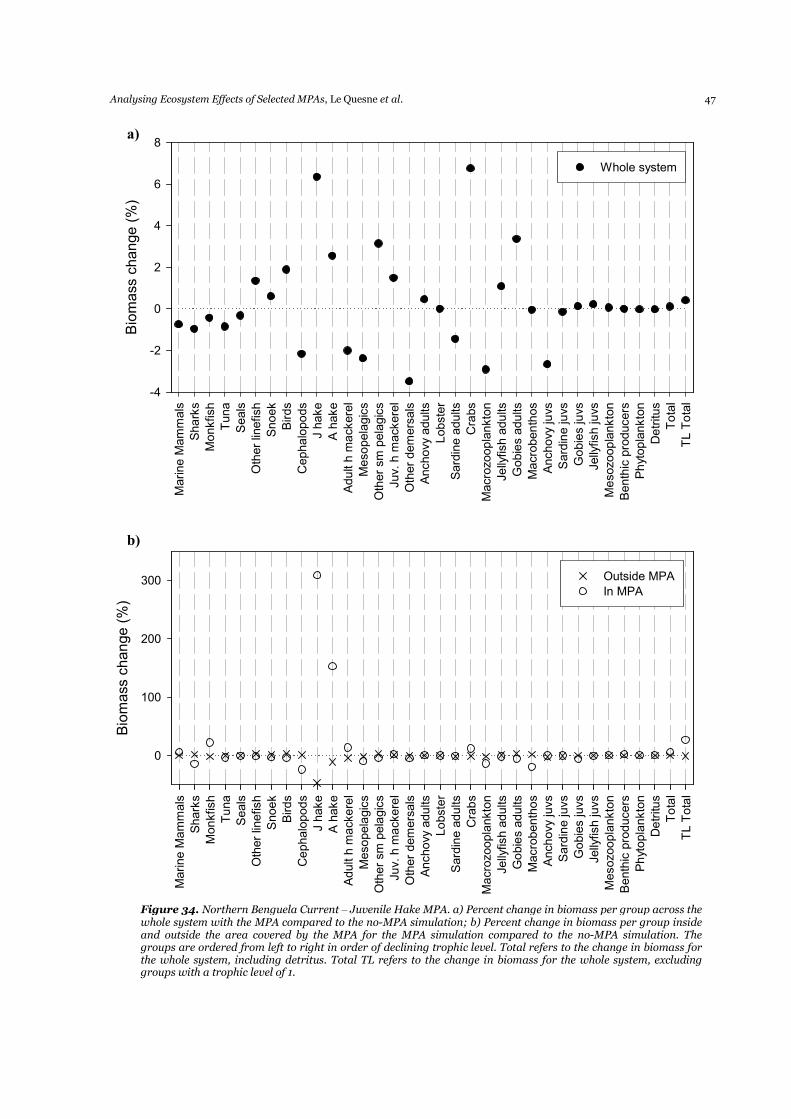
Analysing Ecosystem Effects of Selected MPAs, Le Quesne et al. 47
Marine Mammals
Sharks
Monkfish
Tuna
Seals
Other linefish
Snoek
Birds
Cephalopods
J hake
A hake
Adult h mackerel
Mesopelagics
Other sm pelagics
Juv. h mackerel
Other demersals
Anchovy adults
Lobster
Sardine adults
Crabs
Macrozooplankton
Jellyfish adults
Gobies adults
Macrobenthos
Anchovy juvs
Sardine juvs
Gobies juvs
Jellyfish juvs
Mesozooplankton
Benthic producers
Phytoplankton
Detritus
Total
TL Total
Biomass change (%)
0
100
200
300 Outside MPA
In MPA
Marine Mammals
Sharks
Monkfish
Tuna
Seals
Other linefish
Snoek
Birds
Cephalopods
J hake
A hake
Adult h mackerel
Mesopelagics
Other sm pelagics
Juv. h mackerel
Other demersals
Anchovy adults
Lobster
Sardine adults
Crabs
Macrozooplankton
Jellyfish adults
Gobies adults
Macrobenthos
Anchovy juvs
Sardine juvs
Gobies juvs
Jellyfish juvs
Mesozooplankton
Benthic producers
Phytoplankton
Detritus
Total
TL Total
Biomass change (%)
-4
-2
0
2
4
6
8
Whole system
Figure 34. Northern Benguela Current – Juvenile Hake MPA. a) Percent change in biomass per group across the whole system with the MPA compared to the no-MPA simulation; b) Percent change in biomass per group inside and outside the area covered by the MPA for the MPA simulation compared to the no-MPA simulation. The groups are ordered from left to right in order of declining trophic level. Total refers to the change in biomass for the whole system, including detritus. Total TL refers to the change in biomass for the whole system, excluding groups with a trophic level of 1.
a)
b)
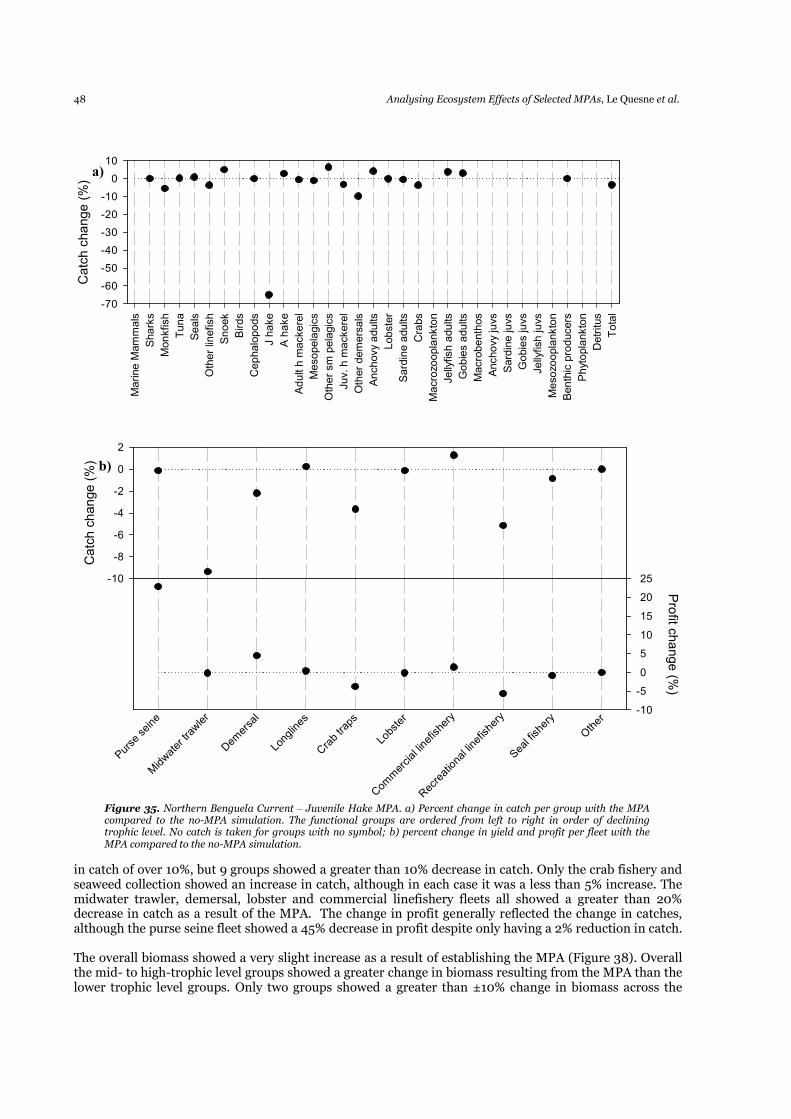
48 Analysing Ecosystem Effects of Selected MPAs, Le Quesne et al.
in catch of over 10%, but 9 groups showed a greater than 10% decrease in catch. Only the crab fishery and seaweed collection showed an increase in catch, although in each case it was a less than 5% increase. The midwater trawler, demersal, lobster and commercial linefishery fleets all showed a greater than 20% decrease in catch as a result of the MPA. The change in profit generally reflected the change in catches, although the purse seine fleet showed a 45% decrease in profit despite only having a 2% reduction in catch. The overall biomass showed a very slight increase as a result of establishing the MPA (Figure 38). Overall the mid- to high-trophic level groups showed a greater change in biomass resulting from the MPA than the lower trophic level groups. Only two groups showed a greater than ±10% change in biomass across the
Marine Mammals
Sharks
Monkfish
Tuna
Seals
Other linefish
Snoek
Birds
Cephalopods
J hake
A hake
Adult h mackerel
Mesopelagics
Other sm pelagics
Juv. h mackerel
Other demersals
Anchovy adults
Lobster
Sardine adults
Crabs
Macrozooplankton
Jellyfish adults
Gobies adults
Macrobenthos
Anchovy juvs
Sardine juvs
Gobies juvs
Jellyfish juvs
Mesozooplankton
Benthic producers
Phytoplankton
Detritus
Total
Catch change (%)
-70
-60
-50
-40
-30
-20
-10
0
10
Catch change (%)
-10
-8
-6
-4
-2
0
2
Purse seine
Midwater trawler
Demersal
Longlines
Crab traps
Lobster
Commercial linefishery
Recreational linefishery
Seal fishery
Other
Profit c
hange (%
)
-10
-5
0
5
10
15
20
25
Figure 35. Northern Benguela Current – Juvenile Hake MPA. a) Percent change in catch per group with the MPA compared to the no-MPA simulation. The functional groups are ordered from left to right in order of declining trophic level. No catch is taken for groups with no symbol; b) percent change in yield and profit per fleet with the MPA compared to the no-MPA simulation.
a)
b)
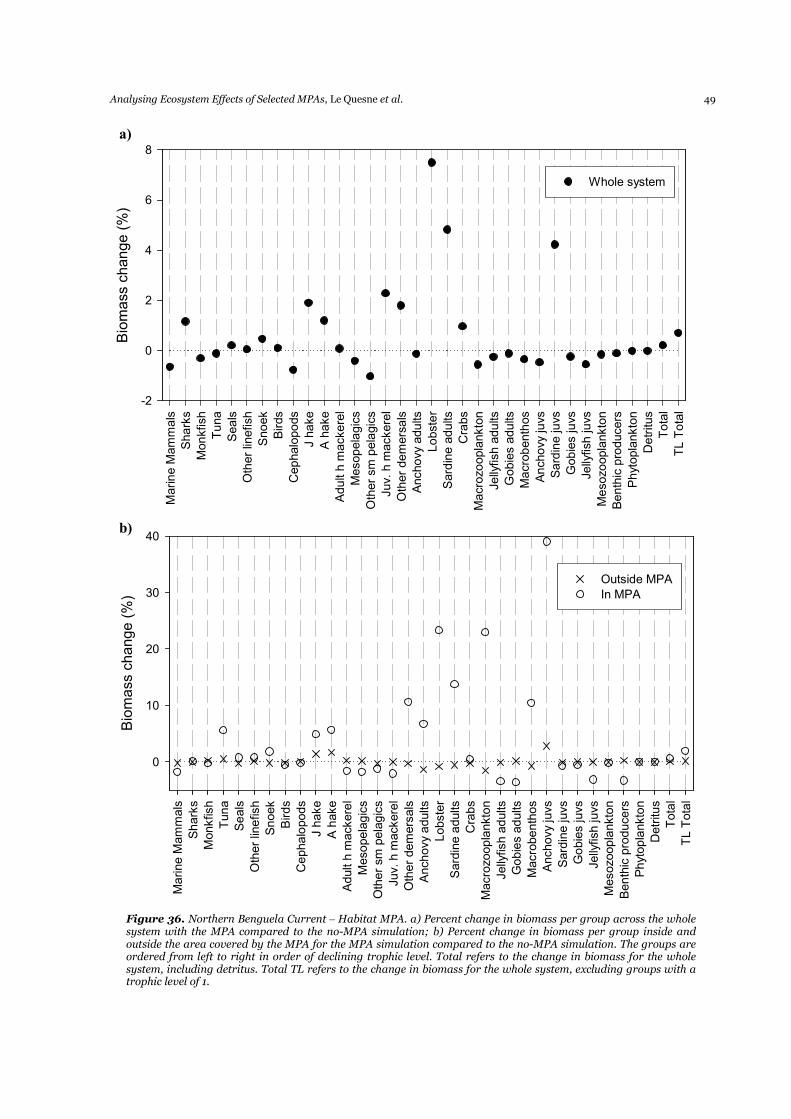
Analysing Ecosystem Effects of Selected MPAs, Le Quesne et al. 49
Marine Mammals
Sharks
Monkfish
Tuna
Seals
Other linefish
Snoek
Birds
Cephalopods
J hake
A hake
Adult h mackerel
Mesopelagics
Other sm pelagics
Juv. h mackerel
Other demersals
Anchovy adults
Lobster
Sardine adults
Crabs
Macrozooplankton
Jellyfish adults
Gobies adults
Macrobenthos
Anchovy juvs
Sardine juvs
Gobies juvs
Jellyfish juvs
Mesozooplankton
Benthic producers
Phytoplankton
Detritus
Total
TL Total
Biomass change (%)
0
10
20
30
40
Outside MPA
In MPA
Marine Mammals
Sharks
Monkfish
Tuna
Seals
Other linefish
Snoek
Birds
Cephalopods
J hake
A hake
Adult h mackerel
Mesopelagics
Other sm pelagics
Juv. h mackerel
Other demersals
Anchovy adults
Lobster
Sardine adults
Crabs
Macrozooplankton
Jellyfish adults
Gobies adults
Macrobenthos
Anchovy juvs
Sardine juvs
Gobies juvs
Jellyfish juvs
Mesozooplankton
Benthic producers
Phytoplankton
Detritus
Total
TL Total
Biomass change (%)
-2
0
2
4
6
8
Whole system
a)
b)
Figure 36. Northern Benguela Current – Habitat MPA. a) Percent change in biomass per group across the whole system with the MPA compared to the no-MPA simulation; b) Percent change in biomass per group inside and outside the area covered by the MPA for the MPA simulation compared to the no-MPA simulation. The groups are ordered from left to right in order of declining trophic level. Total refers to the change in biomass for the whole system, including detritus. Total TL refers to the change in biomass for the whole system, excluding groups with a trophic level of 1.
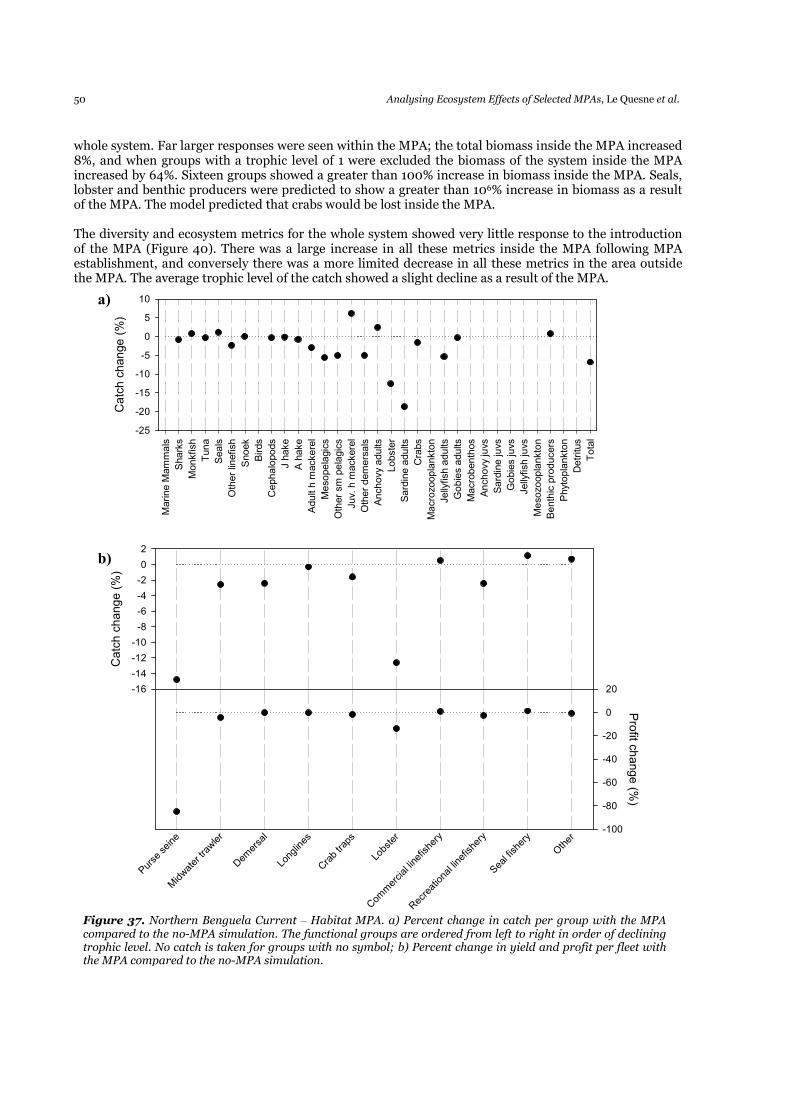
50 Analysing Ecosystem Effects of Selected MPAs, Le Quesne et al.
whole system. Far larger responses were seen within the MPA; the total biomass inside the MPA increased 8%, and when groups with a trophic level of 1 were excluded the biomass of the system inside the MPA increased by 64%. Sixteen groups showed a greater than 100% increase in biomass inside the MPA. Seals, lobster and benthic producers were predicted to show a greater than 106% increase in biomass as a result of the MPA. The model predicted that crabs would be lost inside the MPA. The diversity and ecosystem metrics for the whole system showed very little response to the introduction of the MPA (Figure 40). There was a large increase in all these metrics inside the MPA following MPA establishment, and conversely there was a more limited decrease in all these metrics in the area outside the MPA. The average trophic level of the catch showed a slight decline as a result of the MPA.
Marine Mammals
Sharks
Monkfish
Tuna
Seals
Other linefish
Snoek
Birds
Cephalopods
J hake
A hake
Adult h mackerel
Mesopelagics
Other sm pelagics
Juv. h mackerel
Other demersals
Anchovy adults
Lobster
Sardine adults
Crabs
Macrozooplankton
Jellyfish adults
Gobies adults
Macrobenthos
Anchovy juvs
Sardine juvs
Gobies juvs
Jellyfish juvs
Mesozooplankton
Benthic producers
Phytoplankton
Detritus
Total
Catch change (%)
-25
-20
-15
-10
-5
0
5
10
Catch change (%)
-16
-14
-12
-10
-8
-6
-4
-2
0
2
Purse seine
Midwater trawler
Demersal
Longlines
Crab traps
Lobster
Commercial linefishery
Recreational linefishery
Seal fishery
Other
Profit c
hange (%
)
-100
-80
-60
-40
-20
0
20
a)
b)
Figure 37. Northern Benguela Current – Habitat MPA. a) Percent change in catch per group with the MPA compared to the no-MPA simulation. The functional groups are ordered from left to right in order of declining trophic level. No catch is taken for groups with no symbol; b) Percent change in yield and profit per fleet with the MPA compared to the no-MPA simulation.
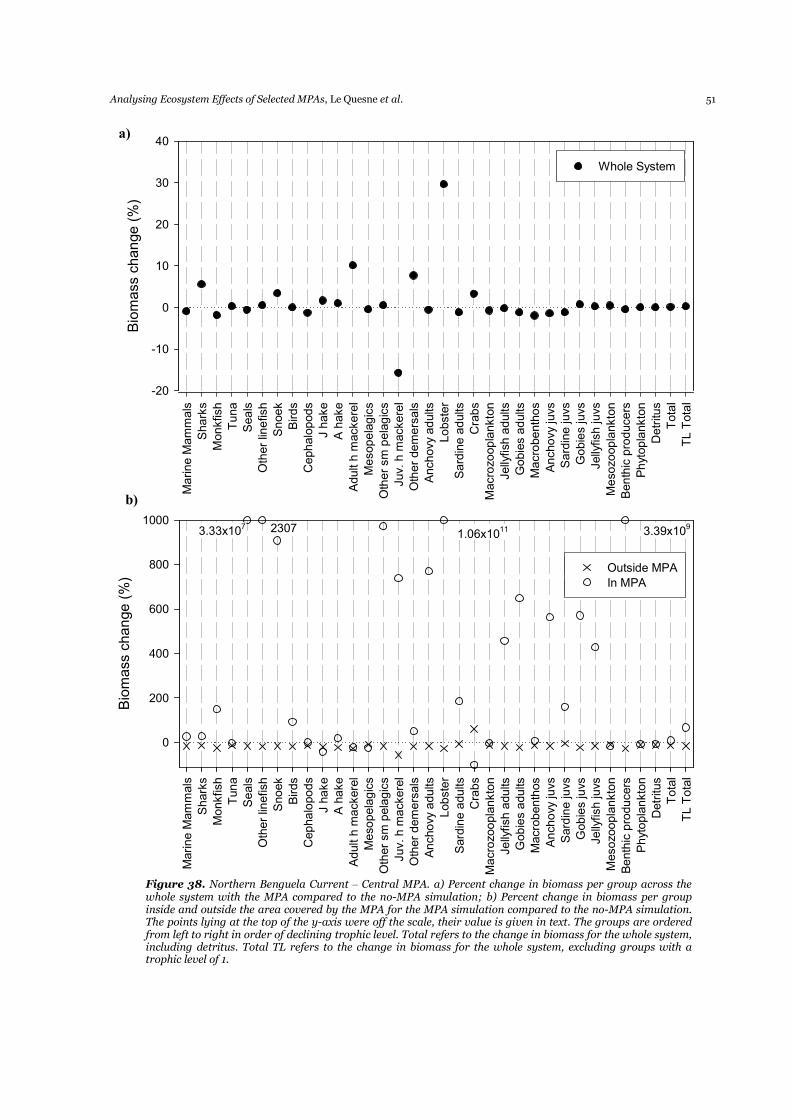
Analysing Ecosystem Effects of Selected MPAs, Le Quesne et al. 51
Marine Mammals
Sharks
Monkfish
Tuna
Seals
Other linefish
Snoek
Birds
Cephalopods
J hake
A hake
Adult h mackerel
Mesopelagics
Other sm pelagics
Juv. h mackerel
Other demersals
Anchovy adults
Lobster
Sardine adults
Crabs
Macrozooplankton
Jellyfish adults
Gobies adults
Macrobenthos
Anchovy juvs
Sardine juvs
Gobies juvs
Jellyfish juvs
Mesozooplankton
Benthic producers
Phytoplankton
Detritus
Total
TL Total
Biomass change (%)
-20
-10
0
10
20
30
40
Whole System
Marine Mammals
Sharks
Monkfish
Tuna
Seals
Other linefish
Snoek
Birds
Cephalopods
J hake
A hake
Adult h mackerel
Mesopelagics
Other sm pelagics
Juv. h mackerel
Other demersals
Anchovy adults
Lobster
Sardine adults
Crabs
Macrozooplankton
Jellyfish adults
Gobies adults
Macrobenthos
Anchovy juvs
Sardine juvs
Gobies juvs
Jellyfish juvs
Mesozooplankton
Benthic producers
Phytoplankton
Detritus
Total
TL Total
Biomass change (%)
0
200
400
600
800
1000
Outside MPA
In MPA
3.33x10⁷ 2307
1.06x10¹¹ 3.39x10
9
a)
b)
Figure 38. Northern Benguela Current – Central MPA. a) Percent change in biomass per group across the whole system with the MPA compared to the no-MPA simulation; b) Percent change in biomass per group inside and outside the area covered by the MPA for the MPA simulation compared to the no-MPA simulation. The points lying at the top of the y-axis were off the scale, their value is given in text. The groups are ordered from left to right in order of declining trophic level. Total refers to the change in biomass for the whole system, including detritus. Total TL refers to the change in biomass for the whole system, excluding groups with a trophic level of 1.
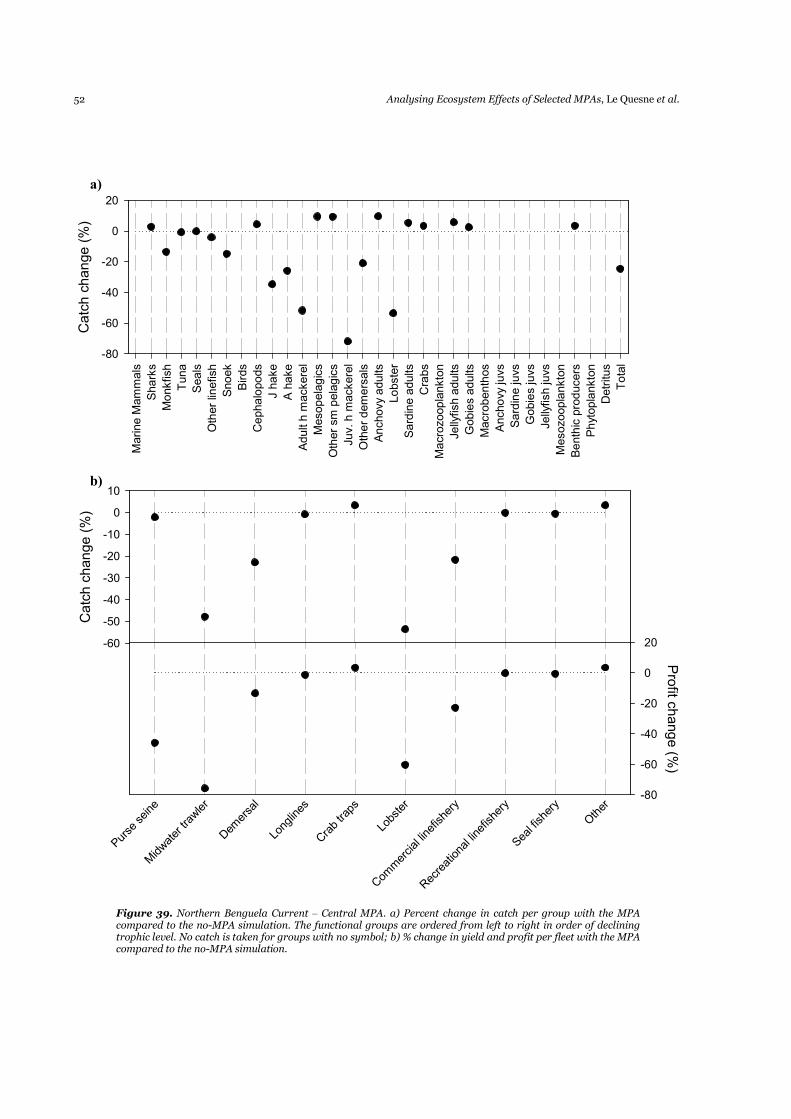
52 Analysing Ecosystem Effects of Selected MPAs, Le Quesne et al.
Marine Mammals
Sharks
Monkfish
Tuna
Seals
Other linefish
Snoek
Birds
Cephalopods
J hake
A hake
Adult h mackerel
Mesopelagics
Other sm pelagics
Juv. h mackerel
Other demersals
Anchovy adults
Lobster
Sardine adults
Crabs
Macrozooplankton
Jellyfish adults
Gobies adults
Macrobenthos
Anchovy juvs
Sardine juvs
Gobies juvs
Jellyfish juvs
Mesozooplankton
Benthic producers
Phytoplankton
Detritus
Total
Catch change (%)
-80
-60
-40
-20
0
20
Catch change (%)
-60
-50
-40
-30
-20
-10
0
10
Purse seine
Midwater trawler
Demersal
Longlines
Crab traps
Lobster
Commercial linefishery
Recreational linefishery
Seal fishery
Other
Profit c
hange (%
)
-80
-60
-40
-20
0
20
a)
b)
Figure 39. Northern Benguela Current – Central MPA. a) Percent change in catch per group with the MPA compared to the no-MPA simulation. The functional groups are ordered from left to right in order of declining trophic level. No catch is taken for groups with no symbol; b) % change in yield and profit per fleet with the MPA compared to the no-MPA simulation.
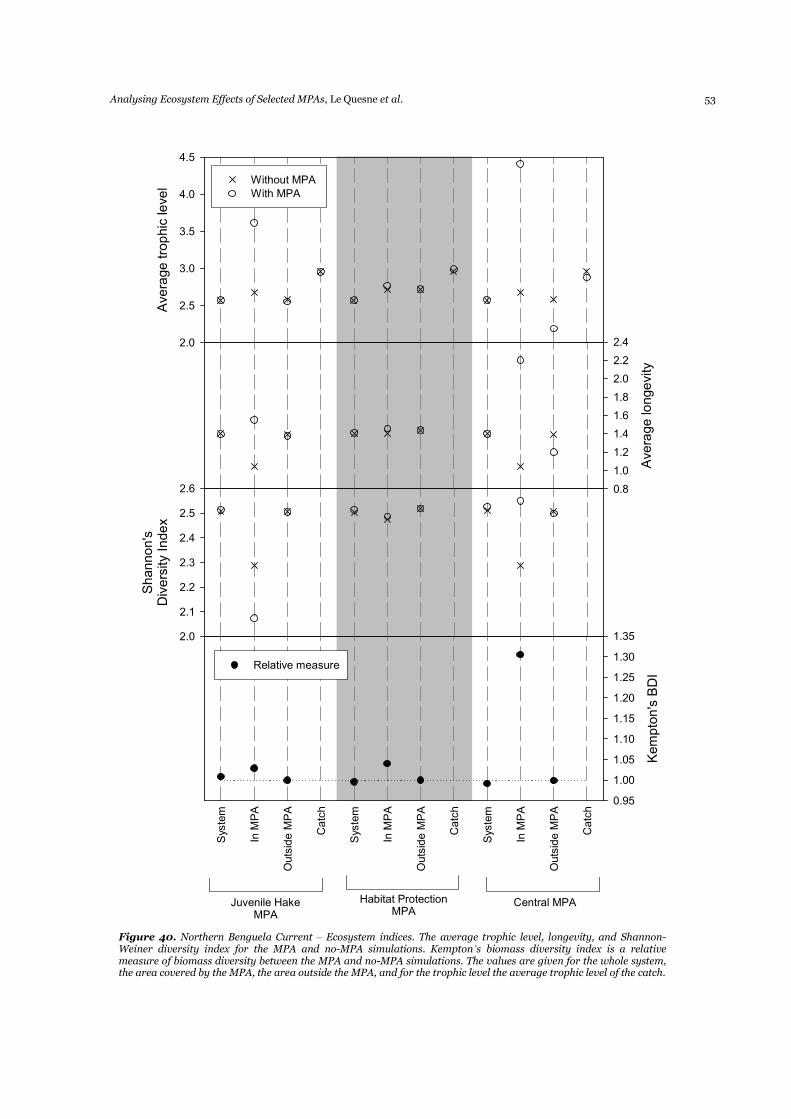
Analysing Ecosystem Effects of Selected MPAs, Le Quesne et al. 53
Average trophic level
2.0
2.5
3.0
3.5
4.0
4.5
Without MPA
With MPA
Shannon's
Diversity Index
2.0
2.1
2.2
2.3
2.4
2.5
2.6
Average longevity
0.8
1.0
1.2
1.4
1.6
1.8
2.0
2.2
2.4
Juvenile HakeMPA
Habitat ProtectionMPA
Central MPA
System
In MPA
Outside MPA
Catch
System
In MPA
Outside MPA
Catch
System
In MPA
Outside MPA
Catch
Kempton's BDI
0.95
1.00
1.05
1.10
1.15
1.20
1.25
1.30
1.35
Relative measure
Figure 40. Northern Benguela Current – Ecosystem indices. The average trophic level, longevity, and Shannon-Weiner diversity index for the MPA and no-MPA simulations. Kempton’s biomass diversity index is a relative measure of biomass diversity between the MPA and no-MPA simulations. The values are given for the whole system, the area covered by the MPA, the area outside the MPA, and for the trophic level the average trophic level of the catch.
54 Analysing Ecosystem Effects of Selected MPAs, Le Quesne et al.
3.5 NORTHERN GULF OF CALIFORNIA
3.5.1 Biosphere Reserve
The total catch declined by 23% as a result of the Biosphere Reserve (Figure 41). There was a decline in the catch of nearly all groups, with only 3 groups showing an increase in catch as a result of the MPA. The MPA was partially established to protect the endangered totoaba (Totoaba macdonaldi) and vaquita (Phocoena sinus). The catch of adult and juvenile totoaba and vaquita declined as a result of establishment of the Biosphere Reserve. The overall biomass of the system increased very slightly (0.01%), and the biomass of groups with a trophic level greater than 1 showed a slightly larger increase (0.14%) (Figure 41). The change in biomass of most groups was limited. Adult totoaba showed the largest increase in biomass, increasing by 37% compared to simulations without the Biosphere Reserve, while the vaquita also increased by 25%. The Biosphere Reserve made no effect on the average trophic level of the system, but the trophic level of the catch increased very slightly (Figure 44). Shannon’s diversity index, average longevity and Kempton’s BDI all increased compared to the no-MPA simulation.
3.5.2 Vaquita Refuge and Biosphere Reserve
The establishment of the Vaquita Refuge in addition to the Biosphere Reserve (hereafter called the Vaquita Refuge) led to a 40% reduction in total catch compared to the no-MPA scenario (Figure 42). Addition of the Vaquita Refuge led to a greater decline in vaquita catch than with the Biosphere reserve by itself. The catch of all groups declined as a result of the Vaquita Refuge, apart from Merluccidae, Serranidae and Macrophytes, which increased by 99, 7 and 124% respectively. The overall biomass of the system increased slightly (Figure 42). Vaquita showed the greatest benefit from the Vaquita Refuge, its biomass increasing by 46% compared to the no-MPA simulation. The pattern in change in biomass per group was similar to that for the Biosphere Reserve by itself, although accentuated for some groups. The average trophic level of the catch increased slightly following the establishment of the Vaquita Refuge, and the average trophic level of the system was not affected (Figure 44). The average longevity, Shannon’s and Kempton’s BDI all increased as a result of the Vaquita Refuge.
3.5.3 Shallow water closure
The shallow water closure led to a 0.5% increase in total catch (Figure 43). The catch of individual groups varied by ±15%. The MPA was established to protect shrimp nursery and spawning grounds to enhance the shrimp fishery. The catch of the shrimps L. stylirostris and F. californiensis varied by -11% and +1.5% respectively, their biomasses changed by +3.9 and -0.4% respectively as a result of the shallow water closure (Figure 43). The total biomass of the system declined slightly as a result of the MPA, and this was more pronounced when groups with a trophic level of 1 were excluded from the calculation. There was no change in the average trophic level of the system or the catch as a result of the shallow water closure (Figure 44). The average longevity and Shannon’s diversity index declined as a result of the shallow water closure, although Kempton’s BDI increased.
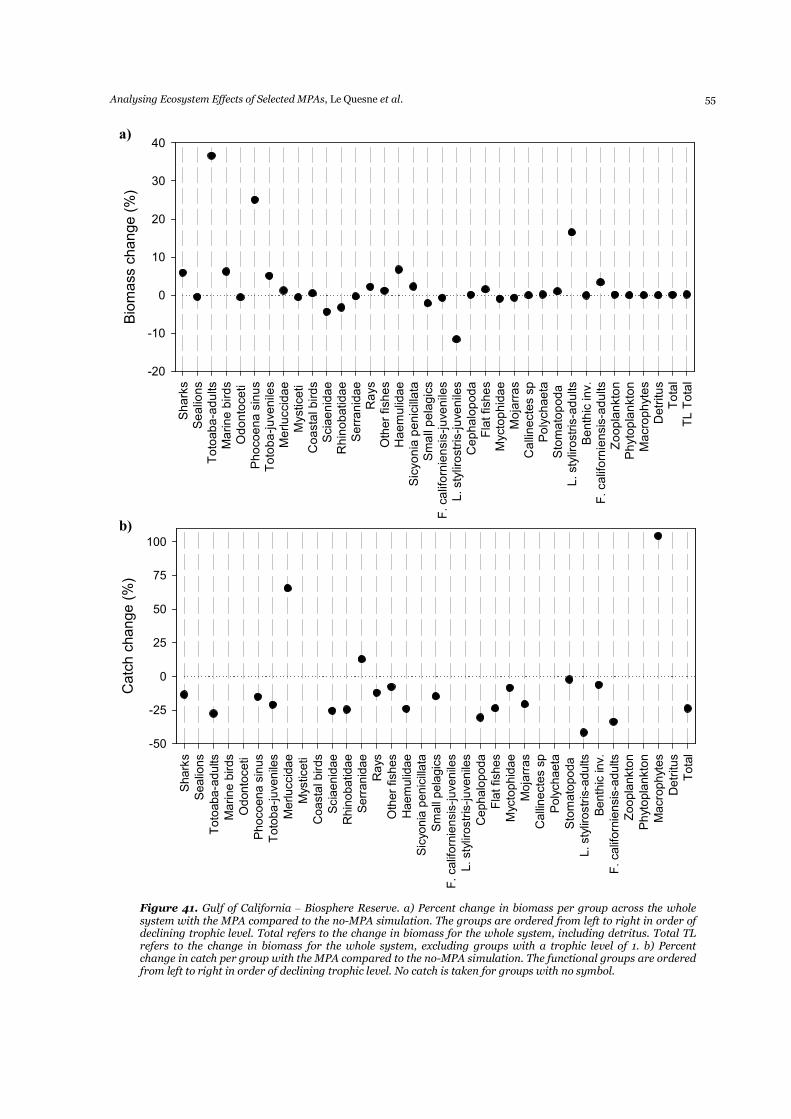
Analysing Ecosystem Effects of Selected MPAs, Le Quesne et al. 55
Sharks
Sealions
Totoaba-adults
Marine birds
Odontoceti
Phocoena sinus
Totoba-juveniles
Merluccidae
Mysticeti
Coastal birds
Sciaenidae
Rhinobatidae
Serranidae
Rays
Other fishes
Haemulidae
Sicyonia penicillata
Small pelagics
F. californiensis-juveniles
L. stylirostris-juveniles
Cephalopoda
Flat fishes
Myctophidae
Mojarras
Callinectes sp
Polychaeta
Stomatopoda
L. stylirostris-adults
Benthic inv.
F. californiensis-adults
Zooplankton
Phytoplankton
Macrophytes
Detritus
Total
TL Total
Biomass change (%)
-20
-10
0
10
20
30
40
Sharks
Sealions
Totoaba-adults
Marine birds
Odontoceti
Phocoena sinus
Totoba-juveniles
Merluccidae
Mysticeti
Coastal birds
Sciaenidae
Rhinobatidae
Serranidae
Rays
Other fishes
Haemulidae
Sicyonia penicillata
Small pelagics
F. californiensis-juveniles
L. stylirostris-juveniles
Cephalopoda
Flat fishes
Myctophidae
Mojarras
Callinectes sp
Polychaeta
Stomatopoda
L. stylirostris-adults
Benthic inv.
F. californiensis-adults
Zooplankton
Phytoplankton
Macrophytes
Detritus
Total
Catch change (%)
-50
-25
0
25
50
75
100
Figure 41. Gulf of California – Biosphere Reserve. a) Percent change in biomass per group across the whole system with the MPA compared to the no-MPA simulation. The groups are ordered from left to right in order of declining trophic level. Total refers to the change in biomass for the whole system, including detritus. Total TL refers to the change in biomass for the whole system, excluding groups with a trophic level of 1. b) Percent change in catch per group with the MPA compared to the no-MPA simulation. The functional groups are ordered from left to right in order of declining trophic level. No catch is taken for groups with no symbol.
a)
b)
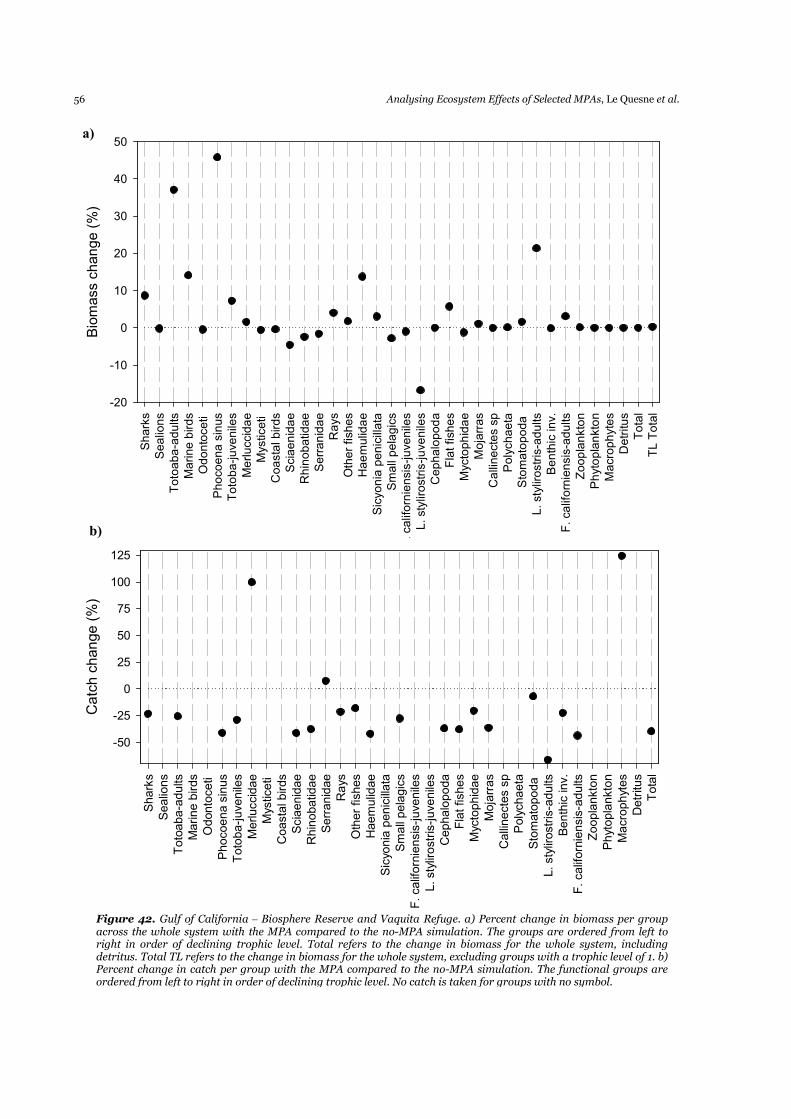
56 Analysing Ecosystem Effects of Selected MPAs, Le Quesne et al.
Sharks
Sealions
Totoaba-adults
Marine birds
Odontoceti
Phocoena sinus
Totoba-juveniles
Merluccidae
Mysticeti
Coastal birds
Sciaenidae
Rhinobatidae
Serranidae
Rays
Other fishes
Haemulidae
Sicyonia penicillata
Small pelagics
F. californiensis-juveniles
L. stylirostris-juveniles
Cephalopoda
Flat fishes
Myctophidae
Mojarras
Callinectes sp
Polychaeta
Stomatopoda
L. stylirostris-adults
Benthic inv.
F. californiensis-adults
Zooplankton
Phytoplankton
Macrophytes
Detritus
Total
TL Total
Biomass change (%)
-20
-10
0
10
20
30
40
50Sharks
Sealions
Totoaba-adults
Marine birds
Odontoceti
Phocoena sinus
Totoba-juveniles
Merluccidae
Mysticeti
Coastal birds
Sciaenidae
Rhinobatidae
Serranidae
Rays
Other fishes
Haemulidae
Sicyonia penicillata
Small pelagics
F. californiensis-juveniles
L. stylirostris-juveniles
Cephalopoda
Flat fishes
Myctophidae
Mojarras
Callinectes sp
Polychaeta
Stomatopoda
L. stylirostris-adults
Benthic inv.
F. californiensis-adults
Zooplankton
Phytoplankton
Macrophytes
Detritus
Total
Catch change (%)
-50
-25
0
25
50
75
100
125
Figure 42. Gulf of California – Biosphere Reserve and Vaquita Refuge. a) Percent change in biomass per group across the whole system with the MPA compared to the no-MPA simulation. The groups are ordered from left to right in order of declining trophic level. Total refers to the change in biomass for the whole system, including detritus. Total TL refers to the change in biomass for the whole system, excluding groups with a trophic level of 1. b) Percent change in catch per group with the MPA compared to the no-MPA simulation. The functional groups are ordered from left to right in order of declining trophic level. No catch is taken for groups with no symbol.
a)
b)
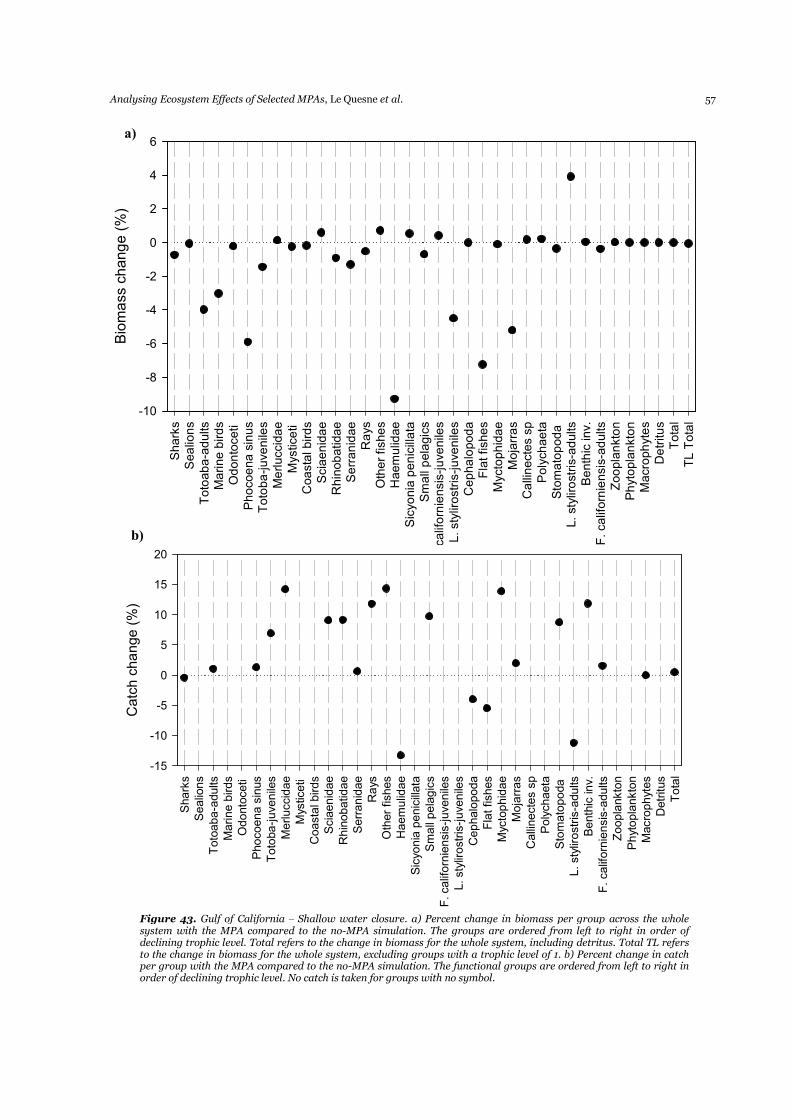
Analysing Ecosystem Effects of Selected MPAs, Le Quesne et al. 57
Sharks
Sealions
Totoaba-adults
Marine birds
Odontoceti
Phocoena sinus
Totoba-juveniles
Merluccidae
Mysticeti
Coastal birds
Sciaenidae
Rhinobatidae
Serranidae
Rays
Other fishes
Haemulidae
Sicyonia penicillata
Small pelagics
F. californiensis-juveniles
L. stylirostris-juveniles
Cephalopoda
Flat fishes
Myctophidae
Mojarras
Callinectes sp
Polychaeta
Stomatopoda
L. stylirostris-adults
Benthic inv.
F. californiensis-adults
Zooplankton
Phytoplankton
Macrophytes
Detritus
Total
TL Total
Biomass change (%)
-10
-8
-6
-4
-2
0
2
4
6
Sharks
Sealions
Totoaba-adults
Marine birds
Odontoceti
Phocoena sinus
Totoba-juveniles
Merluccidae
Mysticeti
Coastal birds
Sciaenidae
Rhinobatidae
Serranidae
Rays
Other fishes
Haemulidae
Sicyonia penicillata
Small pelagics
F. californiensis-juveniles
L. stylirostris-juveniles
Cephalopoda
Flat fishes
Myctophidae
Mojarras
Callinectes sp
Polychaeta
Stomatopoda
L. stylirostris-adults
Benthic inv.
F. californiensis-adults
Zooplankton
Phytoplankton
Macrophytes
Detritus
Total
Catch change (%)
-15
-10
-5
0
5
10
15
20
a)
b)
Figure 43. Gulf of California – Shallow water closure. a) Percent change in biomass per group across the whole system with the MPA compared to the no-MPA simulation. The groups are ordered from left to right in order of declining trophic level. Total refers to the change in biomass for the whole system, including detritus. Total TL refers to the change in biomass for the whole system, excluding groups with a trophic level of 1. b) Percent change in catch per group with the MPA compared to the no-MPA simulation. The functional groups are ordered from left to right in order of declining trophic level. No catch is taken for groups with no symbol.
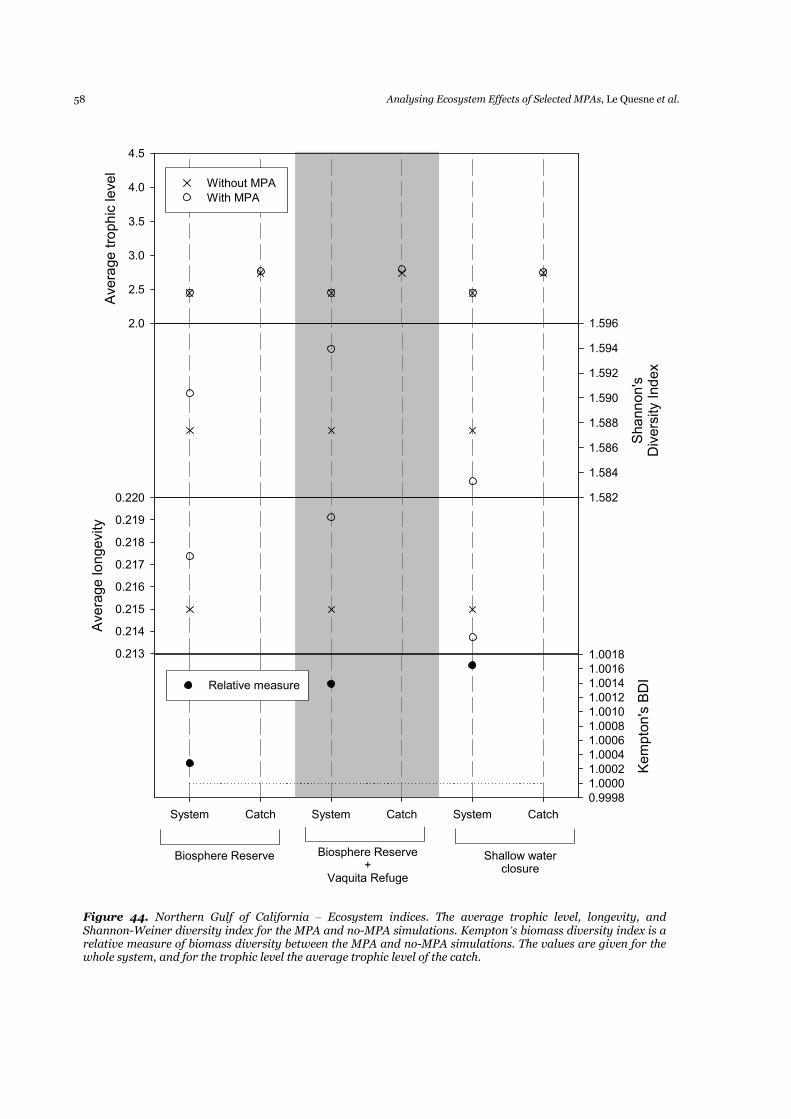
58 Analysing Ecosystem Effects of Selected MPAs, Le Quesne et al.
Figure 44. Northern Gulf of California – Ecosystem indices. The average trophic level, longevity, and Shannon-Weiner diversity index for the MPA and no-MPA simulations. Kempton’s biomass diversity index is a relative measure of biomass diversity between the MPA and no-MPA simulations. The values are given for the whole system, and for the trophic level the average trophic level of the catch.
Average trophic level
2.0
2.5
3.0
3.5
4.0
4.5
Without MPA
With MPA
Shannon's
Diversity Index
1.582
1.584
1.586
1.588
1.590
1.592
1.594
1.596
Average longevity
0.213
0.214
0.215
0.216
0.217
0.218
0.219
0.220
Biosphere Reserve Biosphere Reserve+
Vaquita Refuge
Shallow waterclosure
System Catch System Catch System Catch
Kempton's BDI
0.9998
1.0000
1.0002
1.0004
1.0006
1.0008
1.0010
1.0012
1.0014
1.0016
1.0018
Relative measure
Analysing Ecosystem Effects of Selected MPAs, Le Quesne et al. 59
4. DISCUSSION
The Ecospace simulations of three different MPAs in each of five different regions show no consistent predicted response by ecosystems or fisheries to establishment of an MPA. The simulations predict that total catch, total biomass of trophic levels greater than one, trophic level of the catch, system longevity, Shannon’s diversity index and Kempton’s BDI can increase or decline in response to MPA establishment (Figure 45). The only indicator that showed a consistent response to the establishment of an MPA was the average trophic level of the system, which did not change between the no-MPA and MPA simulations for any of the scenarios examined.
4.1 FISHERY EFFECTS OF MPAS
The variation in qualitative response of total catch to MPA establishment implies that MPAs are not predicted to consistently lead to an overall increase in total catch (Figure 46). The qualitative and quantitative response of total catch to MPA establishment did not show any relationship to MPA size when all the MPA simulations were considered (Figure 45b). However, when only the permanent no-take zones are considered, there appears to be a relationship between greater decline in total catch with increasing proportional MPA size (Figure 45b – red symbols). In some simulations there was an overall increase in catch, and in all simulations the catch of some individual groups increased as a result of MPA establishment. Thus, although there were no consistent benefits from MPAs, in some instances MPA establishment did benefit fisheries for specific target species and lead to an overall benefit to the fisheries. Specifically, yield of adult red grouper from the Campeche Bank increased by 7.4%, whilst total yield was unaffected from establishment of MPA 3, and there were 19% and 9% increases in total yield resulting from the establishment of the Inshore Closed Line and Summer Closure in the East China Sea. Eight of the MPAs were designed as fishery management MPAs to benefit either one or two specific target species. The simulations predicted that for three of these eight fisheries MPAs, the catch of the target species declined as a result of the MPA; for a further two simulations, there was a decline in the catch of one of the two target species, and in one simulation the MPA had no effect on the catch of the target species (Figure 47). Thus, in only two of the eight fishery MPAs simulated did the MPA lead to an increase in yield of the target species compared to the otherwise identical no-MPA scenario (Campeche Bank, MPA 3; North Sea, Cod Box). For three of the fishery MPAs, there was an increase in biomass of all target species, and in a further two there was an increase in biomass of one of the two target species. In the remaining three simulations of fishery MPAs there was a decline in the biomass of the target species. Results from theoretical single species studies of mobile species indicate that when a population is overfished (F > Fmax), the setting up of an MPA can lead to an increase in yield and biomass, even if effort if re-distributed following introduction of a closure (Guénette and Pitcher 1999; Hilborn et al. 2006). Biomass and yield are expected to increase with increasing MPA size, until optimum MPA size is reached after which yield will decline with further increases in MPA size (Le Quesne and Codling submitted). The predicted optimum MPA size for an overfished mobile population will vary depending on mobility, effort and larval dispersal, although estimates range between 5 and 80% depending on stock characteristics (Hannesson 1998; Guénette and Pitcher 1999; Guénette et al. 2000; Le Quesne and Codling submitted). MPAs can support the yield taken from the fished area due to an increase in size of fish in the fished area due to spillover of large individuals from the MPA, and through increased recruitment if the MPA allows a buildup of spawning stock biomass in an otherwise recruit-overfished population (Guénette and Pitcher 1999; Le Quesne and Codling submitted). Therefore, given the expected fishery benefits from MPAs, and although fishery benefits were seen in some instances, it is interesting to consider why fishery benefits from MPAs were not more widely seen in the simulations. As previously noted, it is beyond the scope of this study to examine the specific mechanisms leading to the gross results predicted for each simulation. However, it is interesting to postulate that the limited fisheries benefits seen in these simulations compared to more generic single-species population models is due to the explicit consideration of trophic interactions by Ecospace models. More specifically the build-up of biomass inside MPAs within the Ecospace models may be limited intra-specific competition in contrast to standard single-species models that do not incorporate these effects.
60 Analysing Ecosystem Effects of Selected MPAs, Le Quesne et al.
Overall yield increases of up to 19% were seen in some instances, but not others. It is interesting to consider whether this was due to ‘incorrect’ sizing and siting of MPAs in the instances where benefits to yield were not seen, or whether the nature of some systems and the fisheries that operate in them mean that some systems are inherently more amenable to MPA management than others. Simulation of a wider range of MPA sizes and locations would have be examined to address this question. However, the maximum yield increase that can be generate following optimal MPA establishment depends on the extent to which a fishery is exploited prior to establishment; the more impacted a system the greater the possible benefits resulting from MPA establishment. The extent to which systems are impacted by fishing undoubtedly does vary between systems, although all the systems considered in this report are considered highly impacted by fisheries. It should also be considered that the different responses to MPA establishment seen between the systems may reflect differences in the model parameterisations that do not reflect true ecological differences between the systems. For example, the effect of a small MPA on a population decreases as mobility increases (Le Quesne and Codling submitted). Due to data limitations the base dispersal rate for all groups in the Campeche Bank model were left at the default setting of 300 km yr-1. The Campeche Bank model covers an area of 600 x 700 km. Therefore, all groups in the Campeche Bank model can be considered to be highly mobile within the model space, and it is therefore unsurprising that the three small MPAs simulated in the Campeche Bank (<2% of the model area) had little impact on the system. A more detailed sensitivity analysis of the models used in this study would be necessary to determine the extent to which variation in the response of the models to MPAs are caused by differences between the models that do not reflect real ecological differences between the systems. Change in biomass for inside and outside the MPAs was only available for the North Sea and Northern Benguela Current simulations. These results indicate that for the fisheries MPAs where there was an overall reduction in biomass of the target species, there was an increase in biomass of the target species within the MPAs. However, this was offset by a larger absolute decline in biomass outside the MPAs. The redistribution of fishing effort from within the MPAs to outside is likely to be the main driver behind the reduction in target species biomass outside the MPAs. However, trophic interactions may further modulate the effects of the redistribution of fishing effort on biomass inside and outside the MPA. In all simulations, the establishment of an MPA led to variation in the qualitative response of catch and profitability by the different fleets in each system. Thus, even for simulations where the establishment of an MPA led to an overall benefit to the fishery, some sectors (fleets) of the fishery would incur costs, or gain no benefit, from the MPA. Conversely when the establishment of an MPA leads to an overall reduction in the fishery, some sectors of the fishery remain unaffected, or even derive benefit from the MPA. This demonstrates that MPA establishment may lead to trade-offs and conflict within a fishery, as a specific MPA can have different qualitative effects on the different sectors that make up the overall fishery. The simulations of the case study MPAs indicate that the fishery benefits of MPAs are limited, and in no case did an MPA lead to consistent benefits for all sectors of a fishery. MPAs can lead to an increase in yield of target species, and an increase in profitability for some sectors of a fishery; however, in only three of eight MPAs designed to benefit specific fisheries was the introduction of the MPA predicted to lead to an increase in yield of a target species (Figure 47).
4.2 ECOSYSTEM EFFECTS OF MPAS
Biodiversity and ecosystem indices of the whole system showed a variety of responses to MPAs (Figure 46). Even for the cases where the effects of MPA establishment were examined separately inside the MPAs, there was no consistent response by the ecosystem metrics to MPA establishment. However, determination of the ecosystem effects of MPAs in terms of ecosystem structure and biodiversity is hampered by the lack of consensus on the ecosystem effects of fishing, and the choice of indices best used to measure these impacts (see Section 2.3). Similarly there are no indices for which even simply examining direction of change can be consistently taken to indicate that a system is moving towards a less impacted state (Bianchi et al. 2000; Rice 2000; Rochet and Trenkel 2003; Piet and Jennings 2005). Therefore it is not possible to simply determine whether an MPA is ‘beneficial’ to an ecosystem by examining the direction of change in ecosystem metrics without having an idea of the desired state to which each specific ecosystem should return.
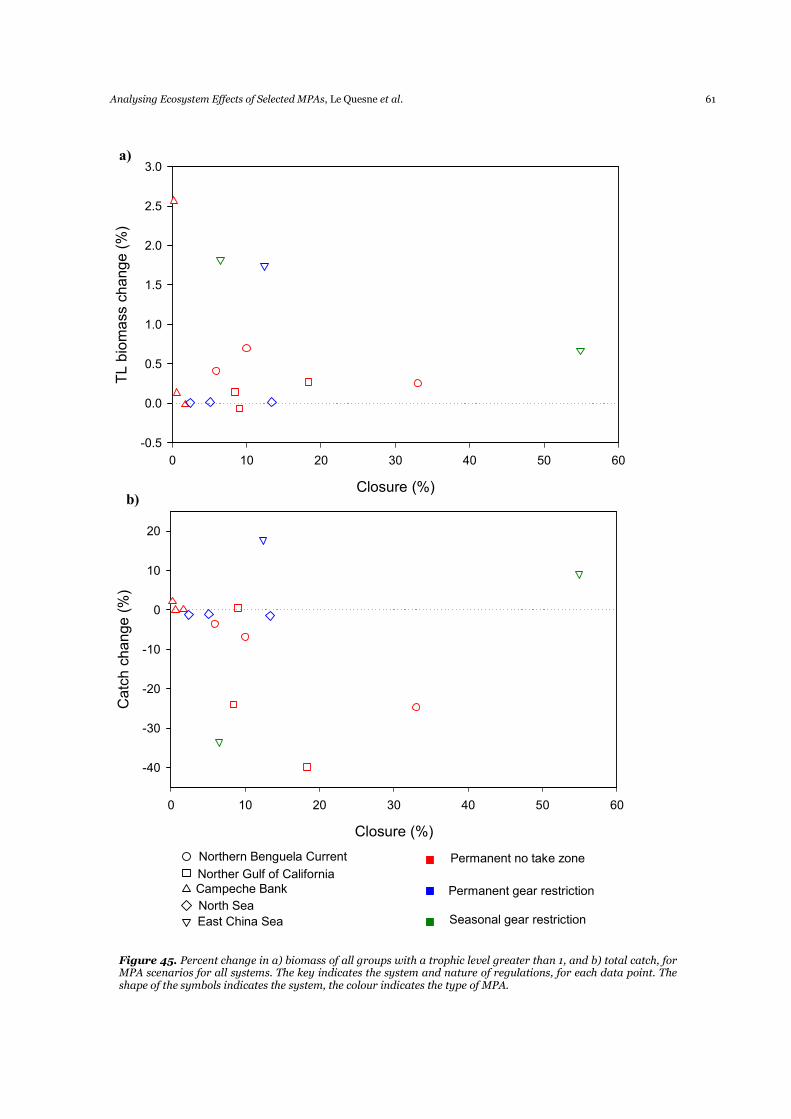
Analysing Ecosystem Effects of Selected MPAs, Le Quesne et al. 61
Closure (%)
0 10 20 30 40 50 60
TL biomass change (%)
-0.5
0.0
0.5
1.0
1.5
2.0
2.5
3.0
Closure (%)
0 10 20 30 40 50 60
Catch change (%)
-40
-30
-20
-10
0
10
20
Northern Benguela Current
Norther Gulf of California
Campeche Bank
North Sea
East China Sea
Permanent no take zone
Permanent gear restriction
Seasonal gear restriction
Figure 45. Percent change in a) biomass of all groups with a trophic level greater than 1, and b) total catch, for MPA scenarios for all systems. The key indicates the system and nature of regulations, for each data point. The shape of the symbols indicates the system, the colour indicates the type of MPA.
a)
b)
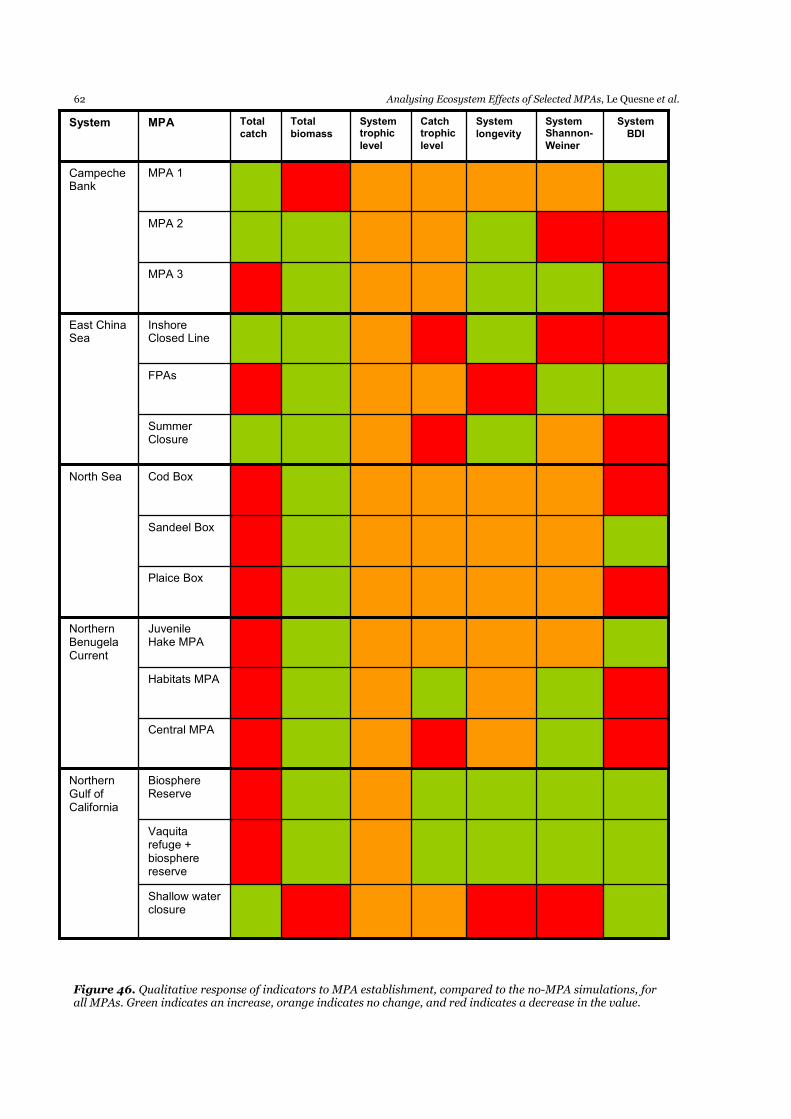
62 Analysing Ecosystem Effects of Selected MPAs, Le Quesne et al.
Shallow water closure
Vaquita refuge + biosphere reserve
Biosphere Reserve
Northern Gulf of California
Central MPA
Habitats MPA
Juvenile Hake MPA
Northern Benugela Current
Plaice Box
Sandeel Box
Cod Box North Sea
Summer Closure
FPAs
Inshore Closed Line
East China Sea
MPA 3
MPA 2
MPA 1 Campeche Bank
System
BDI
System Shannon-
Weiner
System
longevity
Catch trophic
level
System trophic
level
Total
biomass
Total
catch MPA System
Figure 46. Qualitative response of indicators to MPA establishment, compared to the no-MPA simulations, for all MPAs. Green indicates an increase, orange indicates no change, and red indicates a decrease in the value.
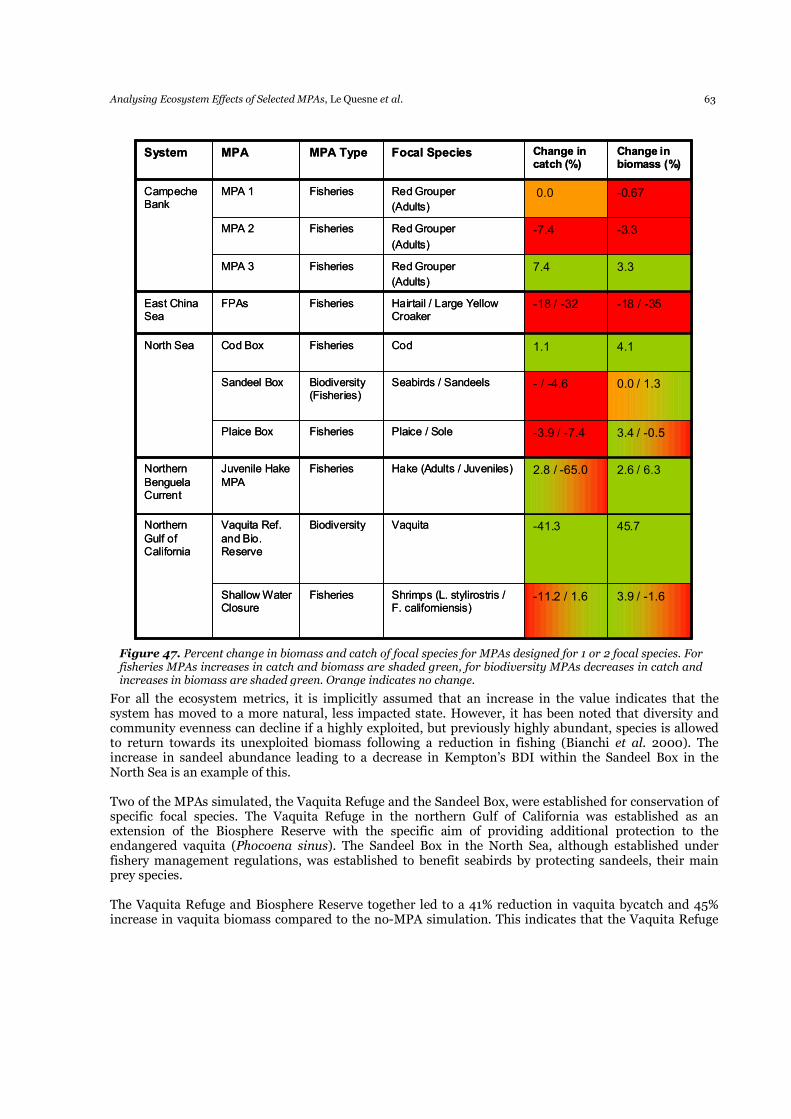
Analysing Ecosystem Effects of Selected MPAs, Le Quesne et al. 63
For all the ecosystem metrics, it is implicitly assumed that an increase in the value indicates that the system has moved to a more natural, less impacted state. However, it has been noted that diversity and community evenness can decline if a highly exploited, but previously highly abundant, species is allowed to return towards its unexploited biomass following a reduction in fishing (Bianchi et al. 2000). The increase in sandeel abundance leading to a decrease in Kempton’s BDI within the Sandeel Box in the North Sea is an example of this. Two of the MPAs simulated, the Vaquita Refuge and the Sandeel Box, were established for conservation of specific focal species. The Vaquita Refuge in the northern Gulf of California was established as an extension of the Biosphere Reserve with the specific aim of providing additional protection to the endangered vaquita (Phocoena sinus). The Sandeel Box in the North Sea, although established under fishery management regulations, was established to benefit seabirds by protecting sandeels, their main prey species. The Vaquita Refuge and Biosphere Reserve together led to a 41% reduction in vaquita bycatch and 45% increase in vaquita biomass compared to the no-MPA simulation. This indicates that the Vaquita Refuge
Figure 47. Percent change in biomass and catch of focal species for MPAs designed for 1 or 2 focal species. For fisheries MPAs increases in catch and biomass are shaded green, for biodiversity MPAs decreases in catch and increases in biomass are shaded green. Orange indicates no change.
45.7-41.3VaquitaBiodiversityVaquita Ref.
and Bio. Reserve
Northern
Gulf of California
3.9 / -1.6-11.2 / 1.6Shrimps (L. stylirostris / F. californiensis)
FisheriesShallow Water Closure
2.6 / 6.32.8 / -65.0Hake (Adults / Juveniles)FisheriesJuvenile Hake
MPA
Northern
Benguela Current
3.4 / -0.5-3.9 / -7.4Plaice / SoleFisheriesPlaice Box
0.0 / 1.3- / -4.6Seabirds / SandeelsBiodiversity (Fisheries)
Sandeel Box
4.11.1CodFisheriesCod BoxNorth Sea
-18 / -35-18 / -32Hairtail / Large Yellow Croaker
FisheriesFPAsEast China Sea
3.37.4Red Grouper
(Adults)
FisheriesMPA 3
-3.3-7.4Red Grouper
(Adults)
FisheriesMPA 2
-0.670.0Red Grouper
(Adults)
FisheriesMPA 1Campeche Bank
Change in biomass (%)
Change in catch (%)
Focal SpeciesMPA TypeMPASystem
64 Analysing Ecosystem Effects of Selected MPAs, Le Quesne et al.
was effective in providing protection to the vaquita; however, the relative improvement in vaquita biomass does not necessarily indicate that the Vaquita Refuge would provide sufficient protection to allow an absolute increase in vaquita biomass. Moreover, protection of the vaquita with the combined Biosphere Reserve and Vaquita Refuge comes at the cost of a 40% reduction in total catch. The Biosphere Reserve was set up for a wider set of aims than just vaquita conservation, and therefore a fuller assessment of its benefits and effects should not just be limited to consideration of the effects on the vaquita. At the whole system level, the Sandeel Box led to a 4.5% reduction in the sandeel catch and a 1.3% increase in sandeel abundance. Within the Sandeel Box, sandeel biomass increased by 17.6%; however, this was not predicted to have an impact on seabird biomass. Seabird biomass remained constant both inside the MPA and across the whole system. An effect that was widely seen in the simulations where biomass changes and ecosystem metrics within and outside an MPA were examined separately, was that the direction of change in the biomass of a group, or of an ecosystem metric, across the whole system may be the opposite of the direction of change of the measure within the MPA. Thus whilst establishing an MPA may lead to the community within the MPA returning to a less impacted state, the redistribution in fishing effort may lead to the rest of the ecosystem becoming more impacted. When this is the case, can the MPA be considered to have been effective for biodiversity conservation and protecting ecosystem structure? This depends on whether the goal of management is to maintain the whole system in as unimpacted a state as possible, or whether the goal of management is to maintain some areas in as pristine a condition as possible, whilst allowing other areas to become more highly impacted. This normative decision is beyond the scope of science and should be addressed as a socio-political question. A clear understanding of the desired outcomes of marine management needs to be established in order for the goals of MPA establishment to be clearly known and understood. The outcomes of the simulations ranged from win/win to lose. The ‘win/win’ MPAs were the Inshore Closed Line and Summer Closure in the ECS, which both led to an increase in total yield and an increase in average longevity. The ‘lose’ MPAs were the FPAs in the ECS and the Plaice Box in the North Sea, as these MPAs led to a reduction in total yield and focal species yield and no benefits to average longevity. The Inshore Closed Line is a permanent gear restriction covering 12% of the ECS; the Summer Closure is a seasonal gear restriction that covers 55% of the ECS; the FPAs are a seasonal gear restriction covering 12% of the ECS; and the Plaice Box were modelled a permanent gear restrictions covering 5% of the North Sea. This indicates no immediate pattern in the restrictions and size required for successful MPA design.
4.3 CONCLUSIONS
Analysis of the multi-species, multi-fleet Ecospace ecosystem models of MPA effects reveals more complex interactions and trade-offs resulting from MPA establishment than is revealed by single-species models. None of the MPAs examined led to consistent benefits to all sectors of the fishery within a system or to the ecosystem structure across the whole system. A clear understanding of the desired benefits from an MPA and the acceptability of associated trade-offs is required in order to proceed with effective MPA designation. The simulations indicate that fishery benefits to target species can be achieved with an MPA, although in a majority of the cases examined, MPAs designed to benefit a specific targeted fishery are predicted to fail to achieve their goal. Similarly, in some instances MPA establishment led to a simultaneous overall increase in yield and average longevity, although in a majority of cases overall yield declined as a result of MPA establishment. This indicates that the possible benefits from MPA establishment in the absence of simultaneous effort limitation may be limited. However, further study is required to determine whether MPA benefits would have been more widely seen had MPAs been more appropriately sized and located, or if only limited and occasional benefits should be expected from the introduction of MPAs without additional effort controls. No consistent relationship between MPA size and MPA effects was observed. This coarse assessment of the effects of MPAs did not find any consistent trends that could be used to aid successful MPA design, and thus supports claims that successful MPAs need to be designed on a case-by-case basis (Hilborn et al. 2004). However further analysis needs to be conducted to establish if any consistent relationships
Analysing Ecosystem Effects of Selected MPAs, Le Quesne et al. 65
between MPA attributes (objectively defined size and location criteria) and MPA success exist, or if successful MPAs can only be designed on a case-by-case basis. Interpretation of the wider ecosystem structure and biodiversity benefits is hindered by a lack of consensus on what is considered a beneficial change in ecosystem structure and a lack of clear understanding of the goals of marine ecosystem management. It should be noted that these conclusions are drawn on the assumption that the Ecospace models used in this study provide reasonable predictions of the responses of the study ecosystems to MPA designation. In particular it should be noted that subsequent to these simulations being conducted a small error was discovered in the Ecopath software. It is thought that this error will mainly effect the quantitative outputs from the model, rather than the qualitative results.
ACKNOWLEDGEMENTS
The assistance of Dr Villy Christensen for providing advice and modifications to Ecospace is kindly acknowledged. Dr Shen Fang assisted with development of the East China Sea Ecospace model. This work was funded by the INCOFISH project (EU contract # 003739).
66 Analysing Ecosystem Effects of Selected MPAs, Le Quesne et al.
REFERENCES
Allison, G. W., Lubchenco, J. and Carr, M. H. 1998. Marine reserves are necessary but not sufficient for marine conservation. Ecological Applications 8: S79-S92.
Babcock, R. C., Kelly, S., Shears, N. T., Walker, J. W. and Willis, T. J. 1999. Changes in community structure in temperate marine reserves. Marine Ecology Progress Series 189: 125-134.
Bianchi, G., Gislason, H., Graham, K., Hill, L., Jin, X., Koranteng, K., Manickchand-Heileman, S., Payá, I., Sainsbury, K., Sanchez, F. and Zwanenburg, K. 2000. Impact of fishing on size composition and diversity of demersal fish communities. ICES Journal of Marine Science 57: 558-571.
Chen, Y. Q. and Shen, X. Q. 1999. Changes in the biomass of the East China Sea ecosystem. Large marine ecosystems of the Pacific rim: assessment, sustainability, and management. K. Sherman and Q. Tang, Blackwell Science, Oxford. pp 221-239.
Cheng, H. Q., Jiang, H., Xu, H. G., Wu, J., Ding, H., Le Quesne, W. and Arreguín-Sánchez, F. 2007. Spatial resources and fishery management framework in the East China Sea, p. 87–99. In: Le Quesne, W.J.F., Arreguín-Sánchez, F. and Heymans, J.J. (eds.) INCOFISH ecosystem models: transiting from Ecopath to Ecospace. Fisheries Centre Research Reports 15(6), Fisheries Centre, University of British Columbia.
Christensen, V. and Pauly, D. 1992. ECOPATH II - A software for balancing steady-state ecosystem models and calculating network characteristics. Ecological Modelling 61: 169-185.
Christensen, V. and Walters, C. J. 2004. Ecopath with Ecosim: methods, capabilities and limitations. Ecological Modelling 172: 109-139.
Christensen, V. and Walters, C. J. 2004. Trade-offs in ecosystem-scale optimization of fisheries management policies. Bulletin of Marine Science 74: 549-562.
Christensen, V., Walters, C. J. and Pauly, D. 2005. Ecopath with Ecosim: a user's guide., Fisheries Centre, University of British Columbia, Vancouver.: November 2005 edition, 154pp.
Cisneros-Mata, M. A. and Roman-Rodriguez, M. J. 1995. Life history and conservation of Totoaba macdonaldi. Conservation Biology 94: 806-814.
D’Agrossa, S., Lennert-Cody, C. and Vidal, O. 2000. Vaquita bycatch in Mexico's artisanal gillnets fisheries: driving a small population to extinction. Conservation Biology 14: 110-119.
Dulvy, N. K., Metcalfe, J. D., Glanville, J., Pawson, M. G. and Reynolds, J. D. 2000. Fishery stability, local extinctions, and shifts in community structure in skates. Conservation Biology 14: 283-293.
Essington, T. E. 2007. Evaluating the sensitivity of a trophic mass-balance model (Ecopath) to imprecise data inputs. Canadian Journal of Fisheries and Aquatic Science 64: 628-637.
FAO 2006. FAO Yearbook of Fishery Statistics. FAO, Rome.
Gell, F. R. and Roberts, C. M. 2003. Benefits beyond boundaries: the fishery effects of marine reserves. Trends in Ecology and Evolution 18: 448-455.
Gerber, L.R., Botsford, L.W., Hastings, A., Possingham, H.P., Gaines, S.D., Palumbi, S.R. and Andelman, S. 2003. Population models for marine reserve design: a retrospective and prospective synthesis. Ecological Applications 13(1 Supplement): S47-S64.
Guénette, S., Lauck, T. and Clark, C. 1998. Marine reserves: from Beverton and Holt to the present. Reviews in Fish Biology and Fisheries 8: 251-272.
Guénette, S. and Pitcher, T. J. 1999. An age-structured model showing the benefits of marine reserves in controlling overexploitation. Fisheries Research 39: 295-303.
Guénette, S., Pitcher, T. J. and Walters, C. J. 2000. The potential of marine reserves for the management of northern cod in Newfoundland. Bulletin of Marine Science 66: 831-852.
Hall, S. J. 1999. The effects of fishing on marine ecosystems and communities. Oxford, U.K., Blackwell Sciences Series on Fish Biology and Aquatic Resources.
Hannesson, R. 1998. Marine reserves: what would they accomplish? Marine Resources Economics 13: 159-170.
Heymans, J.J. and Sumaila, U.R. 2007. Updated ecosystem model for the northern Benguela ecosystem, Namibia, p. 25–70. In: Le Quesne, W.J.F., Arreguín-Sánchez, F. and Heymans, J.J. (eds.) INCOFISH ecosystem models: transiting from Ecopath to Ecospace. Fisheries Centre Research Reports 15(6), Fisheries Centre, University of British Columbia.
Hilborn, R., Micheli, F. and De Leo, G. A. 2006. Integrating marine protected areas with catch regulation. Canadian Journal of Fisheries and Aquatic Sciences 63: 642-649.
Hilborn, R., Stokes, K., Maguire, J.J., Smith, T., Botsford, L.W., Mangel, M., Orensanz, J., Parma, A., Rice, J., Bell, J., Cochrane, K.L., Garcia, S., Hall, S.J., Kirkwood, G.P., Sainsbury, K., Stefansson, G. and Walters, C. J. 2004. When can marine reserves improve fisheries management? Ocean & Coastal Management 47: 197-205.
Analysing Ecosystem Effects of Selected MPAs, Le Quesne et al. 67
Jaramillo Legorreta, A. M., Rojas Bracho, L. and Gerrodette, T. 1999. A new abundance estimate for vaquitas: first step for recovery. Marine Mammal Science 15: 957-973.
JMM 2003. Declaration of the Joint Ministerial Meeting of the Helsinki and OSPAR Commissions. Bremen, 25-26 June 2003.
Kellner, J. B., Tetreault, I., Gaines, S. D. and Nisbet, R. M. 2007. Fishing the line near marine reserves in single and multispecies fisheries. Ecological Applications 17(4): 1039-1054.
Kempton, R. A. and Taylor, L. R. 1976. Models and statistics for species diversity. Nature 262: 818-820.
Larkin, P. A. 1996. Concepts and issues in marine ecosystem management. Reviews in Fish Biology and Fisheries 6: 139-164.
Lauck, T. 1996. Uncertainty in fisheries management. In: D. V. Gordon and G. R. Munro. (eds.) Fisheries and Uncertainty: a Precautionary Approach to Fisheries Management. Calgary, Canada, University of Calgary Press: 91-105.
Le Quesne, W. J. F. and Codling, E. A. Submitted. Managing mobile species with MPAs; the interaction between mobility, larval dispersal and fishing mortality.
Lercari, D., Arreguín-Sánchez, F. and Le Quesne, W. 2007. An ecosystem simulation model of the northern Gulf of California, p. 100-113. In: Le Quesne, W.J.F., Arreguín-Sánchez, F. and Heymans, J.J. (eds.) INCOFISH ecosystem models: transiting from Ecopath to Ecospace. Fisheries Centre Research Reports 15(6), Fisheries Centre, University of British Columbia.
Mackinson, S., Blanchard, J. L., Pinnegar, J. K. and Scott, R. 2003. Consequences of alternative functional response formulations in models exploring whale-fishery interactions. Marine Mammal Science 19: 661-681.
Mackinson, S. and Daskalov, G. 2007. An ecosystem model of the North Sea for use in fisheries management and ecological research; description and parameterisation. CEFAS Technical Report 142.
Magurran, A. E. 1988. Ecological Diversity and Its Measurement. London, Chapman & Hall.
Murawski, S. A. 2000. Definitions of overfishing from an ecosystem perspective. ICES Journal of Marine Science 57: 649-658.
Odum, E. P. 1971. Fundamentals of Ecology. Philadelphia, PA, W.B. Saunders.
OSPAR 2003. Guidelines for the identification and selection of marine protected areas in the OSPAR maritime area. OSPAR Convention on the Protection of the Marine Environment of the North-East Atlantic. OSPAR 03/17/1-E: Annex 10.
Pauly, D., Christensen, V. and Walters, C. J. 2000. Ecopath, Ecosim and Ecospace as tools for evaluating ecosystem impact of fisheries. ICES Journal of Marine Science 57: 697-706.
Pauly, D., Watson, R. and Alder, J. 2005. Global trends in world fisheries: impacts on marine ecosystems and food security. Philosophical Transactions of the Royal Society B 360: 5-12.
Pelletier, D. and Mahévas, S. 2005. Spatially explicit fisheries simulation models for policy evaluation. Fish and Fisheries 6: 307-349.
Piet, G. J. and Jennings, S. 2005. Response of potential fish community indicators to fishing. ICES J. Mar. Sci. 62(2): 214-225.
Plaganyi, E. E. and Butterworth, D. S. 2004. A critical look at the potential of Ecopath with Ecosim to assist in practical fisheries management. African Journal of Marine Science 26: 261-287.
Rice, J. C. 2000. Evaluating fishery impacts using metrics of community structure. ICES Journal of Marine Science 57: 682-688.
Rochet, M.J. and Trenkel, V. M. 2003. Which community indicators can measure the impact of fishing? A review and proposals. Canadian Journal of Fisheries and Aquatic Science 60: 86-99.
Sainsbury, K. J., Campbell, R. A., Lindholm, R. and Whitelaw, A. W. 1997. Experimental management of an Australian multi-species fishery: examining the possibility of trawl-induced habitat modification. In: E. K. Pikitch, D. D. Huppert and M. P. Sissenwine. (eds.) Global Trends: Fisheries Management. Bethesda, Maryland, American Fisheries Society: 107-112.
Van der Westhuizen, A. 2001. A decade of exploitation and management of the Namibian hake stocks. South African Journal of Marine Science 23: 307-315.
Walters, C. J., Christensen, V. and Pauly, D. 1997. Structuring dynamic models of exploited ecosystems from trophic mass-balance assessments. Reviews in Fish Biology and Fisheries 7: 139-172.
Walters, C. J., Pauly, D. and Christensen, V. 1999. Ecospace: predictions of mesoscale spatial patterns in trophic relationships of exploited ecosystems, with emphasis on the impacts of marine protected areas. Ecosystems 2: 539-554.
Walters, C. J., Pauly, D., Christensen, V. and Kitchell, J. F. 2000. Representing density dependent consequences of life history strategies in aquatic ecosystems. Ecosystems 3: 70-83.


![16662073 Dynamic Ecosystem Endangered Ecosystem[1]](https://img.pdfslide.us/doc/110x75/577d295b1a28ab4e1ea691a3/16662073-dynamic-ecosystem-endangered-ecosystem1.jpg)