Embed Size (px)
Citation preview
Analyses of constraints to trade in FtF Africa countries and implications for USAID November 2018
1
• This work originated as a result of discussions held in September 2018
in Nairobi, focusing on the role of regional missions • It draws on their desire to engage with and support US companies who
may wish to invest in and trade with Africa – while supporting growth in the beneficiary countries
• The focus is therefore on opportunities for US companies to trade in ways that take advantage of AGOA (African Growth and Opportunity Act), and into the Feed the Future (FtF) target countries in Africa: Ethiopia, Ghana, Kenya, Mali, Niger, Nigeria, Senegal and Uganda
• In particular we focus on mapping the current trade situation, understanding barriers that may stand in the way, and case studies that show the transformational impact of some past investments
• This work will help investors, donors and advisors direct future work to identify, size and test opportunities for trade, and understand the transformational impact and operational difficulties they may see
Background to the document
2
• The work looks specifically at trade between US and African
FtF target countries – not intraregional trade between countries in Africa
• It focuses on formal trade flows – informal trade and smuggling are not included in the analysis
• While increasing trade flows and trade-related investments can boost food security, through improved livelihoods and better availability of food when local production is reduced (e.g. due to drought or flood), it does not focus on direct contributions to food security
• It starts from an understanding of current trade and barriers, and does not start from an assessment of opportunities
2
What this work is and is not
3
Executive summary and reading guide (1/2)
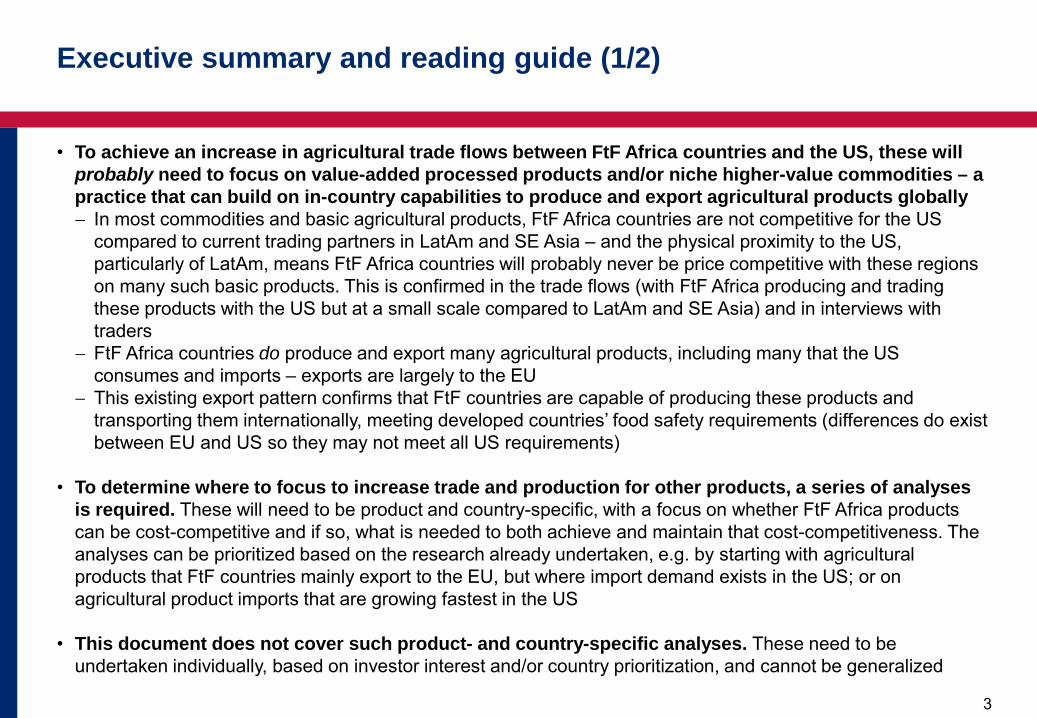
• To achieve an increase in agricultural trade flows between FtF Africa countries and the US, these will probably need to focus on value-added processed products and/or niche higher-value commodities – a practice that can build on in-country capabilities to produce and export agricultural products globally − In most commodities and basic agricultural products, FtF Africa countries are not competitive for the US
compared to current trading partners in LatAm and SE Asia – and the physical proximity to the US, particularly of LatAm, means FtF Africa countries will probably never be price competitive with these regions on many such basic products. This is confirmed in the trade flows (with FtF Africa producing and trading these products with the US but at a small scale compared to LatAm and SE Asia) and in interviews with traders
− FtF Africa countries do produce and export many agricultural products, including many that the US consumes and imports – exports are largely to the EU
− This existing export pattern confirms that FtF countries are capable of producing these products and transporting them internationally, meeting developed countries’ food safety requirements (differences do exist between EU and US so they may not meet all US requirements)
• To determine where to focus to increase trade and production for other products, a series of analyses
is required. These will need to be product and country-specific, with a focus on whether FtF Africa products can be cost-competitive and if so, what is needed to both achieve and maintain that cost-competitiveness. The analyses can be prioritized based on the research already undertaken, e.g. by starting with agricultural products that FtF countries mainly export to the EU, but where import demand exists in the US; or on agricultural product imports that are growing fastest in the US
• This document does not cover such product- and country-specific analyses. These need to be undertaken individually, based on investor interest and/or country prioritization, and cannot be generalized
4
Executive summary and reading guide (2/2)
• This document does provide guidance on what areas of competitiveness need to be explored next, and provides a more detailed analyses of barriers to trade. While it is important to understand which barriers to trade exist, those barriers may not be the key reason for low trade flows. It is important first to confirm the potential for competitiveness for a specific product / country combination, and only then look to address any pertinent trade barriers that restrict that trade. The document also outlines potential next steps for actors in this space – recognizing that private sector actors can and should engage, there is still an opportunity and need for donors to help strengthen these opportunities and overcome barriers
• Trade barriers exist in three categories, all of which this document explores − Constraints that exist across countries and across products for FtF–US trade − Constraints that apply to a specific product or product category, yet are seen consistently across countries − Constraints that apply to a specific country, yet are the same for most of the products from that country
5
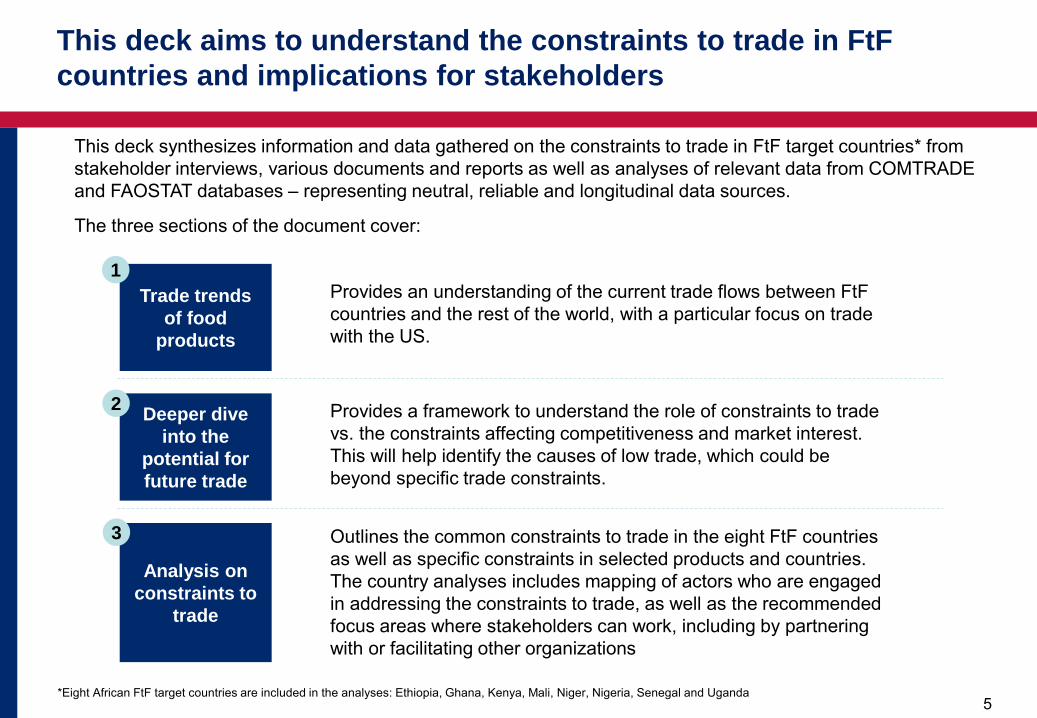
This deck synthesizes information and data gathered on the constraints to trade in FtF target countries* from stakeholder interviews, various documents and reports as well as analyses of relevant data from COMTRADE and FAOSTAT databases – representing neutral, reliable and longitudinal data sources.
The three sections of the document cover:
Trade trends of food
products
Deeper dive into the
potential for future trade
Analysis on constraints to
trade
Provides an understanding of the current trade flows between FtF countries and the rest of the world, with a particular focus on trade with the US.
Provides a framework to understand the role of constraints to trade vs. the constraints affecting competitiveness and market interest. This will help identify the causes of low trade, which could be beyond specific trade constraints.
Outlines the common constraints to trade in the eight FtF countries as well as specific constraints in selected products and countries. The country analyses includes mapping of actors who are engaged in addressing the constraints to trade, as well as the recommended focus areas where stakeholders can work, including by partnering with or facilitating other organizations
1
2
3
*Eight African FtF target countries are included in the analyses: Ethiopia, Ghana, Kenya, Mali, Niger, Nigeria, Senegal and Uganda
This deck aims to understand the constraints to trade in FtF countries and implications for stakeholders
6
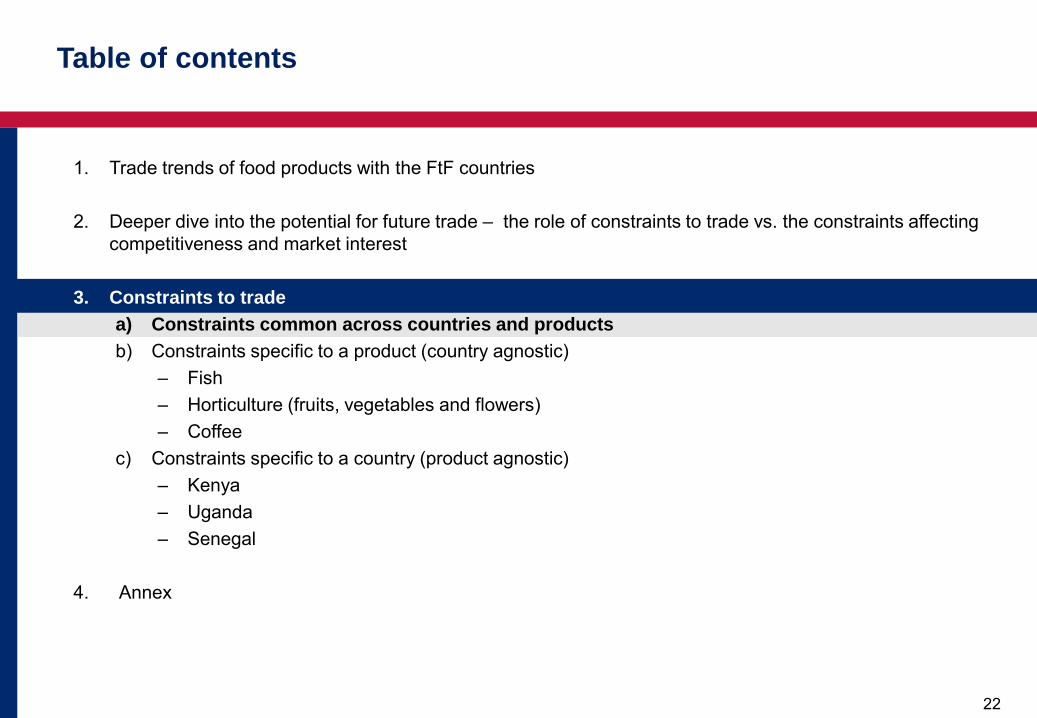
1. Trade trends of food products with the FtF countries
2. Deeper dive into the potential for future trade – the role of constraints to trade vs. the constraints affecting competitiveness and market interest
3. Constraints to trade a) Constraints common across countries and products b) Constraints specific to a product (country agnostic)
– Fish – Horticulture (fruits, vegetables and flowers) – Coffee
c) Constraints specific to a country (product agnostic) – Kenya – Uganda – Senegal
4. Annex
Table of contents
7
Our extensive analyses on trade flows, provided in a separate Annex, points to small US – FtF Africa agricultural trade
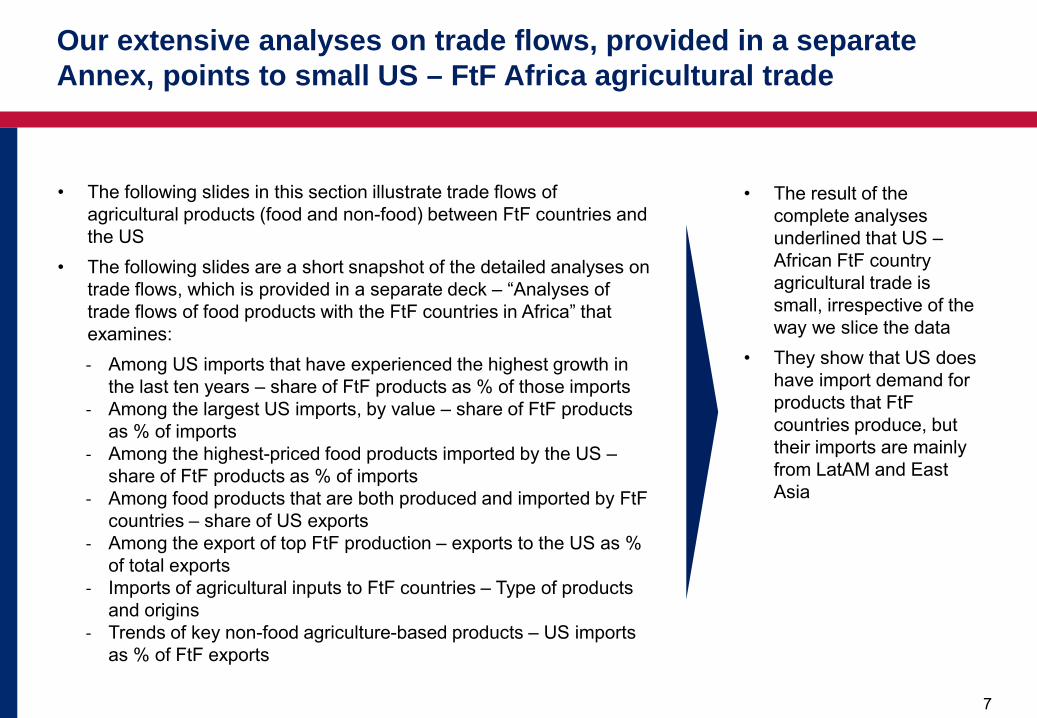
• The following slides in this section illustrate trade flows of agricultural products (food and non-food) between FtF countries and the US
• The following slides are a short snapshot of the detailed analyses on trade flows, which is provided in a separate deck – “Analyses of trade flows of food products with the FtF countries in Africa” that examines: - Among US imports that have experienced the highest growth in
the last ten years – share of FtF products as % of those imports - Among the largest US imports, by value – share of FtF products
as % of imports - Among the highest-priced food products imported by the US –
share of FtF products as % of imports - Among food products that are both produced and imported by FtF
countries – share of US exports - Among the export of top FtF production – exports to the US as %
of total exports - Imports of agricultural inputs to FtF countries – Type of products
and origins - Trends of key non-food agriculture-based products – US imports
as % of FtF exports
• The result of the complete analyses underlined that US – African FtF country agricultural trade is small, irrespective of the way we slice the data
• They show that US does have import demand for products that FtF countries produce, but their imports are mainly from LatAM and East Asia
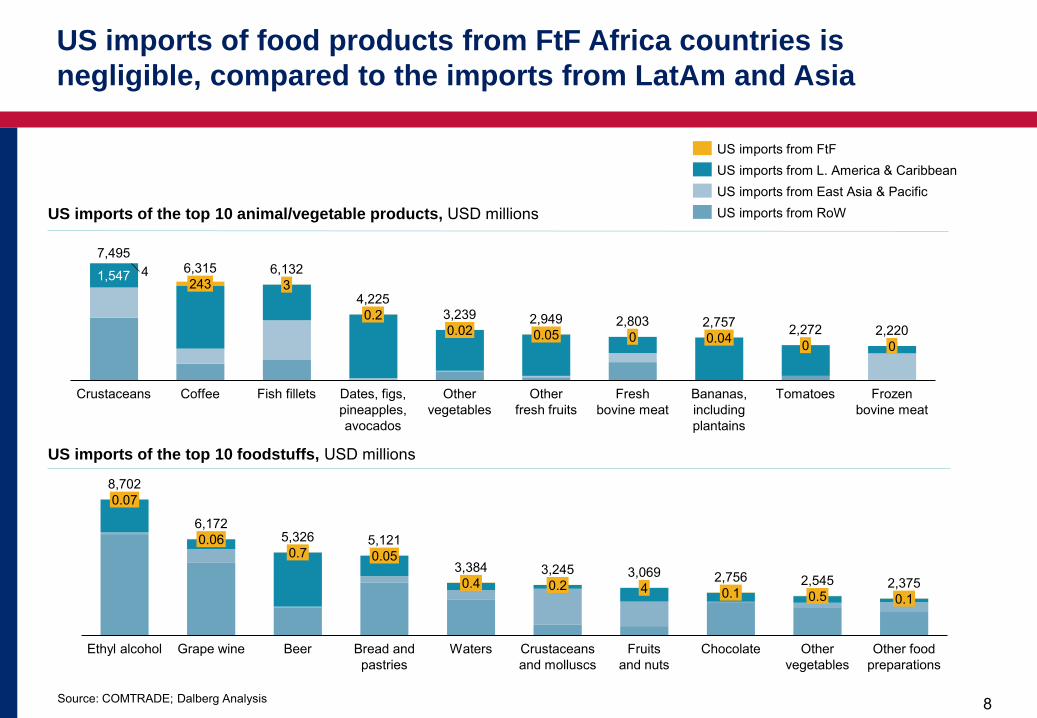
8 Source: COMTRADE; Dalberg Analysis
US imports of the top 10 animal/vegetable products, USD millions
243
Crustaceans
4 6,132 3
0
1,547
Coffee Fish fillets
0.2
Dates, figs, pineapples, avocados
Bananas, including plantains
0.02
4,225
Frozen bovine meat
0.05
Other fresh fruits
Fresh bovine meat
0.04 0
Tomatoes
0
7,495
3,239
6,315
2,949 2,803 2,757 2,272 2,220
Other vegetables
US imports from RoW
US imports from FtF US imports from L. America & Caribbean US imports from East Asia & Pacific
US imports of the top 10 foodstuffs, USD millions
0.07
Ethyl alcohol
0.06
Bread and pastries
Beer
0.05
Grape wine
4
0.7
0.4
Waters
0.2
Crustaceans and molluscs
Other food preparations
Fruits and nuts
0.1
Chocolate
0.5 2,545
Other vegetables
0.1
8,702
6,172 5,326 5,121
3,384 3,245 3,069 2,756 2,375
US imports of food products from FtF Africa countries is negligible, compared to the imports from LatAm and Asia
9 * Includes animal / vegetable products (HS codes 01–15) and foodstuffs (HS codes 16-24) **Emerging refers to BRICS countries; Source: COMTRADE data; Dalberg Analysis
9
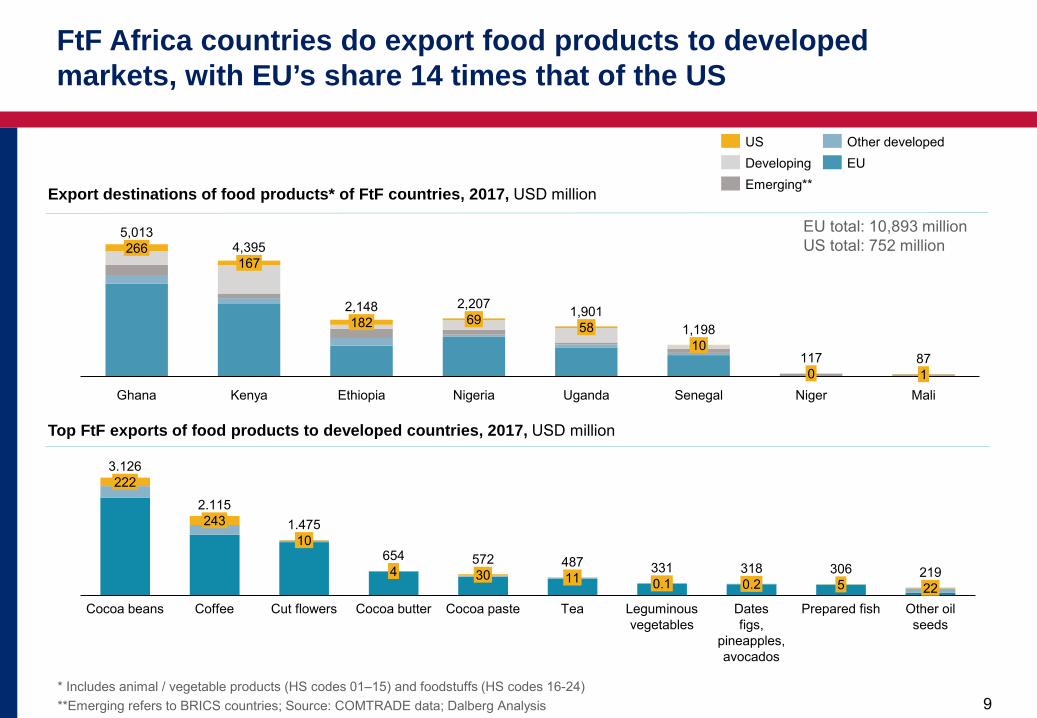
Top FtF exports of food products to developed countries, 2017, USD million
Cocoa butter
331
222
Cocoa beans
243
4
10 654
Coffee Cut flowers
30
Cocoa paste
1.475
11
Tea
0.1
Leguminous vegetables
0.2 318
Dates figs,
pineapples, avocados
5
Prepared fish 22
Other oil seeds
3.126
572
2.115
487 306 219
Export destinations of food products* of FtF countries, 2017, USD million
266
69
Ghana Kenya
167
182
Ethiopia Nigeria
58
Uganda
10
Senegal 0
Niger 1
Mali
5,013 4,395
2,148 2,207 1,901 1,198
117 87
Other developed US EU Developing
Emerging**
EU total: 10,893 million US total: 752 million
FtF Africa countries do export food products to developed markets, with EU’s share 14 times that of the US
10 Source: COMTRADE; Dalberg Analysis 10
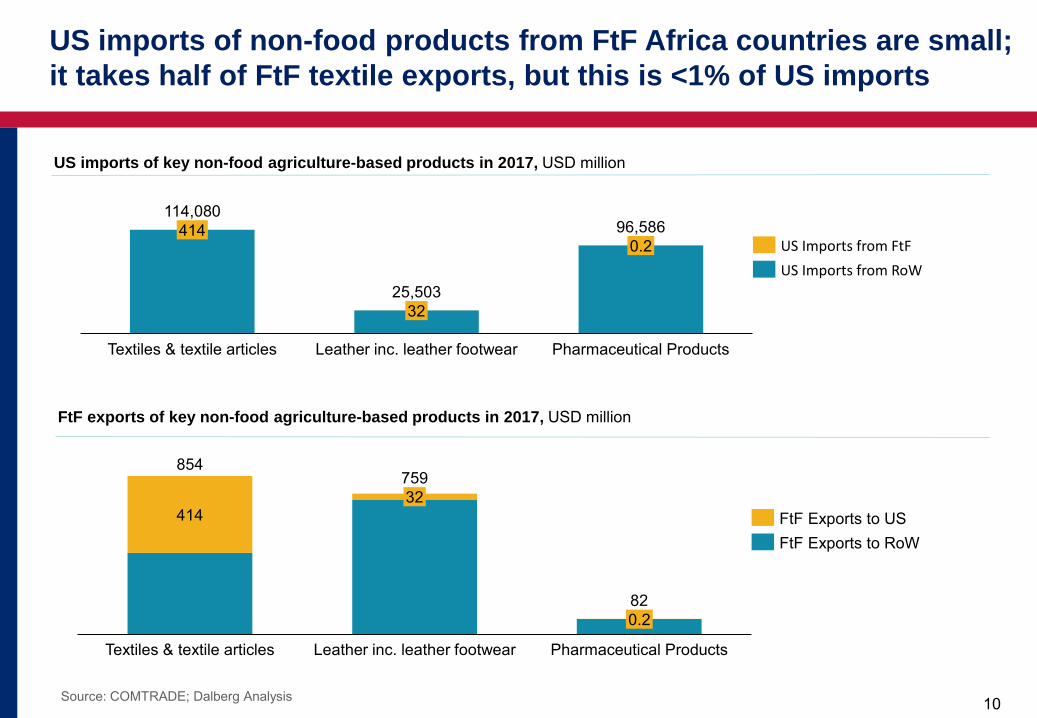
114,080 414
25,503
Leather inc. leather footwear Textiles & textile articles Pharmaceutical Products
32
0.2 96,586
US Imports from FtF US Imports from RoW
US imports of key non-food agriculture-based products in 2017, USD million
FtF exports of key non-food agriculture-based products in 2017, USD million
759
Pharmaceutical Products
854
414
Textiles & textile articles
32
Leather inc. leather footwear
0.2 82
FtF Exports to US FtF Exports to RoW
US imports of non-food products from FtF Africa countries are small; it takes half of FtF textile exports, but this is <1% of US imports
11
1. Trade trends of food products with the FtF countries
2. Deeper dive into the potential for future trade – the role of constraints to trade vs. the constraints affecting competitiveness and market interest
3. Constraints to trade a) Constraints common across countries and products b) Constraints specific to a product (country agnostic)
– Fish – Horticulture (fruits, vegetables and flowers) – Coffee
c) Constraints specific to a country (product agnostic) – Kenya – Uganda – Senegal
4. Annex
Table of contents
12
Further analyses are required to understand and prioritize the underlying drivers of low trade, looking at specific products
• We have seen that FtF countries in Africa are currently exporting food products to developed markets across the world, however, those exports to the US market are negligible
• While we have given a comprehensive picture of trade flows, the reasons behind them cannot be found in trade figures alone. Low trade flows can be the result of many different causes, not all of which relate to trade barriers: consumers can prefer products that are different from those Africa produces, African countries can lack price competitiveness with other suppliers, and strong existing trade relationships can be difficult for Africa to break into, e.g.:
‒ Coffee flavors differ between countries, even from the same bean variety, and certain tastes are preferred in different markets: coffees from Africa tend to be fruity and acidic, as opposed to the milder and lighter flavors of Central and South American coffees that US consumers are more used to and often prefer
‒ Maize yields in Africa are very low – most countries having yields of less than 2 tons / ha / year, compared to nearly 11 tons / ha / year in the US and 6 tons / ha / year in China, meaning that most African countries cannot compete in formal export markets – 70-80% of maize is traded informally – and in fact import maize to meet domestic demand
‒ Tomatoes demonstrate why a large existing trade flow does not always signal a significant opportunity for a new exporter. There are high import volumes of tomatoes into the US, but the dominant position of Mexican imports, and resulting strong existing market structures, would make it very difficult for African countries to break into the market
13
The analysis does however help to overturn several commonly-held beliefs about limited FtF Africa – US trade
• Nevertheless, we are able to draw a few conclusions that may overturn some commonly-held beliefs about the limited trade between FtF Africa countries and the US:
‒ “They cannot meet the high standards of the US” – although not identical, the EU also has high standards and FtF countries are able to export at least certain products to them
‒ “When trading commodities, relationships no longer matter so much in today’s information age” – existing trade pairings involve deep networks of relationships, which new entrants can find it hard to penetrate, replicate or replace
‒ “The US is too far away” – there is significant trade between the US and South-East Asia, despite the long distances involved: absolute distance itself is not necessarily a cost driver, and transport costs make up only a small amount of total costs for many products
‒ “Trade imbalances make sending a ship or plane to Africa too expensive, as it will be empty in the other direction” – this does not seem to be the case for exports to the EU, despite the same trade imbalances existing between Africa and Europe
14
Further analyses are required to understand and prioritize the underlying drivers of low trade, looking at specific products
• While the constraints that hinder trade between African FtF countries and the US reaching its full potential are diverse, only a few can be termed as “trade constraints” – constraints that act upon the specific action of trading. Other constraints, such as the underlying competitiveness of certain products, can dominate – meaning a focus on trade constraints in those areas would not themselves lead to increased trade
• To help structure the approach for the analysis of trade constraints, we have developed a framework to identify constraints holding back African FtF countries and the US trade, particularly to specify those which are a) trade constraints to consider in this analysis, b) non-trade constraints that nevertheless strongly impact on trade, and that we recommend are analyzed separately, and c) constraints likely to be difficult or impossible to surmount
15 15
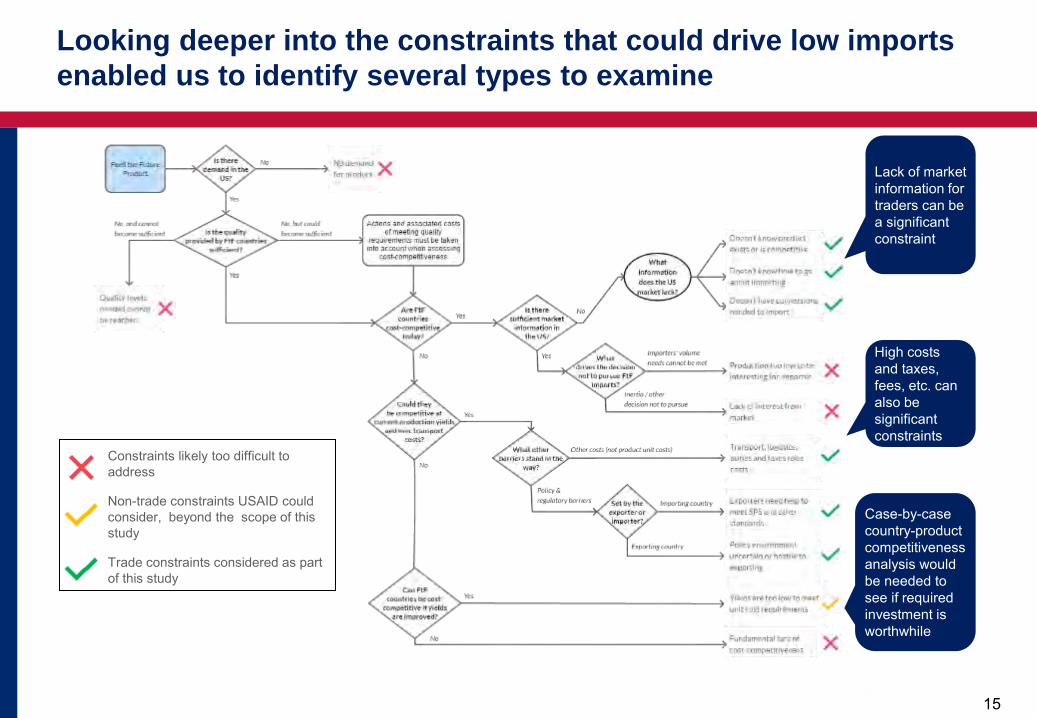
Lack of market information for traders can be a significant constraint
High costs and taxes, fees, etc. can also be significant constraints
Constraints likely too difficult to address
Non-trade constraints USAID could consider, beyond the scope of this study
Trade constraints considered as part of this study
Case-by-case country-product competitiveness analysis would be needed to see if required investment is worthwhile
Looking deeper into the constraints that could drive low imports enabled us to identify several types to examine
16
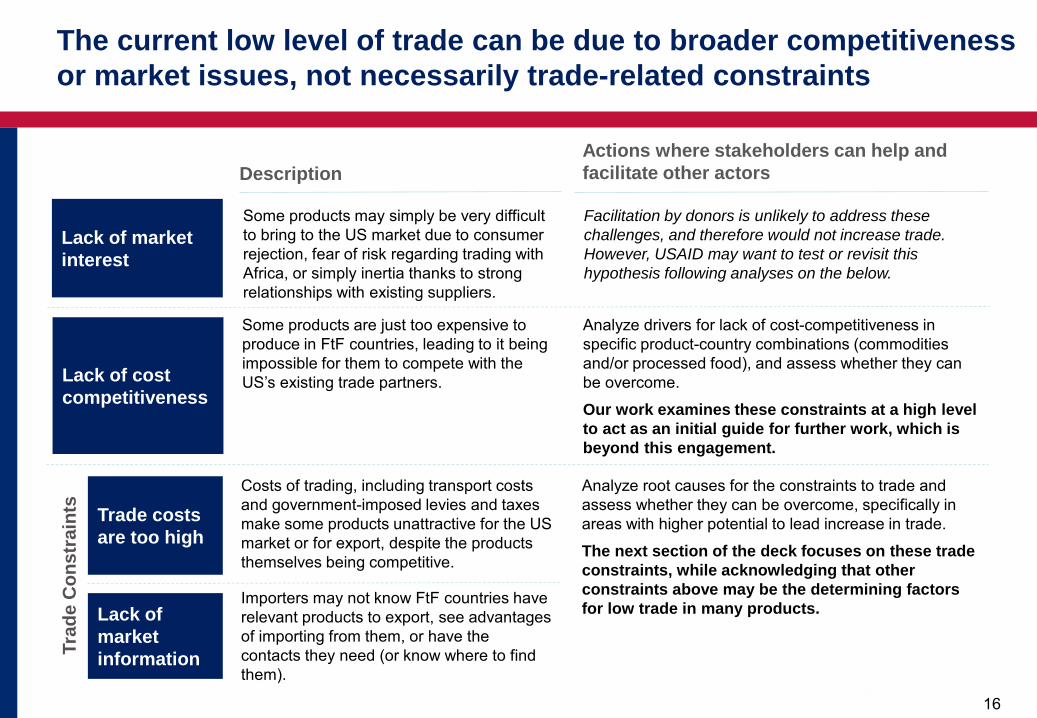
Lack of market interest
Description Actions where stakeholders can help and facilitate other actors
Some products may simply be very difficult to bring to the US market due to consumer rejection, fear of risk regarding trading with Africa, or simply inertia thanks to strong relationships with existing suppliers.
Facilitation by donors is unlikely to address these challenges, and therefore would not increase trade. However, USAID may want to test or revisit this hypothesis following analyses on the below.
Lack of cost competitiveness
Some products are just too expensive to produce in FtF countries, leading to it being impossible for them to compete with the US’s existing trade partners.
Analyze drivers for lack of cost-competitiveness in specific product-country combinations (commodities and/or processed food), and assess whether they can be overcome.
Our work examines these constraints at a high level to act as an initial guide for further work, which is beyond this engagement.
Trade costs are too high
Costs of trading, including transport costs and government-imposed levies and taxes make some products unattractive for the US market or for export, despite the products themselves being competitive.
Lack of market information
Importers may not know FtF countries have relevant products to export, see advantages of importing from them, or have the contacts they need (or know where to find them).
Analyze root causes for the constraints to trade and assess whether they can be overcome, specifically in areas with higher potential to lead increase in trade.
The next section of the deck focuses on these trade constraints, while acknowledging that other constraints above may be the determining factors for low trade in many products.
Trad
e C
onst
rain
ts
The current low level of trade can be due to broader competitiveness or market issues, not necessarily trade-related constraints
17
1. Trade trends of food products with the FtF countries
2. Deeper dive into the potential for future trade – the role of constraints to trade vs. the constraints affecting competitiveness and market interest
3. Constraints to trade a) Constraints common across countries and products b) Constraints specific to a product (country agnostic)
– Fish – Horticulture (fruits, vegetables and flowers) – Coffee
c) Constraints specific to a country (product agnostic) – Kenya – Uganda – Senegal
4. Annex
Table of contents
18
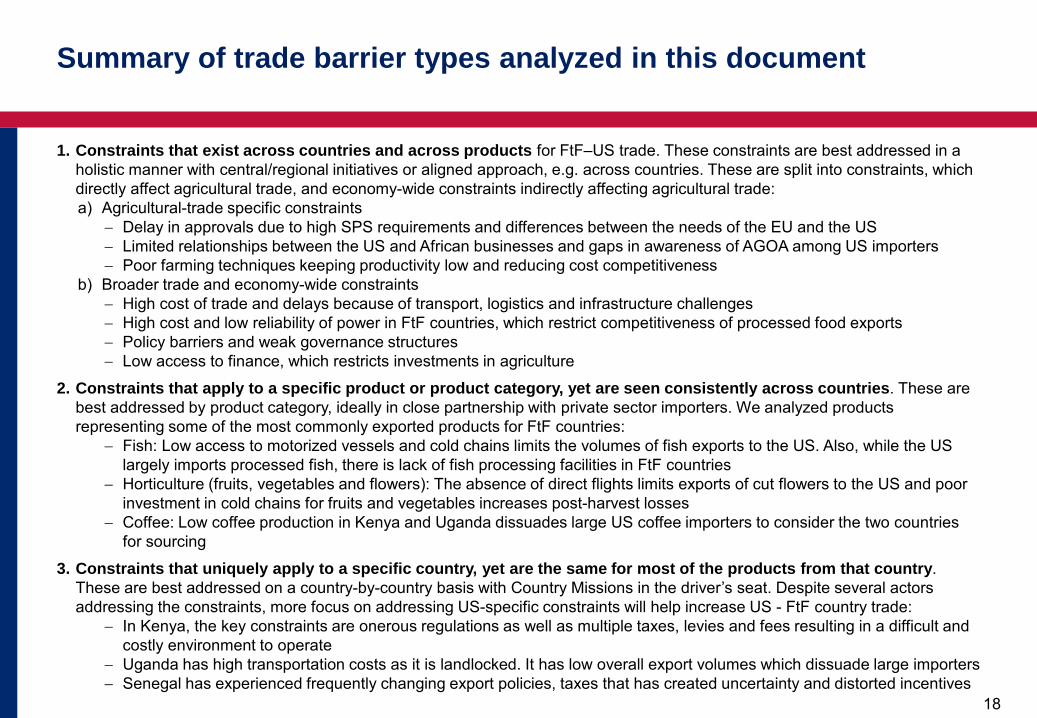
Summary of trade barrier types analyzed in this document
1. Constraints that exist across countries and across products for FtF–US trade. These constraints are best addressed in a holistic manner with central/regional initiatives or aligned approach, e.g. across countries. These are split into constraints, which directly affect agricultural trade, and economy-wide constraints indirectly affecting agricultural trade: a) Agricultural-trade specific constraints
− Delay in approvals due to high SPS requirements and differences between the needs of the EU and the US − Limited relationships between the US and African businesses and gaps in awareness of AGOA among US importers − Poor farming techniques keeping productivity low and reducing cost competitiveness
b) Broader trade and economy-wide constraints − High cost of trade and delays because of transport, logistics and infrastructure challenges − High cost and low reliability of power in FtF countries, which restrict competitiveness of processed food exports − Policy barriers and weak governance structures − Low access to finance, which restricts investments in agriculture
2. Constraints that apply to a specific product or product category, yet are seen consistently across countries. These are best addressed by product category, ideally in close partnership with private sector importers. We analyzed products representing some of the most commonly exported products for FtF countries:
− Fish: Low access to motorized vessels and cold chains limits the volumes of fish exports to the US. Also, while the US largely imports processed fish, there is lack of fish processing facilities in FtF countries
− Horticulture (fruits, vegetables and flowers): The absence of direct flights limits exports of cut flowers to the US and poor investment in cold chains for fruits and vegetables increases post-harvest losses
− Coffee: Low coffee production in Kenya and Uganda dissuades large US coffee importers to consider the two countries for sourcing
3. Constraints that uniquely apply to a specific country, yet are the same for most of the products from that country. These are best addressed on a country-by-country basis with Country Missions in the driver’s seat. Despite several actors addressing the constraints, more focus on addressing US-specific constraints will help increase US - FtF country trade:
− In Kenya, the key constraints are onerous regulations as well as multiple taxes, levies and fees resulting in a difficult and costly environment to operate
− Uganda has high transportation costs as it is landlocked. It has low overall export volumes which dissuade large importers − Senegal has experienced frequently changing export policies, taxes that has created uncertainty and distorted incentives
19
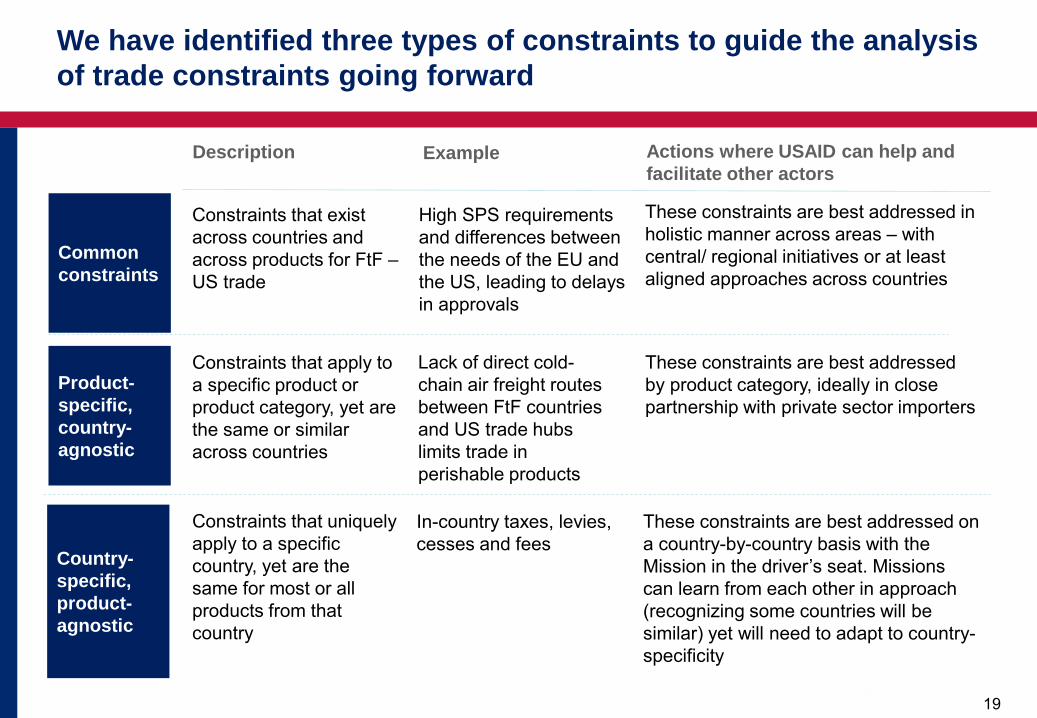
Common constraints
Constraints that exist across countries and across products for FtF – US trade
Description
High SPS requirements and differences between the needs of the EU and the US, leading to delays in approvals
Example
These constraints are best addressed in holistic manner across areas – with central/ regional initiatives or at least aligned approaches across countries
Actions where USAID can help and facilitate other actors
Product-specific, country-agnostic
Constraints that apply to a specific product or product category, yet are the same or similar across countries
Lack of direct cold-chain air freight routes between FtF countries and US trade hubs limits trade in perishable products
These constraints are best addressed by product category, ideally in close partnership with private sector importers
Country-specific, product-agnostic
Constraints that uniquely apply to a specific country, yet are the same for most or all products from that country
These constraints are best addressed on a country-by-country basis with the Mission in the driver’s seat. Missions can learn from each other in approach (recognizing some countries will be similar) yet will need to adapt to country-specificity
In-country taxes, levies, cesses and fees
We have identified three types of constraints to guide the analysis of trade constraints going forward
20 Source: World Development Indicators, World Bank; Dalberg analysis 20
FtF countries Landlocked West Africa East Africa Anglophone Francophone GDP/capita ranking
Ethiopia 6
Ghana 2
Kenya 3
Mali 5
Niger 8
Nigeria 1
Senegal 4
Uganda 7
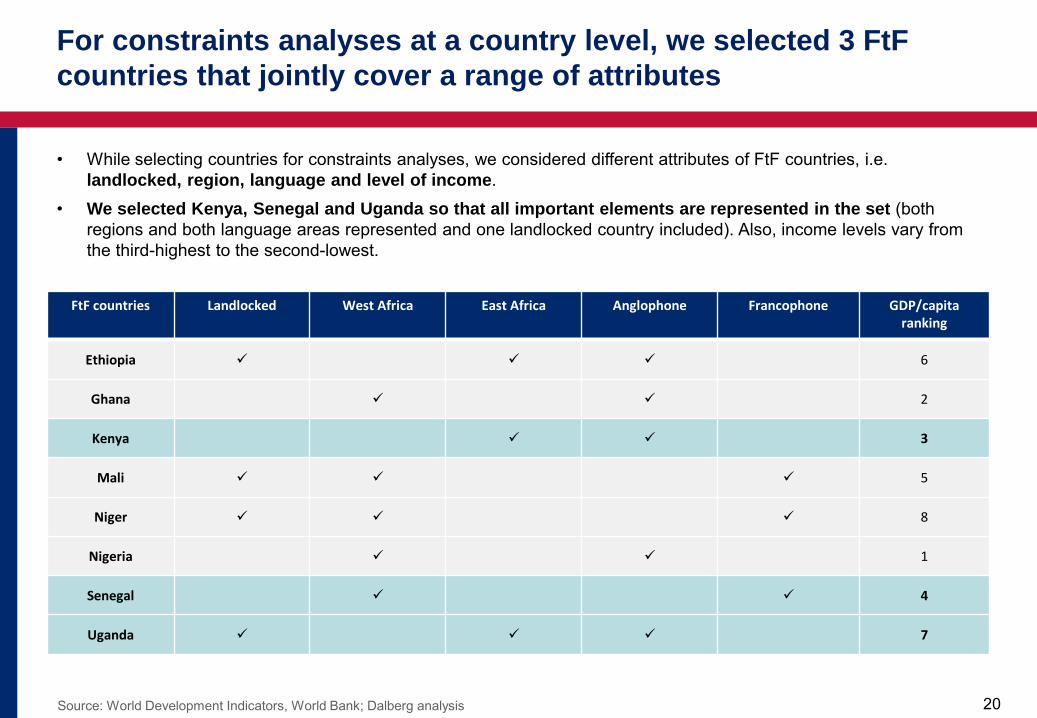
• While selecting countries for constraints analyses, we considered different attributes of FtF countries, i.e. landlocked, region, language and level of income.
• We selected Kenya, Senegal and Uganda so that all important elements are represented in the set (both regions and both language areas represented and one landlocked country included). Also, income levels vary from the third-highest to the second-lowest.
For constraints analyses at a country level, we selected 3 FtF countries that jointly cover a range of attributes
21 * This is based on the Top 5 exports at a HS Code 4 Level 21
Ethiopia Ghana Kenya Mali Niger Nigeria Senegal Uganda
Top
5 ex
port
s in
each
FtF
cou
ntry
in A
fric
a Coffee Cocoa beans Tea Other oil seeds Other oil seeds Cocoa beans and related products Fish, frozen Coffee
Other oil seeds Cocoa paste Cut flowers (horticulture)
Lac; natural gums, resins
Onions and related vegetables
(horticulture) Other oil seeds
Crustaceans, molluscs
(processed)
Fish fillets and other fish meat
Cut flowers (horticulture)
Cocoa butter, fat and oil Coffee
Dates, figs, pineapples, avocados
(horticulture)
Arrowroots and sweet potatoes (horticulture)
Crustaceans (fresh) Groundnuts Cocoa beans
Dried leguminous vegetables
(horticulture)
Prepared or preserved fish;
caviar
Leguminous vegetables
(horticulture)
Fruit, nuts and other edible parts
Ginger, saffron, turmeric
(horticulture)
Cocoa butter, fat and oil
Fish, fresh or chilled
Dried leguminous vegetables
(horticulture)
Other live plants Cocoa powder
Dates, figs, pineapples, avocados
(horticulture)
Coconuts, Brazil nuts and cashew
nuts
Dates, figs, pineapples, avocados
(horticulture)
Soya beans (horticulture)
Crustaceans (fresh)
Cut flowers (horticulture)
Key Coffee, fish, horticulture Selected countries
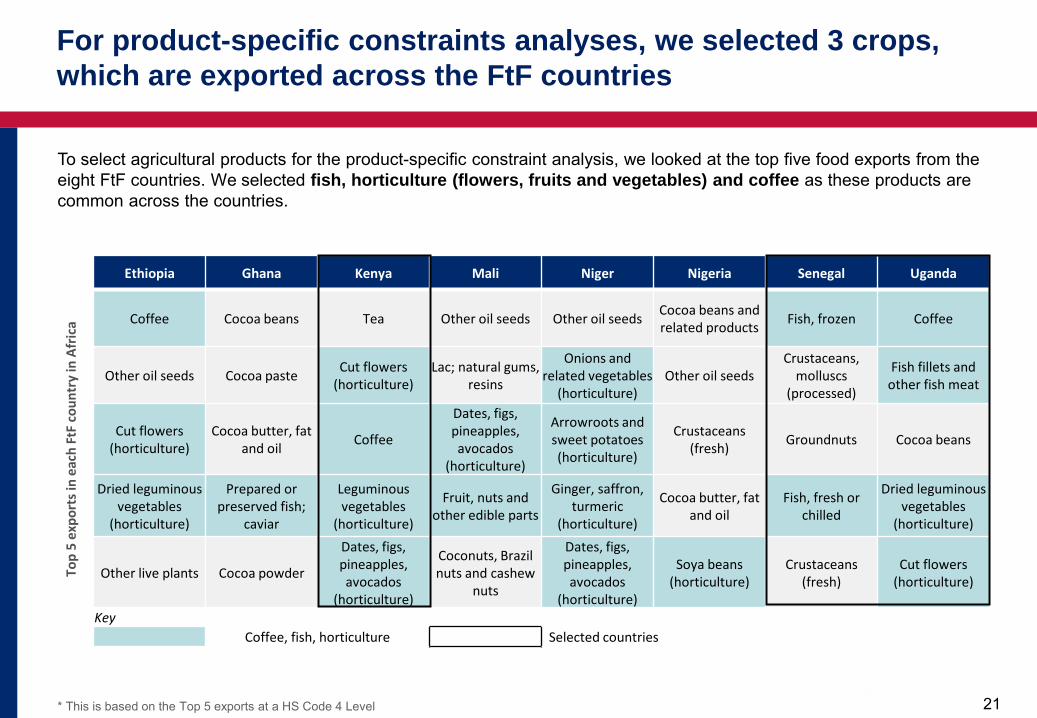
To select agricultural products for the product-specific constraint analysis, we looked at the top five food exports from the eight FtF countries. We selected fish, horticulture (flowers, fruits and vegetables) and coffee as these products are common across the countries.
For product-specific constraints analyses, we selected 3 crops, which are exported across the FtF countries
22
1. Trade trends of food products with the FtF countries
2. Deeper dive into the potential for future trade – the role of constraints to trade vs. the constraints affecting competitiveness and market interest
3. Constraints to trade a) Constraints common across countries and products b) Constraints specific to a product (country agnostic)
– Fish – Horticulture (fruits, vegetables and flowers) – Coffee
c) Constraints specific to a country (product agnostic) – Kenya – Uganda – Senegal
4. Annex
Table of contents
23 23
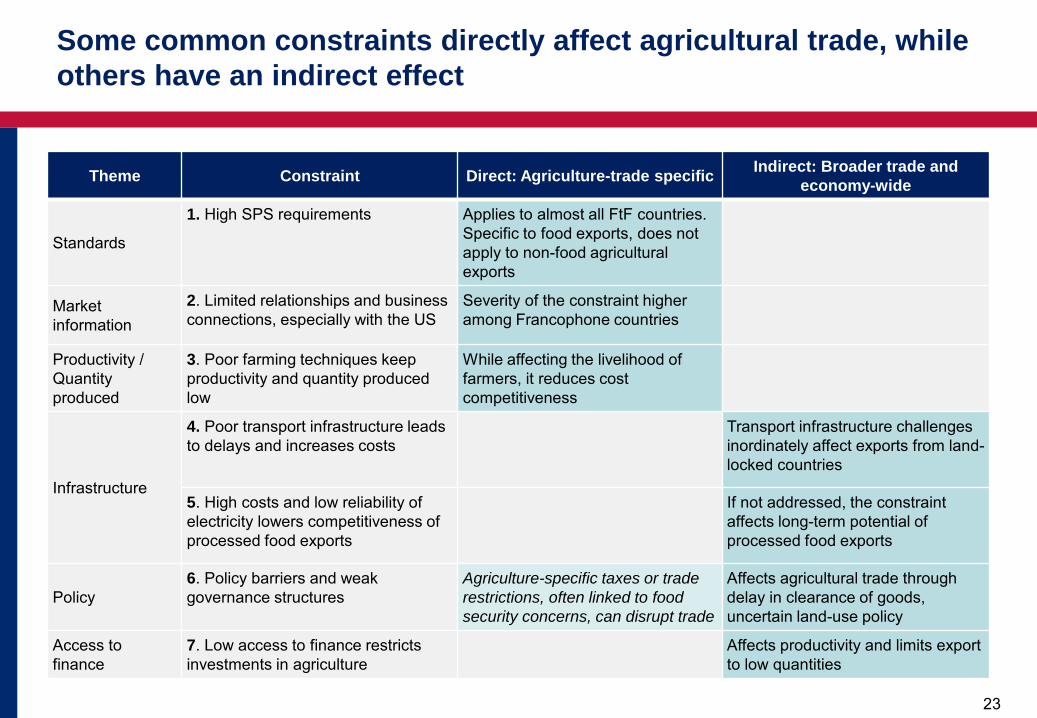
Theme Constraint Direct: Agriculture-trade specific Indirect: Broader trade and economy-wide
Standards
1. High SPS requirements Applies to almost all FtF countries. Specific to food exports, does not apply to non-food agricultural exports
Market information
2. Limited relationships and business connections, especially with the US
Severity of the constraint higher among Francophone countries
Productivity / Quantity produced
3. Poor farming techniques keep productivity and quantity produced low
While affecting the livelihood of farmers, it reduces cost competitiveness
Infrastructure
4. Poor transport infrastructure leads to delays and increases costs
Transport infrastructure challenges inordinately affect exports from land-locked countries
5. High costs and low reliability of electricity lowers competitiveness of processed food exports
If not addressed, the constraint affects long-term potential of processed food exports
Policy 6. Policy barriers and weak governance structures
Agriculture-specific taxes or trade restrictions, often linked to food security concerns, can disrupt trade
Affects agricultural trade through delay in clearance of goods, uncertain land-use policy
Access to finance
7. Low access to finance restricts investments in agriculture
Affects productivity and limits export to low quantities
Some common constraints directly affect agricultural trade, while others have an indirect effect
24 Source: 2011, AGOA,info, Tough US quality checks lock out Kenya flowers; Nairobi Coffee Exchange; Pasco. R Exporting Horticultural Products from AGOA Countries: Challenges & Considerations; Stakeholder interviews; Business Daily;
High SPS requirements
Description Examples
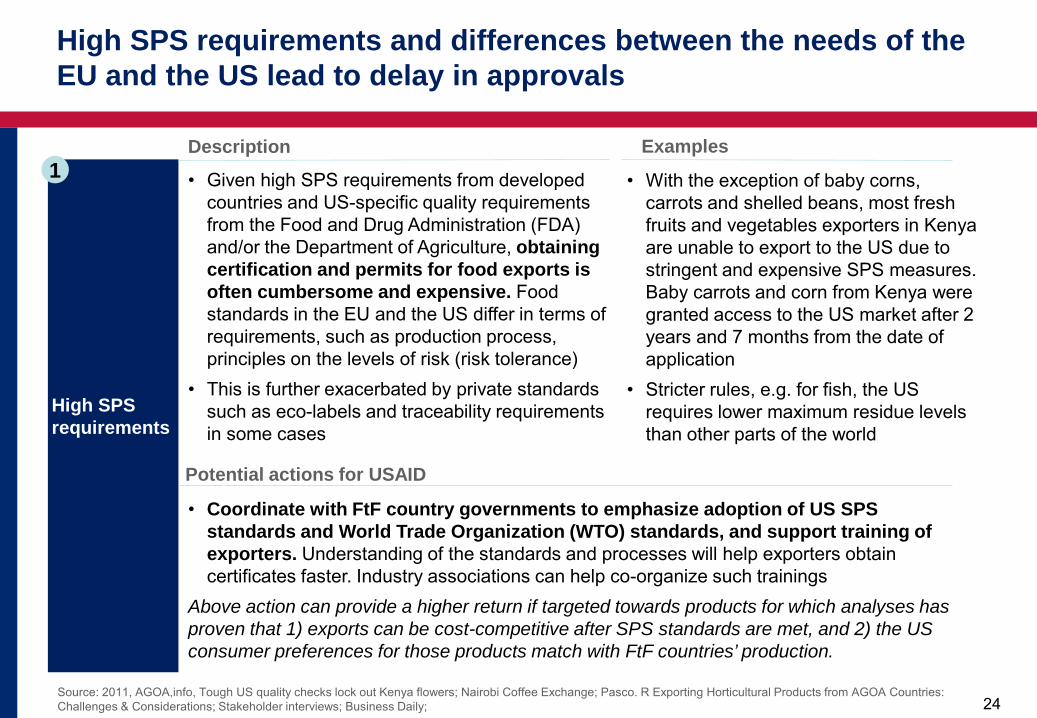
• Given high SPS requirements from developed countries and US-specific quality requirements from the Food and Drug Administration (FDA) and/or the Department of Agriculture, obtaining certification and permits for food exports is often cumbersome and expensive. Food standards in the EU and the US differ in terms of requirements, such as production process, principles on the levels of risk (risk tolerance)
• This is further exacerbated by private standards such as eco-labels and traceability requirements in some cases
• With the exception of baby corns, carrots and shelled beans, most fresh fruits and vegetables exporters in Kenya are unable to export to the US due to stringent and expensive SPS measures. Baby carrots and corn from Kenya were granted access to the US market after 2 years and 7 months from the date of application
• Stricter rules, e.g. for fish, the US requires lower maximum residue levels than other parts of the world
Potential actions for USAID
• Coordinate with FtF country governments to emphasize adoption of US SPS standards and World Trade Organization (WTO) standards, and support training of exporters. Understanding of the standards and processes will help exporters obtain certificates faster. Industry associations can help co-organize such trainings
Above action can provide a higher return if targeted towards products for which analyses has proven that 1) exports can be cost-competitive after SPS standards are met, and 2) the US consumer preferences for those products match with FtF countries’ production.
1
High SPS requirements and differences between the needs of the EU and the US lead to delay in approvals
25 Source: 2015, Senegal National AGOA strategy; Dalberg stakeholder interviews; Dalberg analysis
25
Limited relationships and business connections, especially with the US
Description Examples
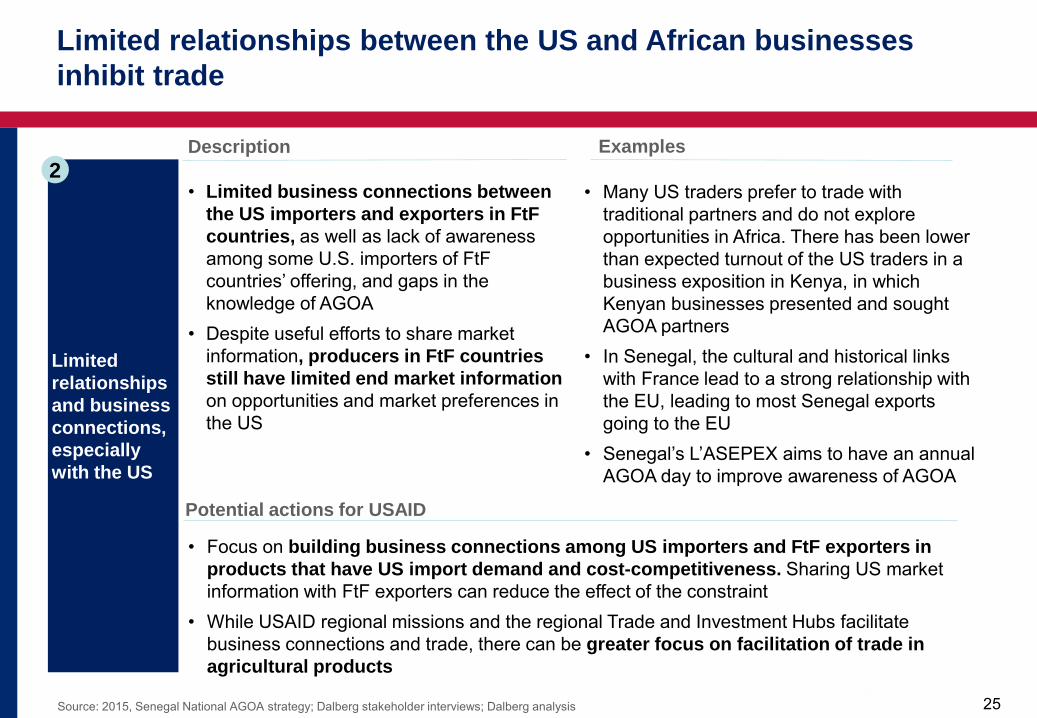
• Limited business connections between the US importers and exporters in FtF countries, as well as lack of awareness among some U.S. importers of FtF countries’ offering, and gaps in the knowledge of AGOA
• Despite useful efforts to share market information, producers in FtF countries still have limited end market information on opportunities and market preferences in the US
• Many US traders prefer to trade with traditional partners and do not explore opportunities in Africa. There has been lower than expected turnout of the US traders in a business exposition in Kenya, in which Kenyan businesses presented and sought AGOA partners
• In Senegal, the cultural and historical links with France lead to a strong relationship with the EU, leading to most Senegal exports going to the EU
• Senegal’s L’ASEPEX aims to have an annual AGOA day to improve awareness of AGOA
Potential actions for USAID
• Focus on building business connections among US importers and FtF exporters in products that have US import demand and cost-competitiveness. Sharing US market information with FtF exporters can reduce the effect of the constraint
• While USAID regional missions and the regional Trade and Investment Hubs facilitate business connections and trade, there can be greater focus on facilitation of trade in agricultural products
2
Limited relationships between the US and African businesses inhibit trade
26
Source: 2018, Business Daily, Why 7.5m Kenyan farmers are yet to adopt new seed varieties; 2017, Export.gov, Kenya market challenges; FAO, 2006, Agricultural policy in Kenya: issues and processes; Joughin J., The Political Economy of Seed Reform: Promoting a Regional Seed Trade Market; 2018, FAOSTAT database; 2018 New Agriculturist, Country profile – Senegal; Dalberg stakeholder interviews; Dalberg analysis
26
Poor farming techniques keep productivity and quantity produced low
Description Examples
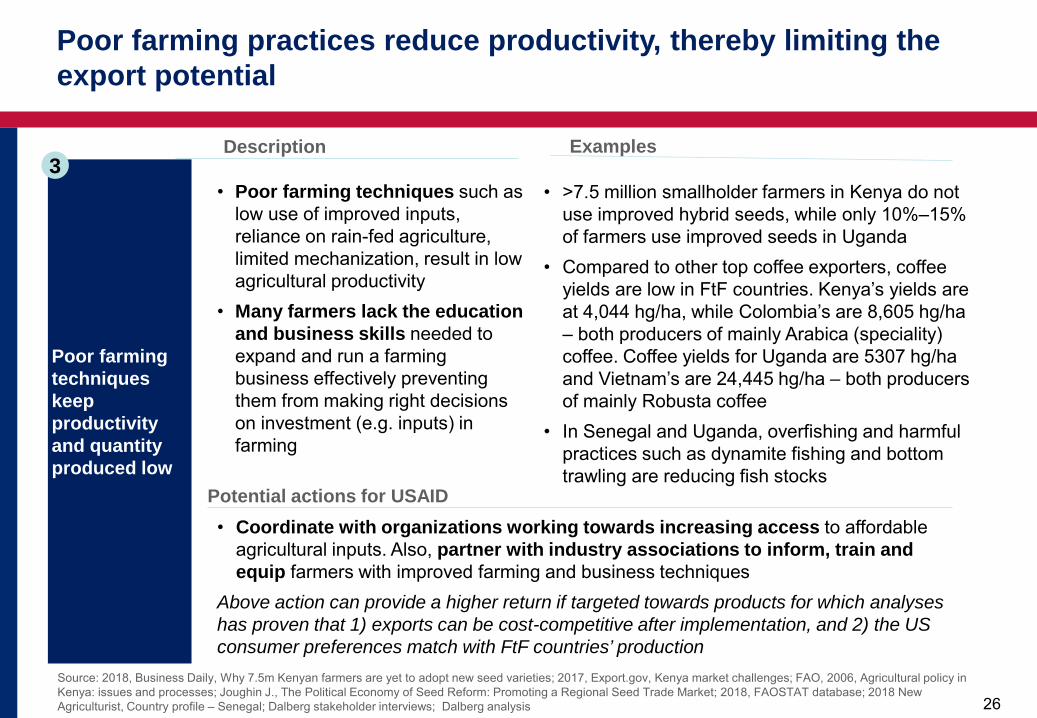
• Poor farming techniques such as low use of improved inputs, reliance on rain-fed agriculture, limited mechanization, result in low agricultural productivity
• Many farmers lack the education and business skills needed to expand and run a farming business effectively preventing them from making right decisions on investment (e.g. inputs) in farming
• >7.5 million smallholder farmers in Kenya do not use improved hybrid seeds, while only 10%–15% of farmers use improved seeds in Uganda
• Compared to other top coffee exporters, coffee yields are low in FtF countries. Kenya’s yields are at 4,044 hg/ha, while Colombia’s are 8,605 hg/ha – both producers of mainly Arabica (speciality) coffee. Coffee yields for Uganda are 5307 hg/ha and Vietnam’s are 24,445 hg/ha – both producers of mainly Robusta coffee
• In Senegal and Uganda, overfishing and harmful practices such as dynamite fishing and bottom trawling are reducing fish stocks
Potential actions for USAID • Coordinate with organizations working towards increasing access to affordable
agricultural inputs. Also, partner with industry associations to inform, train and equip farmers with improved farming and business techniques
Above action can provide a higher return if targeted towards products for which analyses has proven that 1) exports can be cost-competitive after implementation, and 2) the US consumer preferences match with FtF countries’ production
3
Poor farming practices reduce productivity, thereby limiting the export potential
27 Source: 2017, MoITC, National Trade Policy; 2012, Africa Growth Initiative at Brookings, Accelerating growth through improved intra-Africa trade; 2011, Commission of Revenue Allocation, Paved roads as % of total roads in Kenya; 2014,; Dalberg analysis
Poor transport infrastructure leads to delays and increases costs
Description Examples
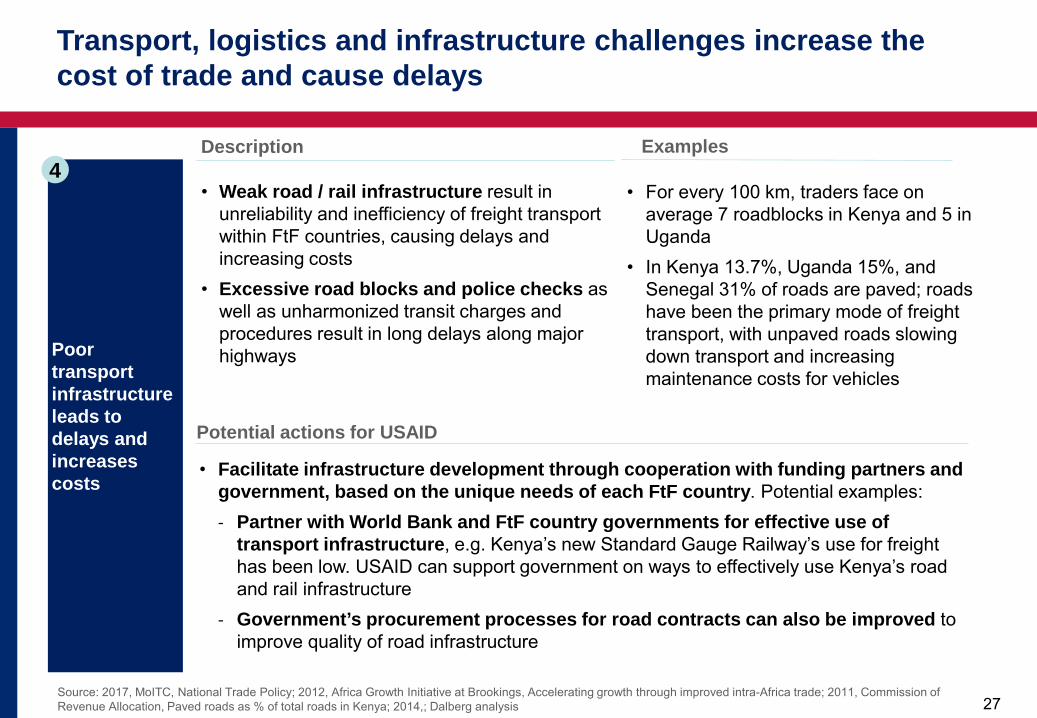
• Weak road / rail infrastructure result in unreliability and inefficiency of freight transport within FtF countries, causing delays and increasing costs
• Excessive road blocks and police checks as well as unharmonized transit charges and procedures result in long delays along major highways
• For every 100 km, traders face on average 7 roadblocks in Kenya and 5 in Uganda
• In Kenya 13.7%, Uganda 15%, and Senegal 31% of roads are paved; roads have been the primary mode of freight transport, with unpaved roads slowing down transport and increasing maintenance costs for vehicles
Potential actions for USAID
• Facilitate infrastructure development through cooperation with funding partners and government, based on the unique needs of each FtF country. Potential examples: - Partner with World Bank and FtF country governments for effective use of
transport infrastructure, e.g. Kenya’s new Standard Gauge Railway’s use for freight has been low. USAID can support government on ways to effectively use Kenya’s road and rail infrastructure
- Government’s procurement processes for road contracts can also be improved to improve quality of road infrastructure
4
Transport, logistics and infrastructure challenges increase the cost of trade and cause delays
28 Source: 2017. Senegal energy report; 2018; Trigona C., Senegal Road Assessment; Dalberg stakeholder interviews; Dalberg analysis;
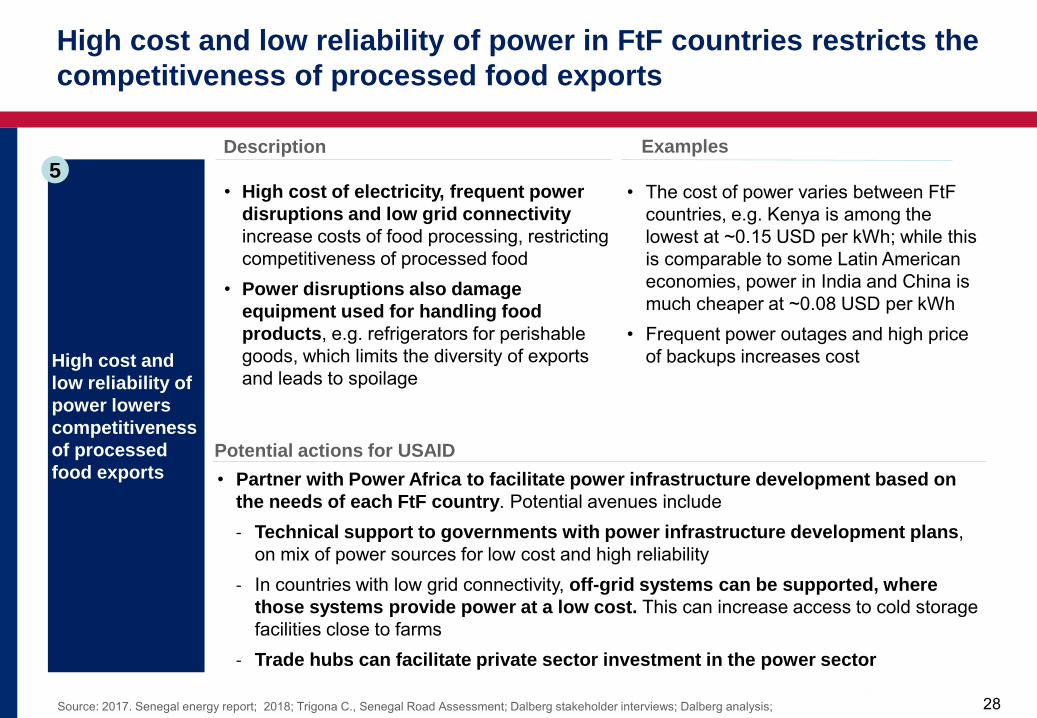
High cost and low reliability of power lowers competitiveness of processed food exports
Description Examples
• High cost of electricity, frequent power disruptions and low grid connectivity increase costs of food processing, restricting competitiveness of processed food
• Power disruptions also damage equipment used for handling food products, e.g. refrigerators for perishable goods, which limits the diversity of exports and leads to spoilage
• The cost of power varies between FtF countries, e.g. Kenya is among the lowest at ~0.15 USD per kWh; while this is comparable to some Latin American economies, power in India and China is much cheaper at ~0.08 USD per kWh
• Frequent power outages and high price of backups increases cost
Potential actions for USAID • Partner with Power Africa to facilitate power infrastructure development based on
the needs of each FtF country. Potential avenues include - Technical support to governments with power infrastructure development plans,
on mix of power sources for low cost and high reliability - In countries with low grid connectivity, off-grid systems can be supported, where
those systems provide power at a low cost. This can increase access to cold storage facilities close to farms
- Trade hubs can facilitate private sector investment in the power sector
5
High cost and low reliability of power in FtF countries restricts the competitiveness of processed food exports
29
*EBA indicators consist of seed, fertilizer, machinery, finance, markets, transport, water, ICT indicators. Market indicator measures laws and regulations that impact access to agricultural markets ; Source: 2017, MoITC, National Trade Policy; 2017, Andae G, Delays at Mombasa port costing cargo importers millions in fines; 2017, Export.gov, Kenya – trade barriers; 2017, The East Africa, Maize trade imports up despite ban; 2018, Export.gov, Uganda – Market challenges; 2018, Trademark EA, projects; Dalberg stakeholder interviews; Dalberg analysis
29
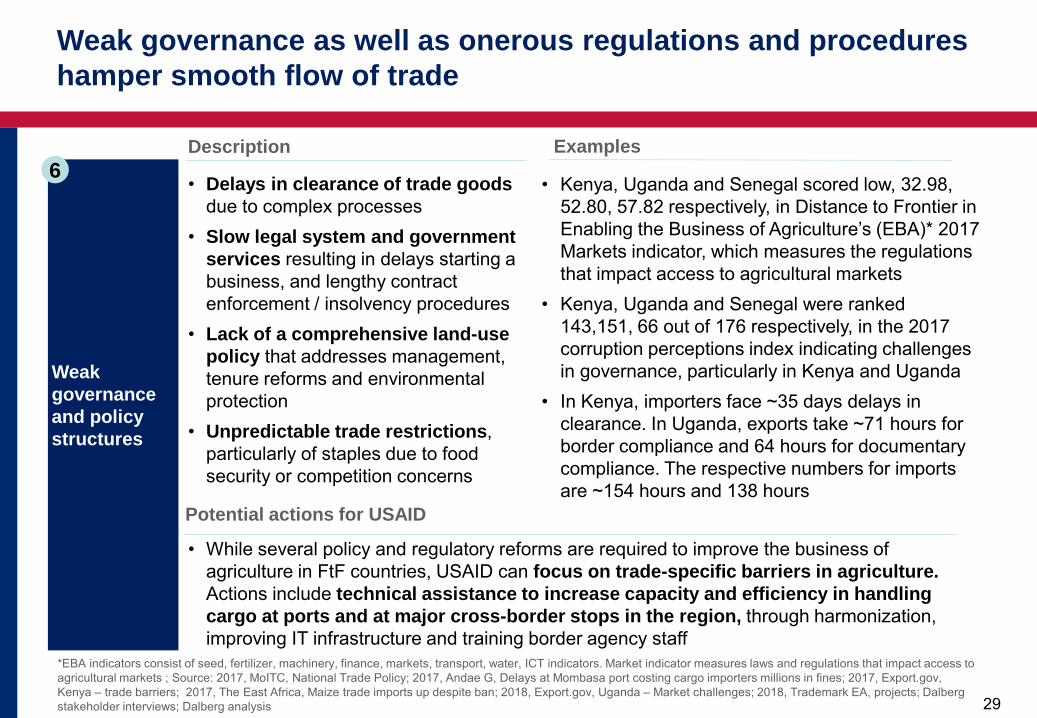
Weak governance and policy structures
Description Examples
• Delays in clearance of trade goods due to complex processes
• Slow legal system and government services resulting in delays starting a business, and lengthy contract enforcement / insolvency procedures
• Lack of a comprehensive land-use policy that addresses management, tenure reforms and environmental protection
• Unpredictable trade restrictions, particularly of staples due to food security or competition concerns
• Kenya, Uganda and Senegal scored low, 32.98, 52.80, 57.82 respectively, in Distance to Frontier in Enabling the Business of Agriculture’s (EBA)* 2017 Markets indicator, which measures the regulations that impact access to agricultural markets
• Kenya, Uganda and Senegal were ranked 143,151, 66 out of 176 respectively, in the 2017 corruption perceptions index indicating challenges in governance, particularly in Kenya and Uganda
• In Kenya, importers face ~35 days delays in clearance. In Uganda, exports take ~71 hours for border compliance and 64 hours for documentary compliance. The respective numbers for imports are ~154 hours and 138 hours
Potential actions for USAID
• While several policy and regulatory reforms are required to improve the business of agriculture in FtF countries, USAID can focus on trade-specific barriers in agriculture. Actions include technical assistance to increase capacity and efficiency in handling cargo at ports and at major cross-border stops in the region, through harmonization, improving IT infrastructure and training border agency staff
6
Weak governance as well as onerous regulations and procedures hamper smooth flow of trade
30 Source:, Export.gov, Kenya market challenges; FAO, 2006, Agricultural policy in Kenya: issues and processes; 2018, Export.gov, Uganda – Market challenges; Dalberg stakeholder interviews; Dalberg analysis
30
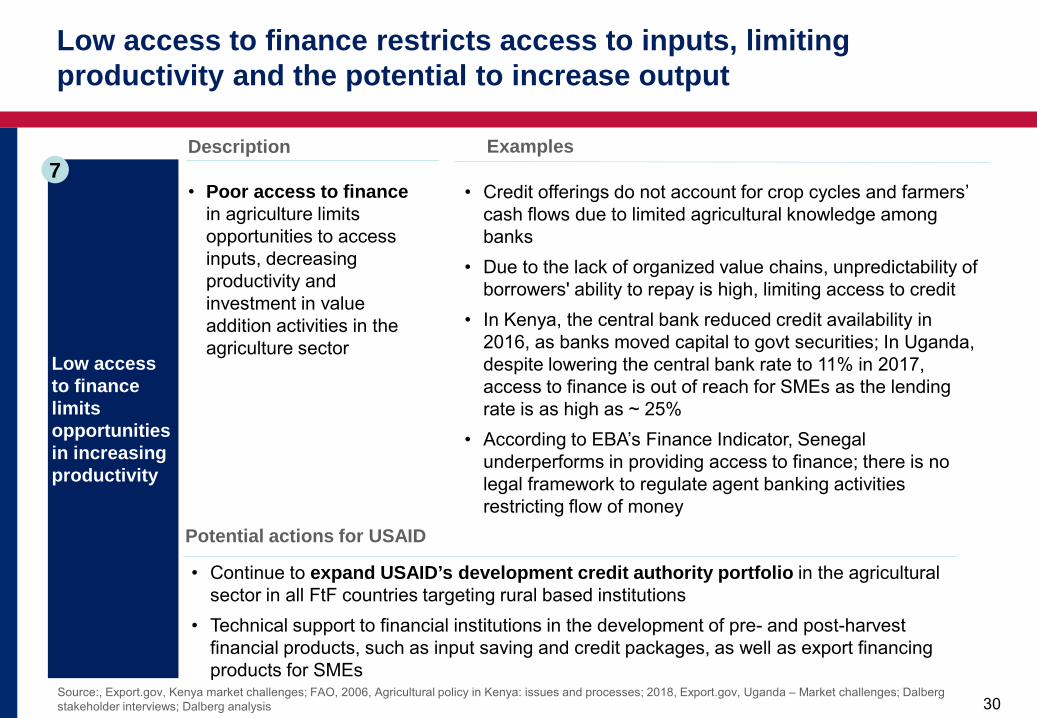
Low access to finance limits opportunities in increasing productivity
Description Examples
• Poor access to finance in agriculture limits opportunities to access inputs, decreasing productivity and investment in value addition activities in the agriculture sector
• Credit offerings do not account for crop cycles and farmers’ cash flows due to limited agricultural knowledge among banks
• Due to the lack of organized value chains, unpredictability of borrowers' ability to repay is high, limiting access to credit
• In Kenya, the central bank reduced credit availability in 2016, as banks moved capital to govt securities; In Uganda, despite lowering the central bank rate to 11% in 2017, access to finance is out of reach for SMEs as the lending rate is as high as ~ 25%
• According to EBA’s Finance Indicator, Senegal underperforms in providing access to finance; there is no legal framework to regulate agent banking activities restricting flow of money
Potential actions for USAID
• Continue to expand USAID’s development credit authority portfolio in the agricultural sector in all FtF countries targeting rural based institutions
• Technical support to financial institutions in the development of pre- and post-harvest financial products, such as input saving and credit packages, as well as export financing products for SMEs
7
Low access to finance restricts access to inputs, limiting productivity and the potential to increase output
31
1. Trade trends of food products with the FtF countries
2. Deeper dive into the potential for future trade – the role of constraints to trade vs. the constraints affecting competitiveness and market interest
3. Constraints to trade a) Constraints common across countries and products b) Constraints specific to a product (country agnostic)
– Fish – Horticulture (fruits, vegetables and flowers) – Coffee
c) Constraints specific to a country (product agnostic) – Kenya – Uganda – Senegal
4. Annex
Table of contents
32 Source: 2017, UNCTAD, Challenges and Opportunities for Small Scale fishers in Fish Trade; 1997 Sophonphong K, Santos C; Fish Inspection Equivalence Agreements; Dalberg analysis
32
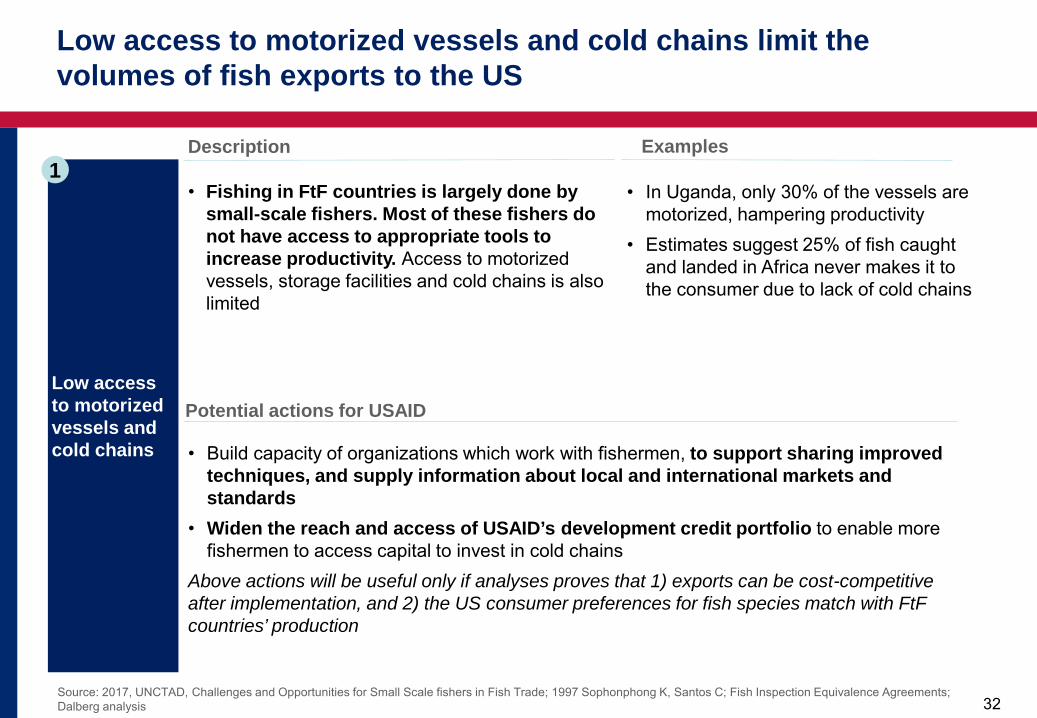
Low access to motorized vessels and cold chains
Description Examples
• Fishing in FtF countries is largely done by small-scale fishers. Most of these fishers do not have access to appropriate tools to increase productivity. Access to motorized vessels, storage facilities and cold chains is also limited
• In Uganda, only 30% of the vessels are motorized, hampering productivity
• Estimates suggest 25% of fish caught and landed in Africa never makes it to the consumer due to lack of cold chains
Potential actions for USAID
• Build capacity of organizations which work with fishermen, to support sharing improved techniques, and supply information about local and international markets and standards
• Widen the reach and access of USAID’s development credit portfolio to enable more fishermen to access capital to invest in cold chains
Above actions will be useful only if analyses proves that 1) exports can be cost-competitive after implementation, and 2) the US consumer preferences for fish species match with FtF countries’ production
1
Low access to motorized vessels and cold chains limit the volumes of fish exports to the US
33 Source: 2015, Inside the US: The Fish and Seat Trade, Agri-Food Canada; 2018, FDA Website Imported Seafood Safety Program; 2018, Britannica, Encyclopaedia, Fish processing; COMTRADE Dalberg analysis
33
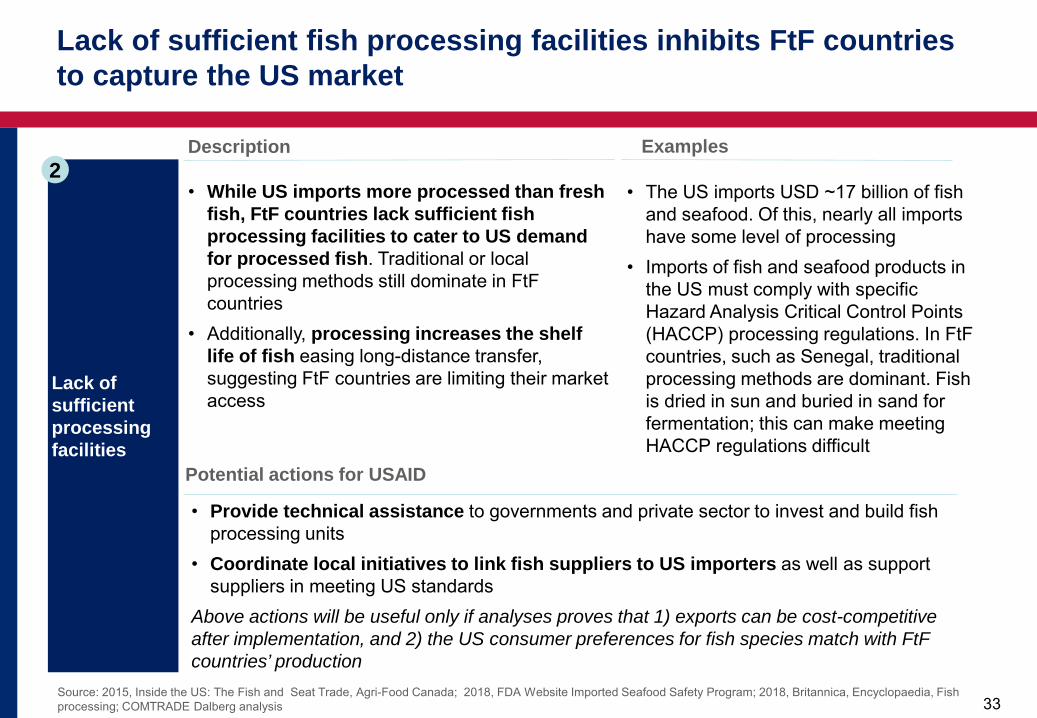
Lack of sufficient processing facilities
Description Examples
• While US imports more processed than fresh fish, FtF countries lack sufficient fish processing facilities to cater to US demand for processed fish. Traditional or local processing methods still dominate in FtF countries
• Additionally, processing increases the shelf life of fish easing long-distance transfer, suggesting FtF countries are limiting their market access
• The US imports USD ~17 billion of fish and seafood. Of this, nearly all imports have some level of processing
• Imports of fish and seafood products in the US must comply with specific Hazard Analysis Critical Control Points (HACCP) processing regulations. In FtF countries, such as Senegal, traditional processing methods are dominant. Fish is dried in sun and buried in sand for fermentation; this can make meeting HACCP regulations difficult
Potential actions for USAID
• Provide technical assistance to governments and private sector to invest and build fish processing units
• Coordinate local initiatives to link fish suppliers to US importers as well as support suppliers in meeting US standards
Above actions will be useful only if analyses proves that 1) exports can be cost-competitive after implementation, and 2) the US consumer preferences for fish species match with FtF countries’ production
2
Lack of sufficient fish processing facilities inhibits FtF countries to capture the US market
34
1. Trade trends of food products with the FtF countries
2. Deeper dive into the potential for future trade – the role of constraints to trade vs. the constraints affecting competitiveness and market interest
3. Constraints to trade a) Constraints common across countries and products b) Constraints specific to a product (country agnostic)
– Fish – Horticulture (fruits, vegetables and flowers) – Coffee
c) Constraints specific to a country (product agnostic) – Kenya – Uganda – Senegal
4. Annex
Table of contents
35 Source: 2011, The Agribusiness Innovation Center of Senegal; Scaling a competitive horticulture sector through value adding post-harvest processing; 2018, Reduce fruit losses in these simple ways; 2017, Bwambale T., Ugandan farmers lose 30% of harvest to poor practices; Dalberg stakeholder interviews; Dalberg analysis
35
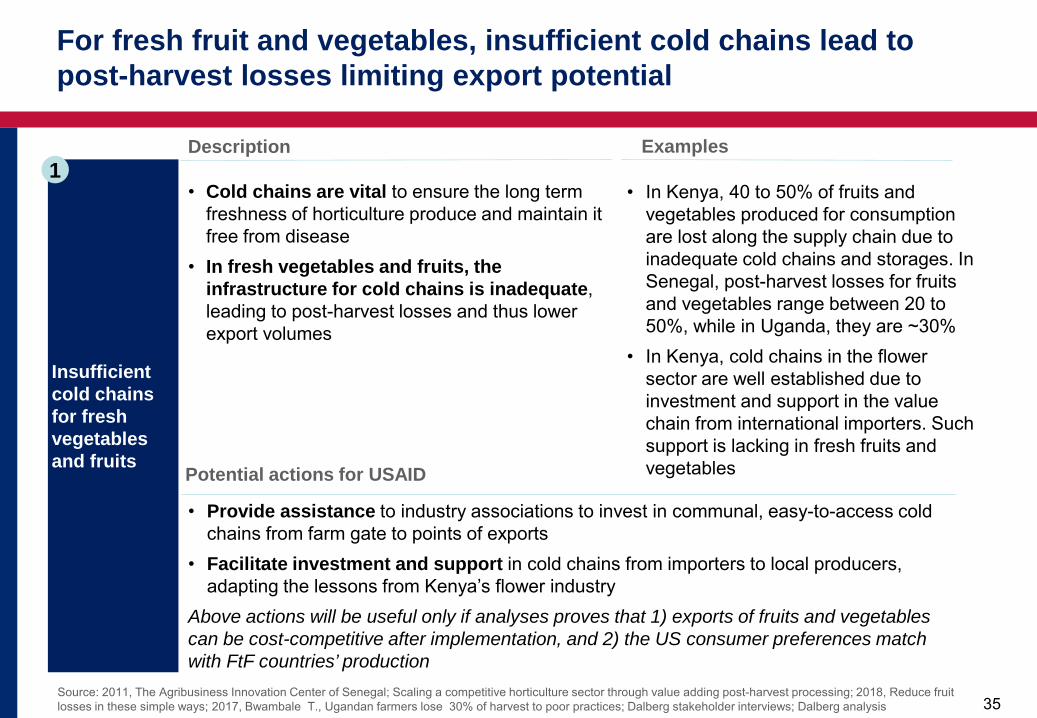
Insufficient cold chains for fresh vegetables and fruits
Description Examples
• Cold chains are vital to ensure the long term freshness of horticulture produce and maintain it free from disease
• In fresh vegetables and fruits, the infrastructure for cold chains is inadequate, leading to post-harvest losses and thus lower export volumes
• In Kenya, 40 to 50% of fruits and vegetables produced for consumption are lost along the supply chain due to inadequate cold chains and storages. In Senegal, post-harvest losses for fruits and vegetables range between 20 to 50%, while in Uganda, they are ~30%
• In Kenya, cold chains in the flower sector are well established due to investment and support in the value chain from international importers. Such support is lacking in fresh fruits and vegetables Potential actions for USAID
• Provide assistance to industry associations to invest in communal, easy-to-access cold chains from farm gate to points of exports
• Facilitate investment and support in cold chains from importers to local producers, adapting the lessons from Kenya’s flower industry
Above actions will be useful only if analyses proves that 1) exports of fruits and vegetables can be cost-competitive after implementation, and 2) the US consumer preferences match with FtF countries’ production
1
For fresh fruit and vegetables, insufficient cold chains lead to post-harvest losses limiting export potential
36
Source: 2011, The Agribusiness Innovation Center of Senegal; Scaling a competitive horticulture sector through value adding post-harvest processing; 2018, Business Daily, Airline cites empty cargo flights from US hurdle; 2018, Reduce fruit losses in these simple ways; 2018, Export.gov, Uganda – Agriculture; Dalberg stakeholder interviews; 2015, USAID, “Senegal's AGOA Strategy” Dalberg analysis
36
Lack of direct flights to the US
Description Examples
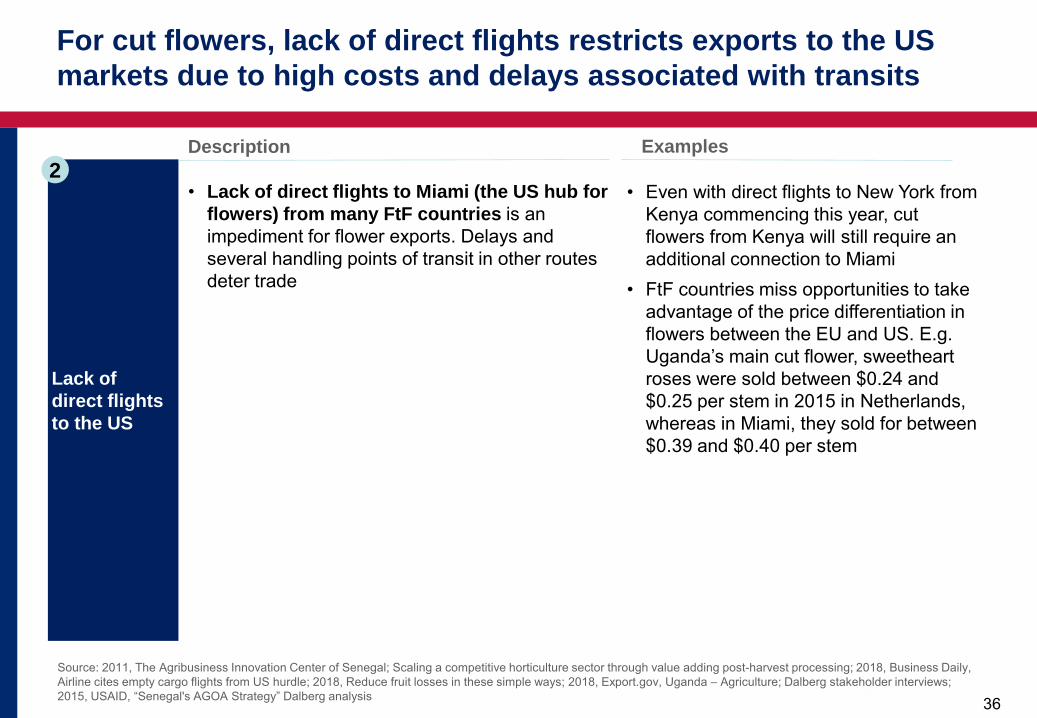
• Lack of direct flights to Miami (the US hub for flowers) from many FtF countries is an impediment for flower exports. Delays and several handling points of transit in other routes deter trade
• Even with direct flights to New York from Kenya commencing this year, cut flowers from Kenya will still require an additional connection to Miami
• FtF countries miss opportunities to take advantage of the price differentiation in flowers between the EU and US. E.g. Uganda’s main cut flower, sweetheart roses were sold between $0.24 and $0.25 per stem in 2015 in Netherlands, whereas in Miami, they sold for between $0.39 and $0.40 per stem
2
For cut flowers, lack of direct flights restricts exports to the US markets due to high costs and delays associated with transits
37
1. Trade trends of food products with the FtF countries
2. Deeper dive into the potential for future trade – the role of constraints to trade vs. the constraints affecting competitiveness and market interest
3. Constraints to trade a) Constraints common across countries and products b) Constraints specific to a product (country agnostic)
– Fish – Horticulture (fruits, vegetables and flowers) – Coffee
c) Constraints specific to a country (product agnostic) – Kenya – Uganda – Senegal
4. Annex
Table of contents
38 Source: 2018 – 2023, Kenya National AGOA Strategy and Action Plan; 2018 FAOSTAT database; 2011, Byanyima B. F., Determinants of Export Volumes of Uganda’s Coffee, 1991- 2007; Dalberg stakeholder analysis; Dalberg analysis
38
Decades of dwindling coffee production, despite recent increase
Description Examples
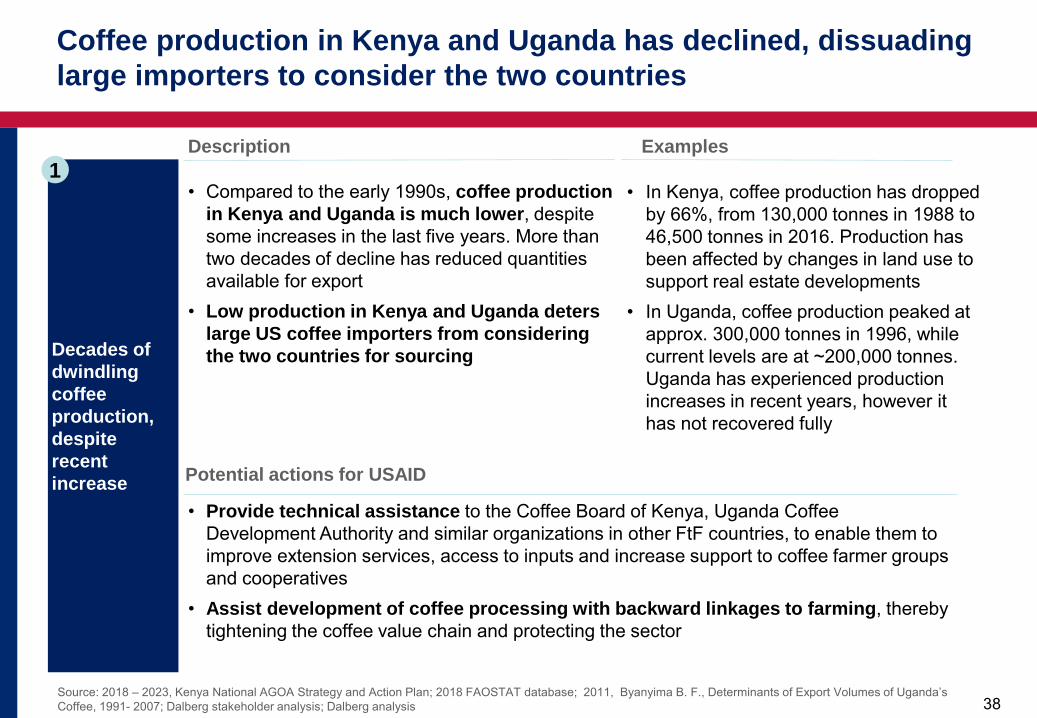
• Compared to the early 1990s, coffee production in Kenya and Uganda is much lower, despite some increases in the last five years. More than two decades of decline has reduced quantities available for export
• Low production in Kenya and Uganda deters large US coffee importers from considering the two countries for sourcing
• In Kenya, coffee production has dropped by 66%, from 130,000 tonnes in 1988 to 46,500 tonnes in 2016. Production has been affected by changes in land use to support real estate developments
• In Uganda, coffee production peaked at approx. 300,000 tonnes in 1996, while current levels are at ~200,000 tonnes. Uganda has experienced production increases in recent years, however it has not recovered fully
Potential actions for USAID
• Provide technical assistance to the Coffee Board of Kenya, Uganda Coffee Development Authority and similar organizations in other FtF countries, to enable them to improve extension services, access to inputs and increase support to coffee farmer groups and cooperatives
• Assist development of coffee processing with backward linkages to farming, thereby tightening the coffee value chain and protecting the sector
1
Coffee production in Kenya and Uganda has declined, dissuading large importers to consider the two countries
39
1. Trade trends of food products with the FtF countries
2. Deeper dive into the potential for future trade – the role of constraints to trade vs. the constraints affecting competitiveness and market interest
3. Constraints to trade a) Constraints common across countries and products b) Constraints specific to a product (country agnostic)
– Fish – Horticulture (fruits, vegetables and flowers) – Coffee
c) Constraints specific to a country (product agnostic) – Kenya – Uganda – Senegal
4. Annex
Table of contents
40 Source: 2018, FAO Website; The agriculture sector in Kenya; ; 2018, World Bank database, population, population growth, employment in agriculture (% of total employment); Kenya National Bureau of statistic;, Land area; COMTRADE data
40
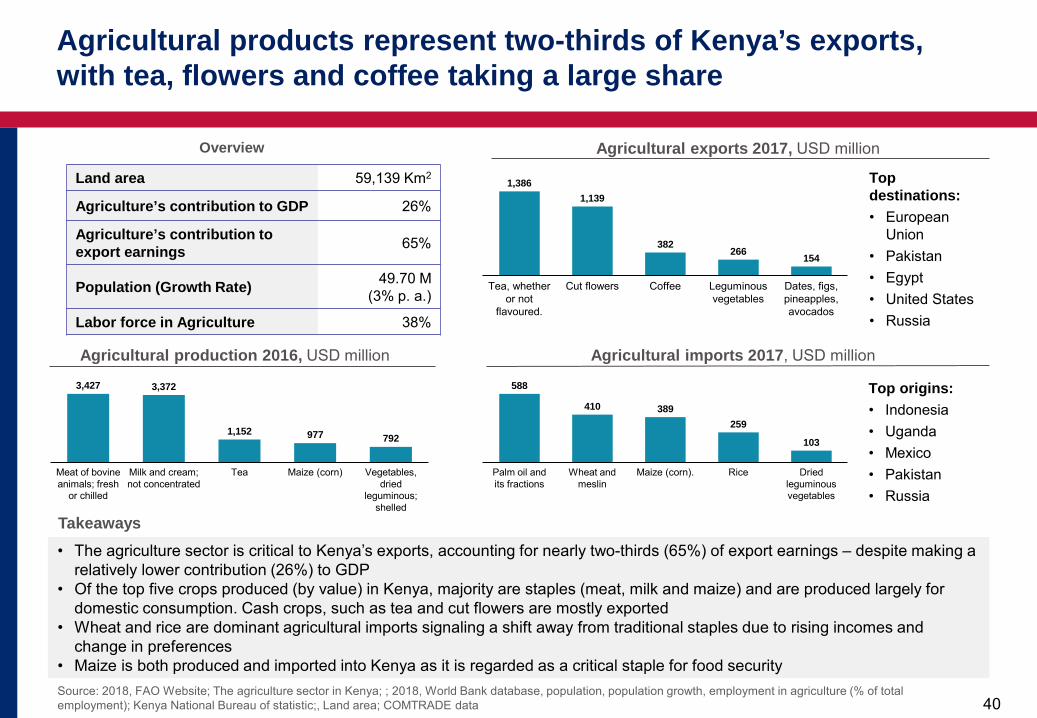
Overview
Land area 59,139 Km2
Agriculture’s contribution to GDP 26%
Agriculture’s contribution to export earnings 65%
Population (Growth Rate) 49.70 M (3% p. a.)
Labor force in Agriculture 38%
Agricultural exports 2017, USD million
• The agriculture sector is critical to Kenya’s exports, accounting for nearly two-thirds (65%) of export earnings – despite making a relatively lower contribution (26%) to GDP
• Of the top five crops produced (by value) in Kenya, majority are staples (meat, milk and maize) and are produced largely for domestic consumption. Cash crops, such as tea and cut flowers are mostly exported
• Wheat and rice are dominant agricultural imports signaling a shift away from traditional staples due to rising incomes and change in preferences
• Maize is both produced and imported into Kenya as it is regarded as a critical staple for food security
Takeaways
Agricultural imports 2017, USD million
3,427 3,372
1,152 977 792
Meat of bovine animals; fresh
or chilled
Vegetables, dried
leguminous; shelled
Milk and cream; not concentrated
Tea Maize (corn)
Agricultural production 2016, USD million
1,139
Cut flowers Tea, whether or not
flavoured.
Coffee
382
Leguminous vegetables
Dates, figs, pineapples, avocados
1,386
266 154
Top destinations: • European
Union • Pakistan • Egypt • United States • Russia
103
410
Palm oil and its fractions
Maize (corn). Wheat and meslin
389
Rice
588
Dried leguminous vegetables
259
Top origins: • Indonesia • Uganda • Mexico • Pakistan • Russia
Agricultural products represent two-thirds of Kenya’s exports, with tea, flowers and coffee taking a large share
41 Source: 2018, Export.gov, Kenya – trade barriers; 2018; Infonet, basic export requirements; 2018; Nation Media, Low prices and export ban rule drive macadamia farmers nuts; Dalberg stakeholder interviews; Dalberg analysis
41
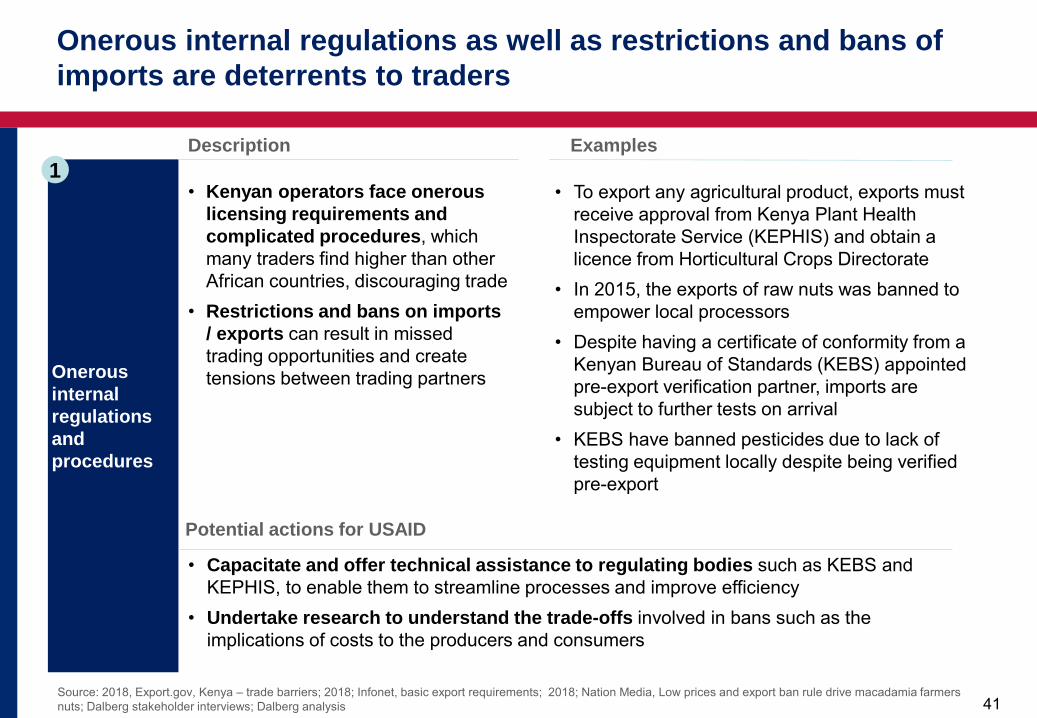
Onerous internal regulations and procedures
Description Examples
• Kenyan operators face onerous licensing requirements and complicated procedures, which many traders find higher than other African countries, discouraging trade
• Restrictions and bans on imports / exports can result in missed trading opportunities and create tensions between trading partners
• To export any agricultural product, exports must receive approval from Kenya Plant Health Inspectorate Service (KEPHIS) and obtain a licence from Horticultural Crops Directorate
• In 2015, the exports of raw nuts was banned to empower local processors
• Despite having a certificate of conformity from a Kenyan Bureau of Standards (KEBS) appointed pre-export verification partner, imports are subject to further tests on arrival
• KEBS have banned pesticides due to lack of testing equipment locally despite being verified pre-export
Potential actions for USAID
• Capacitate and offer technical assistance to regulating bodies such as KEBS and KEPHIS, to enable them to streamline processes and improve efficiency
• Undertake research to understand the trade-offs involved in bans such as the implications of costs to the producers and consumers
1
Onerous internal regulations as well as restrictions and bans of imports are deterrents to traders
42 Source: 2018, Waitathu N., Kenya tea farmers among top 3 earners, 2014, Standard Media, Tea sector reels under punitive tax regimes, players call for review; 2013, 2018, Standard Media, 16% VAT on pesticides will lead to high food prices; Dalberg stakeholder interviews; Dalberg analysis
42
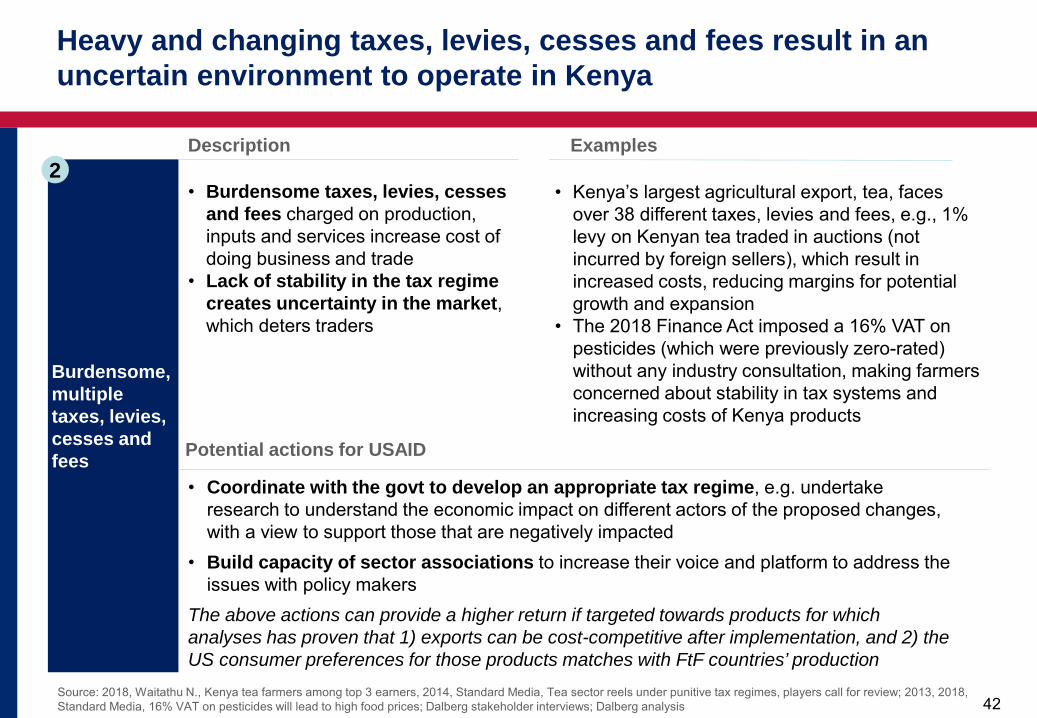
Burdensome, multiple taxes, levies, cesses and fees
Description Examples
• Burdensome taxes, levies, cesses and fees charged on production, inputs and services increase cost of doing business and trade
• Lack of stability in the tax regime creates uncertainty in the market, which deters traders
• Kenya’s largest agricultural export, tea, faces over 38 different taxes, levies and fees, e.g., 1% levy on Kenyan tea traded in auctions (not incurred by foreign sellers), which result in increased costs, reducing margins for potential growth and expansion
• The 2018 Finance Act imposed a 16% VAT on pesticides (which were previously zero-rated) without any industry consultation, making farmers concerned about stability in tax systems and increasing costs of Kenya products
Potential actions for USAID
• Coordinate with the govt to develop an appropriate tax regime, e.g. undertake research to understand the economic impact on different actors of the proposed changes, with a view to support those that are negatively impacted
• Build capacity of sector associations to increase their voice and platform to address the issues with policy makers
The above actions can provide a higher return if targeted towards products for which analyses has proven that 1) exports can be cost-competitive after implementation, and 2) the US consumer preferences for those products matches with FtF countries’ production
2
Heavy and changing taxes, levies, cesses and fees result in an uncertain environment to operate in Kenya
43 Source; Interviews with stakeholders, Dalberg analysis *Refer to the Annex for detailed partner mapping
43
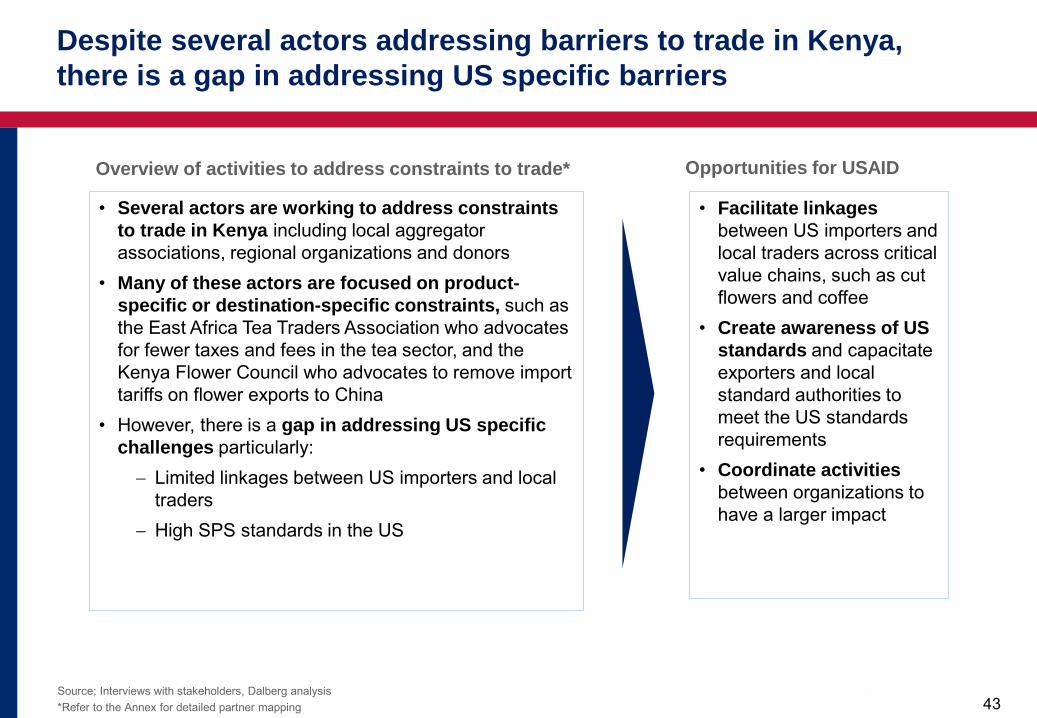
• Several actors are working to address constraints to trade in Kenya including local aggregator associations, regional organizations and donors
• Many of these actors are focused on product-specific or destination-specific constraints, such as the East Africa Tea Traders Association who advocates for fewer taxes and fees in the tea sector, and the Kenya Flower Council who advocates to remove import tariffs on flower exports to China
• However, there is a gap in addressing US specific challenges particularly: − Limited linkages between US importers and local
traders − High SPS standards in the US
• Facilitate linkages between US importers and local traders across critical value chains, such as cut flowers and coffee
• Create awareness of US standards and capacitate exporters and local standard authorities to meet the US standards requirements
• Coordinate activities between organizations to have a larger impact
Opportunities for USAID Overview of activities to address constraints to trade*
Despite several actors addressing barriers to trade in Kenya, there is a gap in addressing US specific barriers

44
1. Trade trends of food products with the FtF countries
2. Deeper dive into the potential for future trade – the role of constraints to trade vs. the constraints affecting competitiveness and market interest
3. Constraints to trade a) Constraints common across countries and products b) Constraints specific to a product (country agnostic)
– Fish – Horticulture (fruits, vegetables and flowers) – Coffee
c) Constraints specific to a country (product agnostic) – Kenya – Uganda – Senegal
4. Annex
Table of contents
45 Source: 2017 World Bank database, population, population growth, arable land area, employment in agriculture (% of total employment); Uganda Bureau of statistics, agricultural contribution to GDP 2016, Export.gov website, agricultural contribution to export earnings; COMTRADE data *Based on constant 2004-2006 1000 I$ Gross Production Value
45
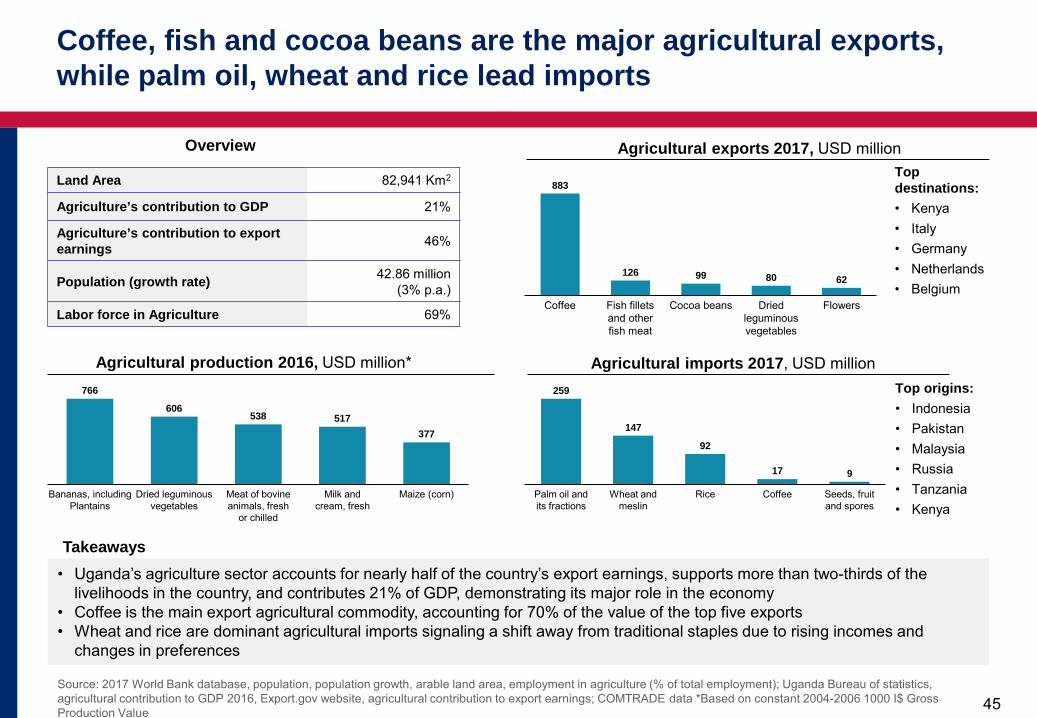
Overview
Land Area 82,941 Km2
Agriculture’s contribution to GDP 21%
Agriculture’s contribution to export earnings 46%
Population (growth rate) 42.86 million (3% p.a.)
Labor force in Agriculture 69%
Agricultural exports 2017, USD million
• Uganda’s agriculture sector accounts for nearly half of the country’s export earnings, supports more than two-thirds of the livelihoods in the country, and contributes 21% of GDP, demonstrating its major role in the economy
• Coffee is the main export agricultural commodity, accounting for 70% of the value of the top five exports • Wheat and rice are dominant agricultural imports signaling a shift away from traditional staples due to rising incomes and
changes in preferences
Takeaways
Agricultural imports 2017, USD million 766
606 538 517
377
Bananas, including Plantains
Maize (corn) Milk and cream, fresh
Dried leguminous vegetables
Meat of bovine animals, fresh
or chilled
Agricultural production 2016, USD million*
Cocoa beans Coffee
99
Fish fillets and other fish meat
Flowers Dried leguminous vegetables
883
126 80 62
Top destinations: • Kenya • Italy • Germany • Netherlands • Belgium
Seeds, fruit and spores
Palm oil and its fractions
147
Wheat and meslin
259
Rice Coffee
92
17 9
Top origins: • Indonesia • Pakistan • Malaysia • Russia • Tanzania • Kenya
Coffee, fish and cocoa beans are the major agricultural exports, while palm oil, wheat and rice lead imports
46 Source: 2018, Export.gov, Uganda – Market challenges; 2018, Othieno L., Barriers to Uganda’s Trade within the Regional Trade Blocs of the EAC and COMESA; 2017, Beyond borders: making transport work for African trade; 2018, World Bank, Logistics Performance Index , Dalberg stakeholder interviews; Dalberg analysis
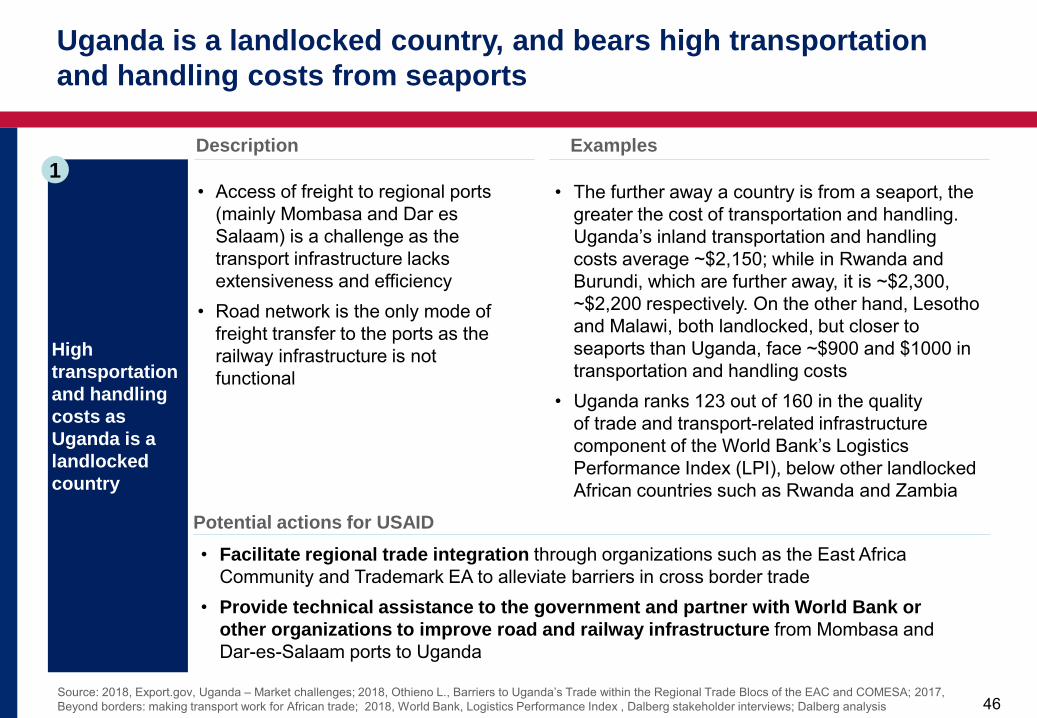
High transportation and handling costs as Uganda is a landlocked country
Description Examples
• Access of freight to regional ports (mainly Mombasa and Dar es Salaam) is a challenge as the transport infrastructure lacks extensiveness and efficiency
• Road network is the only mode of freight transfer to the ports as the railway infrastructure is not functional
• The further away a country is from a seaport, the greater the cost of transportation and handling. Uganda’s inland transportation and handling costs average ~$2,150; while in Rwanda and Burundi, which are further away, it is ~$2,300, ~$2,200 respectively. On the other hand, Lesotho and Malawi, both landlocked, but closer to seaports than Uganda, face ~$900 and $1000 in transportation and handling costs
• Uganda ranks 123 out of 160 in the quality of trade and transport-related infrastructure component of the World Bank’s Logistics Performance Index (LPI), below other landlocked African countries such as Rwanda and Zambia
Potential actions for USAID • Facilitate regional trade integration through organizations such as the East Africa
Community and Trademark EA to alleviate barriers in cross border trade • Provide technical assistance to the government and partner with World Bank or
other organizations to improve road and railway infrastructure from Mombasa and Dar-es-Salaam ports to Uganda
1
Uganda is a landlocked country, and bears high transportation and handling costs from seaports
47 Source: 2017, Hinamundi C., Tracking the Missing Link: Why Uganda is missing out on the cocoa windfall; 2018, Export.gov, Uganda – Agriculture; 2018, MoTIC, New National AGOA Strategy to Impove Uganda’s performance in AGOA; Dalberg analysis
47
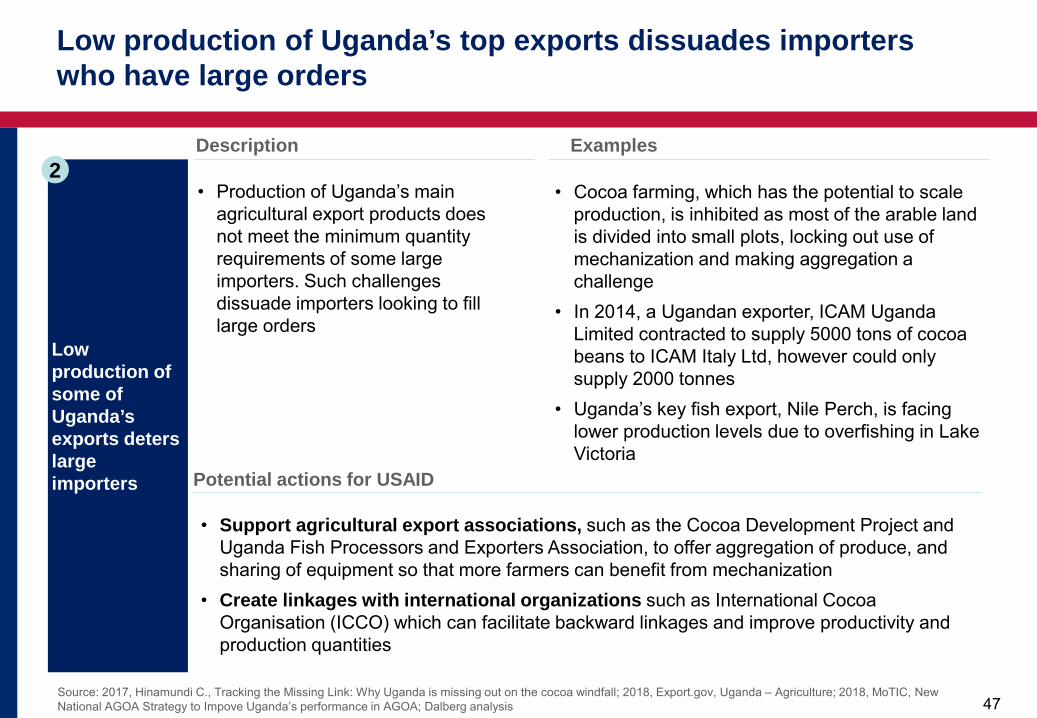
Low production of some of Uganda’s exports deters large importers
Description Examples
• Production of Uganda’s main agricultural export products does not meet the minimum quantity requirements of some large importers. Such challenges dissuade importers looking to fill large orders
• Cocoa farming, which has the potential to scale production, is inhibited as most of the arable land is divided into small plots, locking out use of mechanization and making aggregation a challenge
• In 2014, a Ugandan exporter, ICAM Uganda Limited contracted to supply 5000 tons of cocoa beans to ICAM Italy Ltd, however could only supply 2000 tonnes
• Uganda’s key fish export, Nile Perch, is facing lower production levels due to overfishing in Lake Victoria
Potential actions for USAID
• Support agricultural export associations, such as the Cocoa Development Project and Uganda Fish Processors and Exporters Association, to offer aggregation of produce, and sharing of equipment so that more farmers can benefit from mechanization
• Create linkages with international organizations such as International Cocoa Organisation (ICCO) which can facilitate backward linkages and improve productivity and production quantities
2
Low production of Uganda’s top exports dissuades importers who have large orders
48
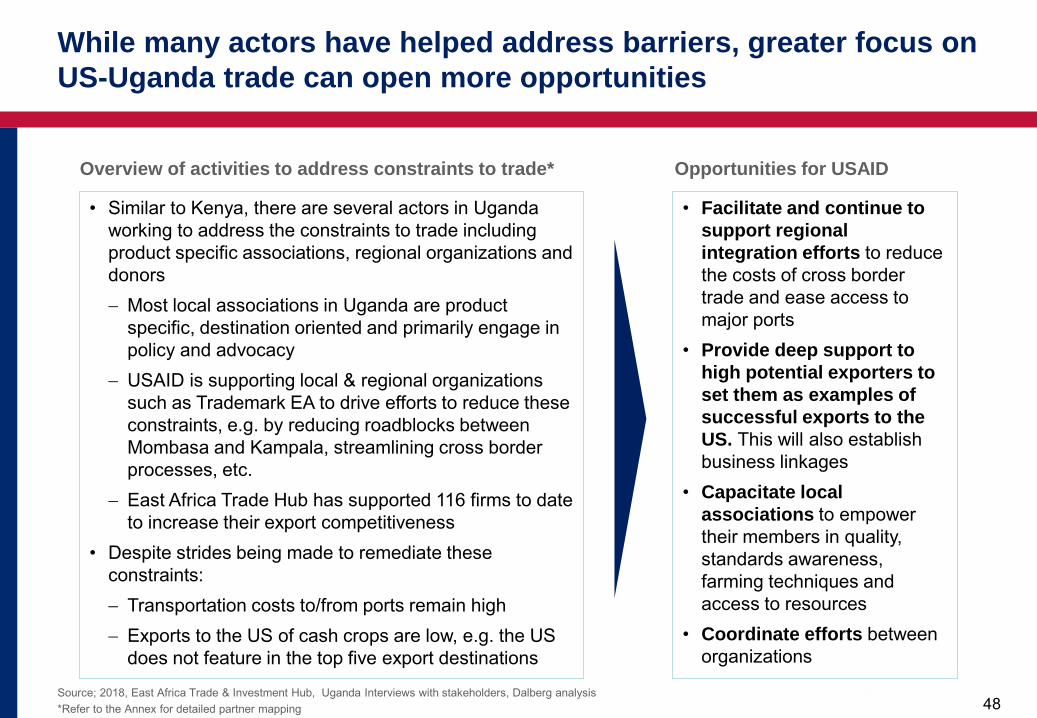
While many actors have helped address barriers, greater focus on US-Uganda trade can open more opportunities
Source; 2018, East Africa Trade & Investment Hub, Uganda Interviews with stakeholders, Dalberg analysis *Refer to the Annex for detailed partner mapping
48
• Similar to Kenya, there are several actors in Uganda working to address the constraints to trade including product specific associations, regional organizations and donors − Most local associations in Uganda are product
specific, destination oriented and primarily engage in policy and advocacy
− USAID is supporting local & regional organizations such as Trademark EA to drive efforts to reduce these constraints, e.g. by reducing roadblocks between Mombasa and Kampala, streamlining cross border processes, etc.
− East Africa Trade Hub has supported 116 firms to date to increase their export competitiveness
• Despite strides being made to remediate these constraints: − Transportation costs to/from ports remain high − Exports to the US of cash crops are low, e.g. the US
does not feature in the top five export destinations
• Facilitate and continue to support regional integration efforts to reduce the costs of cross border trade and ease access to major ports
• Provide deep support to high potential exporters to set them as examples of successful exports to the US. This will also establish business linkages
• Capacitate local associations to empower their members in quality, standards awareness, farming techniques and access to resources
• Coordinate efforts between organizations
Opportunities for USAID Overview of activities to address constraints to trade*
49
1. Trade trends of food products with the FtF countries
2. Deeper dive into the potential for future trade – the role of constraints to trade vs. the constraints affecting competitiveness and market interest
3. Constraints to trade a) Constraints common across countries and products b) Constraints specific to a product (country agnostic)
– Fish – Horticulture (fruits, vegetables and flowers) – Coffee
c) Constraints specific to a country (product agnostic) – Kenya – Uganda – Senegal
4. Annex
Table of contents
50
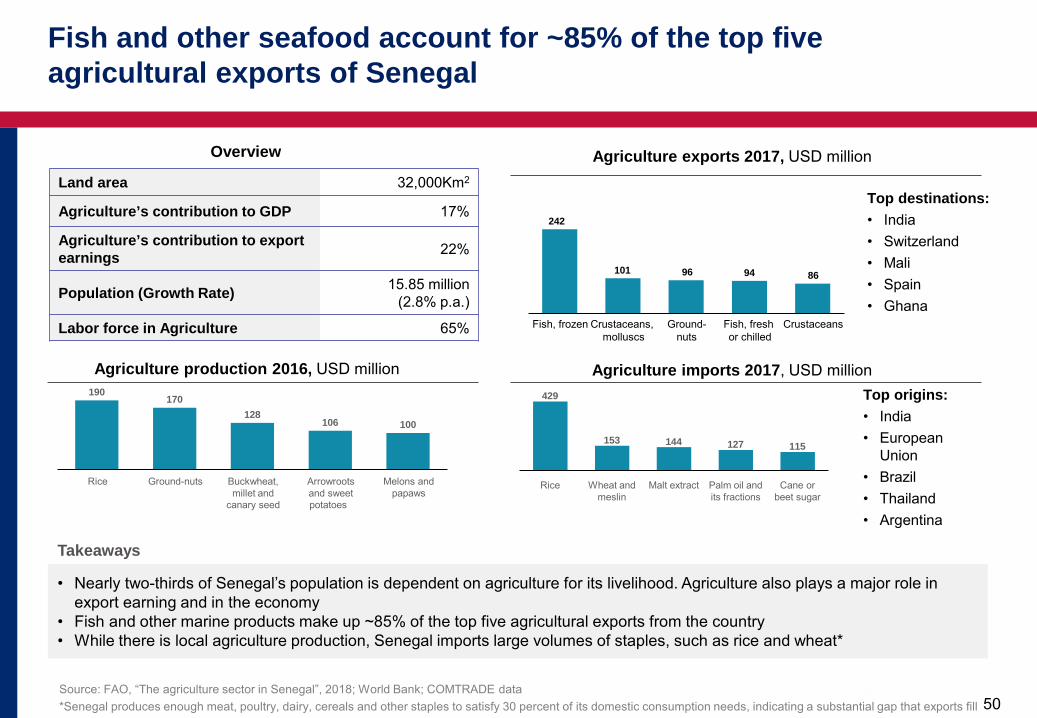
Fish and other seafood account for ~85% of the top five agricultural exports of Senegal
Source: FAO, “The agriculture sector in Senegal”, 2018; World Bank; COMTRADE data *Senegal produces enough meat, poultry, dairy, cereals and other staples to satisfy 30 percent of its domestic consumption needs, indicating a substantial gap that exports fill
Overview
Land area 32,000Km2
Agriculture’s contribution to GDP 17%
Agriculture’s contribution to export earnings 22%
Population (Growth Rate) 15.85 million (2.8% p.a.)
Labor force in Agriculture 65%
Agriculture exports 2017, USD million
• Nearly two-thirds of Senegal’s population is dependent on agriculture for its livelihood. Agriculture also plays a major role in export earning and in the economy
• Fish and other marine products make up ~85% of the top five agricultural exports from the country • While there is local agriculture production, Senegal imports large volumes of staples, such as rice and wheat*
Takeaways
Agriculture imports 2017, USD million 190
170 128
106 100
Buckwheat, millet and
canary seed
Ground-nuts Rice Arrowroots and sweet potatoes
Melons and papaws
Agriculture production 2016, USD million
96
Crustaceans, molluscs
Crustaceans Fish, frozen Ground-nuts
Fish, fresh or chilled
101
242
94 86
Top destinations: • India • Switzerland • Mali • Spain • Ghana
Wheat and meslin
Rice
429
Cane or beet sugar
Malt extract Palm oil and its fractions
127 153 144 115
Top origins: • India • European
Union • Brazil • Thailand • Argentina
51 Source: 2015,World Bank,Groundnut value chain competitiveness and prospects for development; 2017, Apanews, Senegal suspends groundnuts export tax; 2018, IFPRI, Groundnut export tax in Senegal: winners and losers; 2015, FAO, Factsheet on Senegal
51
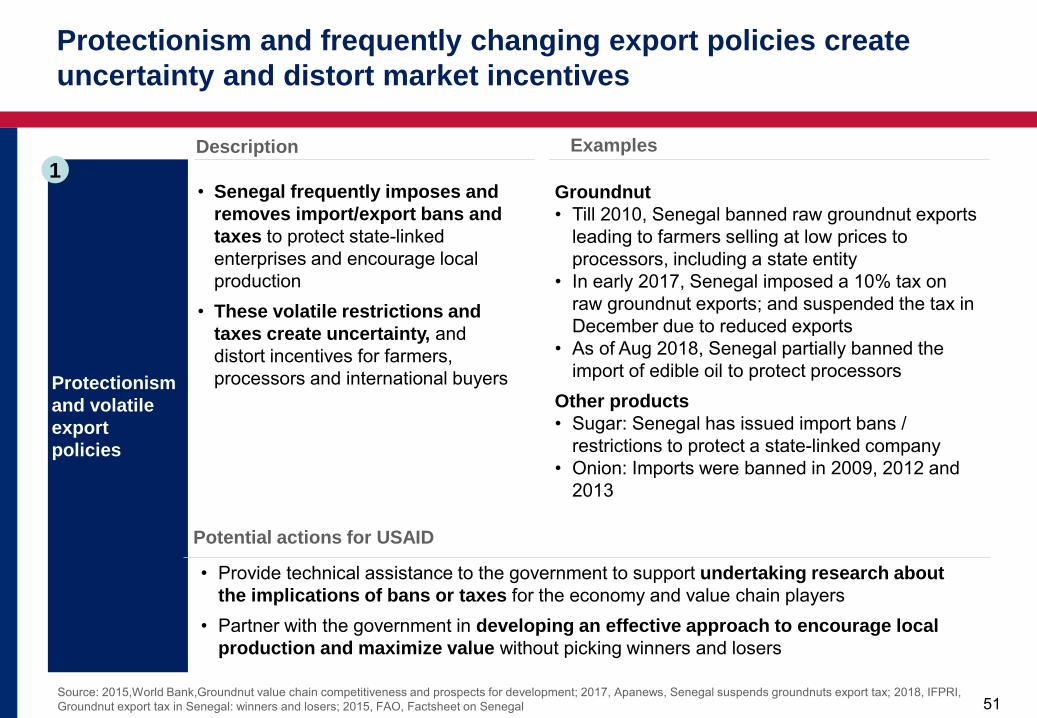
Protectionism and volatile export policies
• Senegal frequently imposes and removes import/export bans and taxes to protect state-linked enterprises and encourage local production
• These volatile restrictions and taxes create uncertainty, and distort incentives for farmers, processors and international buyers
Groundnut • Till 2010, Senegal banned raw groundnut exports
leading to farmers selling at low prices to processors, including a state entity
• In early 2017, Senegal imposed a 10% tax on raw groundnut exports; and suspended the tax in December due to reduced exports
• As of Aug 2018, Senegal partially banned the import of edible oil to protect processors
Other products • Sugar: Senegal has issued import bans /
restrictions to protect a state-linked company • Onion: Imports were banned in 2009, 2012 and
2013
Potential actions for USAID
• Provide technical assistance to the government to support undertaking research about the implications of bans or taxes for the economy and value chain players
• Partner with the government in developing an effective approach to encourage local production and maximize value without picking winners and losers
1
Protectionism and frequently changing export policies create uncertainty and distort market incentives
Description Examples
52
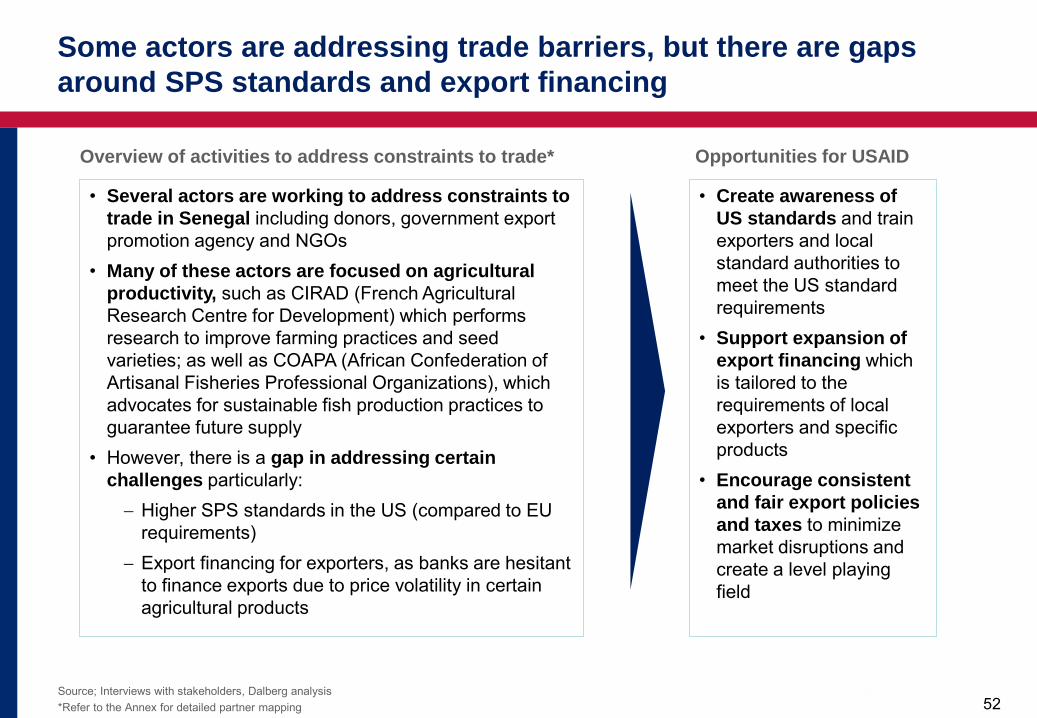
Some actors are addressing trade barriers, but there are gaps around SPS standards and export financing
Source; Interviews with stakeholders, Dalberg analysis *Refer to the Annex for detailed partner mapping
52
• Several actors are working to address constraints to trade in Senegal including donors, government export promotion agency and NGOs
• Many of these actors are focused on agricultural productivity, such as CIRAD (French Agricultural Research Centre for Development) which performs research to improve farming practices and seed varieties; as well as COAPA (African Confederation of Artisanal Fisheries Professional Organizations), which advocates for sustainable fish production practices to guarantee future supply
• However, there is a gap in addressing certain challenges particularly: − Higher SPS standards in the US (compared to EU
requirements) − Export financing for exporters, as banks are hesitant
to finance exports due to price volatility in certain agricultural products
• Create awareness of US standards and train exporters and local standard authorities to meet the US standard requirements
• Support expansion of export financing which is tailored to the requirements of local exporters and specific products
• Encourage consistent and fair export policies and taxes to minimize market disruptions and create a level playing field
Opportunities for USAID Overview of activities to address constraints to trade*
53
1. Trade trends of food products with the FtF countries
2. Deeper dive into the potential for future trade – the role of constraints to trade vs. the constraints affecting competitiveness and market interest
3. Constraints to trade a) Constraints common across countries and products b) Constraints specific to a product (country agnostic)
– Fish – Horticulture (fruits, vegetables and flowers) – Coffee
c) Constraints specific to a country (product agnostic) – Kenya – Uganda – Senegal
4. Annex
a) Stakeholder mapping b) Interviews conducted
Table of contents
54 54
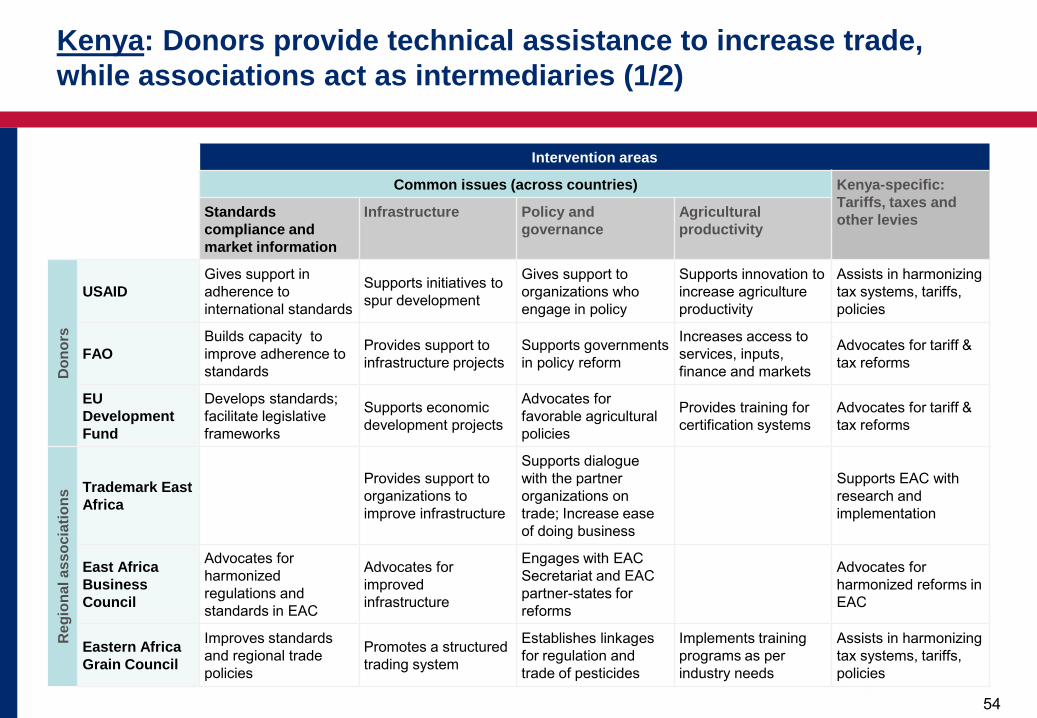
Intervention areas
Common issues (across countries) Kenya-specific: Tariffs, taxes and other levies Standards
compliance and market information
Infrastructure Policy and governance
Agricultural productivity
Don
ors
USAID Gives support in adherence to international standards
Supports initiatives to spur development
Gives support to organizations who engage in policy
Supports innovation to increase agriculture productivity
Assists in harmonizing tax systems, tariffs, policies
FAO Builds capacity to improve adherence to standards
Provides support to infrastructure projects
Supports governments in policy reform
Increases access to services, inputs, finance and markets
Advocates for tariff & tax reforms
EU Development Fund
Develops standards; facilitate legislative frameworks
Supports economic development projects
Advocates for favorable agricultural policies
Provides training for certification systems
Advocates for tariff & tax reforms
Reg
iona
l ass
ocia
tions
Trademark East Africa
Provides support to organizations to improve infrastructure
Supports dialogue with the partner organizations on trade; Increase ease of doing business
Supports EAC with research and implementation
East Africa Business Council
Advocates for harmonized regulations and standards in EAC
Advocates for improved infrastructure
Engages with EAC Secretariat and EAC partner-states for reforms
Advocates for harmonized reforms in EAC
Eastern Africa Grain Council
Improves standards and regional trade policies
Promotes a structured trading system
Establishes linkages for regulation and trade of pesticides
Implements training programs as per industry needs
Assists in harmonizing tax systems, tariffs, policies
Kenya: Donors provide technical assistance to increase trade, while associations act as intermediaries (1/2)
55 55
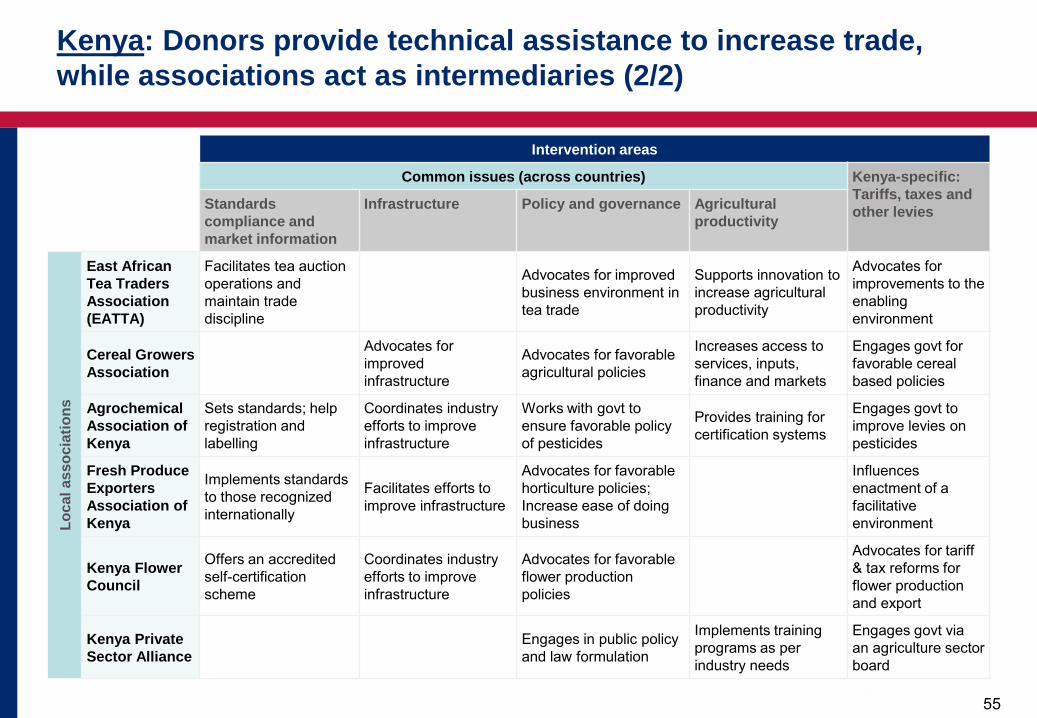
Intervention areas
Common issues (across countries) Kenya-specific: Tariffs, taxes and other levies Standards
compliance and market information
Infrastructure Policy and governance Agricultural productivity
Loca
l ass
ocia
tions
East African Tea Traders Association (EATTA)
Facilitates tea auction operations and maintain trade discipline
Advocates for improved business environment in tea trade
Supports innovation to increase agricultural productivity
Advocates for improvements to the enabling environment
Cereal Growers Association
Advocates for improved infrastructure
Advocates for favorable agricultural policies
Increases access to services, inputs, finance and markets
Engages govt for favorable cereal based policies
Agrochemical Association of Kenya
Sets standards; help registration and labelling
Coordinates industry efforts to improve infrastructure
Works with govt to ensure favorable policy of pesticides
Provides training for certification systems
Engages govt to improve levies on pesticides
Fresh Produce Exporters Association of Kenya
Implements standards to those recognized internationally
Facilitates efforts to improve infrastructure
Advocates for favorable horticulture policies; Increase ease of doing business
Influences enactment of a facilitative environment
Kenya Flower Council
Offers an accredited self-certification scheme
Coordinates industry efforts to improve infrastructure
Advocates for favorable flower production policies
Advocates for tariff & tax reforms for flower production and export
Kenya Private Sector Alliance
Engages in public policy and law formulation
Implements training programs as per industry needs
Engages govt via an agriculture sector board
Kenya: Donors provide technical assistance to increase trade, while associations act as intermediaries (2/2)
56 Source: 2018, Trademark EA website; 2018, East Africa Tea Traders Association website; 2018 FAO website; 2018 USAID website; 2018; The Agrochemical association of Kenya website; Business daily
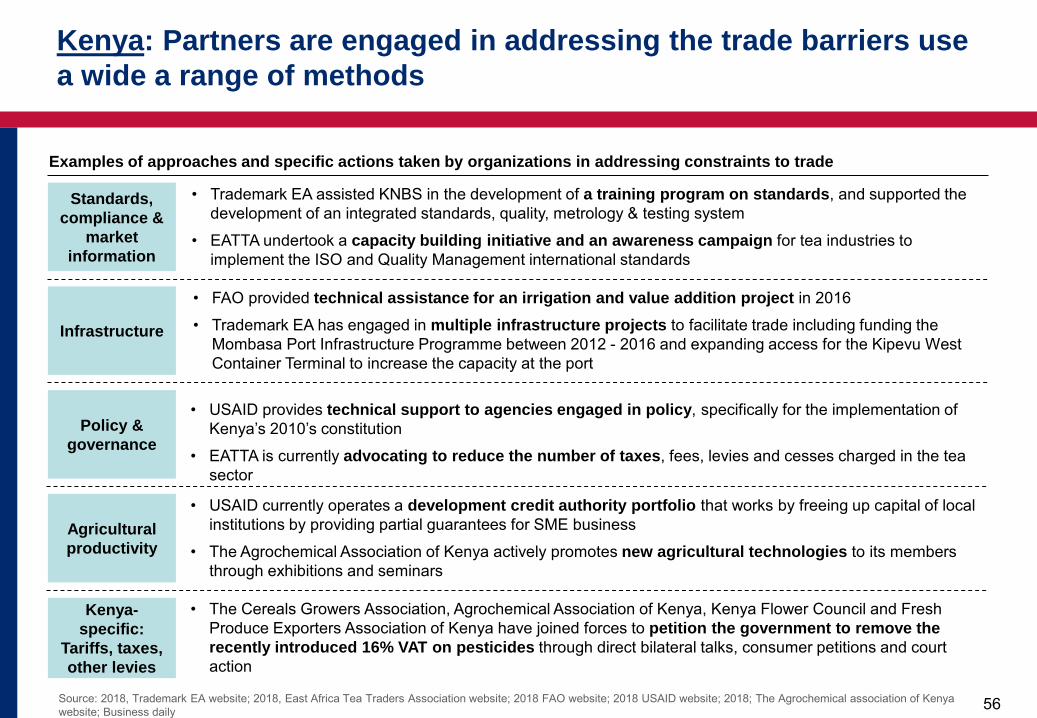
56
Standards, compliance &
market information
Infrastructure
Policy & governance
Agricultural productivity
Kenya-specific:
Tariffs, taxes, other levies
• Trademark EA assisted KNBS in the development of a training program on standards, and supported the development of an integrated standards, quality, metrology & testing system
• EATTA undertook a capacity building initiative and an awareness campaign for tea industries to implement the ISO and Quality Management international standards
• FAO provided technical assistance for an irrigation and value addition project in 2016
• Trademark EA has engaged in multiple infrastructure projects to facilitate trade including funding the Mombasa Port Infrastructure Programme between 2012 - 2016 and expanding access for the Kipevu West Container Terminal to increase the capacity at the port
• USAID provides technical support to agencies engaged in policy, specifically for the implementation of Kenya’s 2010’s constitution
• EATTA is currently advocating to reduce the number of taxes, fees, levies and cesses charged in the tea sector
• USAID currently operates a development credit authority portfolio that works by freeing up capital of local institutions by providing partial guarantees for SME business
• The Agrochemical Association of Kenya actively promotes new agricultural technologies to its members through exhibitions and seminars
• The Cereals Growers Association, Agrochemical Association of Kenya, Kenya Flower Council and Fresh Produce Exporters Association of Kenya have joined forces to petition the government to remove the recently introduced 16% VAT on pesticides through direct bilateral talks, consumer petitions and court action
Examples of approaches and specific actions taken by organizations in addressing constraints to trade
Kenya: Partners are engaged in addressing the trade barriers use a wide a range of methods
57 57
Intervention areas
Common issues (across countries) Uganda-specific: Low production and high transportation costs
Standards compliance and market information
Infrastructure Policy and governance
Agricultural productivity
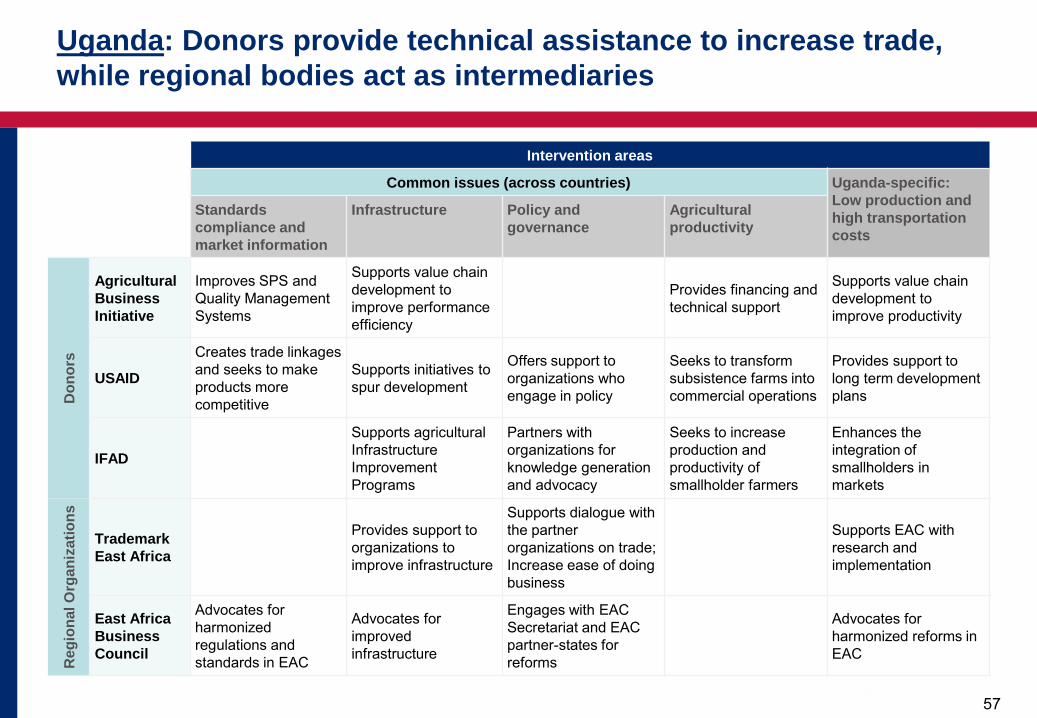
Don
ors
Agricultural Business Initiative
Improves SPS and Quality Management Systems
Supports value chain development to improve performance efficiency
Provides financing and technical support
Supports value chain development to improve productivity
USAID
Creates trade linkages and seeks to make products more competitive
Supports initiatives to spur development
Offers support to organizations who engage in policy
Seeks to transform subsistence farms into commercial operations
Provides support to long term development plans
IFAD
Supports agricultural Infrastructure Improvement Programs
Partners with organizations for knowledge generation and advocacy
Seeks to increase production and productivity of smallholder farmers
Enhances the integration of smallholders in markets
Reg
iona
l Org
aniz
atio
ns
Trademark East Africa
Provides support to organizations to improve infrastructure
Supports dialogue with the partner organizations on trade; Increase ease of doing business
Supports EAC with research and implementation
East Africa Business Council
Advocates for harmonized regulations and standards in EAC
Advocates for improved infrastructure
Engages with EAC Secretariat and EAC partner-states for reforms
Advocates for harmonized reforms in EAC
Uganda: Donors provide technical assistance to increase trade, while regional bodies act as intermediaries
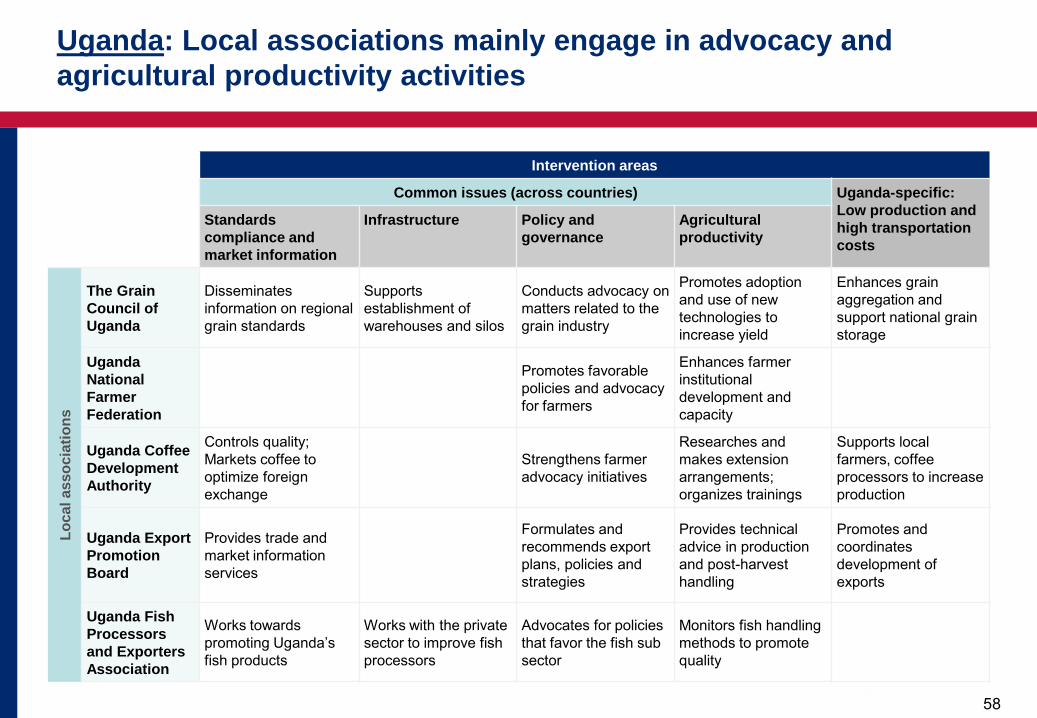
58 58
Intervention areas
Common issues (across countries) Uganda-specific: Low production and high transportation costs
Standards compliance and market information
Infrastructure Policy and governance
Agricultural productivity
Loca
l ass
ocia
tions
The Grain Council of Uganda
Disseminates information on regional grain standards
Supports establishment of warehouses and silos
Conducts advocacy on matters related to the grain industry
Promotes adoption and use of new technologies to increase yield
Enhances grain aggregation and support national grain storage
Uganda National Farmer Federation
Promotes favorable policies and advocacy for farmers
Enhances farmer institutional development and capacity
Uganda Coffee Development Authority
Controls quality; Markets coffee to optimize foreign exchange
Strengthens farmer advocacy initiatives
Researches and makes extension arrangements; organizes trainings
Supports local farmers, coffee processors to increase production
Uganda Export Promotion Board
Provides trade and market information services
Formulates and recommends export plans, policies and strategies
Provides technical advice in production and post-harvest handling
Promotes and coordinates development of exports
Uganda Fish Processors and Exporters Association
Works towards promoting Uganda’s fish products
Works with the private sector to improve fish processors
Advocates for policies that favor the fish sub sector
Monitors fish handling methods to promote quality
Uganda: Local associations mainly engage in advocacy and agricultural productivity activities
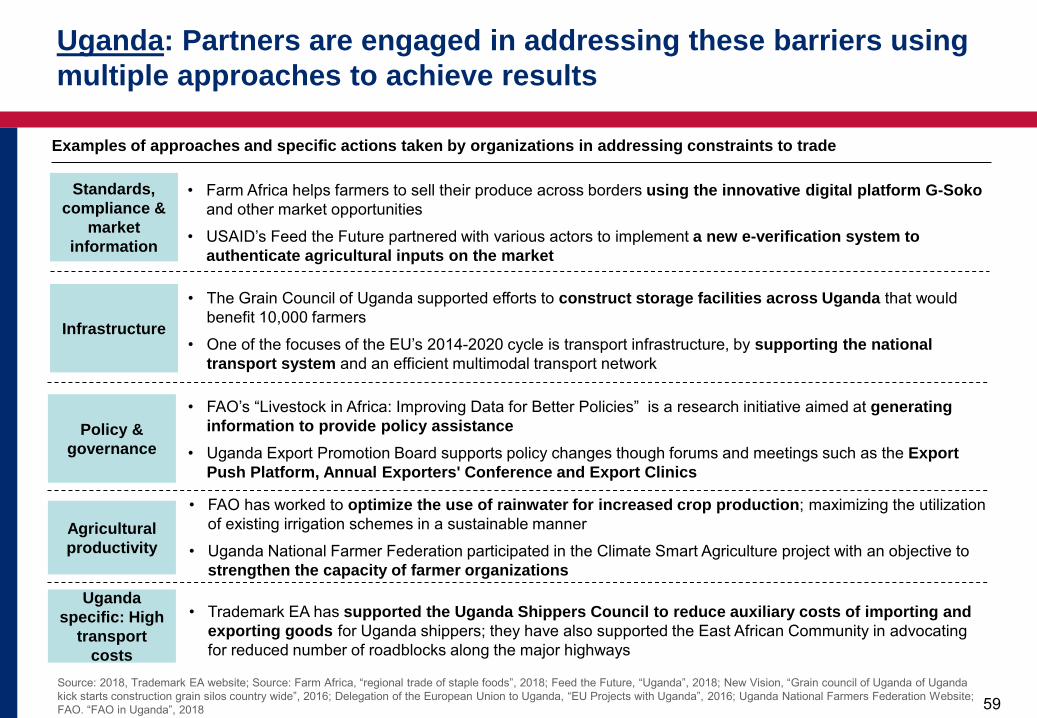
59 Source: 2018, Trademark EA website; Source: Farm Africa, “regional trade of staple foods”, 2018; Feed the Future, “Uganda”, 2018; New Vision, “Grain council of Uganda of Uganda kick starts construction grain silos country wide”, 2016; Delegation of the European Union to Uganda, “EU Projects with Uganda”, 2016; Uganda National Farmers Federation Website; FAO. “FAO in Uganda”, 2018
59
Standards, compliance &
market information
Infrastructure
Policy & governance
Agricultural productivity
Uganda specific: High
transport costs
• Farm Africa helps farmers to sell their produce across borders using the innovative digital platform G-Soko and other market opportunities
• USAID’s Feed the Future partnered with various actors to implement a new e-verification system to authenticate agricultural inputs on the market
• The Grain Council of Uganda supported efforts to construct storage facilities across Uganda that would benefit 10,000 farmers
• One of the focuses of the EU’s 2014-2020 cycle is transport infrastructure, by supporting the national transport system and an efficient multimodal transport network
• FAO’s “Livestock in Africa: Improving Data for Better Policies” is a research initiative aimed at generating information to provide policy assistance
• Uganda Export Promotion Board supports policy changes though forums and meetings such as the Export Push Platform, Annual Exporters' Conference and Export Clinics
• FAO has worked to optimize the use of rainwater for increased crop production; maximizing the utilization of existing irrigation schemes in a sustainable manner
• Uganda National Farmer Federation participated in the Climate Smart Agriculture project with an objective to strengthen the capacity of farmer organizations
Examples of approaches and specific actions taken by organizations in addressing constraints to trade
• Trademark EA has supported the Uganda Shippers Council to reduce auxiliary costs of importing and exporting goods for Uganda shippers; they have also supported the East African Community in advocating for reduced number of roadblocks along the major highways
Uganda: Partners are engaged in addressing these barriers using multiple approaches to achieve results
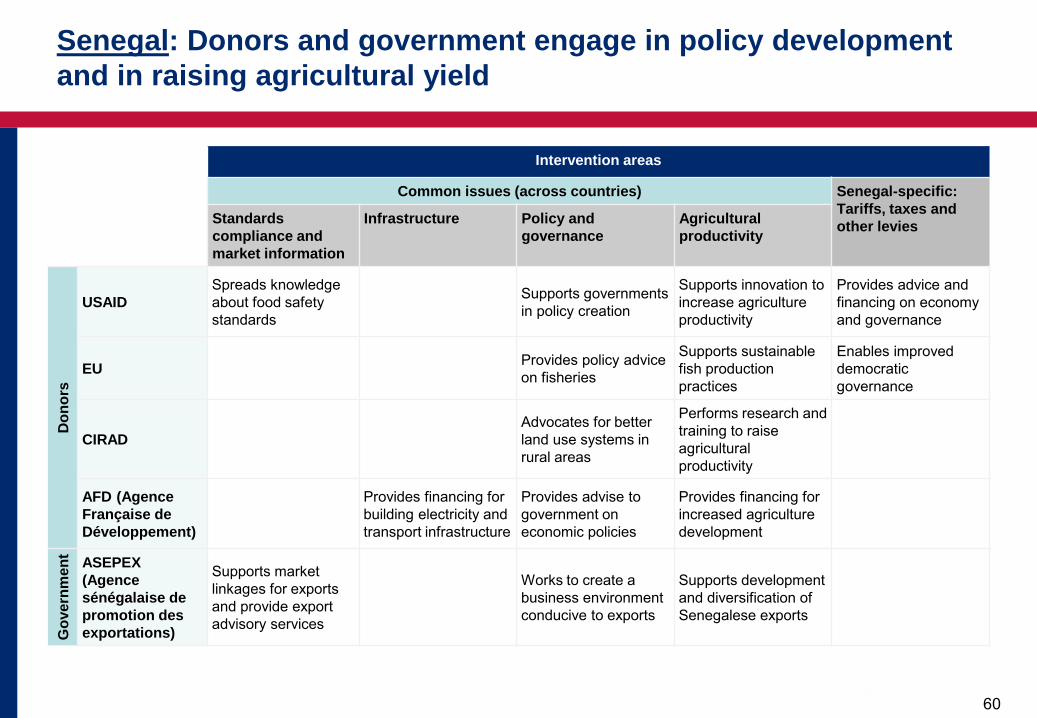
60 60
Intervention areas
Common issues (across countries) Senegal-specific: Tariffs, taxes and other levies Standards
compliance and market information
Infrastructure Policy and governance
Agricultural productivity
Don
ors
USAID Spreads knowledge about food safety standards
Supports governments in policy creation
Supports innovation to increase agriculture productivity
Provides advice and financing on economy and governance
EU Provides policy advice on fisheries
Supports sustainable fish production practices
Enables improved democratic governance
CIRAD Advocates for better land use systems in rural areas
Performs research and training to raise agricultural productivity
AFD (Agence Française de Développement)
Provides financing for building electricity and transport infrastructure
Provides advise to government on economic policies
Provides financing for increased agriculture development
Gov
ernm
ent ASEPEX
(Agence sénégalaise de promotion des exportations)
Supports market linkages for exports and provide export advisory services
Works to create a business environment conducive to exports
Supports development and diversification of Senegalese exports
Senegal: Donors and government engage in policy development and in raising agricultural yield
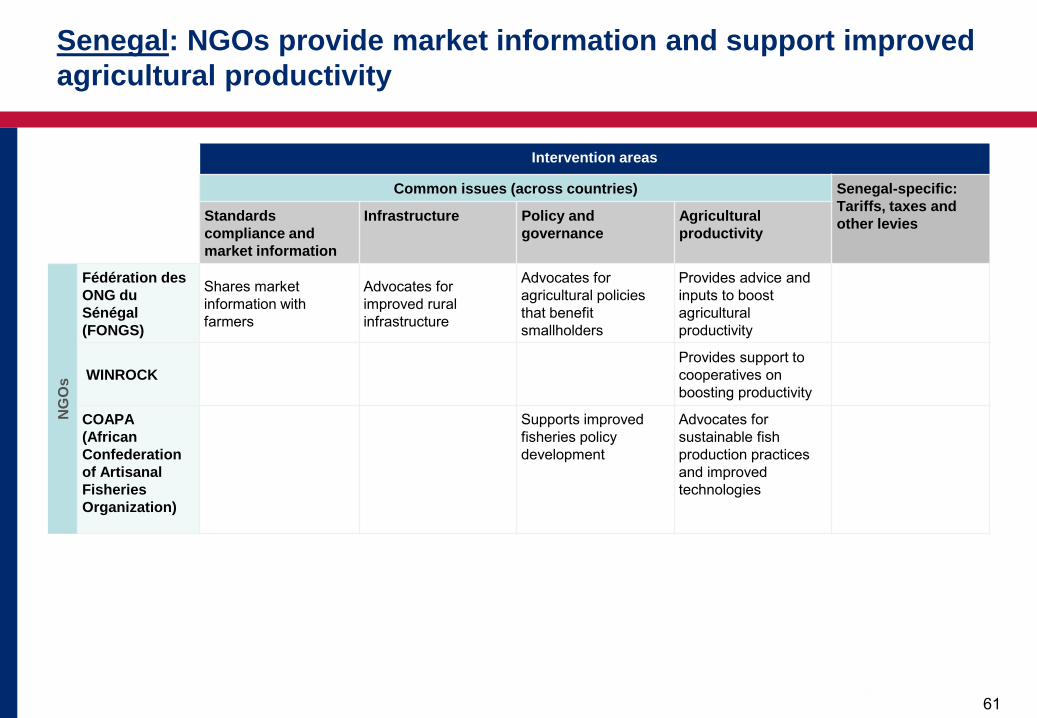
61 61
Intervention areas
Common issues (across countries) Senegal-specific: Tariffs, taxes and other levies Standards
compliance and market information
Infrastructure Policy and governance
Agricultural productivity
NG
Os
Fédération des ONG du Sénégal (FONGS)
Shares market information with farmers
Advocates for improved rural infrastructure
Advocates for agricultural policies that benefit smallholders
Provides advice and inputs to boost agricultural productivity
WINROCK Provides support to cooperatives on boosting productivity
COAPA (African Confederation of Artisanal Fisheries Organization)
Supports improved fisheries policy development
Advocates for sustainable fish production practices and improved technologies
Senegal: NGOs provide market information and support improved agricultural productivity
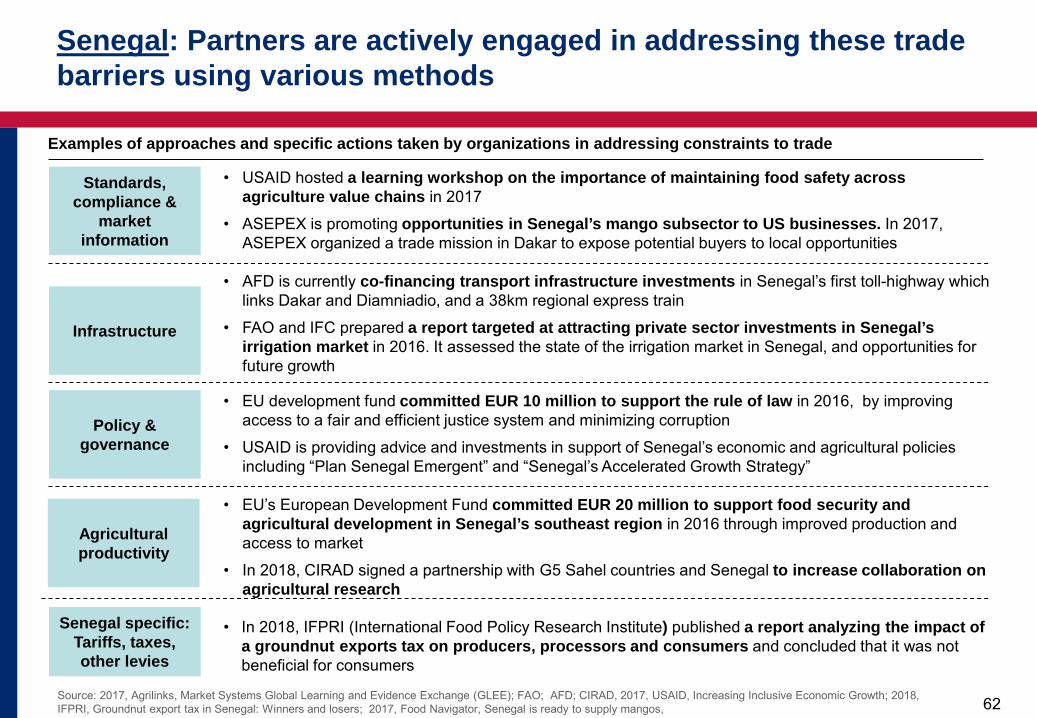
62 Source: 2017, Agrilinks, Market Systems Global Learning and Evidence Exchange (GLEE); FAO; AFD; CIRAD, 2017, USAID, Increasing Inclusive Economic Growth; 2018, IFPRI, Groundnut export tax in Senegal: Winners and losers; 2017, Food Navigator, Senegal is ready to supply mangos,
62
Standards, compliance &
market information
Infrastructure
Policy & governance
Agricultural productivity
Senegal specific: Tariffs, taxes, other levies
• USAID hosted a learning workshop on the importance of maintaining food safety across agriculture value chains in 2017
• ASEPEX is promoting opportunities in Senegal’s mango subsector to US businesses. In 2017, ASEPEX organized a trade mission in Dakar to expose potential buyers to local opportunities
Examples of approaches and specific actions taken by organizations in addressing constraints to trade
• AFD is currently co-financing transport infrastructure investments in Senegal’s first toll-highway which links Dakar and Diamniadio, and a 38km regional express train
• FAO and IFC prepared a report targeted at attracting private sector investments in Senegal’s irrigation market in 2016. It assessed the state of the irrigation market in Senegal, and opportunities for future growth
• EU’s European Development Fund committed EUR 20 million to support food security and agricultural development in Senegal’s southeast region in 2016 through improved production and access to market
• In 2018, CIRAD signed a partnership with G5 Sahel countries and Senegal to increase collaboration on agricultural research
• EU development fund committed EUR 10 million to support the rule of law in 2016, by improving access to a fair and efficient justice system and minimizing corruption
• USAID is providing advice and investments in support of Senegal’s economic and agricultural policies including “Plan Senegal Emergent” and “Senegal’s Accelerated Growth Strategy”
• In 2018, IFPRI (International Food Policy Research Institute) published a report analyzing the impact of a groundnut exports tax on producers, processors and consumers and concluded that it was not beneficial for consumers
Senegal: Partners are actively engaged in addressing these trade barriers using various methods
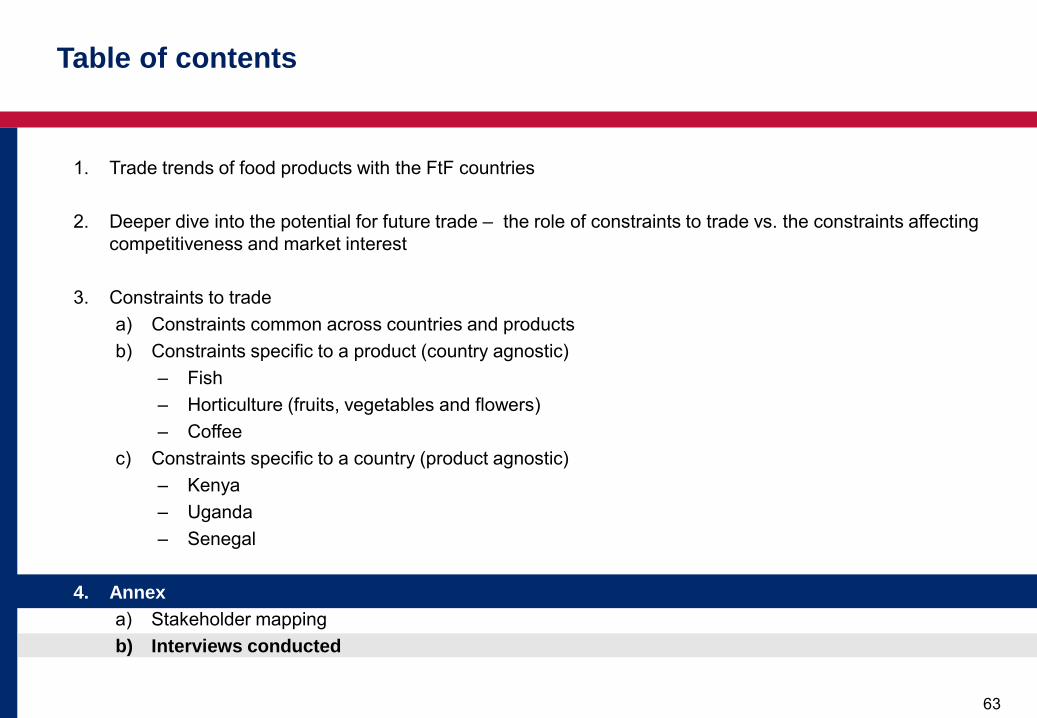
63
1. Trade trends of food products with the FtF countries
2. Deeper dive into the potential for future trade – the role of constraints to trade vs. the constraints affecting competitiveness and market interest
3. Constraints to trade a) Constraints common across countries and products b) Constraints specific to a product (country agnostic)
– Fish – Horticulture (fruits, vegetables and flowers) – Coffee
c) Constraints specific to a country (product agnostic) – Kenya – Uganda – Senegal
4. Annex
a) Stakeholder mapping b) Interviews conducted
Table of contents
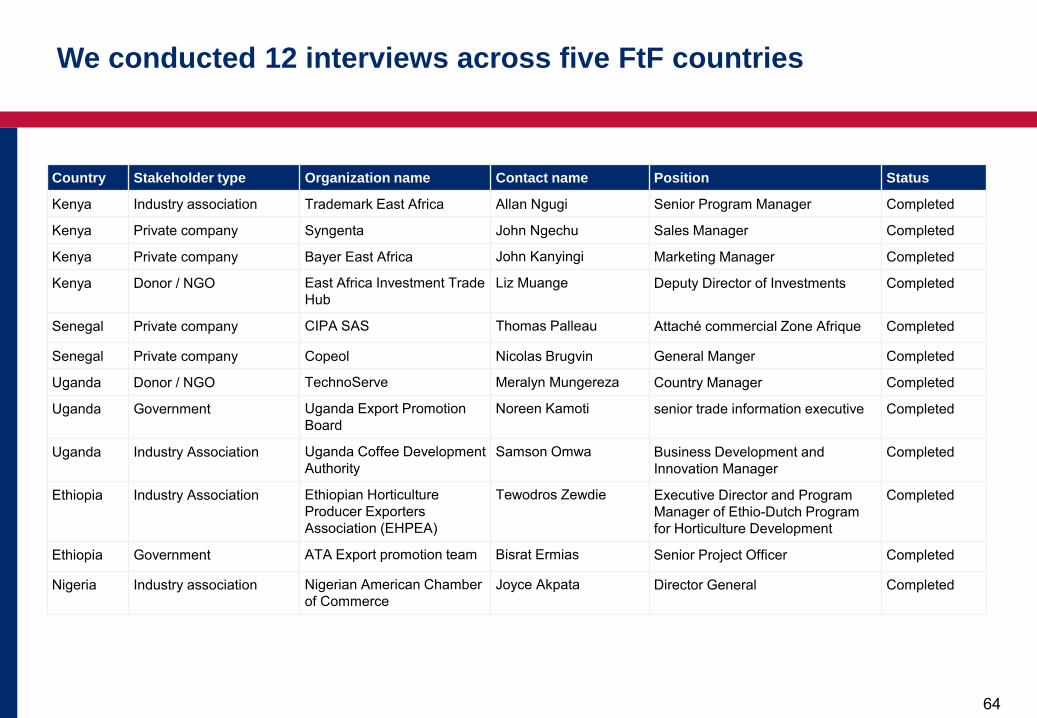
64 64
Country Stakeholder type Organization name Contact name Position Status
Kenya Industry association Trademark East Africa Allan Ngugi Senior Program Manager Completed
Kenya Private company Syngenta John Ngechu Sales Manager Completed
Kenya Private company Bayer East Africa John Kanyingi Marketing Manager Completed
Kenya Donor / NGO East Africa Investment Trade Hub
Liz Muange Deputy Director of Investments Completed
Senegal Private company CIPA SAS Thomas Palleau Attaché commercial Zone Afrique Completed
Senegal Private company Copeol Nicolas Brugvin General Manger Completed
Uganda Donor / NGO TechnoServe Meralyn Mungereza Country Manager Completed
Uganda Government Uganda Export Promotion Board
Noreen Kamoti senior trade information executive Completed
Uganda Industry Association Uganda Coffee Development Authority
Samson Omwa Business Development and Innovation Manager
Completed
Ethiopia Industry Association Ethiopian Horticulture Producer Exporters Association (EHPEA)
Tewodros Zewdie Executive Director and Program Manager of Ethio-Dutch Program for Horticulture Development
Completed
Ethiopia Government ATA Export promotion team Bisrat Ermias Senior Project Officer Completed
Nigeria Industry association Nigerian American Chamber of Commerce
Joyce Akpata Director General Completed
We conducted 12 interviews across five FtF countries