Embed Size (px)
Citation preview

Statistika Deskriptif
Dr. Kusman Sadik, M.Si
Departemen Statistika IPB, 2018/2019

In discussing the methods for providing summary
descriptions of data, it helps to distinguish
between the two basic types:
1. Qualitative or categorical data
2. Quantitative or numerical or
measurement data
2

(1) Discrete variable : the scale is made up of
distinct numbers with gaps in between
data count (number of bacteria, number of
ion, number of star, etc).
(2) Continuous variable : the measurement
scale does not have gaps, such variables are
called continuous height, weight, time.
3

4

5

Frequency table
Pie chart
Bar chart / histogram
Pareto chart
Lihat Johnson , hlm. 25-29
6

7

8

9

10

11

12

13
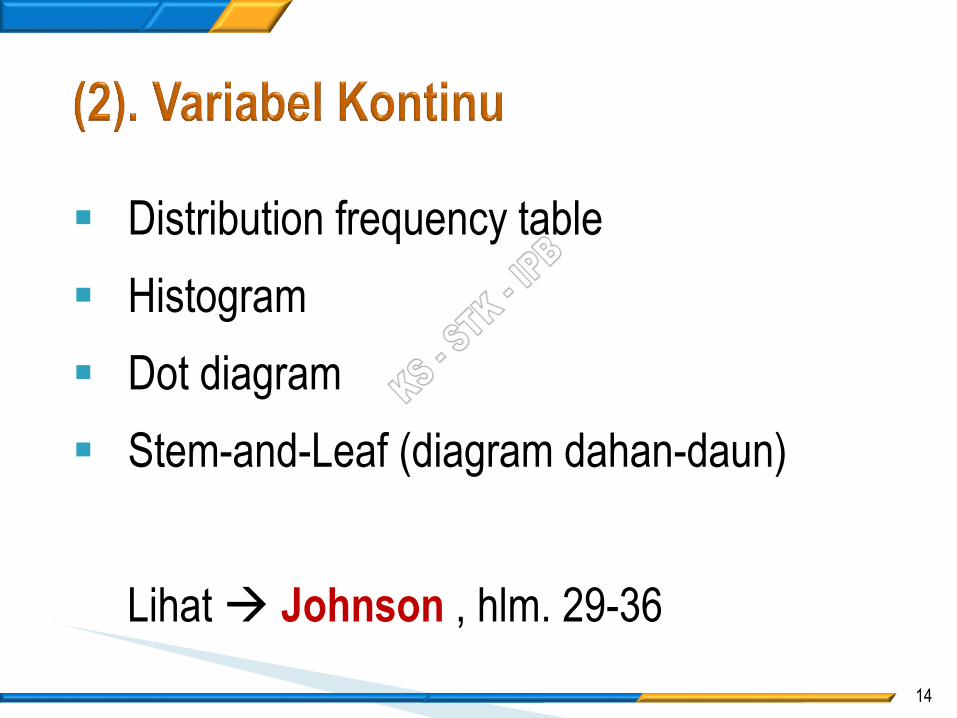
Distribution frequency table
Histogram
Dot diagram
Stem-and-Leaf (diagram dahan-daun)
Lihat Johnson , hlm. 29-36
14

15

16
17

18

19

20

21

22

The graphic procedures help us to visualize the
pattern of a data set of measurements.
To obtain a more objective summary description
and a comparison of data sets, we must go one
step further and obtain numerical values for the
location or center of the data and the amount of
variability present.
23

Rata-rata (mean)
Median
Kuartil
Persentil
24

25

Kuartil dan Persentil
26
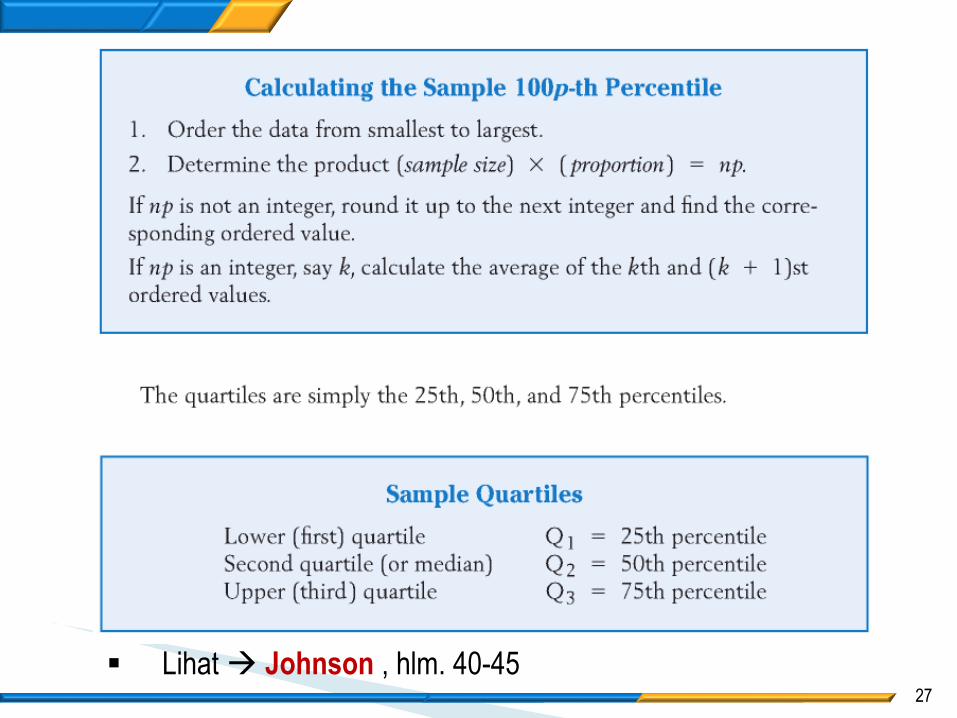
Lihat Johnson , hlm. 40-4527

28

29

30

31

32

Ragam (Variance)
Simpangan Baku (Standard Deviation)
Jangkauan (Range)
Jangkauan antar kuartil (Interquartile range)
33

34
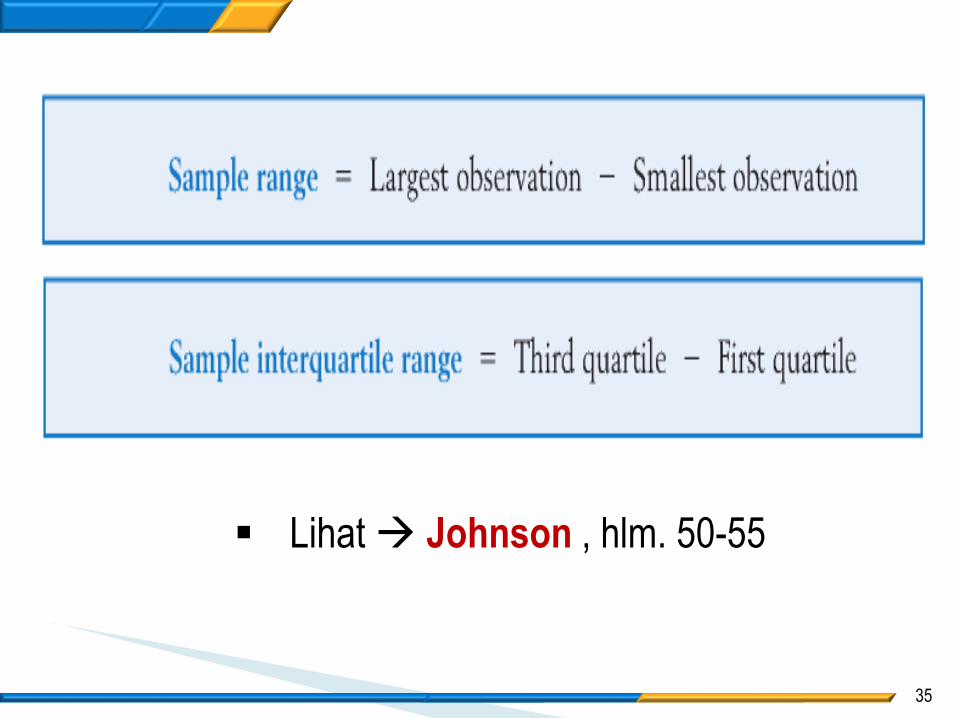
Lihat Johnson , hlm. 50-55
35

36

37

38

Lihat Johnson (Example 17), hlm. 56
Min
Q1 Q2 Q3
Max
39

Q1 = 4.4
Q2 = 9.4
Q3 = 17.5
(dari hasil sebelumnya)
40
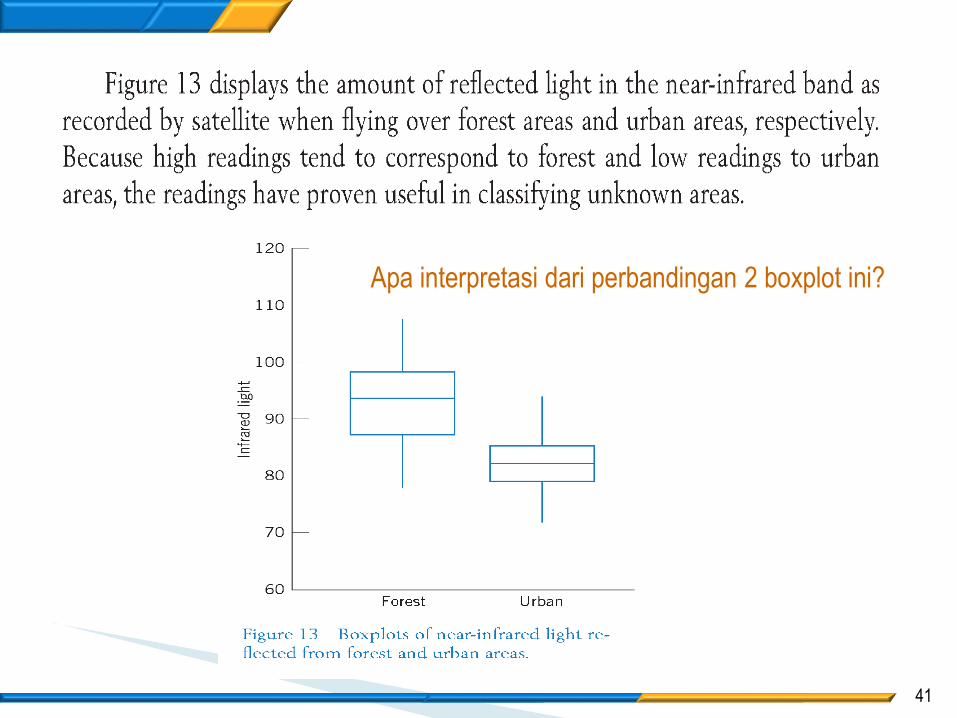
Apa interpretasi dari perbandingan 2 boxplot ini?
41

42

Johnson (Exercise : 2.1), hlm. 36
43

Johnson (Exercise : 2.17), hlm. 38
44

Johnson (Exercise : 2.19), hlm. 38
45
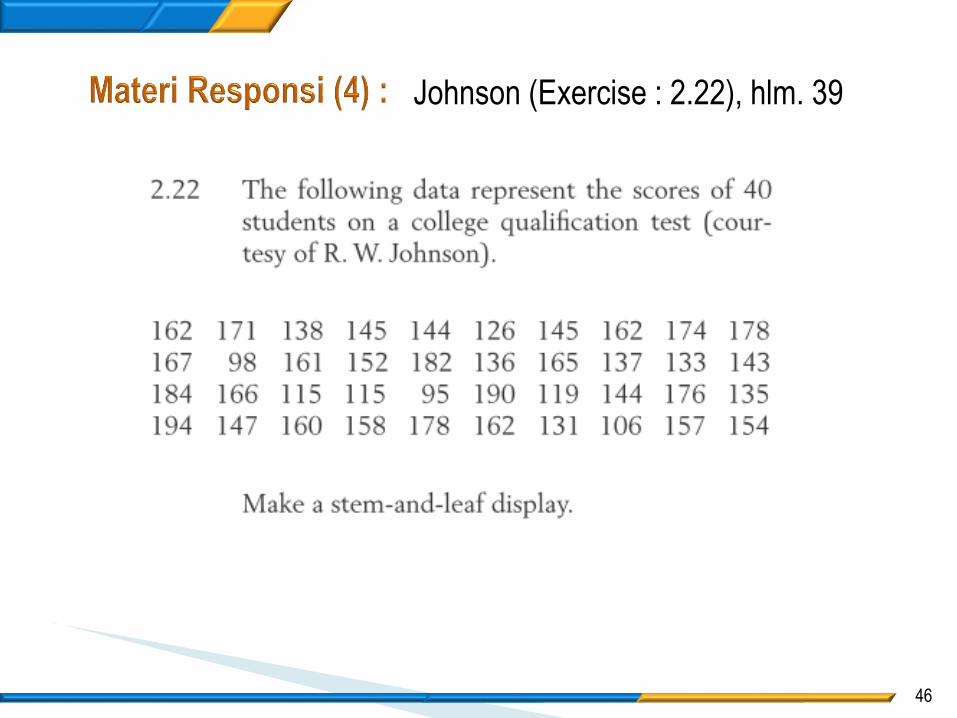
Johnson (Exercise : 2.22), hlm. 39
46

Johnson (Exercise : 2.61), hlm. 57
47

Johnson (Exercise : 2.67), hlm. 57
48

Johnson (Exercise : 2.84), hlm. 59
49

Johnson (Exercise : 2.89), hlm. 59
50

Johnson, R.A. and Bhattacharyya, G.K. 2010.
Statistics, Principles and Methods 6th. John Wiley
& Sons, Inc., New York.
Montgomery, D.C. 2013. Design and Analysis of
Experiments 8th. John Wiley & Sons, Inc.,
Canada.
51

Bisa di-download di
kusmansadik.wordpress.com
52

53