Embed Size (px)
Citation preview

������������� ����
����������������������������������������������������
������������ �
����������� !�"��#����$�%���!"��&�'"����%�"%"
���


Copyright © , by University of Jyväskylä

Dedicated to Tuomas and my family

ABSTRACT
Luostarinen, Sari Annukka Anaerobic on-site wastewater treatment at low temperatures Jyväskylä: University of Jyväskylä, 2005, 83 p. (Jyväskylä Studies in Biological and Environmental Science, ISSN 1456–9701; 158) ISBN 951–39–2274–XYhteenveto: Jätevesien kiinteistö- ja kyläkohtainen anaerobinen käsittely alhaisissa lämpö-tiloissa Diss. Anaerobic treatment stabilises the treated waste(water), and enables production of renewable energy (methane, hydrogen), and preservation of valuable resources (nutrients). Decentralised, on-site application of anaerobic treatment for communities or individual households may thus provide combined waste(water) management, energy production, and nutrient recovery. Two-phased UASB-septic tanks were feasible for treatment of synthetic black water, dairy parlour wastewater, and a mixture of black water and kitchen waste at low temperatures of 10–20 °C with respective removals of total, suspended solids, and dissolved chemical oxygen demand (CODt, CODss, CODdis), and biological oxygen demand (BOD7) being over 90, 98, 70, and over 90 %. In pilot studies with single-phased UASB-septic tanks and more concentrated black water, 65 % of CODt and 70–80 % of CODss were removed, while CODdis removal was negative during 1st-year-operation and improved to over 50 % over time. At lower temperatures, COD removal was more due to settling and accumulation, while at higher temperatures, biological activity increased and more COD was converted to methane, the highest conversion being 44 % (mixture of black water and kitchen waste, 20 °C). Black water from conventional flush toilets may be treated in single-phased UASB-septic tank especially with nitrogen removing post-treatment, while two-phased anaerobic process is recommended for low-temperature treatment of the other studied wastewaters. High removal of suspended solids in phase 1 resulted in sludge bed growth, and sufficient sludge retention time for stabilisation has to be provided. With nutrient removal requirement, post-treatment of anaerobically treated dairy parlour wastewater (10 °C) and mixture of black water and kitchen waste (20 °C) in intermittently aerated moving bed biofilm reactors resulted in 50–60 % nitrogen and 40–70 % CODt removals. Complete nitrification was achieved with 2.0–3.5 mg dissolved oxygen/l and sufficiently long aeration period, while denitrification suffered from carbon shortage. Carbon addition increased nitrogen removal instantly to 83 %, wherefore the anaerobic process should be optimised to retain sufficient carbon for denitrification. The combination of two-phased UASB-septic tank and moving bed biofilm reactor removed over 92 % of CODt, 88 % of CODdis, 99 % of BOD7, 80 % of phosphorous, and 65-70 % of nitrogen at 10-20 °C, thus proving an efficient combination for on-site wastewater treatment. Mixture of kitchen waste and black water also showed potential for fermentative hydrogen production due to readily soluble carbohydrates for hydrogen producers, while synthetic black water seemed less suitable with its high solid/readily soluble organic matter ratio.
Key words: Anaerobic wastewater treatment; black water; dairy parlour wastewater; kitchen waste; low temperature; moving bed biofilm reactor; on-site; UASB-septic tank. S. Luostarinen, University of Jyväskylä, Department of Biological and Environmental Science, P.O. Box 35, FI-40014 University of Jyväskylä, Finland

Author’s address Sari Luostarinen University of Jyväskylä
Department of Biological and Environmental Science P.O. Box 35 FI-40014 University of Jyväskylä, Finland E-mail: [email protected]
Supervisor Professor Jukka Rintala
University of Jyväskylä Department of Biological and Environmental Science P.O. Box 35 FI-40014 University of Jyväskylä, Finland
E-mail: [email protected]
Reviewers Prof., Ph.D. Adrianus van Haandel
Department of Civil Engineering Federal University of Campina Grande Rua Aprígio Veloso 882 BR-58.109-970 Campina Grande, PB, Brazil E-mail: [email protected]
Dr.Tech. Riitta Kettunen Tritonet Ltd. Pinninkatu 53 C FI-33101 Tampere, Finland E-mail: [email protected]
Opponent Prof., Ph.D. Sergey Kalyuzhnyi Department of Chemical Enzymology Chemistry Faculty Moscow State University
Leninskiye Gory 1-11 RU-119992 Moscow, Russia E-mail: [email protected]

CONTENTS
LIST OF ORIGINAL PUBLICATIONS ABBREVIATIONS 1 INTRODUCTION...............................................................................................11
1.1 Anaerobic degradation of organic matter .............................................11 1.1.1 Effect of temperature...................................................................14 1.1.2 Other factors affecting anaerobic degradation ........................14
1.2 Anaerobic wastewater treatment............................................................15 1.2.1 Anaerobic wastewater treatment at low temperatures..........16
1.3 On-site wastewater treatment .................................................................18 1.3.1 Anaerobic on-site wastewater treatment .................................19 1.3.2 UASB-septic tank .........................................................................20 1.3.3 Selected substrates for anaerobic on-site wastewater
treatment ......................................................................................22 1.4 Nitrogen cycle and nitrogen removal from wastewaters....................23
1.4.1 Moving bed biofilm reactor........................................................25 2 OBJECTIVES........................................................................................................27 3 MATERIALS AND METHODS........................................................................28
3.1 Wastewaters and inocula ........................................................................28 3.2 Experimental set-up.................................................................................31
3.2.1 Pilot UASB-septic tanks (I) .........................................................31 3.2.2 Laboratory two-phased UASB-septic tanks (II, III) ................31 3.2.3 Moving bed biofilm reactors (IV) ..............................................32 3.2.4 UASB reactors (V)........................................................................32 3.2.5 Batch assays (II-V)........................................................................32
3.3 Analyses......................................................................................................33
4 RESULTS..............................................................................................................35 4.1 Anaerobic on-site wastewater treatment in UASB-septic tanks........35
4.1.1 COD removal................................................................................35 4.1.2 Sludge beds, BOD7, and nutrients.............................................43 4.1.3 Specific methanogenic activities and stability of reactor sludges ............................................................................44
4.2 Post-treatment of anaerobic effluents in moving bed biofilm reactor ...........................................................................................46
4.3 Acidogenesis and fermentative hydrogen production in UASB reactors............................................................................................50
5 DISCUSSION.......................................................................................................54
5.1 Anaerobic on-site wastewater treatment in UASB-septic tanks........54

5.2 Post-treatment of anaerobic effluents in moving bed biofilm reactors .........................................................................................60
5.3 Acidogenesis and fermentative hydrogen production in UASB reactors ............................................................................................61
5.4 On-site waste(water) treatment using anaerobic technologies ..........63 6 CONCLUSIONS .................................................................................................66 Acknowledgements .........................................................................................................69 YHTEENVETO (Résumé in Finnish) ........................................................................71 REFERENCES...............................................................................................................74

LIST OF ORIGINAL PUBLICATIONS
This thesis is a summary and discussion of the following articles and manuscripts, which are referred to by their Roman numerals I - V in the text. I planned the experiments with my supervisor and performed the majority of the work described in each article. I have also written the first drafts of all articles, which were then completed in co-operation with my supervisor. I Luostarinen, S., Sanders, W., Kujawa-Roeleveld, K. & Zeeman, G. Effect of
temperature on anaerobic treatment of black water in UASB-septic tank systems. Submitted.
II Luostarinen, S.A. & Rintala, J.A. 2005. Anaerobic on-site treatment of black
water and dairy parlour wastewater in UASB-septic tanks at low temperatures. Water Research, 39: 436-448.
III Luostarinen, S. & Rintala, J. Anaerobic on-site treatment of kitchen waste
in combination with black water in UASB-septic tanks at low temperatures. Submitted.
IV Luostarinen, S., Luste, S., Valentín, L. & Rintala, J. Nitrogen removal from
on-site treated anaerobic effluents using intermittently aerated moving bed biofilm reactors at low temperatures. Submitted.
V Luostarinen, S., Ronkainen, O. & Rintala, J. Screening for potential of
fermentative hydrogen production from black water and kitchen waste in on-site UASB reactors at 20°C. Manuscript.

ABBREVIATIONS
BOD7 7-day-biological oxygen demand BW black water BWKW mixture of black water and kitchen waste CODcol colloidal chemical oxygen demand CODdis dissolved chemical oxygen demand CODss suspended solids chemical oxygen demand CODt total chemical oxygen demand DO dissolved oxygen DPWW dairy parlour wastewater EGSB expanded granular sludge bed GHG greenhouse gas HRT hydraulic retention time KW kitchen waste LCFA low chain fatty acids MBBR moving bed biofilm reactor NLR nitrogen loading rate Ntot total nitrogen OLR organic loading rate Ptot total phosphorous SBR sequencing batch reactor SHA specific hydrogenogenic activity SMA specific methanogenic activity TON total oxidised nitrogen (nitrate + nitrite) TS total solids TS-fix attached total solids TSS total suspended solids VFA volatile fatty acids UASB upflow anaerobic sludge blanket VS volatile solids VSS volatile suspended solids

1 INTRODUCTION
Thus far, organic wastes and wastewaters have been treated mostly due to pollution control, while in the future, they may act as valuable resources (Angenent et al. 2004). Biological anaerobic waste(water) treatment is able to stabilise the treated waste(water)s, to produce renewable energy (methane, hydrogen), and to preserve resources, such as nutrients, of which the world may be lacking before long. With decentralised treatment, the need for transportation can further be minimised. Anaerobic decentralised treatment may thus provide waste management, nutrient recovery, and renewable energy in a combined system.
1.1 Anaerobic degradation of organic matter
Anaerobic degradation of organic matter occurs in natural ecosystems, such as swamps, soils, sediments, and digestive systems of ruminant animals (Madigan et al. 1997). Similar degradation can also be utilised in anaerobic treatment (digestion) of organic wastes and wastewaters, thus reducing their organic matter content. Anaerobic degradation of organic matter is a balance between the activities of different groups of micro-organisms and occurs as a sequence of four steps: hydrolysis, acidogenesis, acetogenesis, and methanogenesis (Gujer & Zehnder 1983; Fig. 1). During hydrolysis, hydrolytic micro-organisms produce extracellular enzymes which degrade complex organic compounds into their monomeric and dimeric components, i.e. proteins into amino acids, carbohydrates into simple sugars, and lipids into long chain fatty acids (LCFA). Acidogenic bacteria then degrade these components further into volatile fatty acids (VFA), such as acetic, propionic, butyric, and valeric acids, and alcohols. During acetogenesis, these intermediary compounds are converted to acetic acid, hydrogen, and carbon dioxide, from which methanogenic bacteria

12
produce methane and carbon dioxide as end products (Mata-Alvarez 2002; Gerardi 2003).
100 % COD
Anaerobic Oxidation
Acetogenesis
70 % 30 %
?
11 % 23 %
11 % 8 % 12 %
20 %
35 %
34 %
-0 %
34 %
20 %
66 %
100 % COD Particulate Organic Matter
Proteins Carbohydrates
Amino acids, Simple sugars
21 % Hydrolysis 40 %
5 %
34 %
39 %
Fatty acids, Alcohols
Intermediary products (propionate, butyrate, etc.)
Acidogenesis
Acetate Hydrogen
Methane
Methanogenesis
Homoacetogenesis
Acetoclastic methanogenesis
Reductive methanogenesis
Lipids
FIGURE 1 Anaerobic degradation of organic matter (redrawn after Gujer & Zehnder
1983).
When treating waste materials containing particulate organic matter, hydrolysis is usually the first step required for the chain of degradation to proceed. Particulate matter is degraded by hydrolytic bacteria excreting extracellular enzymes responsible for converting complex particulate substrates into simpler, dissolved compounds, which in turn are readily available for uptake into the cells of acidogenic bacteria (Mata-Alvarez 2002). Hydrolysis is therefore often considered the rate-limiting step for anaerobic digestion, and it is affected by availability of hydrolytic enzymes, availability and structure of substrate (spherical, flat, or cylindrical; Sanders et al. 2000), pH, temperature, as well as short sludge retention time (SRT) and subsequent accumulation of acidic intermediates (Pavlostathis & Giraldo-Gomez 1991; Sanders 2001).
During acidogenesis, a group of different micro-organisms convert hydrolysis products into VFA and alcohols (Pavlostathis & Giraldo-Gomez 1991; Mata-Alvarez 2002; Gerardi 2003). The end products depend on digestion conditions, organic substrate, and bacterial activity. Sugars are readily converted into VFA, while degradation of amino acids also yields to ammonium nitrogen (NH4+) thus increasing the ammonium concentration of

13
the digested end product. This may be noteworthy especially at high temperature (e.g. thermophilic processes at 50-55 °C) and alkaline pH, as large part of ammonium is then present as its unionised form, ammonia (NH3), which is toxic and inhibitive (Angelidaki & Ahring 1993; Hansen et al. 1998). LCFA formed from lipids during hydrolysis are further degraded via β-oxidation to acetate or propionate by acidogenic bacteria (Mackie et al. 1991). To ensure favourable thermodynamic conditions for this, hydrogen partial pressure needs to be low in the digestion system (Pavlostathis & Giraldo-Gomez 1991; Mata-Alvarez 2002). Usually methanogens consume hydrogen immediately as it is produced, but in case high concentrations of LCFA and VFA are produced, pH decreases inhibiting methanogenic activity. Thus, hydrogen partial pressure increases inhibiting also LCFA degradation to acetate, an intermediate readily available for methanogens (Mackie et al. 1991). Propionate and other VFA will then be produced in excess (acidification), which can either deteriorate an anaerobic process completely or be eventually overcome by decrease or temporary stop of feeding to allow VFA concentration to decrease and methanogens to grow.
Acetogenic bacteria convert VFA further to acetate, hydrogen, and carbon dioxide, and these conversions also depend on low hydrogen partial pressure and close location of hydrogen producing and consuming bacteria (Dolfing 1988; Mata-Alvarez 2002). Finally, methanogenic bacteria (Methanosaeta spp., Methanosarcina spp.) convert the products of acetogenesis to methane and carbon dioxide (=biogas). Approximately 70 % of methane is usually derived from acetate by acetoclastic methanogens and 30 % from hydrogen and carbon dioxide by hydrogenotrophic methanogens. Other possible substrates for methanogens are methylated amines, formate, and methanol (Oremland 1988; Gerardi 2003).
Instead of methane, the preferred end product may also be fermentative hydrogen as a source of renewable energy. On the other hand, hydrogenogenic and methanogenic stages can be coupled with acido- and acetogenesis and hydrogen production in the first stage and subsequent methane production and waste(water) stabilisation in the second stage. Hydrogen is produced during acido- and acetogenesis by facultative anaerobes and obligate anaerobes (Nandi & Sengupta 1998; de Vrije & Claassen 2003), such as heat-resistant, spore-forming Clostridia (also Enterobacteria and Streptococci; Fang et al. 2002; de Vrije & Claassen 2003). However, as shown in Fig. 1, hydrogen is usually instantly consumed in methanogenesis (to methane) or homoacetogenesis (to acetate). If hydrogen is to be used for energy production, this consumption needs to be prevented by e.g. pre-treatment of inoculum sludge with e.g. heating (Logan et al. 2002; Chang & Lin 2004; van Ginkel et al. 2005) or acid addition (Chang et al. 2002; Wu et al. 2003; Lee et al. 2004), or with operational parameters, such as short operational HRT and low pH (Hawkes et al. 2002).

14
1.1.1 Effect of temperature
Temperature has a considerable effect on anaerobic degradation of organic matter with influence on the growth and survival of micro-organisms. When temperature decreases, chemical and enzymatic reactions as well as growth slow down with complete cease of growth at the lowest temperature possible for survival. Minimum growth temperature is probably met when cell membrane loses its proper functioning with subsequent disturbances in uptake and excretion of compounds. On the other hand, as temperature rises, chemical and enzymatic reactions as well as growth are accelerated up to the temperature optimum, above which proteins, nucleic acids, and other cellular components may be irreversibly damaged. Thus, temperature rise within the optimal range is beneficial to anaerobic degradation of organic matter, but becomes damaging at temperatures above optimum (Madigan et al. 1997).
Micro-organisms are classified into different temperature classes according to their temperature optima. Psychrophilic bacteria are abundant at 0–20 °C, mesophilic at approximately 30–40 °C, and thermophilic at over 55 °C (Madigan et al. 1997). Methanogens are also temperature sensitive and depending on the temperature of an anaerobic digestion process, different methanogens prevail. Most of the anaerobic digestion systems are mesophilic, while psychrophilic operation has been considered difficult due to the slower degradation rates and long hydraulic and sludge retention times (HRT, SRT) needed (Lettinga et al. 2001). Still, low-temperature anaerobic wastewater treatment has gained renewed attention, especially on areas with low seasonal ambient temperatures (e.g. Bogte et al. 1993; Viraraghavan & Varadarajan 1996; Dague et al. 1998; Kettunen & Rintala 1997, 1998; Lettinga et al. 1999; Zeeman & Lettinga 1999; Langenhoff & Stuckey 2000; Uemura & Harada 2000; Kalyuzhnyi et al. 2001, 2003; Lettinga et al. 2001; Zeeman et al. 2001; Elmitwalli et al. 2003; Singh & Viraraghavan 2003). Real psychrophilic bacteria isolated e.g. from deep lake sediments (Nozhevnikova et al. 1997, 2004) and Antarctic sea ice (Franzmann et al. 1997) are adapted to constant low temperature (temperature optima below 15 °C, maximum growth temperature below 20 °C, minimum growth temperature 0 °C or below; Madigan et al. 1997). However, on areas, where seasonal temperature varies, psychrotolerant bacteria instead of real psychrophiles are found. Psychrotolerant bacteria are able to grow slowly at 0 °C but have a temperature optimum between 20 and 40 °C (Madigan et al. 1997). Also psychrotolerant methanogens have been isolated (Simankova et al. 2003).
1.1.2 Other factors affecting anaerobic degradation
pH affects microbial conversions directly through the micro-organisms, which all have their specific pH optima (e.g. around 6.0 with hydrolytic bacteria; Sleat & Mah 1987; 6.0–8.0 with methanogenic bacteria; Oremland 1988). Effects may also be indirect with changes in chemical equilibrium of the system related to e.g. toxicity of ammonia and VFA, availability of nutrients and substrate

15
ingredients (precipitation of e.g. proteins), and availability of carbon dioxide. To maintain pH in the optimal range, sufficient buffering capacity, i.e. alkalinity is needed. With high enough alkalinity, e.g. high VFA concentrations can be tolerated without acidification of the anaerobic system. Buffering capacity can be increased with addition of bicarbonates (e.g. NaHCO3) or compounds reacting with carbon dioxide and thus producing bicarbonates (e.g. NaOH, Ca(OH)2).
Some compounds may cause inhibition of anaerobic degradation. E.g. oxygen is toxic to methanogens already at low concentration. Other inhibitors to methanogenesis include alternate electron acceptors (nitrate, sulphate), 2-bromoethanesulphonic acid (BES), chlorinated methanes, and compounds with unsaturated carbon-carbon bonds, such as acetylene (Oremland 1988).
As stated earlier, low hydrogen partial pressure is vital for acido- and acetogenesis and subsequently also for methanogenesis (McInerney 1988; Pavlostathis & Giraldo-Gomez 1991). Therefore, fermentative hydrogen production is also inhibited by the end product itself. High hydrogen partial pressure in liquid phase decreases hydrogen production and shifts metabolism towards production of lactate and alcohols instead of acetate (de Vrije & Claassen 2003). At higher temperatures, this dependence on hydrogen partial pressure is, however, alleviated (Levin et al. 2004). Other factors affecting fermentative hydrogen production are pH and HRT, and increasing study efforts are made to optimise them. It seems, however, that they both need to be optimised for each reactor set-up, substrate, and inoculum separately (Fang & Liu 2002; Hawkes et al. 2002). In principle though, HRT should be short and pH low to prevent growth of hydrogen consuming bacteria.
1.2 Anaerobic wastewater treatment
Anaerobic digestion is one of the oldest treatment methods applied for domestic wastewaters. Traditional septic tank dates back to 1860s (Mouras′ Automatic Scavenger; McCarty 2001) and is often used even today. It was further developed and patented in England in 1895. A similar system was also developed in 1894 and 1897 in the USA (McCarty 2001). In the following years, attention to methane collection and separate sludge treatment were established with different technical applications. In 1904, a two-phased process with separate chambers for liquid and solid fractions was studied in the USA, and it was further refined for Imhoff tank, which improved sludge treatment significantly (McCarty 2001). Septic tank combines settling and digestion of settled solids, though the process is often deemed inefficient especially with respect to sludge stability. In the 1970s, a new concept of high-rate anaerobic processes was established (e.g. Lettinga et al. 1980). This upflow anaerobic sludge blanket (UASB), efficient in immobilisation of active sludge through granulation, is now applied all over the world and has since evolved into other reactor set-ups, such as expanded granular sludge bed (EGSB; reviewed by

16
Seghezzo et al. 1998). Despite this, anaerobic wastewater treatment is still restricted largely to industrial wastewaters and most of domestic wastewater (sewage) is treated aerobically. In tropical countries, however, interest in anaerobic treatment of sewage has increased due to cost-efficiency of anaerobic treatment and suitable climatic conditions, and e.g. in Brazil, Mexico, China, Colombia, and India several plants are in operation (van Haandel & Lettinga 1994; Monroy et al. 2000; Aiyuk et al. 2005).
Anaerobic wastewater treatment is considered sustainable (e.g. Lettinga 1996; Hammes et al. 2000) and has several advantages over aerobic treatment technologies. It consumes little energy as no aeration is needed and produces renewable energy in the form of hydrogen or methane. Importantly, it also produces little sludge (up to 10 times less than aerobic processes), which is stabilised and can be preserved unfed for long periods without losing its biological activity. Anaerobic processes are efficient at removing organic matter and endure high loading rates, which also reduces its space requirement. The processes are relatively simple and can be applied at small and large scale. Moreover, pH adjustment and nutrient addition are rarely needed (Lettinga 1996; Seghezzo et al. 1998; Zeeman & Lettinga 1999; Hammes et al. 2000).
Disadvantages of anaerobic wastewater treatment have earlier been reported as long start-up due to low growth rate of methanogens and difficulties with low temperatures, both of which have been solved with increasing amount of anaerobic treatment plants and subsequent easy access to inoculum sludge and with increasing knowledge of low-temperature treatment (Seghezzo et al. 1998; Lettinga 1996). Malodours may be emitted from anaerobic digesters due to formation of hydrogen sulphide (Widdel 1988), but they can be reduced with proper gas treatment and closed systems. Anaerobic wastewater treatment has limited ability to remove pathogens and may need separate post-treatment. The situation is similar with nutrients, which are only partially removed. A relatively simple post-treatment is, however, usually sufficient to reach discharge requirements (Seghezzo et al. 1998) or the anaerobic effluents can be used directly as organic fertilisers and irrigation, in which case no post-treatment is required (Lens et al. 2001).
1.2.1 Anaerobic wastewater treatment at low temperatures
Many wastewaters are discharged at low ambient temperatures. Heating them for mesophilic or thermophilic treatment is energy intensive and costly, wherefore psychrophilic wastewater treatment is desirable. However, low temperature needs to be taken into account in design and operation of treatment systems as it changes many properties in the treatment process. Solubility of gases increases with decreasing temperature, leaving more methane into effluent than at higher temperatures. Moreover, higher solubility of carbon dioxide may lower the pH. Liquid viscosity is also increased at low temperatures, wherefore mixing requires more energy, and particles settle more slowly due to decreased liquid-solid separation (Lettinga et al. 2001).

17
Retention of viable sludge is vital to low-temperature anaerobic wastewater treatment, wherefore processes with uncoupled HRT and SRT are needed (e.g. UASB, EGSB). The inoculum should also be of high quality and suitable for adaptation to sub-optimal conditions in case mesophilic or thermophilic sludge is used. Moreover, sufficient mixing should be provided to ensure good contact between sludge and wastewater, and the wastewater should be suitable for anaerobic treatment (Lettinga et al. 2001). Mixing also alleviates problems with gas pockets in the sludge bed and subsequent lift-up of large sludge aggregates or pulse-like eruption of gas (Mahmoud et al. 2003). Multi-phased processes may improve treatment results for low-temperature conditions, for different stages of degradation can be uncoupled e.g. to hydrolytic and acidogenic stage and to methanogenic stage (Lettinga et al. 1999, 2001). In this case, particulate matter can be accumulated and eventually hydrolysed in phase 1, while phase 2 converts the produced soluble matter to methane.
Many industrial wastewaters, such as malting wastewater, contain mostly dissolved organic matter and can be best treated in EGSB reactors at low temperatures (Rebac et al. 1997). Domestic sewage, however, is a complex wastewater containing a high fraction of suspended solids. They need to be removed by settling, adsorption, or entrapment in sludge bed, depending on the process applied, and their hydrolysis has to be ensured with long SRT. According to Miron et al. (2000), SRT of 15 d is sufficient for hydrolysis and methanogenesis at 25 °C, whereas at 15 °C, SRT of 75 d is required, subsequently also lengthening HRT (Zeeman & Lettinga, 1999). In case granular sludge is used, suspended solids need to be removed prior to anaerobic treatment, or the system may deteriorate completely (Zeeman & Lettinga 1999; Uemura & Harada 2000; Elmitwalli et al. 2001). With flocculent sludge, however, they can be fed to the anaerobic process, provided sufficient SRT is applied (Zeeman & Lettinga 1999). Examples of earlier studies with anaerobic sewage treatment at low temperatures are given in Table 1.

18
TABLE 1 Anaerobic treatment of sewage at low temperatures (<20 °C).
Reactor CODt (g/l)
Temp (°C)
HRT (h)
OLR (kgCOD/m3d)
CODt removal
(%)
Reference
UASB 0.19–1.18
12–20 7–8 0.6–3.5 30–75 de Man et al. 1986
UASB+EGSB 0.32–0.51
8–13 5 1.6–2.5 45–57 Wang 1994
UASB+UASB 0.2–0.7 18–20 10 0.48–1.7 75 Sayed & Fergala 1995
UASB+UASB 0.2–0.7 18–20 6 0.8–2.8 84 Sayed & Fergala 1995
UASB 0.35–0.5 20 10 0.84–1.2 60–75 Singh & Viraraghavan 1998
UASB 0.15–0.6 13–25 4.7 0.8–3.1 64–70 Uemura & Harada 2000
AF+AH 0.46–0.53
13 12 0.9–1.1 70 Elmitwalli et al. 2001
ABFR 0.22–0.51
4.5–23 15 0.35–0.82 79–83 Bodík et al. 2002
AF = anaerobic filter; AH = anaerobic hybrid reactor; ABFR = anaerobic baffled filter reactor
1.3 On-site wastewater treatment
Wastewaters are usually transported to centralised treatment plants through extended sewage networks. This has improved environmental conditions in many places but may still not be the most sustainable way to deal with wastewaters. In fact, large volume of potable water is needed to dilute the wastewater and to ensure its transportation to the treatment plant. Moreover, wastewater temperature decreases during transportation in the extended sewage and thus decreases the treatment temperature. Combination of wastewaters from various origins may further make the treatment complicated and result in hazardous compounds in produced sludge making its reuse difficult or impossible. Centralised treatment plants and sewage networks are also expensive to build, operate, and maintain. The facilities are also vulnerable to natural catastrophes, wars, and terrorism, and their failure due to any reason may cause severe problems to the society (van Lier & Lettinga 1999; Zeeman & Lettinga 1999; Wilderer & Schreff 2000; Lens et al. 2001).
Therefore, decentralised wastewater treatment, i.e. community- or house-on-site treatment, may be more sustainable in spite the larger amount of treatment processes required. Many large industrial facilities use internal water recycling through their own, specific wastewater treatment plants and subsequent reuse of treated water in the facility. Decentralised sanitation bears

19
more or less the same idea with possible separation of wastewater streams, treatment close-by or on-site, and subsequent possibility to reuse the treated water for fertilising and irrigating gardens and fields or e.g. reuse as toilet flushing water. Moreover, produced sludge can also be utilised as fertiliser and soil improver, if local legislation permits land application. Separation of more diluted wastewaters from more concentrated ones adds to the possibility of water recycling. Moreover, consumption of potable water can be minimised, simple and low-cost processes suffice, and different scales are applicable (van Lier & Lettinga 1999).
On-site wastewater treatment is currently applied and needed all over the world due to e.g. long distances, difficult geographical conditions, and high cost of sewerage and large treatment plants. In Finland, 20 % of population (approximately 1 million people; Kaarikivi-Laine 2003) lives on rural areas outside centralised sewerage and treatment plants, and during summer months the amount doubles due to summer settlements. Therefore, on-site treatment is traditionally used and accepted. In the beginning of 2004, new legislation concerning wastewater treatment on these areas was implemented with more stringent requirements for quality of discharged effluents (Government Decree 542/2003). Within ten year period (by 2014), old housing have to update their wastewater treatment processes to remove minimum 90 % of biological oxygen demand (BOD7), minimum 85 % of phosphorous, and minimum 40 % of nitrogen. The requirements apply immediately to new housing. All domestic wastewater streams as well as wastewaters from small scale industries without separate environmental licence, such as dairy farms, are included into the legislation. As a result of the new legislation, many communities are planning and building community-on-site treatment plants and individual houses are improving their house-on-site processes. As the population density in Finland is low, most of the updated and built processes will be house-on-site solutions.
Solid, organic kitchen waste also requires stabilisation before disposal or reuse. E.g. in European Union landfilling untreated biodegradable waste has been forbidden since the beginning of 2005 (EU Council Directive on the Landfill of Waste 1999/31/EC). Kitchen waste is highly biodegradable (>90 %; Veeken & Hamelers 1999) and its uncontrolled degradation leads to greenhouse gas (GHG) emissions, while with biological treatment, it can be stabilised in a controlled manner with useful end product for fertilising and soil improvement, provided its land application is permitted. With on-site treatment of kitchen waste, the organic waste fraction is kept pure and easily degradable as opposed to impurities in organic fraction of municipal solid waste treated in large centralised plants (Kujawa-Roeleveld 2001). Further, with on-site treatment, transportation can be minimised.
1.3.1 Anaerobic on-site wastewater treatment
Anaerobic on-site wastewater treatment is considered sustainable with its simple, thus cost-effective reactor design, small space requirement, low sludge production, low energy and nutrient demand, potential for energy production,

20
high loading capacity, efficient removal of organic matter, possibility for nutrient recycling, and suitability for e.g. camping sites and summer houses with tolerance for pauses in feeding (van Lier & Lettinga 1999). The produced biogas is collected and utilised as renewable energy (heat, electricity, or vehicle fuel) when sufficient volumes are produced. In case the produced volume is low, the gas should at least be burned, as methane is a strong GHG (21 times stronger than carbon dioxide; IPCC 1996). In case nutrient removal is required, post-treatment with other simple and cost-effective processes can be applied. Possible options include e.g. sand filter, soil infiltration, aerobic pond, membrane process, and sequencing batch reactor (SBR).
Kitchen waste is often home composted on-site, but with little maintenance this results in poor degradation and malodours. Moreover, ammonia is lost through evaporation thus decreasing the fertilising value of the end product, and no energy can be recovered. Anaerobic treatment, on the other hand, enables controlled degradation in closed systems and energy recovery as hydrogen and/or methane, and increases fertilising value of the end product due to ammonification of organic nitrogen. Treatment of kitchen waste and wastewaters from individual households can be combined thus reducing treatment systems into one for all organic waste(water) streams. When considering waste management of individual households, anaerobic treatment thus enables waste stabilisation, energy production, and nutrient reuse in a single process, though legislative support is required.
Simple and easy-to-use anaerobic processes suitable for on-site treatment are septic tank, UASB-septic tank, and accumulation system. Accumulation system collects and stores wastewaters as such for a certain period of time with active anaerobic sludge degrading organic matter during the storage period. In the end, the system is emptied and only some seed sludge is left to inoculate the new collection and storage period. The wastewater treated in accumulation system has to be very concentrated, which can be achieved e.g. with vacuum toilets or night soil collection and addition of kitchen waste (Kujawa-Roeleveld et al. 2003; Elmitwalli et al. 2005).
Septic tank is probably the oldest anaerobic treatment system and is still applied today (McCarty 2001). Wastewater flows slowly and horizontally through the septic tank with solid material settling or floating and being thus accumulated into the reactor. The settled sludge is biologically active providing thus partial stabilisation of accumulated solids. However, nearly all dissolved organic material escapes the system with effluent (Metcalf & Eddy 1991), wherefore addition of kitchen waste into septic tanks is not recommended. UASB-septic tank is discussed in detail next.
1.3.2 UASB-septic tank
UASB-septic tank is a modified version of conventional septic tank (Fig. 2; Bogte et al. 1993; Lettinga et al. 1993; Zeeman & Lettinga 1999; Zeeman et al. 2001; Kujawa-Roeleveld et al. 2005). It is operated in an upflow mode (hence UASB) as opposed to horizontally flowing septic tank. The upflow mode
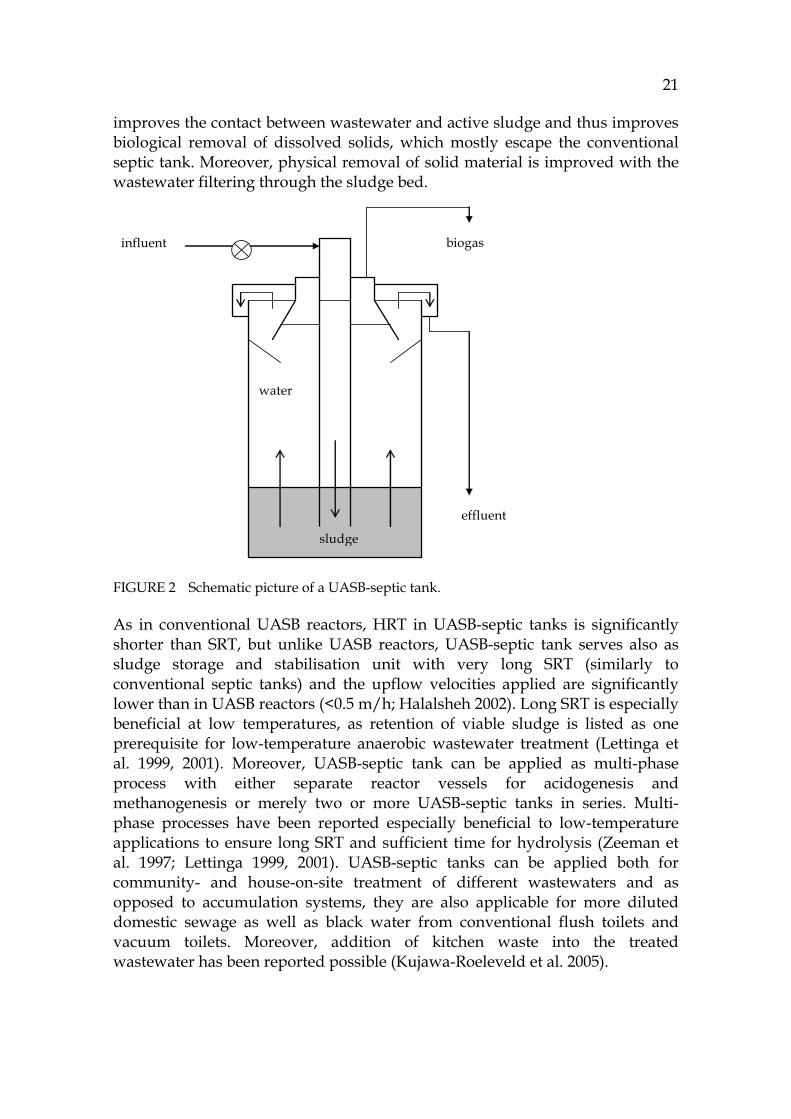
21
improves the contact between wastewater and active sludge and thus improves biological removal of dissolved solids, which mostly escape the conventional septic tank. Moreover, physical removal of solid material is improved with the wastewater filtering through the sludge bed.
water
sludge
effluent
biogas influent
FIGURE 2 Schematic picture of a UASB-septic tank.
As in conventional UASB reactors, HRT in UASB-septic tanks is significantly shorter than SRT, but unlike UASB reactors, UASB-septic tank serves also as sludge storage and stabilisation unit with very long SRT (similarly to conventional septic tanks) and the upflow velocities applied are significantly lower than in UASB reactors (<0.5 m/h; Halalsheh 2002). Long SRT is especially beneficial at low temperatures, as retention of viable sludge is listed as one prerequisite for low-temperature anaerobic wastewater treatment (Lettinga et al. 1999, 2001). Moreover, UASB-septic tank can be applied as multi-phase process with either separate reactor vessels for acidogenesis and methanogenesis or merely two or more UASB-septic tanks in series. Multi-phase processes have been reported especially beneficial to low-temperature applications to ensure long SRT and sufficient time for hydrolysis (Zeeman et al. 1997; Lettinga 1999, 2001). UASB-septic tanks can be applied both for community- and house-on-site treatment of different wastewaters and as opposed to accumulation systems, they are also applicable for more diluted domestic sewage as well as black water from conventional flush toilets and vacuum toilets. Moreover, addition of kitchen waste into the treated wastewater has been reported possible (Kujawa-Roeleveld et al. 2005).

22
1.3.3 Selected substrates for anaerobic on-site wastewater treatment
Domestic sewage is a mix of pollutants and the water into which it has been mixed. Its characteristics differ in time and place due to variation in the discharged amounts of substances and in water consumption of households (Henze & Ledin 2001). In countries with water scarcity, such as Jordan, domestic sewage is rather concentrated (total chemical oxygen demand, CODt approx. 1.5–2.0 g/l; Halalsheh 2002), while in many Western countries it is more diluted due to higher water consumption (0.2–0.7 gCODt/l; Henze & Ledin 2001). Domestic sewage can be divided into separate streams according to their origin. Black water from toilets contains faeces, urine, toilet paper, and flushing water and is the most concentrated wastewater stream from households containing most of organic matter, nitrogen, and phosphorous produced. Its concentration depends on the volume of flushing water which again depends on the toilet used. With traditional flush toilets, flush volume is 4–10 l depending on the age of the toilet seat, while with vacuum toilets, flush volume of approximately 1 l is used. Moreover, depending on the toilet system, urine and faeces can further be separated. Another traditionally separated wastewater stream is grey water from kitchen, wash, and bath. It contains relatively little organic matter and nitrogen, but some phosphorous in case detergents with phosphates are used.
Solid kitchen waste is sorted in individual households and thus easily kept pure from impurities, such as plastics and metals. It may also contain some plant material from garden or houseplants. Kitchen waste comprises of all organic matter from food preparation (fruit peels, coffee grounds, tea bags, egg shells, etc.) to leftovers (Kujawa-Roeleveld 2001). It is highly biodegradable (>90 %, Veeken & Hamelers 1999) with high volatile (VS) to total solids (TS) ratio (Kujawa-Roeleveld 2001). On-site collected and treated kitchen waste can most likely be freely reused in gardens and fields as fertiliser and soil improver, as many problems associated with end-products from centralised treatment of organic waste, such as high heavy metal contents (Veeken 1998) can be avoided.
Dairy parlour wastewater is produced on dairy farms during wash of milking machine, related tubes, and milk containers. The produced volume and characteristics depend on wash procedure, detergents, cattle size, and volume of water used. According to a Finnish study, a farm with 10-20 cows consumes daily approximately 300 l of water, while with 30 cows and more, water consumption increases to 600 l/d (Valio Ltd. 1998). Dairy parlour wastewater contains significant amounts of milk, and thus proteins and fats, similarly to wastewaters from dairy industry. Such organic matter is easily biodegradable with a range of 230–1700 mg BOD7/l on Finnish dairy farms (Kallio & Santala 2002). Phosphorous (20–120 mg/l; Kallio & Santala 2002) originates usually from detergents and can be reduced by choosing detergents without phosphates, while nitrogen (15–80 mg/l; Kallio & Santala 2002) is from milk residues and nitric acid containing detergents. Chlorine is often used as disinfectant and nearly all detergents contain some chlorine compounds. pH of dairy parlour wastewater depends on the wash procedure, and with the usual

23
combination of alternating alkaline (detergent pH approx. 12) and acid (detergent pH 1.5–2.5) wash, pH differs significantly between washing periods (Kallio & Santala 2002). Such extreme pH values are not suitable for biological treatment, wherefore equalisation unit or neutralisation is required prior to treatment.
Wastewater temperature varies in time and place. E.g. in Mexico, temperature of domestic sewage is 18–30 °C throughout the year (Monroy et al. 2000), while in Finland, it is usually minimum 5 °C in the winter and maximum 18 °C in the summer in centralised sewage and treatment systems (Heiska 2002). Sewage temperature decreases during transportation to treatment via long sewage systems. In decentralised treatment, however, wastewaters are transported only short distances and the original temperature can easily be preserved. This is an advantage e.g. with dairy parlour wastewater, which is collected warm (e.g. 40–80 °C in the dairy parlour wastewater used in this study).
1.4 Nitrogen cycle and nitrogen removal from wastewaters
Nitrogen is recycled in nature almost exclusively by micro-organisms (Fig. 3). Nitrogen gas (N2) is the most stable form of nitrogen, wherefore atmosphere is a major reservoir of nitrogen on Earth. Reduction of nitrogen gas, called nitrogen fixation, is only possible for a limited number of organisms, and 85 % of nitrogen fixed is of biological origin. Due to this limited fixation ability, most of recycled nitrogen on Earth is accomplished with more easily available compounds, such as ammonia (NH3) and nitrate (NO3-; Madigan et al. 1997). Ammonia is produced during degradation of organic nitrogen compounds (ammonification) and exists at neutral pH as ammonium ion (NH4+). In anaerobic or anoxic conditions, ammonia is stable, though susceptible to volatilisation. In the presence of oxygen, however, ammonia can be oxidised to nitrogen oxides, nitrite (NO2-) or nitrate, by nitrifying bacteria in nitrification. Nitrate is readily available for plants in soils similarly as ammonia, but is easily leached due to its high water-solubility. Ammonia, on the other hand, is cationic and adsorbs strongly to negatively charged soil particles (Madigan et al. 1997). Oxidised nitrogen compounds are converted to nitrogen gas or to nitrous oxide (N2O) in denitrification. In natural environments, denitrification decreases readily available nitrogen concentration being thus a detrimental process (Madigan et al. 1997). However, with waste and wastewater treatment, denitrification may act as the final step of nitrogen removal.

24
Pseudomonas, Bacillus and other facultative bacteria
Nitrification
NO2-
NO3-
NO2-
NO, N2O N2
NH3
N2
Nitrogen fixation
Oxic Assimilation
NH2 groups of protein
Assimilation
Deamination
Nitrobacter
Clostridium pasteurianum Anoxygenic phototrophic bacteria
Cyanobacteria Rhizobium Azotobacter Beijerinckia
Nitrosomonas
Deamination
Assimilation
NH2 groups of protein
Anoxic
Denitrification
FIGURE 3 Nitrogen cycle (redrawn after Madigan et al. 1997).
Nitrification takes place in two steps as ammonium nitrogen is first oxidised to nitrite by a group of bacteria called Nitrosomonas and nitrite is then further oxidised to nitrate by another bacterial group called Nitrobacter. Nitrifying bacteria have low growth rates due to low energy yield from ammonium oxidation, which can be a problem when removing nitrogen from wastewaters. Nitrifying bacteria usually use carbon dioxide as their carbon source and reduce alkalinity by 2 alkalinity equivalents per mole of ammonium oxidised (Henze 1997), i.e. 8.64 mg HCO3- per one mg of ammonia-nitrogen oxidised (Metcalf & Eddy 1991). Thus, low pH and alkalinity inhibit nitrification. Optimum pH has been reported to be 7.5–8.6, though nitrification at lower pH has also been reported (Metcalf & Eddy 1991) Also, temperature affects nitrification by slowing it down with decreasing temperature, while the optimum temperature is 30–35 °C (Henze 1997). Sudden temperature decrease from 20, 25, and 30 °C to 10 °C is reported to decrease nitrification rates with 58–82 % (Head & Oleszkiewicz 2004), but when the decrease is slow, nitrification can adapt to significantly lower temperatures than the optimum. Nitrification of different wastewaters has been shown feasible e.g. with landfill leachate at 10, 7, and 5 °C (Hoilijoki et al. 2000) and at 5–20 °C (Welander et al. 1997), and with municipal wastewater at 7 °C (Canler et al. 2003). As an aerobic process, nitrification is dependent on sufficient oxygen concentration (above 1 mg/l; Metcalf & Eddy 1991; minimum 2 mg/l; Surampalli et al. 1997). Inhibiting substrates include e.g. high concentrations of free ammonia, metals, sulphur, and phenols (Henze 1997).

25
During denitrification, oxidised nitrogen is converted to nitrogen gas. Denitrifying micro-organisms form a diverse group of facultative bacteria, which prefer oxygen as oxidising agent when it is present. Thus, to ensure denitrification, the conditions have to be anaerobic or at least anoxic. Intermediate products of denitrification, i.e. nitrite, nitric oxide (DO), and nitrous oxide are toxic and inhibitive, thus also unwanted in a wastewater treatment system (Henze 1997). Moreover, nitrous oxide is a strong GHG (310 times stronger than carbon dioxide; IPCC 1996). As opposed to alkalinity consuming nitrification, denitrification produces alkalinity by one equivalent per mole of nitrate converted (Henze 1997) and optimum pH is 7.0–8.0 with different optima for different bacteria (Metcalf & Eddy 1991). Denitrification can proceed efficiently also at lower pH, but at pH <7.0, the end product shifts towards undesirable nitric oxides (Henze 1997). Denitrifying bacteria use a variety of carbon sources for energy, such as acetone, methane, methanol, acetate, and ethanol. In a waste or wastewater treatment system, carbon usually derives from internal sources, i.e. organic matter in the treated substrate. In case external carbon is needed to enhance denitrification, methanol and acetate are usually used due to them being readily available for denitrifying bacteria. If the organic matter in the treated substrate is mostly solid, Minimum COD/N ratios for denitrification of different wastewaters have been reported to be 3–5 (g/g; la Cour Jansen et al. 1997). Temperature optimum of denitrification is also often considered to be 30–35 °C (Henze 1997), though it is also reported to be less sensitive to low temperatures than nitrification (Surampalli et al. 1997) and denitrification has been reported to proceed efficiently e.g. at 9–11 °C (artificial wastewater; Æsøy et al. 1998), 10 °C (landfill leachate; Kalyuzhnyi & Gladchenko 2004), and 10–12 °C (nitrate contaminated ground water; Rezania et al. 2005).
1.4.1 Moving bed biofilm reactor
In case nutrient removal is required, a post-treatment system subsequent to anaerobic treatment needs to be applied. Anaerobic pre-treatment may be beneficial to biological nitrogen removal (Elmitwalli et al. 2001; Kalyuzhnyi et al. 2003) due to efficient removal of organic matter (less competition between nitrifying autotrophic and carbon removing heterotrophic bacteria) and dissolution of particulate organic matter (carbon readily available for nitrogen removing bacteria) in the anaerobic treatment. The pre-treatment should not, however, be too efficient in carbon removal, as denitrification needs carbon to proceed (Elmitwalli et al. 2001; Kalyuzhnyi et al. 2003; Kalyuzhnyi & Gladchenko 2004).
Post-treatment of different anaerobic effluents has been performed e.g. with hanging sponge cubes (Agrawal et al. 1997), aerobic/anoxic biofilter (Kalyuzhnyi et al. 2003), upflow biological aerated filter (Lacalle et al. 2001), and sequencing batch reactor (SBR; Subramaniam et al. 1994; Callado & Foresti 2001; Garrido et al. 2001). Moreover, intermittent aeration with alternating aeration and anoxic/anaerobic periods has been applied in e.g. activated sludge
26
(Sasaki et al. 1996; Villaverde et al. 2001), SBR (Kuba et al. 1996), and submerged membrane activated sludge (Hasar et al. 2001) to enable complete nitrogen removal in one reactor.
Moving bed biofilm reactor (MBBR, also known as suspended carrier biofilm reactor, Welander et al. 1997; Welander & Mattiasson 2003) is a continuously operating biofilm reactor with no backwashing or sludge recycling. The biofilm grows on small carrier elements moving along the reactor with aeration or mechanical mixing (Rusten et al. 1994; Ødegaard et al. 1994). Different carrier elements, such as KMT K1, K2, and K3 (Rusten et al. 2005; Anoxkaldnes 2005) and FLOCOR-RMP® (Andreottola et al. 2000) have been established. For example KMT K1 cylindrical carriers are made of polyethylene (density 0.95 g/cm3) with a cross inside and longitudinal fins outside (height and diameter 10 mm) and 350 m2/m3 specific biofilm surface area (70 % volumetric filling; Rusten et al. 1994). Biofilm grows mostly inside the carriers, while it is eroded from the outside due to carriers constantly colliding into each other (Rusten et al. 1992; Ødegaard et al. 1994).
MBBR have been applied for different wastewaters such as landfill leachate (Welander et al. 1997), fish farming wastewater (Rusten et al. 2005), dairy wastewater (Rusten et al. 1992), and municipal wastewater on large (Rusten et al. 1994) and small scale (Ødegaard et al. 1994; Rusten et al. 1997; Andreottola et al. 2000). It has been applied at a wide range of temperatures (3–20 °C) with little temperature dependency. This has been explained with deeper penetration of oxygen into biofilm, higher amount of nitrifiers, and improved dissolution of oxygen (Ødegaard et al. 1994; Welander et al. 1997) as well as diffusional restrictions of denitrification despite the temperature (Welander & Mattiasson 2003). Moreover, MBBR has been operated continuously (Ødegaard et al. 1994) and with sequencing batch mode enabling simultaneous biological phosphorous and nitrogen removal (Pastorelli et al. 1997, 1999; Helness & Ødegaard 2001). Despite its advantages, MBBR has not apparently been used for post-treatment of anaerobic effluents nor applied with intermittent aeration.

2 OBJECTIVES
The main purpose of this thesis was to evaluate the feasibility of UASB-septic tank for on-site wastewater treatment at low temperatures (< 20 °C) with main focus on removal of solid and dissolved organic matter as well as somewhat on methane production. Also, the need and method for post-treatment was evaluated. In order to assess the feasibility, the main objectives were divided as follows: - evaluation of the long-term performance of pilot UASB-septic tank, which had
treated black water at ambient temperatures (5–20 °C) for 13 years, with comparison to 1st-year-performance (I)
- evaluation of two-phased laboratory UASB-septic tanks for treatment of black water, dairy parlour wastewater, and a mixture of black water and kitchen waste at 10, 15, and 20 °C (II-III)
- evaluation of the need for single- or two-phased UASB-septic tanks for on-site, low-temperature wastewater treatment (I- III)
- comparison of continuous and discontinuous feeding of UASB-septic tanks (II, III)
- evaluation of feasibility, as defined by removal of nitrogen and organic matter, of intermittently aerated, on-site moving bed biofilm reactors for post-treatment of anaerobic effluents from UASB-septic tanks (IV)
- screening for potential of fermentative hydrogen production in on-site UASB reactors in combination with methane from UASB-septic tanks (V)

3 MATERIALS AND METHODS
The materials and methods are described in more detail in the original articles (I–V).
3.1 Wastewaters and inocula
The wastewaters treated in this study were authentic (referred to as black water; I) and synthetic black water (II, III, V), dairy parlour wastewater (II), a mixture of synthetic black water and kitchen waste (III, V; Table 2), and glucose (V). Black water originated from the toilets of the experimental hall of Sub-Department of Environmental Technology at Wageningen University, the Netherlands (I). It was fed to the UASB-septic tanks as daily quantum (1 portion of faeces, 5 portions of urine) of 1–4 persons. The degree of dilution varied also according to flushing volume of the toilets (10, 6, or 1 l/flush).
Synthetic black water was prepared using primary sludge from a municipal wastewater treatment plant (Jyväskylä, Finland), shredded toilet paper, and tap water to dilute the mixture approximately to the desired 1 g CODt/l (II–III, V). Kitchen waste was prepared to resemble kitchen waste from individual households according to a survey made at the Environmental Science section of University of Jyväskylä, Finland, and comprised of potato and fruit peels, coffee with filter papers, bread, sausage, chicken, liver casserole, and egg shells (III). The mixture of black water and kitchen waste was then prepared in the same ratio as the respective waste streams are produced in individual Finnish households (30 l black water/person/d; 0.2 kg kitchen waste/person/d; III).

TABLE 2 Average characteristics of the wastewaters used (BW = black water; DPWW = dairy parlour wastewater; BWKW = mixture of black water and kitchen waste) during the experiments (I–V). Standard deviations are given in parenthesis.
Paper Wastewater pH
(range) CODt
(mg/l) CODss (mg/l)
CODcol (mg/l)
CODdis (mg/l)
BOD7 (mg/l)
TSS (mg/l)
VSS (mg/l)
Ntot (mg/l)
NH4+ (mg/l)
Ptot (mg/l)
I aBW (1st year)
n.d. 1700 (260)
1200 (220)
n.d. *520 (64)
n.d. n.d. n.d n.d. n.d. n.d.
I aBW (13th year)
n.d. 2750 (1260)
2240 (1120)
250 (150)
270 (107)
n.d. n.d. n.d n.d. n.d. n.d.
I aBW (15 °C)
n.d. 9500 (6460)
7870 (6140)
200 (160)
1430 (480)
n.d. n.d. n.d. n.d. n.d. n.d.
I aBW (25 °C)
n.d. 12300 (7782)
9650 (6830)
660 (810)
2000 (1200)
n.d. n.d. n.d. n.d. n.d. n.d.
II bBW 5.9–6.9 950 (350)
820 (360)
26 (26)
120 (70)
270 (74)
670 (270)
490 (220)
32 (9.7)
4.5 (2.5)
17 (3.2)
II aDPWW 5.4–6.7 620 (150)
320 (140)
87 (42)
230 (80)
420 (150)
170 (45)
170 (41)
33 (9.6)
15 (7.0)
18 (1.9)
III bBW 5.8–6.6 1090 (370)
990 (330)
21 (18)
82 (43)
310 (42)
800 (270)
610 (210)
40 (14)
5.3 (2.1)
13 (0)
III bBWKW 5.2–6.0 2020 (490)
1580 (490)
70 (33)
380 (73)
680 (120)
1170 (360)
1020 (300)
57 (13)
5.5 (2.2)
17 (0.71)
IV cDPWW 6.8–7.5 190 (60)
n.d. n.d. 91 (40)
46 (0)
54 (22)
50 (24).
36 (6)
25 (3)
20 (0)
IV cBWKW 6.2–7.7 140 (80)
38 (28)
29 (22)
89 (53)
12 (0)
57 (19)
41 (23)
33 (6.7)
28 (4.9)
4.7 (2.4)
V bBW 5.8–6.9 1390 (60)
1290 (80)
59 (3.4)
60 (5.9)
n.d. 920 (400)
720 (330)
n.d. n.d. n.d.
V bBWKW 4.0–4.8 1790 (420)
1190 (430)
57 (10)
540 (16)
n.d. 1110 (140)
860 (120)
n.d. n.d. n.d.
aauthentic; bsynthetic; canaerobically pre-treated; *CODcol+dis; n.d. = not detected

30
Dairy parlour wastewater was collected at a dairy farm in Äänekoski, Finland, with wastewaters after one evening and one morning wash combined (II). Anaerobic effluents of dairy parlour wastewater and the mixture of black water and kitchen waste were collected during laboratory experiments for post-treatment studies (IV). Glucose was used as substrate as 2 g/l, equivalent to 2 g COD/l (V).
TABLE 3 Characteristics of inocula used in pilot and laboratory UASB-septic tanks
(UASBst; I–III), moving bed biofilm reactors (MBBR; IV), and UASB reactors (V) treating black water (BW), dairy parlour wastewater (DPWW), glucose, or a mixture of black water and kitchen waste (BWKW).
Paper Reactor/
Wastewater Inoculum TS
(g/l) VS
(g/l) Volume added
(l) I 1.2 m3 UASBst
BW Granular sludge from
paper mill n.d. n.d. 100
I 0.2 m3 UASBst (15 °C) BW
Sludge from 1.2 m3 UASBst
10.4 (TSS)
n.d. 80
I 0.2 m3 UASBst (25 °C) BW
None - - -
II 12+3 l UASBst BW + DPWW
Mesophilic digested sewage sludge
29.0 16.7 6
III 12+3 l UASBst BW + BWKW
Mesophilic digested sewage sludge
29.6 15.6 6
IV 2 l MBBR DPWW
Activated sludge (biol. N removal)
n.d. n.d 1
IV 2 l MBBR DPWW
Activated sludge (nitrifying)
1.24 0.71 1
V 0.5 l UASB BW
Primary sludge aUASBst 1
bUASBst 1 + heat
15.6 22.5 50.5
10.6 12.4 28.7
0.25
V 0.5 l UASB Glucose
Primary sludge heat aUASBst 1
bUASBst 1 + heat
33.2 22.5 50.5
24.8 12.4 28.7
0.25
V 0.5 l UASB BWKW
cUASBst 2 dUASBst 2 + heat
7.8 10.8
5.0 6.8
0.25
asludge from phase 1 of UASB-septic tank treating BW (III); bheat-treated sludge a csludge from phase 1 of UASB-septic tank treating BWKW (III); dheat-treated sludge c n.d. = not detected
Synthetic wastewaters were prepared 2–3 times per week and kept at 4 °C until feeding, while primary sludge and dairy parlour wastewater were collected every 4–5 weeks and stored at 4 °C. Kitchen waste was prepared, shredded with kitchen blender, and frozen at -18 °C until melting before feeding. Black water was fed to the UASB-septic tanks as the interceptor tanks filled with short equalisation time in the tank. The 1.2 m3 pilot UASB-septic tank, which had been operated for 13 years before the present studies, was originally inoculated

31
with granular sludge from a paper mill (I; Table 3). The other two pilot UASB-septic tanks (0.2 m3) were inoculated either with sludge from the 1.2 m3 UASB-septic tank (15 °C process) or not at all (25 °C process; I). The inocula used in the laboratory experiments were mesophilic digested sewage sludge from a municipal wastewater treatment plant (Jyväskylä, Finland; II–III), anaerobic sludge from phase 1 of the two-phased laboratory UASB-septic tanks described in paper III (V), and primary sludge from a municipal wastewater treatment plant (Jyväskylä, Finland; V). Inocula for fermentative hydrogen production were used as such or with heat-pre-treatment (100 °C, 15 min). Post-treating moving bed biofilm reactors were inoculated with nitrifying activated sludge (municipal wastewater treatment plant, Jyväskylä, Finland) or activated sludge from a biologically nitrogen removing municipal wastewater treatment plant (Savonlinna, Finland; IV). The volume of inocula added was 50 % of reactor volume (II–V).
3.2 Experimental set-up
3.2.1 Pilot UASB-septic tanks (I)
A UASB-septic tank with volume of 1.2 m3 treated shredded black water from three toilets. The UASB-septic tank was made of steel plate with internal structures of PVC and was placed in an underground cellar. Feeding was performed through an interceptor tank of 18 l, from which 12 l was pumped to the UASB-septic tank after the tank was filled. COD removal from 13th year of operation was compared to data from 1st year operation. Original flushing volume of the toilets was 10 l, but was reduced to 6 l in the 13th year. Moreover, black water fed to the UASB-septic tank was originally produced by 1–2 persons (1 portion of faeces/d and 5 portions of urine/d) but by 3–4 persons in the 13th year of operation. Operational temperature varied according to ambient temperature at the time of study and was 5–17 °C in the 1st year and 14–19 °C the 13th year.
The two 0.2 m3 pilot UASB-septic tanks were fed with black water from vacuum toilets (flushing volume 1 l). Black water was first collected into an interceptor tank of 10 l, from which it was pumped with a shredding pump to a pressure release vessel on top of the UASB-septic tank feeding the reactors to the bottom. One 0.2 m3 UASB-septic tank was operated at 15 °C, while the other at 20 °C (weeks 0–16) and at 25 °C (week 17 onwards; referred to as constant 25 °C UASB-septic tank).
3.2.2 Laboratory two-phased UASB-septic tanks (II, III)
Laboratory studies with anaerobic wastewater treatment were conducted in two-phased UASB-septic tanks, i.e. two UASB-septic tanks in series (phase 1: 12 l, height 70 cm, diameter 15 cm, PVC; phase 2: 3 l, height 50 cm, diameter 9 cm,

32
acrylic plastic). The reactors were fed either continuously with synthetic black water and dairy parlour wastewater (II) or discontinuously twice per weekday, 30 min at a time, with synthetic black water and a mixture of black water and kitchen waste (III). Phase 1 of all UASB-septic tanks contained a sludge/water separator constructed of carriers (Flootek RF 438, diameter 44 mm, height 36 mm). All tubing was made of PVC. Produced biogas was collected into aluminium gas bags. Operational temperatures were 20, 15 and 10 °C ± 1 (II), and 20 and 10 °C ± 1 (III).
3.2.3 Moving bed biofilm reactors (IV)
Post-treatment studies of anaerobic effluents were carried out in 2 l moving bed biofilm reactors (MBBR; height 70 cm, diameter 11 cm, PVC) at 10 °C (dairy parlour wastewater) and 20 °C (mixture of black water and kitchen waste). Cylindrical polyethylene carriers (KMT K1, Kaldnes Miljøteknologi AS, Norway) were added as 50 % of volume. Three moving bed biofilm reactors were fed continuously with effluent flowing out from the top, while the fourth reactor was operated in a sequencing batch mode with a cycle of fill, aeration, no aeration (mixing provided with magnetic stirrers), settling, and draw. Duration of fill and draw were kept constant at 30 min, while durations of the other cycle periods were altered. One MBBR was continuously and three intermittently aerated.
3.2.4 UASB reactors (V)
Fermentative hydrogen production and acidification of the wastewaters were studied in six 500 ml UASB reactors (height 32 cm, diameter 4.5 cm, glass) at 20 °C. Four of the reactors were fed continuously with synthetic black water and glucose, and two discontinuously twice per weekday, 15 min at a time, with a mixture of black water and kitchen waste. Produced biogas was collected into aluminium gas bags through Masterflex Tygon® tubes (Cole-Parmer Instrument Company, USA), while the other tubing was made of PVC.
3.2.5 Batch assays (II–V)
Batch assays to determine specific methanogenic activity (SMA) and stability of reactor sludges (II, III) and specific hydrogenogenic activity (SHA; V) were performed in duplicate 118 ml serum bottles. Each bottle received 2 g VS/l of inoculum, either reactor sludges (II, III, V) or primary sludge from a municipal wastewater treatment plant (Jyväskylä, Finland; V). With specific hydrogenogenic activity (V), the inocula were used as such and with heat-pre-treatment (100 °C, 15 min). Blank batches with mere inocula were established to study sludge stability (II, III) and hydrogen production from inocula (V). Methane production of blanks was extracted from the methane productions with substrates (II, III). Moreover, batches with 40 ml of mere reactor sludge were established to further study sludge stability (III). Other batches received

33
one of the substrates: sodium acetate (2 g COD/l, pH 7.1; II, III), synthetic black water (II: 0.9 g CODt/l; III: 0.7 g CODt/l, V: 0.9 g CODt/L), dairy parlour wastewater (II: 0.6 g CODt/l), mixture of kitchen waste and black water (III: 1.2 g CODt/l; V: 1.1 gCODt/l), or glucose (V: 2 g COD/l). Distilled water was added to reach liquid volume of 60 ml, after which the bottles were flushed with nitrogen gas and sealed with butyl rubber stoppers and aluminium crimps. With SHA, one set of batches was also flushed with hydrogen gas to study consumption of hydrogen from the headspace. Incubation temperatures were 35, 20, 15, 10 and 5 °C (II), 20 and 10 °C (III), and 20 °C (V). Batch pH was 7.2–7.8 (II), or adjusted to 7.2 (III), and 6.0 or 5.0 (V).
Another set of batch experiments studied the effect of longer anaerobic period and mixing on nitrogen removal (IV). Sixteen (16) 118 ml serum bottles were filled with 50 ml of effluent from either continuously fed MBBR (8 batches) or sequencing batch operated MBBR (8 batches) treating anaerobically treated mixture of black water and kitchen waste. Four batches with each effluent were flushed with nitrogen gas and the rest were made into vacuum. All batches were sealed with butyl rubber stoppers and aluminium crimps. Duplicates of each headspace treatment were then placed in a shaker (Heidolph mr 3000, Germany) and the other duplicates were static. Total nitrogen before and after 24 h incubation were compared.
Optimal COD/N ratio to enhance nitrogen removal was also studied in 118 ml serum bottles with carbon addition (sodium acetate) to reach COD/N ratios of 4.2, 7.1, 10, 14.2, 18, and 28.4 (IV). CODt of the effluents from moving bed biofilm reactors treating anaerobically pre-treated mixture of black water and kitchen waste (50 ml/batch) was taken into account. Headspaces were flushed with nitrogen gas and the batches sealed with butyl rubber stoppers and aluminium crimps. Total nitrogen of effluents before and after 24 h batch incubation were compared.
Aerobic degradability of anaerobically treated mixture of black water and kitchen waste and effluents from two MBBRs post-treating it was studied with 24 h aeration (Rena 100 aquarium aerators, USA) in parafilm covered decanter glasses (liquid volume 500 ml). COD values before and after were compared.
3.3 Analyses
CODt was measured according to Jirka & Carter (1975) in pilot studies (I) and according to Finnish standard methods in other studies (II–V; SFS 5504 1988). CODt was measured from raw samples. All that was retained by membrane filtering (S&S ME25, pore size 0.45 µm) was considered suspended solids COD (CODss) in pilot studies, while in the other studies (II–V) , CODss was obtained by subtracting paper filtered (S&S 595 ½, pore size 4.4 µm) COD from CODt. Colloidal COD (CODcol) was obtained by subtracting membrane filtered COD from paper filtered COD, while dissolved COD (CODdis) was the equivalent of

34
membrane filtered COD. BOD7 was analysed according to Finnish standard methods (SFS-EN 1899-1 1998; II–IV).
TS and VS as well as total and volatile suspended solids (TSS, VSS; Whatman GF/A filters) were measured according to Standard Methods (APHA 1998; II–V). Biomass attached to carriers was analysed as TS-fix (IV) by weighing 10–20 unused and used carriers from the MBBRs after drying them for 1 h at 105 °C. TS-fix was the difference of unused and used carriers multiplied by the amount of carriers in one litre.
Total nitrogen (Ntot; II–IV), ammonium nitrogen (NH4+-N; II–IV), and total oxidised nitrogen (TON; nitrate + nitrite; IV) were analysed using Tecator application note (Perstorp Analytical/Tecator AB 1995). Nitrate (NO3-) and nitrite (NO2-) were measured separately (IV) using Dr Lange mobile laboratory photometer LASA 100 (Dr Bruno Lange AB, Switzerland) and Dr Lange analysis cuvettes (nitrate: LCK340; nitrite: LCK342). Total phosphorous (Ptot) and phosphate phosphorous (PO4-) were analysed according to a Finnish standard (SFS-EN 1189 1997; II–IV).
pH (II–V) was measured with Metrohm 477 pH meter (Switzerland) and dissolved oxygen (DO; IV) with HANNA instruments HI-9143 portable meter (Italy). Alkalinity was analysed with a European standard (ISO 9963-1 1994; II–IV).
Carbon dioxide was removed from the produced biogas in the pilot studies with 3% NaOH and the volume of methane was measured with gas meters (I). Alternatively (II, III, V), biogas was collected into aluminium gas bags and its volume measured by water displacement. Methane content of biogas (II, III) was measured with a gas chromatograph Perkin Elmer Autosystem XL (USA; Column: PE Alumina column 30 m * 0.53 mm; Carrier gas: Helium; Oven: 100 °C; Injection port: 250 °C; Flame ionisation detector: 225 °C). In hydrogen experiments (V), biogas composition (methane, hydrogen, carbon dioxide) was measured with a gas chromatograph PE Arnel Clarus 500 (USA; Column: Supelco Carboxen™ 1010 Plot Fused Silica capillary column 30 m * 0.53 mm; Carrier gas: Argon 15 ml/min; Oven: 200 °C; Injection port: 225 °C; Thermal conductivity detector: 230 °C).
Volatile fatty acids (VFA; II, III, V) were analysed with a gas chromatograph Perkin Elmer Autosystem XL (USA; Column: PE FFAP column 30 m * 0.32 mm * 25 µm; Carrier gas: Helium; Oven: 100–160 °C with increase of 20 °C/min; Injection port: 225 °C; Flame ionisation detector: 225 °C). VFA samples were filtered (S&S ME25, pore size 0.45 µm) prior to analysing. Metals (II) were measured as described in Väisänen et al. (2002) with the exception of using ICP-OES (PE Optima 4300 DV, USA).

4 RESULTS
4.1 Anaerobic on-site wastewater treatment in UASB-septic tanks
4.1.1 COD removal
Anaerobic on-site treatment of different wastewaters was studied at low temperatures using single- and two-phased UASB-septic tanks. The UASB-septic tanks applied were 1.2 m3 single-phased process treating black water at ambient temperatures (I), two 0.2 m3 single-phased processes treating black water at constant 15 and 25 °C (I), and two-phased laboratory processes treating synthetic black water (II, III), dairy parlour wastewater (II), and a mixture of black water and kitchen waste (III) at 10–20 °C. The higher temperatures resembled summer wastewater temperatures in northern Europe (14–20 °C; approx. May-September), while the lower temperatures (5–13 °C) corresponded to winter temperatures. Organic loading rates (OLR) of all reactors treating black water were similar at approximately 0.25–0.45 kgCOD/m3d, except with 1.2 m3 UASB-septic tank (13th year of operation) in which OLR was 0.89 kgCOD/m3d (Table 4). HRT, however, differed significantly between black water from conventional flush toilets (1.2 m3 and laboratory UASB-septic tanks) and that from vacuum toilets (0.2 m3 UASB-septic tanks; Table 4) being significantly higher (29 d) with vacuum toilets.
CODt removals of the laboratory two-phased UASB-septic tanks (II, III) averaged high at above 90 % with synthetic black water (Fig. 4 & 6), above 82 % with dairy parlour wastewater (Fig. 5), and above 88 % with the mixture of black water and kitchen waste (Fig. 7). Little differences in complete COD removals of the two-phased processes were noticed between different temperature periods (Fig. 4–7, Table 4). Also, removal of suspended solids (CODss) was high (on average >85 %) at all temperatures (Fig. 4–7; Table 4).

36
CODdis removal was approximately 70 % with dairy parlour wastewater (Fig. 5; II), mixture of black water and kitchen waste (Fig. 7; III), and continuously fed synthetic black water (Fig. 4; II). With discontinuously fed synthetic black water (Fig. 6; III), it was on average 25 % (Table 4). CODcol corresponded to 2–14 % of influent CODt (Fig. 4–7). It was removed most efficiently from dairy parlour wastewater (>62 %) with a relatively high removal also with continuously fed synthetic black water (approx. 50 %). Variation of CODcol removal was, however, high (Table 4).
Most of CODt was removed along with CODss in reactor phase 1 with all laboratory studied wastewaters (II, III; Fig. 4–7; Table 4). Some CODcol and CODdis were also removed in phase 1 from continuously fed synthetic black water and dairy parlour wastewater, while respective phase 2 removed only some residual COD (Fig. 4–5; II). This was more pronounced with continuously fed synthetic black water, with which phase 2 seemed unnecessary (Fig. 4). With dairy parlour wastewater, however, COD removal of phase 1 decreased somewhat with decreasing temperature and phase 2 was a justified addition to achieve the high COD removals at low temperatures (Fig. 5).
Accumulation of metals, such as sodium, calcium, and iron, into phase 1 treating dairy parlour wastewater (II) eventually resulted in wash out of precipitates and attached sludge particles at 10 °C, thus decreasing the CODt and CODss removals in phase 1 (days 300–400; Fig. 5). Combined COD removal of the two-phased process remained, however, high due to increased removals in phase 2 (Table 4).
With discontinuously fed synthetic black water (Fig. 6) and mixture of black water and kitchen waste (Fig. 7), CODcol and CODdis were produced in phase 1 as shown by their increase (Table 4). This produced COD was, however, removed in subsequent phase 2 with high overall removal, especially with the mixture of black water and kitchen waste.
Residual COD values after two-phased UASB-septic tank were the lowest with discontinuously fed black water being 44–61 mgCODt/l, 5.2–12 mgCODss/l, 1.0–19 mgCODcol/l, and 32–45 mgCODdis/l at all applied temperatures, while with discontinuous feeding they were 92–100, 16–20, 20–27, and 48–70, respectively. With the mixture of black water and kitchen waste somewhat more COD was left in final effluent, residual values being 171–199 mgCODt/l, 26–44 mgCODss/l, 41–49 mgCODcol/l, and 110–113 mgCODdis/l. With dairy parlour wastewater, 74–156 mg/l of CODt, 9.0–51 mg/l of CODss, 16–33 mg/l of CODcol and 48–88 mg/l of CODdis remained in final effluent.
With the pilot single-phased UASB-septic tanks (I), somewhat lower COD removals were achieved with average of 60–80 % CODt and 70–80 % CODss removals (Table 4). During the warmer period (14–17 °C) of 1st year operation of the 1.2 m3 process, unadapted inoculum washed out thus deteriorating the removals (Table 4). Moreover, CODdis removals were low during the 1st year operation of 1.2 m3 process and 0.2 m3 process at 15 °C,

37
but at higher temperature (0.2 m3 process at 25 °C) and after long-term operation at low temperatures (13th year of 1.2 m3 process) it increased to approx. 50 % (Table 4). Residual COD values were 600–1200 mg CODt/l during 1st year operation of the 1.2 m3 UASB-septic tank and 865 mg CODt/l in the 13 the year despite two times higher influent COD. With the two 0.2 m3 processes, effluent CODt values were 3700 mg/l (15 °C) and 2750 mg/l (25 °C), while in influent it was 9500–12300 mg/l.

TABLE 4 Feeding scheme (continuous/discontinuous = C/D), temperature, hydraulic retention time, organic loading rate, and COD removals
per reactor phase and per complete two-phased UASB-septic tanks treating black water (BW), dairy parlour wastewater (DPWW), and a mixture of black water and kitchen waste (BWKW). Standard deviations are in parenthesis.
Paper Wastewater and reactor
Feed Day (weeks)
Temp (°C)
HRT (d)
OLR (kgCOD/m3d)
COD removal /phase (%) CODt CODss CODcol CODdis
Two-phased COD removal (%) CODt CODss CODcol CODdis
I *aBW 1.2 m3
D (52) 5–13
14–17 4.3 0.43 - 65 83 - **10
33 59 - **-24 I *bBW 1.2 m3 D (13) 14–19 4.1 0.89 - 70 71 - **53 I *BW 0.2 m3 D (50) 15 29 0.33 - 61 80 - **-31 I *BW 0.2 m3 D (50) 20/25 29 0.42 - 78 79 - **51 II DPWW
phase 1 C 0–114
115–222 223–398
20 15 10
3.5 (1.8) 3.8 (1.1) 3.5 (0.8)
0.18 (0.058) 0.16 (0.043) 0.19 (0.074)
73 (11) 82 (17) 67 (27) 62 (15) 61 (13) 65 (25) 56 (36) 52 (18) 51 (16) 27 (44) 37 (47) 46 (15)
84 (13) 90 (11) 77 (40) 70 (19) 86 (4.9) 91 (8.7) 66 (36) 77 (11) 82 (6.3) 86 (15) 62 (24) 70 (20)
II DPWW phase 2
C 0–114 115–222 223–398
20 15 10
1.7 (0.52) 1.6 (0.25) 1.5 (0.43)
0.10 (0.041) 0.14 (0.057) 0.24 (0.10)
46 (17) 78 (31) 18 (87) 33 (22) 63 (16) 80 (21) 32 (56) 51 (18) 64 (12) 78 (21) 34 (43) 52 (21)
-
II BW phase 1
C 0–114 115–222 223–398
20 15 10
3.3 (2.3) 4.8 (4.6) 4.4 (4.2)
0.28 (0.11) 0.22 (0.22) 0.30 (0.16)
88 (6.4) 96 (5.7) 44 (53) 51 (15) 91 (4.3) 96 (5.6) 41 (80) 63 (20) 91 (5.1) 96 (5.0) 40 (56) 70 (19)
93 (4.0) 97 (3.0) 21 (85) 54 (17) 93 (3.9) 98 (2.7) 58 (39) 70 (16) 94 (3.3) 98 (2.6) 50 (32) 71 (19)
II BW phase 2
C 0–114 115–222 223–398
20 15 10
1.6 (0.53) 1.6 (0.25) 1.4 (0.36)
0.075 (0.069) 0.046 (0.018) 0.071 (0.031)
42 (21) 64 (48) 37 (80) 12 (12) 38 (19) 60 (34) 14 (98) 26 (22) 40 (18) 54 (57) 18 (62) 22 (20)
-
III BW phase 1
D 0–123 124–200
20 10
2.9 (0) 2.9 (0)
0.37 (0.12) 0.42 (0.15)
80 (5.9) 96 (2.0) -300 -100 (90) 79 (11) 92 (6.0) -250 -25 (32)
91 (4.6) 98 (1.9) 11 (55) 21 (27) 92 (3.9) 98 (2.2) 35 (45) 22 (31)
III BW phase 2
D 0–123 124–200
20 10
1.3 (0.22) 1.2 (0.23)
0.17 (0.064) 0.14 (0.063)
57 (14) 70 (25) 47 (27) 52 (16) 53 (23) 74 (20) 31 (48) 43 (17)
-
III BWKW phase 1
D 0–123 124–200
20 10
3.4 (0.53) 3.4 (0)
0.56 (0.15) 0.60 (0.12)
78 (11) 95 (3.4) 17 (42) 29 (47) 72 (15) 84 (18) 4.6 (37) 31 (18)
88 (9.2) 96 (4.0) 38 (39) 69 (24) 91 (4.1) 98 (1.3) 28 (38) 71 (9.7)
III BWKW phase 2
D 0–123 124–200
20 10
1.3 (0.23) 1.4 (0.31)
0.32 (0.17) 0.31 (0.11)
52 (17) 57 (28) 25 (44) 52 (18) 70 (7.9) 83 (13) 26 (34) 58 (16)
-
*single phased process, authentic black water; *a 1st year; *b 13th year; **CODcol+dis; negative values = COD increased
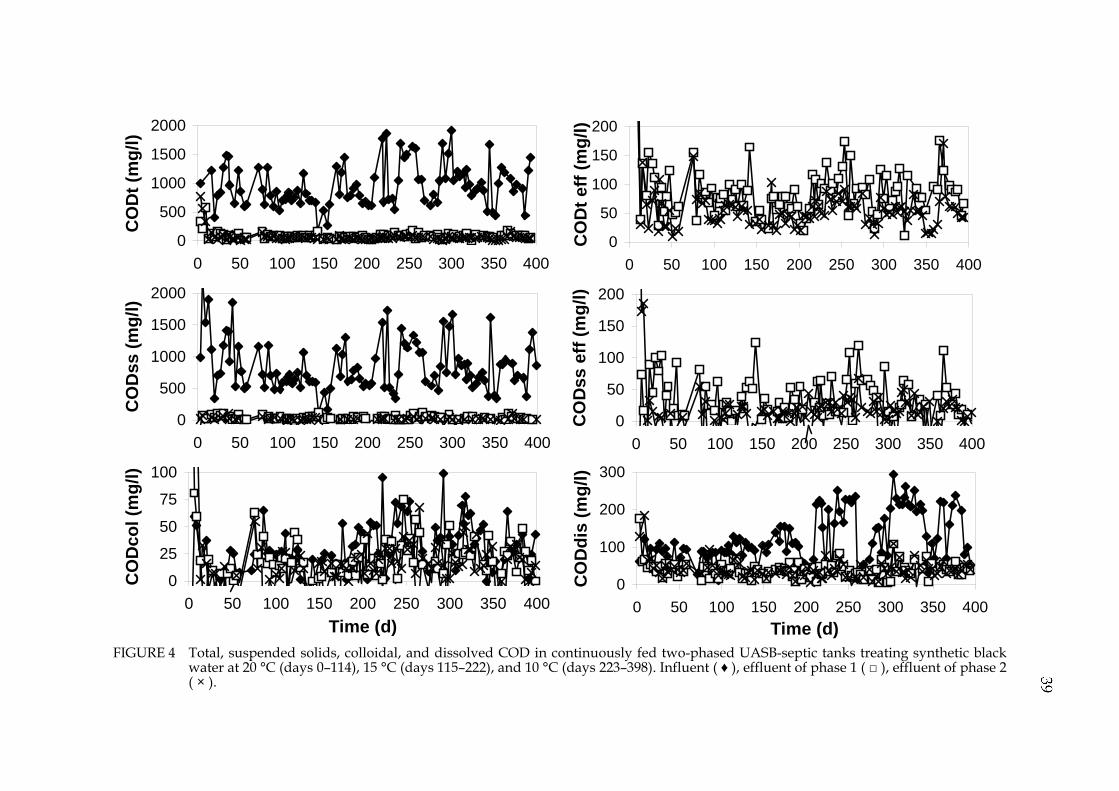
0
50
100
150
200
0 50 100 150 200 250 300 350 400
CO
Dt e
ff (m
g/l)
0
50
100
150
200
0 50 100 150 200 250 300 350 400
CO
Dss
eff
(mg/
l)
0
500
1000
1500
2000
0 50 100 150 200 250 300 350 400
CO
Dt (
mg/
l)
0
500
1000
1500
2000
0 50 100 150 200 250 300 350 400
CO
Dss
(mg/
l)
0
25
50
75
100
0 50 100 150 200 250 300 350 400Time (d)
CO
Dco
l (m
g/l)
0
100
200
300
0 50 100 150 200 250 300 350 400Time (d)
CO
Ddi
s (m
g/l)
FIGURE 4 Total, suspended solids, colloidal, and dissolved COD in continuously fed two-phased UASB-septic tanks treating synthetic black
water at 20 °C (days 0–114), 15 °C (days 115–222), and 10 °C (days 223–398). Influent ( ♦ ), effluent of phase 1 ( □ ), effluent of phase 2 ( × ).

0200400600800
1000
0 50 100 150 200 250 300 350 400
CO
Dt e
ff (m
g/l)
0
200
400
600
800
0 50 100 150 200 250 300 350 400
CO
Dss
eff
(mg/
l)
0
300
600
900
1200
0 50 100 150 200 250 300 350 400
CO
Dt (
mg/
l)
0
300
600
900
1200
0 50 100 150 200 250 300 350 400
CO
Dss
(mg/
l)
0
100
200
300
400
0 50 100 150 200 250 300 350 400Time (d)
CO
Ddi
s (m
g/l)
0
50
100
150
200
0 50 100 150 200 250 300 350 400
Time (d)
CO
Dco
l (m
g/l)
FIGURE 5 Total, suspended solids, colloidal, and dissolved COD in continuously fed two-phased UASB-septic tanks treating dairy parlour
wastewater at 20 °C (days 0–114), 15 °C (days 115–222), and 10 °C (days 223–398). Influent ( ♦ ), effluent of phase 1 ( □ ), effluent of phase 2 ( × ).

0500
100015002000
0 25 50 75 100 125 150 175 200
CO
Dt (
mg/
l)
0400800
12001600
0 25 50 75 100 125 150 175 200
CO
Dss
(mg/
l)
0
150
300
450
0 25 50 75 100 125 150 175 200
CO
Dt e
ff (m
g/l)
050
100150200
0 25 50 75 100 125 150 175 200CO
Dss
eff
(mg/
l)
0
50
100
150
0 25 50 75 100 125 150 175 200
Time (d)
CO
Dco
l (m
g/l)
0100200300400
0 25 50 75 100 125 150 175 200Time (d)
CO
Ddi
s (m
g/l)
FIGURE 6 Total, suspended solids, colloidal, and dissolved COD in discontinuously fed two-phased UASB-septic tanks treating synthetic
black water at 20 °C (days 0–123) and 10 °C (days 124–198). Influent ( ♦ ), effluent of phase 1 ( □ ), effluent of phase 2 ( × ).

0
1000
2000
3000
0 25 50 75 100 125 150 175 200
CO
Dt (
mg/
l)
0
1000
2000
3000
0 25 50 75 100 125 150 175 200
CO
Dss
(mg/
l)
050
100150200
0 25 50 75 100 125 150 175 200
Time (d)
CO
Dco
l (m
g/l)
0300600900
1200
0 25 50 75 100 125 150 175 200
CO
Dt e
ff (m
g/l)
0
100
200
300
400
0 25 50 75 100 125 150 175 200CO
Dss
eff
(mg/
l)
0200400600800
0 25 50 75 100 125 150 175 200Time (d)
CO
Ddi
s (m
g/l)
FIGURE 7 Total, suspended solids, colloidal, and dissolved COD in discontinuously fed two-phased UASB-septic tanks treating a mixture of
black water and kitchen waste at 20 °C (days 0–123) and 10 °C (days 124–198). Influent ( ♦ ), effluent of phase 1 ( □ ), effluent of phase 2 ( × ).

43
4.1.2 Sludge beds, BOD7, and nutrients
Other measured parameters from two-phased UASB-septic tanks included sludge bed growth and stability, BOD7, and nutrients (II, III). After inoculation, sludge beds settled to 20 % of reactor volume and remained as such in all phases 2 (Fig. 8). Sludge beds in phase 1, however, grew with all but dairy parlour wastewater. With continuously fed synthetic black water (II), it grew slowly filling 65 % of reactor volume after 398 days of operation at 20, 15, and 10 °C. No desludging was needed. With discontinuously fed synthetic black water and mixture of black water and kitchen waste (III), however, sludge beds grew more quickly (Fig. 8). After 89 days at 20 °C, they filled 50 % of reactor volume and were emptied to 20 % of volume. After decreasing the temperature to 10 °C (day 123), sludge bed growth increased, and another desludging was needed on day 156 (67 days after 1st desludging) as the sludge beds filled 70 % of the reactor volume. The processes were operated for 42 days more and were stopped on day 198. At this point, desludging would have been needed again with sludge beds filling 80 % of reactor volume and occasionally washing out with the effluent.
Sludge beds of phases 1 treating discontinuously fed synthetic black water and mixture of black water and kitchen waste were left to stabilise without feeding at 10 °C (day 198 onwards; III). During the following 30 days, they both produced approximately 80 ml biogas/d with 25–35 % methane. After this, biogas volume was negligible but its methane content remained the same.
01020304050
0 100 200 300 400
Slud
ge b
ed (c
m)
A
0102030405060
0 50 100 150 200
Time (d)
Slud
ge b
ed (c
m)
B
FIGURE 8 Sludge bed growth in two-phased UASB-septic tanks treating continuously fed
synthetic black water (BW) and dairy parlour wastewater (DPWW) at 20 °C (days 0–114), 15 °C (days 115–222), and 10 °C (days 223–398) above (A) and discontinuously fed synthetic black water and mixture of black water and kitchen waste (BWKW) at 20 °C (days 0–123) and 10 °C (days 124–198) below (B). A: BW phase 1 ( × ), BW phase 2 ( ▲ ), DPWW phase 1 ( ♦ ), DPWW phase 2 ( □ ). B: BW phase 1 ( × ), BW phase 2 ( ▲ ), BWKW phase 1 ( ♦ ), BWKW phase 2 ( □ ).

44
BOD7 was measured from selected samples (II, III). At all applied temperatures, 93 % of BOD7 was removed from continuously fed synthetic black water and dairy parlour wastewater (II), while with discontinuously fed synthetic black water, the removal was 91 % (III). BOD7 removal was above 95 % with mixture of black water and kitchen waste at 20 °C but decreased to 76 % at 10 °C (III). This decrease in BOD7 removal may have been due to sludge wash out rather than decreased biological activity. Little, if any, VFA was left in effluents from all laboratory UASB-septic tanks, except with dairy parlour wastewater at 10 °C, 30 % of CODdis in effluent was VFA (II). This coincided with the wash out of precipitated metals, indicating disturbances in biological activity as well. With pilot studies, BOD7 and VFA were not analysed (I).
Nitrogen content was studied every 3–4 weeks, while phosphorous was measured from selected samples (II, III). Nutrient removal was high with continuously fed synthetic black water with 93 % removal of Ptot and 63 % of Ntot, and was accounted for precipitation and removal with suspended solids (II). With discontinuously fed synthetic black water, no such nitrogen removal was noticed (18 % removed), but 82–92 % Ptot removal was detected (III). Moreover, with the mixture of black water and kitchen waste, 30–40 % of nitrogen and 62–72 % of phosphorous were removed (III). Dairy parlour wastewater differed from the other treated wastewaters with lower removals of 13 % of phosphorous and 17 % of nitrogen.
Ammonification was more efficient at the higher temperatures applied. At 20 °C, concentration of ammonium nitrogen increased from 4.6 to 23 mg/l with discontinuously fed synthetic black water and from 4.8 to 33 mg/l with mixture of black water and kitchen waste (III). At 10 °C, respective final effluents contained only 13 and 15 mg NH4+/l. Nutrients were not analysed in pilot studies (I).
4.1.3 Specific methanogenic activities and stability of reactor sludges
SMA and stability of laboratory UASB-septic tank sludges were studied in batch assays at 35, 20, 15, 10, and 5 °C (II) and at 20 and 10 °C (III) without and with different substrates (acetate, synthetic black water, dairy parlour wastewater, mixture of black water and kitchen waste) with focus on temperature dependence (Fig. 9) and substrate consumption. SMAs were highest at the highest temperatures applied (35 and 20 °C), indicating psychrotolerant rather than psychrophilic population in the sludges (Fig. 9). Methane production started quickly with maximum lag of 10 d in most batches (II, III). With dairy parlour wastewater, however, longer lag periods were noticed already at 20 °C and they were prolonged as the temperature decreased (II). Acetate yielded the highest methane productions and SMAs with all sludges, whereas SMAs with dairy parlour wastewater were the lowest at 20 and 10 °C (Fig. 9).
All sludges were unstabilised as indicated by methane production from blank batches (no substrate added; II, III). SMA of sludges from UASB-septic tank phases 1 treating synthetic black water and mixture of black water and

45
kitchen waste (III) were studied separately (40 ml of sludge/batch) after reactor operation at 20 and 10 °C. SMA had increased respectively from 3.7 to 8.6 mlCH4/gVSd (incubation at 20 °C) and 2.0 to 2.7 mlCH4/gVSd (10 °C) with sludge from black water treatment. Respective increases were from 6.0 to 7.2 mlCH4/gVSd (20 °C) and 2.5 to 3.5 mlCH4/gVSd (10 °C) with sludge from treatment of mixture of black water and kitchen waste. Sludges from phase 2 were somewhat better stabilised with less methane produced and lower SMAs (III).
010203040
0 5 10 15 20 25 30 35 40
SMA
0
10
20
30
40
0 5 10 15 20 25 30 35 40
SMA
0
10
20
30
40
0 5 10 15 20 25 30 35 40Temp (°C)
SMA
FIGURE 9 Temperature dependence of reactor sludges from two-phased UASB-septic
tanks treating synthetic black water (BW), dairy parlour wastewater (DPWW), and mixture of black water and kitchen waste (BWKW) with substrates (wastewater or acetate). Unit of SMA is mlCH4/gVSd. On top: sludge from phase 1 treating continuously fed BW in the end of studies – BW ( ◊ ), acetate ( □ ); sludge from phase 2 treating DPWW in the end of studies – DPWW ( ▲ ), acetate ( × ). In the middle: sludge from phase 1 treating discontinuously fed BW at 20 °C – BW (◊ ), acetate (□ ); sludge from phase 1 treating BWKW at 20 °C – BWKW ( ▲ ), acetate ( × ). On bottom: sludge from phase 1 treating discontinuously fed BW at 10 °C – BW (◊ ), acetate (□ ) ); sludge from phase 2 treating BW at 10 °C – BW ( * ), acetate ( ♦ ); sludge from phase 1 treating BWKW at 10 °C – BWKW ( ▲ ), acetate ( × ); sludge from phase 2 treating BWKW at 10 °C – BWKW ( + ), acetate ( - ).

46
4.2 Post-treatment of anaerobic effluents in moving bed biofilm reactors
Nitrogen and COD removal from anaerobically treated dairy parlour wastewater (10 °C) and mixture of black water and kitchen waste (20 °C) were studied in intermittently aerated moving bed biofilm reactors (MBBR). Two MBBRs were continuously fed with anaerobically treated dairy parlour wastewater either with continuous (MBBR1) or intermittent aeration (30 min on, 150 min off; MBBR2), while two other intermittently aerated processes received anaerobically treated mixture of black water and kitchen waste continuously (MBBR3) or in a sequencing batch mode (MBBR4; IV). Different aeration cycles were applied with MBBR3 and MBBR4. HRT were 1.8–2.8 d with both wastewaters and OLR 0.023–0.027 kgCOD/m3d with dairy parlour wastewater and 0.031–0.093 kgCOD/m3d with mixture of black water and kitchen waste. Respective nitrogen loading rates (NLR) were 0.014–0.017 kgN/m3d and 0.012–0.021 kgN/m3d.
Both MBBR1 and MBBR2 nitrified anaerobically treated dairy parlour wastewater completely (Fig. 10), while Ntot removal was 50–60 % also in constantly aerated MBBR1 (Fig. 10; Table 5). Removal of CODt was approximately 70 % in both processes, whereas CODdis removal was 54–68 % with somewhat higher removal in intermittently aerated MBBR2 (Fig. 10; Table 5). Reactor pH of both MBBR1 and MBBR2 decreased occasionally below 6.4 and was then increased to approximately 7.0 by buffer addition (NaHCO3; Fig. 10). Moreover, influent alkalinity (approximately 190 mgCaCO3/l) was almost completely consumed (below 50 mgCaCO3/l in effluent). After day 70, however, pH remained above 6.5 without buffering (Fig. 10).
With MBBR3 and MBBR4 treating anaerobically treated mixture of black water and kitchen waste, complete nitrification was achieved as long as DO was 2.0–3.5 mg/l during aeration and the aeration period lasted minimum 1.0 h with continuously fed MBBR3 (aeration 5 h off) and 2.0–2.5 h with sequencing batch operated MBBR4 (3.0–4.5 h off with mixing + 1.0–2.0 h settling; Fig. 11). Approximately 50 % Ntot was removed (Fig. 11; Table 5) despite the apparent shortage of carbon for denitrification.
Optimal COD/N ratio (g/g) to enhance nitrogen removal was studied with batch assays with six different COD/N ratios (Fig. 12), of which 14.2 was found the most efficient. COD/N ratio was then elevated to 11–12 in reactors, increasing Ntot removal instantly to 83 %. Longer and mixed anaerobic period was also found beneficial to denitrification as 50 % of Ntot was further removed from both effluents during 24 h incubation in mixed batches, while respective removal was less than 15 % with static batches.

0204060
0 20 40 60 80 100 120
Nto
t (m
g/l)
010203040
0 20 40 60 80 100 120
NH
4+ (m
g/l)
0102030
0 20 40 60 80 100 120
Time (d)
TON
(m
g/l)
0
100
200
300
0 20 40 60 80 100 120
CO
Dt (
mg/
l)
0
50
100
150
0 20 40 60 80 100 120CO
Ddi
s (m
g/l)
5678
0 20 40 60 80 100 120Time (d)
pH
FIGURE 10 Total, ammonium, and oxidised nitrogen, as well as total and dissolved COD, and pH in intermittently aerated moving bed biofilm
reactors treating anaerobically treated dairy parlour wastewater at 10 °C. Influent ( ♦ ), MBBR1 ( □ ), MBBR2 ( × ).

01020304050
0 10 20 30 40 50 60 70 80
Nto
t (m
g/l)
0
20
40
60
0 10 20 30 40 50 60 70 80
NH
4+ (m
g/l)
0
10
20
30
0 20 40 60 80Time (d)
TON
(mg/
l)
66.5
77.5
88.5
0 10 20 30 40 50 60 70 80Time (d)
pH
0
100
200
300
0 10 20 30 40 50 60 70 80
CO
Dt (
mg/
l)
0
50
100
150
0 10 20 30 40 50 60 70 80
CO
Ddi
s (m
g/l)
FIGURE 11 Total, ammonium, and oxidised nitrogen, as well as total and dissolved COD, and pH in intermittently aerated moving bed biofilm
reactors treating anaerobically treated mixture of black water and kitchen waste at 20 °C. Influent ( ♦ ), MBBR3 ( □ ), MBBR4 ( × ).

49
MBBR3 and MBBR4 removed 40–50 % of CODt and 40–70 % of CODdis (Fig. 11; Table 5). The shortest aeration cycle of MBBR3 (0.5 h on, 5.5 h off) deteriorated COD removals to 19 and 13 %, respectively, thus indicating high aerobic degradability of post-treated anaerobic effluent requiring longer aeration period to be removed. This was also shown in aerated batch assays as 63 and 90 % of residual COD was removed after 24 h aeration from both effluents of MBBR3 and MBBR4.
With anaerobically treated mixture of black water and kitchen waste pH remained well above 6.5 at all times (Fig. 11) and alkalinity was also higher than with MBBR1 and MBBR2. No buffering was therefore needed.
0
5
10
15
Initial 4.2 7.1 10.0 14.2 18.0 28.1COD/N ratio
Nto
t (m
g/l)
FIGURE 12 Total nitrogen removal with different COD/N ratios (g/g) in batch assays.
Carbon was added as sodium acetate. White column = MBBR3; black column = MBBR4.
The sequential system with two-phased UASB-septic tank and MBBR removed over 92 % of CODt, 88 % of CODdis, 99 % of BOD7, and 65–70 % of Ntot of both wastewaters at 10 and 20 °C (Table 5). Moreover, approximately 80 % of Ptot was removed without any attempt to optimise phosphorous removal. TABLE 5 Total and dissolved COD, BOD7, as well as total, ammonium, and total
oxidised nitrogen in original dairy parlour wastewater (DPWW) and mixture of black water and kitchen waste (BWKW), effluent of UASB-septic tank phase 1 (Eff 1) and phase 2 (Eff 2) of two-phased UASB-septic tanks, and effluent of post-treating moving bed biofilm reactors (MBBR1-4). Standard deviations are in parenthesis.
Paper Waste-
water T
(°C) CODt
(mg/L) CODdis
(mg/L) BOD7
(mg/l) Ntot
(mg/L) NH4+
(mg/L) TON
(mg/l) II / IV
DPWW Eff 1 Eff 2
MBBR1 MBBR2
10
690 (130) 456 (190) 190 (48) 57 (19) 45 (14)
270 (87) 150 (46) 100 (36) 34 (12) 33 (12)
400 370 46 <3 3
43 (2.8) 55 (11) 29 (2.1) 15 (2.6) 15 (2.4)
21 (4.4) 23 (4.8) 23 (5.1)
0 (0) 0 (0)
n.d. n.d.
0 11 (7.2) 8.4 (6.1)
III / IV
BWKW Eff 1 Eff 2
MBBR3 MBBR4
20
1890 (440) 420 (230) 140 (78) 80 (35) 43 (22)
390 (66) 280 (200) 89 (53) 75 (40) 31 (24)
760 31 12 <3 4.5
57 (13) 43 (3.2) 34 (6.7) 16 (4.5) 17 (6.5)
4.8 (2.7) 31 (15) 28 (4.9) 2.6 (2.4) 4.3 (4.6)
n.d. n.d.
0 10 (5.8) 8.9 (5.7)
n.d. = not detected

50
4.3 Acidogenesis and fermentative hydrogen production in UASB reactors
Acidogenesis and potential for fermentative hydrogen production were studied in six UASB reactors at 20 °C (V). Synthetic black water was added to three UASBs inoculated with primary sludge from a municipal wastewater treatment plant as such (UASB1) and sludge from laboratory UASB-septic tank treating synthetic black water as such (UASB2) and with heat-pre-treatment (UASB3). HRT was 9–12 h and OLR 2.4–4.3 kgCOD/m3d (days 0–11).
In the beginning, little, if any, acidogenesis was noticed with very low VFA concentrations in effluents (Fig. 13), and no hydrogen was produced (Fig. 14). Only some carbon dioxide and methane was produced, and with heat-treated inoculum merely carbon dioxide. pH was >6.5, apparently too high to inhibit methanogenic activity.
UASB2 and UASB3 were switched to glucose addition (2 gCOD/l) on day 14, and a UASB4, inoculated with heat-treated primary sludge, was established. HRT was then 15–21 h and OLR 3.6–3.8 kgCOD/m3d, while pH decreased spontaneously to 3.8–4.6. Acidogenesis produced mostly acetate and butyrate with little propionate (Fig. 13). The highest total VFA production (211 mg/l) was detected with UASB2 (170 mg/l UASB3; 99 mg/l UASB4). Hydrogen production started quickly with all reactors and was increased to the maximum reached, 153 ml H2/d, i.e. 0.44 mol H2/mol glucose in UASB3, when HRT was dropped to 8.5 h (day 21 onwards; Fig. 14). Also, UASB2 produced 127 ml H2/d corresponding to 0.36 mol H2/mol glucose, while in UASB4, hydrogen production ceased at 10 ml H2/d (0.08 mol H2/mol glucose). No methane was detected in biogas. Whereas with all other inocula remained flocculent, UASB-septic tank sludge in UASB2 started to form granule-like aggregates (diameter approximately 0.6 mm) during glucose addition.
Finally, two other reactors were established with inocula from phase 1 of laboratory UASB-septic tank treating mixture of black water and kitchen waste as such (UASB5) and with heat-pre-treatment (UASB6). The UASB-septic tank had treated mixture of black water and kitchen waste, which was added discontinuously to the UASB reactors with HRT of 17 h and OLR of 2.6 kgCOD/m3d. pH was adjusted first to 5.0 and later to 4.0 as the low pH induced hydrogen production with glucose. Acidogenesis proceeded with end products of acetate (26 mg/l) and propionate (23 mg/l), while butyrate and valerate concentrations were lower (Fig. 13). Despite detected conversion to VFA, no hydrogen was produced (Fig. 14). Some methane was detected in UASB5 despite the very low pH.

51
05
101520
0 3 6 9 12
VFA
(mg/
l)BW
0306090
120
0 5 10 15 20 25
VFA
(mg/
l)
UASB1;BW
UASB4; Glucose
050
100150200250
0 5 10 15 20 25
VFA
(mg/
l) UASB2;BW
UASB2; Glucose
050
100150200
0 5 10 15 20 25
VFA
(mg/
l)
UASB3;BW
UASB3;Glucose
020406080
25 30 35 40
VFA
(mg/
l)
BWKW
020406080
100
25 30 35 40
VFA
(mg/
l)
UASB5;BWKW
020406080
100
25 30 35 40Time (d)
VFA
(mg/
l)
UASB6; BWKW
FIGURE 13 Volatile fatty acids (VFA) in acidogenic UASB reactors fed with black water
(BW), glucose, and a mixture of black water and kitchen waste (BWKW) at 20 °C. Note the different scales on Y-axis. Total VFA ( × ), acetate ( ♦ ), propionate ( □ ), butyrate ( ◊ ), and valerate ( * ).

52
02468
10
0 10 20 30
Gas
(ml/d
) UASB1;BW
UASB4;glucose
04080
120160
0 10 20 30
Gas
(m
l/d)
UASB2;BW
UASB2;glucose
04080
120160
0 10 20 30
Gas
(ml/d
)
UASB3;BW
UASB3;glucose
02468
25 30 35 40 45
Gas
(m
l/d)
UASB5;BWKW
012345
25 30 35 40 45Time (d)
Gas
(ml/d
)
UASB6;BWKW
FIGURE 14 Gas production in acidogenic UASB reactors fed with black water (BW),
glucose, and a mixture of black water and kitchen waste (BWKW) at 20 °C. Note the different scales on Y-axis. Hydrogen ( ♦ ), methane ( × ), carbon dioxide ( □ ).
SHA of the inocula with and without substrates (synthetic black water, mixture of black water and kitchen waste, glucose) and hydrogen consumption from headspace were studied in batch assays at 20 °C. The results showed a similar trend to reactor experiments with hydrogen production only from batches with glucose. The highest hydrogen volume produced was with heat-treated sludge from UASB-septic tank treating synthetic black water (17 ml H2), while with the same sludge as such, 14 ml H2 was produced and all other batches with glucose

53
produced less than 9 ml H2. SHA were 4.9, 65, 39, 10, and 10 ml H2/gVSd respectively for primary sludge as such, UASB-septic tank sludge (synthetic black water) as such and with heat-treatment, and another UASB-septic tank sludge (mixture of black water and kitchen waste) as such and with heat-treatment. Remaining VFA in the glucose batches differed from each other. The highest acetate production (121 mg/l) was noticed with UASB-septic tank sludge (synthetic black water) as such, which also yielded the highest SHA. With the others, butyrate was detected in the highest concentrations.
In blank batches with hydrogen gas in headspace, hydrogen was consumed slowly from batches with primary sludge and UASB-septic tank sludge (synthetic black water) as such as inocula. Still, little methane or carbon dioxide was detected. Acetate concentration was, however, higher than in similar blank batches with nitrogen headspace.
Batches with synthetic black water and mixture of black water and kitchen waste produced mostly methane instead of hydrogen. The lag periods were three to five days with sludges as such, while with heat-treated sludges, lag was longer and produced volumes lower. Little VFA remained in the batches being mostly propionate, while acetate had probably been consumed to methane.

5 DISCUSSION
5.1 Anaerobic on-site wastewater treatment in UASB-septic tanks
All present results indicate the feasibility of UASB-septic tank for (pre)treatment of wastewaters from individual households, small communities, or dairy farms in terms of COD and suspended solids removal. In the laboratory studies (II, III), significant biological activity was encountered also at the low temperature of 10 °C with high CODdis (70 %) and BOD7 (80–90 %) removal and significant conversion of influent COD into methane (14–29 %). Moreover, CODt removals were high at an average of 91–94 % for synthetic black water, 82–86 % for dairy parlour wastewater, and 88–91 % for mixture of black water and kitchen waste. Over 90 % of CODss was also removed from all wastewaters (II, III), except during wash out of metal precipitates from dairy parlour wastewater at 10 °C (86 %; II). CODcol values were low and removal the least efficient, except from dairy parlour wastewater, which also contained the most CODcol, removal was 62–77 % (II). Residual COD was mostly aerobically degradable as shown in post-treatment of dairy parlour wastewater and mixture of black water and kitchen waste.
In pilot studies with black water at ambient temperatures, CODt and CODss removals were somewhat lower at 65 and 70–80 %, respectively (I). Colder periods (<14 °C) indicated the pilot process to work mainly as a settler with little biological activity and mostly accumulation of the removed COD (I). Even so, the process was most likely more efficient than conventional septic tank due to the upflow mode filtering the wastewater through the sludge bed instead of mere settling. At higher temperatures (>14 °C), CODdis removal, biogas production, and degradation of the accumulated solids increased.
In all studies conducted, temperature (10–20 °C) had little effect on CODt and solids removal from UASB-septic tanks, but with the most concentrated (mixture of black water and kitchen waste, black water from vacuum toilets) and

55
complex (dairy parlour wastewater) wastewaters, CODdis removal decreased if only one reactor phase was used. With two-phased UASB-septic tanks, however, phase 2 compensated for the decreased removal of phase 1 and the quality of final effluent remained the same as at higher temperatures (20 °C).
The lower temperatures (10°C) did increase sludge bed growth with discontinuous and thus more vigorously mixing feeding (III), while with slow, continuous feeding sludge bed growth was constant and slow at all temperatures applied (II). Apparently, slower hydrolysis at low temperatures resulted in higher accumulation of particulate matter and thus increased sludge bed growth, while the slow, continuous feeding improved sludge settleability.
Decreasing temperature decreased methane production with dairy parlour wastewater (II), discontinuously fed synthetic black water, and mixture of black water and kitchen waste (III), though with continuously fed synthetic black water it remained rather constant despite the temperature (II). In pilot studies, somewhat less methane was also produced at the lower temperatures (<20 °C) than at the highest temperature applied, 25 °C (I).
COD mass balances of the two-phased laboratory UASB-septic tanks calculated over the two-phased process from influent to final effluent show that most of the removed COD was accumulated into the reactor (44–76 %; Fig. 15) as particulate matter which degraded gradually. Less than 10 % of influent COD remained in the final effluent with synthetic black water (II, III) as well as the mixture of black water and kitchen waste (III), while with dairy parlour wastewater, 13–20 % of influent COD remained in final effluent (II). Conversion of influent COD to methane (including dissolved methane) was the highest with the mixture of black water and kitchen waste with estimated value of 44 % at 20 °C (estimated with the measured results from 10 °C) and 29 % at 10 °C (Fig. 15). With dairy parlour wastewater, 36 % of influent COD was converted to methane at 20 °C, but at 15 and 10 °C, conversion decreased to approximately 20 %. With continuously fed synthetic black water (II), 20 % of influent COD was converted to methane at all applied temperatures, while the respective result with discontinuous feeding (III) was 30 % at 20 °C and 14 % at 10 °C. The results were similar with pilot UASB-septic tanks (I), which accumulated 37–58 % of influent COD and converted 1–25 % to methane, while 20–40 % remained in the effluent.
When comparing the present results to earlier studies, COD removals were higher than those reported for UASB-septic tanks at 5–20 °C (Bogte et al. 1993; Table 6) and those expected from UASB-septic tanks treating black water at 5–20 °C (52–54 % CODt and 71–86 % CODss removal; Zeeman & Lettinga 1999). Moreover, the removals were similar to those reported for black water treatment in tropical conditions (>20 °C) with similar OLR (Lettinga et al. 1993) and for an anaerobic hybrid (AH) –septic tank (a combination of UASB-septic tank and anaerobic filter) treating concentrated sewage at 13 °C with higher OLR (Elmitwalli et al. 2003). Also, the COD removals from the mixture of black water and kitchen waste were comparable or higher than in earlier studies with accumulation systems (Kujawa-Roeleveld et al. 2003; Elmitwalli et al. 2005) and

56
a single UASB-septic tank (Table 6; Kujawa-Roeleveld et al. 2005), though in the earlier studies, temperature was higher (15 and 25 °C) and the mixture more concentrated (vacuum toilets).
0 %
20 %
40 %
60 %
80 %
100 %
BW
(2
0 °C
)
BW
(1
5 °C
)
BW
(1
0 °C
)
DP
WW
(20
°C)
DP
WW
(15
°C)
DP
WW
(10
°C)
BW
(2
0 °C
)
BW
(1
0 °C
)
BWK
W(2
0 °C
)
BWK
W(1
0 °C
)
Methane
Accumulated
CODdis in effluent
CODcol in effluent
CODss in effluent
FIGURE 15 COD mass balance, as percentage of the average CODt in influent, of
laboratory two-phased UASB-septic tanks calculated from influent to final effluent (first six columns: II; last four columns: III). BW =synthetic black water; DPWW = dairy parlour wastewater; BWKW = mixture of black water and kitchen waste. Methane production of BWKW at 20 °C is estimated with measured results from 10 °C, others were measured.
One reason for the high COD removals achieved in the laboratory experiments (II, III) may be the synthetic origin of the black water used, which differed from authentic black water e.g. due to somewhat lower BOD/COD ratio, nitrogen concentration, and N/P ratio of the synthetic black water (Mahmoud et al. 2004). However, biomass adaptation to the low temperatures may also have contributed to the high removals as noticed with improved CODdis removal from black water at 15 and 10 °C as compared to initial 20 °C (II) and improved CODdis removal from black water in long-term UASB-septic tank operation (1st year vs. 13th year of operation; I). The SMAs of reactor sludges were, however, always the highest at the highest temperature applied (II, III) indicating psychrotolerant, not psychrophilic population in the sludges, as also reported elsewhere (Rebac et al. 1995; Kettunen & Rintala 1998; Langenhoff & Stuckey 2000). Temperatures lower than 10 °C were not applied during reactor experiments, but one set of batches were incubated at 5 °C (II). Sludge from phase 1 of UASB-septic tank treating black water started methane production without long lag indicating possibility to treat black water also at 5 °C. With more complex dairy parlour wastewater, however, the lag was considerably longer and the produced volume of methane lower.
The upflow mode of UASB-septic tank proved efficient at removing suspended solids by filtering the wastewater through the sludge bed. As this was mostly performed in phase 1 and the accumulated solids were not completely degraded, sludge bed growth was self-evident. The increase in sludge bed growth of discontinuously fed phase 1 of black water alone and in

57
combination with kitchen waste at 10 °C (III) was apparently due to slower degradation of the accumulated solids as compared to that at 20 °C (Elmitwalli et al. 2003; Kujawa-Roeleveld et al. 2005). Improvements of 10 and 22 % in CODt and CODss removal, respectively, were achieved with the application of two-phased AH-septic tank as compared to UASB-septic tank as such (Elmitwalli et al. 2003). On the other hand, similar COD removals were also accomplished with the current two-phased UASB-septic tanks, especially with CODss, as long as desludging frequency was short enough, thus arguing for proper design rather than application of more complicated reactor set-up. Feeding scheme may also affect the sludge bed growth as with slow, continuous feeding sludge bed of UASB-septic tank phase 1 treating black water grew slowly at all applied temperatures with no need for desludging during the 398-day-experiment (II). Moreover, with dairy parlour wastewater both reactor phases and with each phase 2, the sludge bed remained at 20 % of reactor volume throughout the study periods (II, III). On the contrary, discontinuous, more vigorously mixing feeding seemed to decrease sludge settleability with higher sludge bed growth with black water.
The partial degradation of the accumulated solids led to unstabilised reactor sludges (II, III), as blank batches with sludge alone still produced methane (II, III). Sludges from phases 2 were somewhat better stabilised with lower SMA and methane volumes, but sludges from phases 1 contained more undegraded organic matter and produced more methane, as also found in single UASB-septic tanks (Kujawa-Roeleveld et al. 2005). Methane production from unfed phases 1 of synthetic black water and mixture of black water and kitchen waste treatment at 10 °C (III) further indicated partial stabilisation of the reactor sludges. Still, the unstabilised fraction of sludge beds was partly influent fed directly before drawing sludge or stopping feeding, and it did not have enough time to degrade within the reactor. Nevertheless, to ensure complete stabilisation, either an unfed period prior to desludging or longer SRT are needed at low temperatures.
The highest methane production was achieved with the mixture of black water and kitchen waste as expected and also reported earlier (Kujawa-Roeleveld et al. 2005). When comparing the present results to those reported by Kujawa-Roeleveld et al. (2005) for UASB-septic tanks and Kujawa-Roeleveld et al. (2003) for accumulation systems, methane production is higher from UASB-septic tanks than from accumulation systems, indicating also higher degree of sludge stability in UASB-septic tanks. Thus, if the produced methane is to be recovered and utilised for energy, more concentrated wastewaters and UASB-septic tanks are preferred. Moreover, two-phased UASB-septic tank is more suitable for concentrated and complex wastewaters at low temperatures to ensure the highest possible degree of stabilisation (wastewater and sludge) and methane production, as with them, hydrolysis becomes rate-limiting and only part of the accumulated solids are hydrolysed and thus further degraded to methane (Elmitwalli et al. 2003).

TABLE 6 Comparisons between present and earlier studies with UASB-septic tanks (UASBst), accumulation systems (AC), and anaerobic
hybrid–septic tanks (AHst).
Removal (%) Reactor Wastewater Temp (°C)
HRT (d)
OLR (kgCOD/m3d) CODt CODss CODcol CODdis
Ref.
UASBst Black water (BW)
5–13 14–17
4.3 0.43 65 33
83 59
n.d. 10b -24b
I
UASBst BW 14–19 4.1 0.89 70 71 n.d. 53b I UASBst BW 15 29 0.33 61 80 n.d. -31b I UASBst BW 25 29 0.42 78 79 n.d. 51b I UASBsta BW 10 4.4 + 1.4 0.301 94 98 50 71b II UASBsta Dairy parlour
wastewater 10 3.5 + 1.5 0.191 82 86 62 70 II
UASBsta BW 10 2.9 + 1.2 0.41 91 98 35 26 III UASBsta BW + kitchen waste 10 3.4 + 1.2 0.62 91 98 28 71 III UASBst BW >20 15 0.37 90–93 n.d. n.d. n.d. Lettinga et al. 1993 UASBst Domestic sewage >20 1.4 0.96 67–77 n.d. n.d. n.d. Lettinga et al. 1993 UASBst Grey water 14 1.8 0.53 31 9 n.d. 47b Bogte et al. 1993 UASBst Grey water 13 2.4 0.34 4 6 n.d. -1b Bogte et al. 1993 AHst Strong sewage 13 2.5 1.44 94 98 74 78 Elmitwalli et al. 2003 AC BW + kitchen waste 20 150 - 34 n.d. n.d. n.d. Kujawa-Roeleveld et al. 2003 AC Faeces + kitchen
waste 20 150 - 61 n.d. n.d. n.d. Kujawa-Roeleveld et al. 2003
UASBst BW + kitchen waste 25 29 0.85 82 94 n.d. n.d. Kujawa-Roeleveld et al. 2005 AC BW 20 105 n.d. 58 n.d. n.d. n.d. Elmitwalli et al. 2005 AC BW + kitchen waste 20 105 n.d. 58 n.d. n.d. n.d. Elmitwalli et al. 2005 atwo-phased; bCODcol+dis; n.d. = not detected

59
The present study is apparently the first on anaerobic treatment of dairy parlour wastewater (II). Earlier studies with cow-house wastewater (including beddings, manure, and dairy parlour wastewater; Craggs et al. 2003; McGrath & Mason 2004), milk processing wastewater (Omil et al. 2003; Ramasamy et al. 2004), and synthetic dairy wastewater (Dague et al. 1998; Angenent et al. 2001) indicated feasibility of anaerobic treatment for different dairy wastewaters. The present results further prove the feasibility of two-phased UASB-septic tanks in dairy parlour wastewater treatment with efficient COD removals. Dairy parlour wastewater is usually warm to hot (e.g. washing temperature 40–80 °C in the present farm; II), wherefore good insulation and short sewage from dairy parlour to the treatment system would ensure high treatment temperature. Thus, present treatment temperatures of 10–20 °C may be lower than in practise. However, the possibility of metal precipitation during anaerobic treatment of dairy parlour wastewater should be taken into account. To avoid the wash out of the precipitates or their formation, pH control and periodic replacement of reactor sludges may be needed (Kettunen & Rintala, 1998).
Nutrient removal was also detected in two-phased UASB-septic tanks. 30–40 % of nitrogen (63 % from continuously fed black water) and 60–90 % of phosphorous were removed from black water and the mixture of black water and kitchen waste (II, III) along with accumulated suspended solids and possibly also due to precipitation to e.g. struvite (NH4MgPO4; Loewenthal et al. 1994). However, from dairy parlour wastewater only 17 and 13 % of nitrogen and phosphorous, respectively, were removed, indicating non-optimal conditions for struvite formation in the process. Ammonification was efficient at 20 °C with nearly all Ntot converted to ammonium nitrogen, as also reported earlier (Kujawa-Roeleveld et al. 2005). At 10 °C, however, ammonification slowed down along with the other reactions.
Discharge requirements are often given as mg/l without any attention to discharge volume (e.g. discharge requirements in the Netherlands: IBA Manual 2001). However, when comparing discharged volumes from vacuum toilets to those from conventional toilets, the difference is significant. Comparison of CODt discharged from the different pilot UASB-septic tanks (I) showed that the two 0.2 m3 UASB-septic tanks, though with the highest CODt in effluent (15°C: 3700 mg/l; 25 °C: 2750 mg/l), actually discharge the least CODt/flush (flush volume 1 l). During the 1st year operation of the 1.2 m3 UASB-septic tank, flush volume was 10 l, thus discharged amount of CODt is ten times CODt in effluent, 6000 mgCODt/flush (low temperature period) and 11500 mgCODt/flush (warmer period). In the 13th year, flush volume was 6 l, thus six times the CODt in effluent results to 5200 mgCODt/flush. Therefore, measuring the requirements for COD removal in mg/l may not always be the best way to ensure low environmental impacts in the receiving waters.

60
5.2 Post-treatment of anaerobic effluents in moving bed biofilm reactors
MBBR was found effective in nitrogen removal from effluents of two-phased UASB-septic tanks treating dairy parlour wastewater at 10 °C and mixture of black water and kitchen waste at 20 °C (IV). With anaerobically treated dairy parlour wastewater, both MBBRs removed 51–61 % of Ntot, while with mixture of black water and kitchen waste, the removal was 47–55 %. Complete nitrification was achieved if sufficient aeration (length and DO) was provided, while denitrification was limited by lack of carbon as indicated by instant increase of Ntot removal to 83 % after acetate addition. Also, COD removal was efficient (40–70 %) leaving little COD (40–80 mg/l) and less than 6 mg BOD7/l in all effluents. Moreover, intermittent aeration enabled nitrogen removal in single reactor and short aeration was sufficient for nitrification, thus decreasing construction and operational costs. Further, as continuous and sequencing batch MBBR were shown as efficient in nitrogen and COD removal, the simpler continuous MBBR may be more suitable for on-site applications.
All ammonium nitrogen was removed when DO concentration was 2.0–3.5 mg/l as also reported in earlier studies (Rusten et al. 1994; Ødegaard et al. 1994; Pastorelli et al. 1997). The aeration period, however, also had to be sufficient long with minimum of 1.0 h with continuously fed MBBR3 and 2.0–2.5 h with sequencing batch fed MBBR4, both treating anaerobically treated mixture of black water and kitchen waste. With anaerobically treated dairy parlour wastewater, aeration of 0.5 h was sufficient for complete nitrification as long as DO was higher (9.0 mg/l). The low temperature of 10 °C did not apparently restrict nitrification, though it is below optimum (30–35 °C; Metcalf & Eddy 1991). pH of 6.9–8.5 and influent alkalinity of 255 mgCaCO3/l were sufficient for nitrification of anaerobically treated mixture of black water and kitchen waste (optimum pH >6.5; Carrera et al. 2004), while with anaerobically treated dairy parlour wastewater, buffering was needed (pH 5.6 and effluent alkalinity 15 mgCaCO3/l at the lowest).
Denitrification was apparently restricted by lack of carbon with both post-treated wastewaters resulting in 50–60 % Ntot removal. With anaerobically treated mixture of black water and kitchen waste, this was confirmed by carbon (acetate) addition to the reactors instantly increasing Ntot removal to 83 %. Carbon addition was performed according to optimal COD/N ratio (g/g) determined in batch assays (14.2). To minimise operational costs (Rusten et al. 1997; Loukidou & Zouboulis 2001) and to retain the microbial populations as such (Metcalf & Eddy 1991) somewhat lower COD/N ratios were chosen: 11 for continuously operated MBBR3 and 12 for sequencing batch operated MBBR4. The original COD/N ratio (2.7–5.1) of the treated wastewaters should have been sufficient for denitrification (minimum COD/N ratio 3–5; la Cour Jansen 1997), but apparently carbon was not readily available for denitrification but bound in solid particulates. Thus, CODdis values should have been higher. As

61
external carbon addition increases operational costs and complexity of the treatment system, it is not desirable for on-site applications. A better way to ensure sufficient carbon in post-treated anaerobic effluents is to optimise the COD removal of the anaerobic unit (Elmitwalli et al. 2001; Kalyuzhnyi et al. 2003; Kalyuzhnyi & Gladchenko 2004). For example with black water, phase 2 of the UASB-septic tanks could be replaced with the post-treatment system. At low temperatures, some methane is also dissolved in effluents, which may be used as carbon source by denitrifying bacteria (Khin & Annachhatre 2004).
COD removal was also efficient in all MBBR leaving less than 50 mgCODt/l in final effluent of dairy parlour wastewater and less than 100 mgCODt/l in final effluent of mixture of black water and kitchen waste. The residual COD may still contain aerobically degradable organic matter, as the DO and length of aeration were low. Some phosphorous removal was also noticed, though it was not attempted. Phosphorous removal could be enhanced with simple precipitation to UASB-septic tanks, though biological phosphorous removal has been successfully applied in MBBR (Pastorelli et al. 1997, 1999; Helness & Ødegaard 2001). The process might, however, be too complicated for on-site solutions.
When considering the combination of two-phased UASB-septic tank and MBBR, overall removals were above 90 % of CODt, 88 % of CODdis, 99 % of BOD7, and 65–70 % of Ntot. These are sufficient for the new Finnish requirements for wastewater treatment outside centralised treatment plants (Government Decree 542/2003), in which removals of 90 % for BOD7 and 40 % for nitrogen are required. Moreover, removal requirement for phosphorous (85 %) was nearly accomplished with 80 % removal without any attempt to even remove it.
5.3 Acidogenesis and fermentative hydrogen production in UASB reactors
Acidogenesis to VFA and potential for fermentative hydrogen production was studied in six UASB reactors with different inocula and substrates at 20 °C (V). Acidogenesis to acetate, propionate, butyrate, and valerate was detected in UASB reactors fed with the mixture of black water and kitchen waste, but no hydrogen was produced either with inoculum sludge as such or with heat-pre-treatment. With synthetic black water, little VFA and no hydrogen were produced. With glucose addition, however, all three UASB reactors produced hydrogen with the highest volume from UASB-septic tank sludge as such (maximum 0.36 mol H2/mol glucose) and with heat-pre-treatment (maximum 0.44 mol H2/mol glucose). Primary sludge from municipal wastewater treatment plant produced very little hydrogen (maximum 0.08 mol H2/mol glucose). Glucose addition also produced VFA with acetate and butyrate in the highest concentrations.

62
Apparently synthetic black water contained too little readily available, i.e. soluble carbohydrates for hydrogen producing bacteria, as also noticed with domestic wastewater (van Ginkel et al. 2005). van Ginkel et al. (2005) concentrated the domestic wastewater by rotoevaporation at 100 °C, but such actions would be costly and laborious for on-site applications. Thus, black water alone may not be readily suitable for fermentative hydrogen production at least in preferably simple on-site solutions. Further studies for fermentative hydrogen production from black water are needed.
Mixture of black water and kitchen waste may, however, have more potential for fermentative hydrogen production as it is more biodegradable (kitchen waste biodegradability >90%; Veeken & Hamelers 1999), contains more carbohydrates, and is readily fermented to VFA. The mixture was, however, presently degraded to acetate and propionate and not acetate and butyrate, which have been reported to give the highest hydrogen yields (4 mol H2/mol acetate; 2 mol H2/mol butyrate; Claassen et al. 1999; Hawkes et al. 2002; Levin et al. 2004; Noike et al. 2005). In fact, propionate has been reported to give no hydrogen at all (Hawkes et al. 2002; Noike et al. 2005). Propionate is produced when the substrate contains little carbohydrates or the reactor is under starvation (Noike et al. 2005), wherefore a shorter HRT and thus higher OLR may have switched acidogenesis to the route of acetate and butyrate and subsequent production of hydrogen from the mixture of black water and kitchen waste. With synthetic black water alone, this may not have helped, since the ratio of solids/readily hydrolysed matter is high and during a shorter HRT, no acidogenesis would have time to occur. Moreover, conversion to acetate and hydrogen may have been improved if hydrogen partial pressure had been ensured to remain low e.g. with N2/CO2 sparging (Shizas & Bagley 2005).
The inocula used were capable of hydrogen production as proved with glucose addition. Under optimal conditions, also the untreated inocula ceased methane production and produced only hydrogen and carbon dioxide. However, the optimal conditions seem to be difficult to find and all reported studies give different optima for pH, HRT, temperature, etc. It has been said that methanogenic activity ceases at pH below 5.5 (Shizas & Bagley 2005) or below 5.0 (Ren et al. 2004) but in the present study, methane was still produced at pH 5.0 from the mixture of black water and kitchen waste. Moreover, pH 6.0, which has sometimes been reported optimal for hydrogen production (Lay et al. 2005), was found too high for acidogenesis and hydrogen production, since methane was produced during black water addition. During glucose addition, pH dropped spontaneously to 3.8–4.6 with subsequent hydrogen production and complete cease of methane production. Such a low pH has, in fact, been reported inhibitive to hydrogen producing Clostridia (van Ginkel et al. 2001), though elsewhere pH of 4.2–4.5 has been reported suitable for hydrogen production (Ren et al. 2004).
Batch assays revealed another problem concerning hydrogen production in batches with black water as substrate. Black water contains methanogens and

63
other hydrogen consumers which should be inhibited in some way. Heat- or some other pre-treatment of the wastewater is not reasonable (Hawkes et al. 2002), wherefore operational parameters should be such that inhibit methanogenic activity. In continuous processes, this can be fairly well ensured with short HRT and low pH, but in batch processes, methanogens will eventually grow, as shown in the present assays with methane production in time even with heat-treated inocula. Moreover, autotrophic acetate producers should also be inhibited since they also consume hydrogen. In the present batch assays with hydrogen headspace and mere inoculum without pre-treatment, hydrogen was consumed to acetate, as its concentration increased and no methane was produced.
At the moment, fermentative hydrogen production is still inefficient and long-term studies are lacking, wherefore mere hydrogen production may be too expensive and laborious (de Vrije & Claassen 2003; Angenent et al. 2004), especially for on-site applications. However, in combination with methane production, i.e. hydrogen production followed by a methanogenic stage, hydrogen production may be reasonable and applicable in the near future (de Vrije & Claassen 2003; Angenent et al. 2004; Benemann et al. 2004; Ren et al. 2004). Combination of hydrogenogenic UASB reactor and methanogenic UASB-septic tank may thus provide both waste(water) stabilisation and renewable energy in on-site applications. Apparently, community-on-site application would at least energy-wise be more profitable than house-on-site solutions, as with hydrogen producing stage, more monitoring to ensure optimal conditions is needed (Hawkes et al. 2002) than with mere wastewater treatment and methane production.
5.4 On-site waste(water) treatment using anaerobic technologies
House- and community-on- site anaerobic waste(water) treatment is feasible with high COD and suspended solids removal, partial removal of nutrients from effluent, and preservation of removed nutrients in reactor sludge. Both in house-on-site (Fig. 16) and community-on-site (Fig. 17) solutions, all organic waste(water) streams from households (also dairy farms) can be treated anaerobically e.g. in single-or two-phased UASB-septic tanks, while the more diluted grey water is treated in an aerobic system prior to discharge. In case nutrient removal is required, anaerobically treated wastewaters can be post-treated with grey water in the aerobic process proven efficient in nitrogen and residual COD removal. If nutrient removal is not required, anaerobic effluents can be used in fertilising and irrigation of gardens and fields with additional fertiliser and soil improvement from the reactor sludges. Pathogen removal and hygienisation of the sludge can also be organised, as often required by law. Produced methane can be utilised as heat (and electricity: especially community-on-site). In community-on-site applications, fermentative hydrogen production in UASB reactors prior to UASB-septic tank may also be possible.

64
Black water (conventional flush toilets) ~1 gCODt/l ~16 mgP/l ~36 mgN/l
Grey water Kitchen waste 268 gTS/l 244 gVS/l
Nonbiodegradable solid waste
Landfill
Anaerobic treatment (COD removal; Partial nutrient removal)
Aerobic treatment (Removal of nutrients, pathogens, and COD; Post-treatment)
Discharge: BWKW - 61 mgCODt/l 2 mgP/l 17 mgN/l
Biogas (CH4)
Mixture: 30 l BW/person/d; 0.2 kg KW/person/d ~2 gCODt/l ~17 mgP/l ~45 mgN/l
Irrigation and fertilisation/ Post-treatment: BW - 70 mgCODt/l 1 mgP/l 17 mgN/l BWKW - 185 mgCODt/l 6 mgP/l 29 mgN/l (Hygienisation + )
Sludge for fertilising and soil improvement
FIGURE 16 Proposed scheme of house-on-site treatment of waste(waters) from individual
households. The COD and nutrient values are from the present study and present estimations of authentic situations at 10–20 °C in Finland.

65
Anaerobic treatment (COD removal; partial nutrient removal) Hydrogenogenic UASB + methanogenic UASB-septic tank
(Hygienisation +) Sludge for fertilising and soil improvement
Aerobic treatment (Nutrient, pathogen, and COD removal; Post-treatment)
Discharge: 61 mgCODt/l 2 mgP/l 17 mgN/l
Black water + kitchen waste: 2 gCODt/l 17 mgP/l 45 mgN/l
Grey water
Irrigation and fertilisation/ Post-treatment: 185 mgCODt/l 6 mgP/l 29 mgN/l
Biogas (CH4, H2)
FIGURE 17 Proposed scheme of community-on-site treatment of waste(waters) from a
small community. The COD and nutrient values are from the present study and present estimations of authentic situations at 10–20 °C in Finland.

6 CONCLUSIONS
The results obtained in this study indicate the feasibility of anaerobic on-site wastewater treatment in UASB-septic tanks at low temperatures of 10–20 °C, as defined by over 90% BOD7 and CODt, 98 % CODss, and 70 % CODdis removals (HRT 3–4 d; OLR 0.2–0.9 kgCODt/m3d). Treatment of different wastewater is possible with black water, dairy parlour wastewater, and a mixture of black water and kitchen waste treated during this study. Moreover, post-treatment such as intermittently aerated moving bed biofilm reactor suffices for removal of nitrogen and residual organic matter, if required. Production of renewable energy as hydrogen from UASB reactors may also be possible in case black water and kitchen waste are treated together and community-on-site scale is used.
With concentrated and complex wastewaters, such as mixture of black water and kitchen waste, black water from vacuum toilets, and dairy parlour wastewater, two-phased UASB-septic tank is beneficial for low-temperature conditions compared to single-phased process. With the two-phased process, most of suspended solids can be removed in phase 1 while phase 2 removes the produced colloidal and dissolved organic fractions. Phase 1 thus provides also storage and stabilisation of the produced sludges resulting in higher methane production than that of phase 2. Single UASB-septic tank may suffice for treatment of black water from conventional toilets, especially if a post-treatment process for nitrogen removal is applied.
The high removal of suspended solids in phase 1 results in sludge bed growth which should be considered when designing UASB-septic tanks. Phase 1 (or the single reactor) should be large enough to ensure long SRT and long frequency for desludging the process. This will also ensure stability of the sludge when discharged. Moreover, feeding mode of the UASB-septic tank may have an effect on sludge bed growth and COD removal, as discontinuous feeding quickly at a time mixes the sludge bed vigorously and should be

67
optimised to provide sufficient mixing along with biogas production without endangering sludge settling and the contact between sludge and wastewater.
Removal efficiencies of UASB-septic tanks seem enhance over time, whereas the 1st year operation may still be somewhat variable with respect to COD removals due to adaptation to low temperatures. This can be overcome with high quality inoculum adapted to the temperatures and wastewaters used.
Approximately 14–44 % of influent CODt was converted to methane with the highest conversion in treatment of mixture of black water and kitchen waste at 20 °C and the lowest in treatment of discontinuously fed black water at 10 °C. Methane production decreased with decreasing temperature, whereas COD removals remained unaffected. Thus, during colder periods, UASB-septic tank works more as a settler with somewhat decreased biological activity and higher accumulation of removed COD, while at higher temperatures, biological activity increases and also the accumulated COD is converted to methane. If energy (methane) is of interest in UASB-septic tanks, the mixture of black water and kitchen waste is the most suitable for substrate with highest conversion of COD to methane.
Intermittently aerated moving bed biofilm reactors removed 50–60 % of nitrogen and 40–70 % of CODt from anaerobically treated dairy parlour wastewater and mixture of black water and kitchen waste (HRT 2–3 d; OLR 0.02–0.09 kgCODt/m3d; NLR 0.014–0.021 kgN/m3d). Complete nitrification was accomplished with short aeration period (min. 1.0 h of 6.0 h cycle with continuously fed MBBR; 2.0–2.5 h of 8.0 h cycle with sequencing batch operated MBBR) and 2.0–3.5 mgDO/l. Denitrification removed 50–60 % of oxidised nitrogen despite apparent lack of carbon. With acetate addition, Ntot removal was instantly increased to 83 % with anaerobically treated mixture of black water and kitchen waste. Thus, pre-treatment in UASB-septic tank should be optimised to retain sufficient carbon in effluent to ensure denitrification. Intermittent aeration successfully enabled complete nitrogen removal in single reactor, while both continuous and sequencing batch operated processes proved as efficient giving the continuous process advantage for on-site solutions as the simpler process.
The combination of two-phased UASB-septic tank and moving bed biofilm reactor removed over 92 % of CODt, 88 % of CODdis, 99 % of BOD7, 80 % of Ptot, and 65–70 % of Ntot, thus proving an efficient combination for on-site wastewater treatment. The achieved removals for BOD7 and nitrogen were sufficient for the Finnish legislation concerning wastewater treatment on rural areas (90 % of BOD7, 40 % of N), and also phosphorous removal was close to the requirement (85 %) despite it was not particularly attempted. However, the discharged volume should be considered to ensure low environmental impacts to the receiving waters instead of usual treatment requirements merely given as mg/l without a thought to the discharged volume.
Sludges from UASB-septic tanks were shown suitable for inocula to fermentative hydrogen production, while mixture of black water and kitchen waste may have potential as a substrate. Synthetic black water alone apparently

68
contains too little readily soluble carbohydrates which the hydrogen producing bacteria prefer. The mixture of black water and kitchen waste, however, contain more carbohydrates and with optimal conditions may produce hydrogen in continuous UASB reactors at 20 °C. A combination of hydrogenogenic UASB reactor and methanogenic UASB-septic tank may thus be used for production of renewable energy as hydrogen and methane some time in the future. Community-on-site scale is, however, more suitable than house-on-site scale, as hydrogen production needs more monitoring to ensure optimal conditions than mere anaerobic wastewater treatment to methane.

69
Acknowledgements
This Ph.D. thesis could not have been accomplished without the help, co-operation, and support from several invaluable people. Firstly, my sincerest thanks to Prof. Jukka Rintala, my supervisor, for all his hard work. I am indebted to you for hiring me long ago as laboratory assistant, taking me through M.Sc. thesis, and further to this Ph.D. thesis. Thank you for believing in me and giving me all these once-in-a-lifetime opportunities. My sincerest thanks also to Prof. Jules van Lier for giving me the opportunity to visit the excellent research group of Environmental Technology at Wageningen University, the Netherlands. My deepest gratitude to Wendy Sanders, Katarzyna Kujawa-Roeleveld, and Grietje Zeeman for the work they did with me during my stay in the Netherlands and for co-authoring one of the papers in this thesis. Working with you was not only fruitful and interesting, but also so much fun. Sincerest thanks also to my other co-authors: Outi Ronkainen, Lara Valentín, and Sami Luste as well as to my laboratory assistants Anni Pursiainen and Hanne Tähti. I could not have managed all the work without you. I would like to acknowledge Markku and Mari Ruuska for collecting dairy parlour wastewater for numerous times and for letting me use it in my studies. Sincere thanks also to office and technical personnel of the Department of Biological and Environmental Science. I am also indebted to Prof. Adrianus van Haandel and Dr.Tech. Riitta Kettunen for reviewing this thesis.
My heartfelt thanks to everyone at “Ymppi” (i.e. Environmental Science section) for all your help, support, and hilarious moments during my years with you. I cannot name you all, or this thesis would be miles longer. Please, just know that each and everyone of you will be thought of with friendship and gratitude. Special thanks to our laboratory technician Leena Siitonen for your invaluable ability to maintain some order in the chaos and to Anni Lehtomäki for accompanying me on several great trips to congresses and courses and for being a good friend. Thank you also for all the international friends I made during my stay in the Netherlands and in congresses. I feel so much richer as a person for having friends in Brazil, Argentina, Jordan, the Netherlands, Sweden, Denmark, etc. Special thanks to Katja Grolle for her friendship and shared liking in cats. Thank you also to my friends outside research for being there. An escape from the Ph.D. was always most welcome. Special thanks to Hanna for always being there, listening patiently to all my sorrows, problems, and complaints as well as rejoicing with me during moments of happiness and success.
I am increasingly grateful to my parents for everything they have done for me. Thank you for the never-ending support, help, and love you have always given me. You have never pushed me, never given any pressure, but just always been there for me. You mean the world to me.
My deepest gratitude is also extended to my sister Marjo and her family. The friendship we share is so special and something I depend on. We take care of each other in ways that cannot be described, and I miss you all every time we

70
are apart. Very special thanks to Samuel and Sofia for being such cuties. I cannot help but be happy with your little faces smiling at me and your hands hugging me tight.
And lastly, my own little family: thanks to Namu for all the purring and well-needed distraction from work. If a cat could be awarded Ph.D., Namu would earn it: she has already helped two students to achieve the degree. And most of all, thank you, Tuomas, for everything. There are no words to how much you mean to me. Thanks for putting up with my mood-swings and completely unnecessary nagging when under pressure. Thanks for all your help, support, and love. I could not have managed this, or much of anything, without you. I love you.
This research was supported by Maj and Tor Nessling’s Foundation, University of Jyväskylä, Nordic Energy Research Programme project: Biohydrogen, Maa- ja vesitekniikan tuki ry, Nuffic (Netherlands organization for international cooperation in higher education), and Finnish Graduate School for Environmental Science and Technology (EnSTe).

71
YHTEENVETO (RÉSUMÉ IN FINNISH)
Jätevesien kiinteistö- ja kyläkohtainen anaerobinen käsittely alhaisissa läm-pötiloissa
Tässä väitöstyössä tutkittiin hajautettua jätevesien käsittelyä alhaisissa lämpöti-loissa anaerobisia tekniikoita hyödyntäen. Jätteiden ja jätevesien anaerobinen käsittely mahdollistaa sekä jätemateriaalin stabiloinnin, uusiutuvan energian tuotannon metaanina ja/tai vetynä että arvokkaiden yhdisteiden, kuten ravin-teiden, uudelleenkäytön. Käsittely voidaan toteuttaa keskitettynä suurissa yksi-köissä tai hajautettuna kiinteistö- tai kyläkohtaisissa prosesseissa, joista jälkim-mäisten etuna on myös kuljetustarpeen sekä fossiilisten polttoaineiden kulu-tuksen minimointi. Näin ollen hajautettu anaerobinen jätevesien ja orgaanisten jätteiden käsittely voi tarjota haja-asutukselle yhdistettynä jäte- ja jätevesihuol-lon, uusiutuvan energian tuotantomahdollisuuden sekä ravinteiden talteenoton ja uudelleenkäytön. Mikäli ravinteiden uudelleenkäyttö ei ole mahdollista (esim. hygieniamääräykset) ja ravinteiden poistoa vaaditaan, se voidaan toteut-taa aerobisessa jälkikäsittelyprosessissa.
Lauhkean ja kylmän ilmaston maissa monien jätevesien lämpötilat ovat usein alhaisia, mitä on pidetty ongelmallisena anaerobiselle käsittelylle. Useat tutkimukset ovat kuitenkin todistaneet väitteen vääräksi, ja käsittely onnistuu, kunhan alhainen lämpötila huomioidaan prosessien suunnittelussa ja operoin-nissa. Tärkeitä tekijöitä ovat mm. riittävän pitkä lieteikä ja viipymä sekä sopi-van lieteympin käyttäminen käsittelyä aloitettaessa.
UASB-saostuskaivo (upflow anaerobic sludge blanket) on yksi vaihtoehto hajautetulle anaerobiselle jätevesien käsittelylle. Se muistuttaa UASB-reaktoria, sillä jätevesi virtaa alhaalta ylöspäin pohjalla olevan lietepatjan läpi. Tämä pa-rantaa lietteen ja jäteveden kontaktia ja tehostaa sekä kiinteän että liuenneen orgaanisen aineen poistoa. Lieteikä ja jäteveden viipymä ovat erilliset: lieteikä on pitkä (kuukausia, jopa vuosia), kun taas viipymä korkeintaan muutamia päiviä. Perinteisen saostuskaivon tapaan UASB-saostuskaivo siis varastoi muo-dostunutta lietettä, mutta koska liete on biologisesti hyvin aktiivista, se myös stabiloituu tehokkaasti. Muodostunut biokaasu (metaani) kerätään hallitusti ja käytetään energiana riippuen muodostuneesta biokaasumäärästä.
Ravinteiden poistoa vaadittaessa jatkokäsittelymahdollisuuksia on useita maasuodatuksista pienpuhdistamoihin. Yksi mahdollisuus on vaiheittaisesti ilmastettu kantajakappaleprosessi (moving bed biofilm reactor), jossa mikrobit elävät muovisten kantajakappaleiden pinnalle kiinnittyneinä. Kantajakappaleita liikutetaan reaktorissa joko ilmastuksen tai mekaanisen sekoituksen avulla. Vaiheittaisella ilmastuksella mahdollistetaan nitrifikaatio ja denitrifikaatio yh-dessä reaktorissa, mikä vähentää sekä rakennus- että käyttökustannuksia.
Anaerobinen orgaanisen aineen hajoaminen tuottaa välituotteenaan vetyä, joka luonnollisissa prosesseissa kulutetaan heti mm. metaaniksi. Mikäli vedyn kulutus prosessissa voidaan estää, tämä fermentatiivinen vety voidaan kerätä uusiutuvan energian tuotantoa varten. Vetyä tuottavat mikrobit sietävät sitä

72
kuluttavia mikrobeja paremmin korkeita lämpötiloja ja alhaista pH:ta, minkä vuoksi lämpö- ja happokäsittelyjä on käytetty lieteymppien esikäsittelyssä ve-dyntuottokokeissa. Lisäksi vedyn tuottajat kasvavat nopeammin, ja lyhyt vii-pymä voi rikastaa niitä prosessiin vedyn kuluttajien huuhtoutuessa hidaskas-vuisina pois. Fermentatiivisen vedyntuottokokeissa on käytetty panos- että jat-kuvatoimisia prosesseja.
Tässä väitöstyössä tutkittiin kaksivaiheisia laboratorio- sekä yksivaiheisia pilot-UASB-saostuskaivoja alhaisissa lämpötiloissa (10–20 °C). Kaksivaiheiset prosessit havaittiin soveltuviksi synteettisen käymäläjäteveden, maitohuoneen jäteveden sekä käymäläjäteveden ja keittiöjätteen käsittelyyn. Ne poistivat yli 90 % kokonais-kemiallisesta hapenkulutuksesta (CODt), 98 % kiintoaine-COD:sta (CODss), 70 % liuenneesta COD:sta (CODdis) sekä yli 90 % biologisesta hapen kulutuksesta (BOD7) riippumatta käytetystä lämpötilasta (10, 15, 20 °C). Pilot-kokeissa yksivaiheiset UASB-saostuskaivot käsittelivät väkevämpää käy-mäläjätevettä poistaen 65 ja 70–80 % kokonais- ja kiintoaine-COD:sta vastaavas-ti. Liuennutta COD:ta muodostui aluksi, mutta sen poisto tehostui ajan myötä yli 50 %:iin alhaisessakin lämpötilassa (14–19 °C; ensimmäinen vs. 13. käyttö-vuosi). Alhaisissa lämpötiloissa (<14 °C) orgaanista ainetta poistui eniten liete-patjaan kertymisen vuoksi, kun taas korkeammissa lämpötiloissa (>14 °C) liet-teen biologinen aktiivisuus tehostui ja käsiteltävästä COD:sta suurempi osuus muunnettiin metaaniksi (saavutettu muuntomaksimi 44 % käymäläjäteveden ja keittiöjätteen seoksella 20 °C:ssa). Käymäläjäteveden ja keittiöjätteen seos sisälsi eniten orgaanista ainetta ja hajosi siis tehokkaasti metaaniksi, minkä vuoksi se soveltui myös tutkituista jätevesistä parhaiten energiantuottoon. Vaikka reakto-riin kertyvä COD hajoaa hiljalleen, sitä saattaa jäädä lietteeseen, jolloin liete on stabiloitava ennen jatkokäyttöä.
Tulosten mukaan perinteisissä vesivessoissa tuotettu käymäläjätevesi (huuhteluveden määrä 2–10 l/huuhtelu) voidaan käsitellä yksivaiheisissa UASB-saostuskaivoissa varsinkin, jos sitä seuraa jatkokäsittely typen poistami-seksi. Sen sijaan väkevät jätevedet (käymäläjätevesi vakuumivessoista, käymä-läjäteveden ja keittiöjätteen seos) sekä kemiallisesti monimutkaisemmat jäteve-det (maitohuoneen jätevesi) tulisi käsitellä kaksivaiheisissa UASB-saostuskaivoissa alhaisissa lämpötiloissa. Ensimmäisen reaktorivaiheen tehokas kiintoaineen poisto aiheuttaa lietepatjan kasvua, mikä on huomioitava reaktori-kokoa ja sopivaa lieteikää suunniteltaessa. Myös syöttötekniikkaan on kiinnitet-tävä huomiota, jotta syöttö sekoittaa lietepatjaa sopivasti, mutta myös varmis-taa lietteen hyvän laskeutuvuuden ja riittävän pitkän kontaktin lietteen ja jäte-veden välillä.
Anaerobisesti käsiteltyjen maitohuoneen jäteveden (10 °C) sekä käymälä-jäteveden ja keittiöjätteen seoksen (20 °C) jatkokäsittelyä tutkittiin vaiheittaisesti ilmastetuissa kantajakappaleprosesseissa. Prosessit poistivat 50–60 % kokonais-typestä ja 40–70 % jäljellä olevasta COD:sta. Täydellinen nitrifikaatio saavutet-tiin liuenneen hapen pitoisuudella 2.0–3.5 mg/l, kun ilmastusjakso oli riittävän pitkä, kun taas denitrifikaatio kärsi hiilenpuutteesta. Ulkoisen hiilen lisäyksellä (COD/N-suhde 11–12) käymäläjäteveden ja keittiöjätteen seoksen kokonaisty-

73
penpoisto nousi välittömästi 83 %:iin. Tämän vuoksi, mikäli anaerobista proses-sia seuraa biologinen typenpoisto ja typenpoisto on erityisen tärkeää, anaerobi-sen prosessin toiminta tulisi optimoida säilyttämään riittävästi hiiltä myös de-nitrifikaatiota varten.
UASB-saostuskaivon ja kantajakappaleprosessin yhdistelmä poisti yli 92 % kokonais-COD:sta, 88 % liuenneesta COD:sta, 99 % BOD7:sta, 80 % kokonais-fosforista ja 65–70 % kokonaistypestä. Suomen haja-asutuksen jätevesien käsit-telyvaatimuksia ajatellen (poistettava vähintään 90 % BOD:sta, 85 % fosforista ja 40 % typestä; laskennalliset arvot) puhdistustulos oli siis riittävä orgaanisen aineen ja typen osalta, kun taas fosforin poistoa ei edes tutkittu/optimoitu. Fos-fori voitaisiin kuitenkin esimerkiksi saostaa UASB-saostuskaivon yhteydessä käsittelyvaatimusten saavuttamiseksi.
Fermentatiivisen vedyntuottokokeissa käytettiin jatkuvatoimisia UASB-reaktoreita 20 °C:ssa. Käymäläjäteveden ja keittiöjätteen seos osoittautui poten-tiaaliseksi materiaaliksi fermentatiivisen vedyntuottoon. Se hajosi nopeasti ly-hytketjuisiksi rasvahapoiksi (VFA), mutta koska hajoamisolosuhteet eivät olleet optimaaliset vedyntuotolle (seos hajosi asetaatiksi ja propionaatiksi eikä halu-tusti asetaatiksi ja butyraatiksi), vetyä ei muodostunut. Synteettinen käymäläjä-tevesi puolestaan ei soveltune sellaisenaan materiaaliksi vedyntuottoon, sillä se sisältää vähän helposti hajoavia hiilihydraatteja ja runsaasti hitaammin hajoa-vaa kiintoainetta. Vetyä tuottavan UASB-reaktorin ja metaania tuottavan UASB-saostuskaivon yhdistelmä arvioitiin potentiaaliseksi energiantuotto- ja jäteveden käsittelyprosessiksi kyläkohtaisiin ratkaisuihin.

74
References
Agrawal, L.K., Ohashi, Y., Mochida, E., Okui, H., Ueki, Y., Harada, H. & Ohashi, A. 1997. Treatment of raw sewage in a temperate climate using a UASB reactor and the hanging sponge cubes process. Wat. Sci. Technol. 36(6–7): 433–440.
Aiyuk, S., Forrez, I., de Kempeneer, L., van Haandel, A. & Verstrate, W. 2005. Anaerobic and complementary treatment of domestic sewage in regions with hot climates – a review. Biores. Technol. In press.
Andreottola, G., Foladori, P. & Ragazzi, M. 2000. Upgrading of a small wastewater treatment plant in a cold climate region using a moving bed biofilm reactor (MBBR) system. Wat. Sci. Technol. 41(1): 177–185.
Angenent, L.T., Banik, G.C. & Sung, S. 2001. Anaerobic migrating blanket reactor treatment of low-strength wastewater at low temperature. Wat. Environ. Res. 73: 567–574.
Angenent, L.T., Karim, K., Al-Dahhan, M.H., Wrenn, B.A. & Domíguez-Espinosa, R. 2004. Production of bioenergy and biochemicals from industrial and agricultural wastewater. Trends Biotechnol. 22: 477–485.
Angelidaki, I. & Ahring, B.K. 1993. Thermophilic anaerobic digestion of livestock waste: effect of ammonia. Appl. Microbiol. Biotechnol. 38: 560–564.
Anoxkaldnes 2005. MBBRTM biofilm technology. http://www.anoxkaldnes.com/ (accessed 20.10.2005)
APHA. 1998. Standard Methods for the Examination of Water and Wastewater, 20th Edition. American Public Health Association. Washington DC, USA.
Æsøy, A., Ødegaard, H., Bach, K., Pujol, R. & Hamon, M. 1998. Denitrification in a packed bed biofilm reactor (Biofor) – experiments with different carbon sources. Wat. Res. 32: 1463–1470.
Benemann, J.R., Cannizzaro, C.M. & Cooney, M. 2004. Biological production of hydrogen-methane mixtures for clean electricity. In: Proceedings of the 10th World Congress on Anaerobic Digestion, Vol. II: 654–659. Montreal, Canada.
Bodík, I., Kratochvíl, K., Herdová, B., Tapia, G. & Gaŝpariková, E. 2002. Municipal wastewater treatment in the anaerobic-aerobic baffled filter reactor at ambient temperature. Wat. Sci. Technol. 46(8): 127–135.
Bogte, J.J., Breure, A.M., van Andel, J.G. & Lettinga, G. 1993. Anaerobic treatment of domestic wastewater in small scale UASB reactors. Wat. Sci. Technol. 27(9): 75–82.
Callado, N.H. & Foresti, E. 2001. Removal of organic carbon, nitrogen and phosphorous in sequential batch reactors integrating the aerobic/anaerobic processes. Wat. Sci. Technol. 44(4): 263–270.
Canler, J.-P., Perrel, J.-M., Lengrand, F. & Iwema, A. 2003. Nitrification in biofilters under variable load and low temperature. Wat. Sci. Technol. 47(11): 129–135.

75
Carrera, J., Jubany, I., Carvallo, L., Chamy, R. & Lafuente, J. 2004. Kinetic models for nitrification inhibition by ammonium and nitrite in a suspended and immobilised biomass systems. Proc. Biochem. 39: 1159–1165.
Chang, F-Y. & Lin, C-Y. 2004. Biohydrogen production using an upflow anaerobic sludge blanket reactor. Internat. J. Hydr. Energy. 29: 33–39.
Chang, J-S., Lee, K-S. & Lin, P-J. 2002. Biohydrogen production with fixed-bed bioreactors. Internat. J. Hydr. Energy. 27: 1167–1174.
Claassen, P.A.M., van Lier, J.B., Lopez Contreras, A.M., van Niel, E.W.J., Sijstma, L., Stams, A.J.M., de Vries, S.S. & Weusthuis, R.A. 1999. Utilisation of biomass for the supply of energy carriers. Appl. Microbiol. Biotechnol. 42: 741–755.
la Cour Jansen, J., Harremoës, P. & Henze, M. 1997. Treatment plants for denitrification. In: Henze, M., Harremoës, P., la Cour Jansen, J. & Arvin, E. (eds), Wastewater Treatment – Biological and Chemical Processes: 229–272. 2nd edition. Springer-Verlag Berlin Heidelberg, Germany.
Craggs, R.J., Tanner, C.C., Sukias, J.P.S. & Davies-Colley, R.J. 2003. Dairy farm wastewater treatment by an advanced pond system. Wat. Sci. Technol. 48(2): 291–297.
Dague, R.R., Banik, G.C. & Ellis, T.G. 1998. Anaerobic sequencing batch reactor treatment of dilute wastewater at psychrophilic temperatures. Wat. Environ. Res. 70: 155–160.
Dolfing, J. 1988. Acetogenesis. In: Zehnder, A.J.B. (ed.), Biology of Anaerobic Microorganisms: 417–468. John Wiley & Sons, Inc., New York, USA.
Elmitwalli, T., Zeeman, G. & Lettinga, G. 2001. Anaerobic treatment of domestic sewage at low temperature. Wat. Sci. Technol. 49(11–12): 33–40.
Elmitwalli, T.A., Sayed, S., Groendijk, L., van Lier, J., Zeeman, G. & Lettinga, G. 2003. Decentralised treatment of concentrated sewage at low temperature in a two-step anaerobic system: two upflow-hybrid septic tanks. Wat. Sci. Technol. 48(6): 219–226.
Elmitwalli, T.A., van Leeuwen, M., Kujawa-Roeleveld, K., Sanders, W. & Zeeman G. 2005. Anaerobic biodegradability and digestion in accumulation systems for concentrated black water and kitchen organic wastes. In: Ahring, B.A. & Hartmann, H. (eds), Conference Proceedings of 4th International Symposium on Anaerobic Digestion of Solid Waste, Volume I: 587–594. Copenhagen, Denmark.
Fang, H.H.P. & Liu, H. 2002. Effect of pH on hydrogen production from glucose by a mixed culture. Biores. Technol. 82: 87–93.
Fang, H.H.P., Zhang, T. & Liu, H. 2002. Microbial diversity of a mesophilic hydrogen-producing sludge. Appl. Microbiol. Biotechnol. 58:112–118.
Franzmann, P.D., Liu, Y., Balkwill, D.L., Aldrich, H.C., Conway de Macario, E. & Boone, D.R. 1997. Methangenium frigidum sp. nov., a psychrophilic, H2-using methanogen from Ace Lake, Antarctica. Internat. J. Syst. Bacteriol. 47: 1068–1072.

76
Garrido, J.M., Omil, F., Arrojo, B., Méndez, R. & Lema, J.M. 2001. Carbon and nitrogen removal from a wastewater of an industrial dairy laboratory with a coupled anaerobic filter-sequencing batch reactor system. Wat. Sci. Technol. 43(3): 249–256.
Gerardi M.H. (ed.) 2003. The Microbiology of Anaerobic Digesters. Wiley Publishers. 192 p.
van Ginkel, S., Sung, S. & Lay, J.J. 2001. Biohydrogen production as a function of pH and substrate concentration. Environ. Sci. Technol. 35: 4726–4730.
van Ginkel, S., Oh, S.-E. & Logan, B.E. 2005. Biohydrogen gas production from food processing and domestic wastewaters. Internat. J. Hydr. Energy. In press.
Government Decree on Treating Domestic Wastewater in Areas outside Sewer Networks. 542/2003. Finnish Environmental Legislation, Finnish Ministry of Justice. http://www.finlex.fi/pdf/saadkaan/E00305542.PDF
Gujer, W. & Zehnder, A.J.B. 1983. Conversion processes in anaerobic digestion. Wat. Sci. Technol. 15(8–9): 127–167.
van Haandel, A.C. & Lettinga, G. 1994. Anaerobic Sewage Treatment. A Practical Guide for Regions with a Hot Climate. John Wiley and Sons Ltd., Chichester, UK. 226 p.
Halalsheh, M.M. 2002. Anaerobic pre-treatment of strong sewage – a proper solution for Jordan. Ph.D. thesis. Wageningen University, the Netherlands.
Hammes, F., Kalogo, Y. & Verstraete, W. 2000. Anaerobic digestion technologies for closing the domestic water, carbon and nutrient cycles. Wat. Sci. Technol. 41(3): 203–211.
Hansen, K.H., Angelidaki, I. & Ahring, B.K. 1998. Anaerobic digestion of swine manure: inhibition by ammonia. Wat. Res. 32: 5–12.
Hasar, H., Kinaci, C., Unlü, A. & Ipek, U. 2001. Role of intermittent aeration in domestic wastewater treatment by submerged membrane activated sludge system. Desalin. 142: 287–293.
Hawkes, F.R., Dinsdale, R., Hawkes, D.L. & Hussy, I. 2002. Sustainable fermentative hydrogen production: challenges for process optimisation. Internat. J. Hydr. Energy. 27: 1339–1347.
Head, M.A. & Oleszkiewicz, J.A. 2004. Bioaugmentation for nitrification at cold temperatures. Wat. Res. 38: 523–530.
Heiska, E. 2002. Biological filtering of wastewaters after chemical treatment. Jäteveden biologinen suodatus kemiallisen puhdistuksen jälkeen. Finnish J. Wat. Econ. Wat. Technol. Hydr. Agric. Eng. Environ. Prot., Vesitalous, 4/2002: 10–14. (In Finnish)
Helness, H. & Ødegaard, H. 2001. Biological phosphorous and nitrogen removal in a sequencing batch moving bed biofilm reactor. Wat. Sci. Technol. 43(1): 233–240.
Henze, M. 1997. Basic biological processes. In: Henze, M., Harremoës, P., la Cour Jansen, J. & Arvin, E. (eds), Wastewater Treatment – Biological and Chemical Processes: 55–107. 2nd edition. Springer-Verlag Berlin Heidelberg, Germany.

77
Henze, M. & Ledin, A. 2001. Types, characteristics and quantities of classic, combined domestic wastewaters. In: Lens, P., Zeeman, G. & Lettinga, G. (eds), Decentralised Sanitation and Reuse – Concepts, Systems and Implementation: 57–72. IWA Publishing, UK.
Hoilijoki, T.H., Kettunen, R.H. & Rintala, J.A. 2000. Nitrification of anaerobically pretreated municipal landfill leachate at low temperatures. Wat. Res. 34: 1435–1446.
IBA Manual. 1999. NL: Individual Treatment of Wastewater. Individuele Behandling Afvalwater. Van Hall Institute Business Centre. (In Dutch)
IPCC. 1996. Climate Change 1995: The Science of Climate Change. In: Houghton, J.T., Meira Filho, L.G., Callander, B.A., Harris, N., Kattenberg, A. & Maskell, K. (eds), Intergovernmental Panel on Climate Change. Cambridge University Press. Cambridge, UK. 572 p.
ISO 9963-1. 1994. Water quality – Determination of alkalinity – Part 1: Determination of total and composite alkalinity. European Committee for Standardisation. Brussels, Belgium.
Jirka, A. & Carter, M.J. 1975. Micro semi-automated analysis of surface and waste waters for chemical oxygen demand. Anal. Chem. 47: 1397–1401.
Kaarikivi-Laine, U. 2003. Government Decree on treating domestic wastewater in areas outside sewer networks. Memo 6.6.2003. Finnish Ministry of the Environment. http://www.ymparisto.fi/download.asp?contentid=10479&lan=fi (in Finnish)
Kallio, J. & Santala, E. 2002. Treatment of Milking Room Wastewater. Maitohuoneen jätevesien käsittely. Environment Guide 91. Finnish Environment Institute, Ministry of Agriculture and Forestry, Ministry of the Environment. Edita Publishing Ltd. Finland. (In Finnish)
Kalyuzhnyi, S. V., Gladchenko, M.A., Sklyar, V.I., Kizimenko, Ye.S. & Shcherbakov, S.S. 2001. Psychrophilic one- and two-step systems for pre-treatment of winery wastewater. Wat. Sci. Technol. 44(4): 23–31.
Kalyuzhnyi, S., Gladchenko, M. & Epov, A. 2003. Combined anaerobic-aerobic treatment of landfill leachates under mesophilic, submesophilic and psychrophilic conditions. Wat. Sci. Technol. 48(6): 311–318.
Kalyuzhnyi, S.V. & Gladchenko, M.A. 2004. Sequenced anaerobic–aerobic treatment of high strength, strong nitrogenous landfill leachate. Wat. Sci. Technol. 49(5–6): 301–312.
Kettunen, R.H. & Rintala, J.A. 1997. The effect of low temperature (5–29 °C) and adaptation on the methanogenic activity of biomass. Appl. Microbiol. Biotechnol. 48: 570–576.
Kettunen, R.H. & Rintala, J.A. 1998. Performance of an on-site UASB reactor treating leachate at low temperature. Wat. Res. 32: 537–546.
Khin, T. & Annachhatre, A.P. 2004. Novel microbial nitrogen removal processes. Biotech. Adv. 22: 519–532.

78
Kuba, T., van Loosdrecht, M.C.M. & Heijnen, J.J. 1996. Effect of cyclic oxygen exposure on the activity of denitrifying phosphorous removing bacteria. Wat. Sci. Technol. 34(1–2): 33–40.
Kujawa-Roeleveld, K. 2001. Types, characteristics and quantities of domestic solid waste. In: Lens, P., Zeeman, G. & Lettinga, G. (eds), Decentralised Sanitation and Reuse – Concepts, Systems and Implementation: 73–93. IWA Publishing, UK.
Kujawa-Roeleveld, K., Elmitwalli, T., Gaillard, A., van Leeuwen, M. & Zeeman, G. 2003. Co-digestion of concentrated black water and kitchen refuse in an accumulation system within the DESAR (decentralised sanitation and reuse) concept. Wat. Sci. Technol. 48(4): 121–128.
Kujawa-Roeleveld, K., Fernandes, T., Wiryawan, Y., Tawfik, A., Visser, M. & Zeeman, G. 2005. Performance of UASB-septic tank for treatment of concentrated black water within DESAR concept. Wat. Sci. Technol. 52(1–2): 307–313.
Lacalle, M.L., Fdz-Polanco, F. & Garcia-Encina, P.A. 2001. Combined anaerobic/aerobic (UASB+UBAF) system for organic matter and nitrogen removal from a high strength industrial wastewater. Wat. Sci. Technol. 44(4): 255–262.
Langenhoff, A.A.M. & Stuckey, D.C. 2000. Treatment of dilute wastewater using an anaerobic baffled reactor: effect of low temperature. Wat. Res. 34: 3867–3875.
Lay, J.J., Tsai, C.J., Huang, C.C, Chang, J.J., Chou, C.H., Fan, K.S., Chang, J.I. & Hsu, P.C. 2005. Influences of pH and hydraulic retention time on anaerobes converting beer processing wastes into hydrogen. Wat. Sci. Technol. 52(1–2): 123–129.
Lee, K-S., Lo, Y-S., Lo, Y-C., Lin, P-J. & Chang, J-S. 2004. Operation strategies for biohydrogen production with a high-rate anaerobic granular bed bioreactor. Enzyme Microb. Technol. 35: 605–612.
Lens, P., Zeeman, G. & Lettinga, G. 2001. Decentralised Sanitation and Reuse – Concepts, Systems and Implementation. IWA Publishing, UK. 650 p.
Lettinga, G. 1996. Sustainable integrated biological wastewater treatment. Wat. Sci. Technol. 33(3): 85–98.
Lettinga, G., van Nelsen, A.F.M., Hobma, S.W., de Zeeuw, W. & Klapwijk, A. 1980. Use of the upflow sludge blanket (USB) reactor concept for biological wastewater treatment, especially for anaerobic treatment. Biotechnol. Bioeng. 25: 699–734.
Lettinga, G., de Man, A., van der Last, A.R.M., Wiegant, W., van Knippenberg, K., Frijns, J. & van Buuren, J.C.L. 1993. Anaerobic treatment of domestic sewage and wastewater. Wat. Sci. Technol. 27(9): 63–73.
Lettinga, G., Rebac. S., Parshina, S., Nozhevnikova, A., van Lier, J.B. & Stams, A.J.M. 1999. High-rate anaerobic treatment of wastewater at low temperatures. Appl. Environ. Microbiol. 65: 1696–1702.
Lettinga, G., Rebac. S. & Zeeman, G. 2001. Challenge of psychrophilic anaerobic wastewater treatment. Trends Biotechnol. 19: 363–370.
79
Levin, D.B., Pitt, L. & Love. M. 2004. Biohydrogen production: prospects and limitations to practical application. Internat. J. Hydr. Energy. 29: 173–185.
van Lier, J.B. & Lettinga, G. 1999. Approriate technologies for effective management of industrial and domestic wastewaters: the decentralised approach. Wat. Sci. Technol. 40(7): 171–183.
Loewenthal, R.E., Kornmüller, U.R.C. & van Heerden, E.P. 1994. Modelling struvite precipitation in anaerobic treatment systems. Wat. Sci. Technol. 30(12): 107–116.
Logan, B.E., Oh, S-E., Kim, I.S. & van Ginkel, S. 2002. Biological hydrogen production measured in batch anaerobic respirometers. Environ. Sci. Technol. 36: 2530–2535.
Loukidou, M. & Zouboulis, A. 2001. Comparison of two biological treatment processes using attached growth biomass for sanitary landfill leachate treatment. Environ. Poll. 111: 273–281.
Mackie, R.I., White, B.A. & Bryant, M.P. 1991. Lipid metabolism in anaerobic ecosystems. Crit. Rev. Microbiol. 17: 449–478.
Madigan, M.T., Martinko, J.H. & Parker, J. 1997. Brock – Biology of Microorganisms. 8th edition. Prentice Hall International Inc., USA. 986 p.
Mahmoud, N., Zeeman, G., Gijzen, H. & Lettinga, G. 2003. Solids removal in upflow anaerobic reactors, a review. Biores. Technol. 90: 1–9.
Mahmoud, N., Zeeman, G., Gijzen, H. & Lettinga, G. 2004. Anaerobic stabilisation and conversion of biopolymers in primary sludge – effect of temperature and sludge retention time. Wat. Res. 38: 983–991.
de Man, A.W.A., Grin, P.C., Roersma, R.E., Grolle, K.C.F. & Lettinga, G. 1986. Anaerobic treatment of municipal wastewater at low temperatures. In: Proceedings of Anaerobic Treatment – a Grown-up Technology: 451–466. Amsterdam, the Netherlands.
Mata-Alvarez, J. 2002. Fundamentals of the anaerobic digestion process. In: Mata-Alvarez, J. (ed.), Biomethanization of the Organic Fraction of Municipal Solid Waste: 1–19. IWA Publishing, UK.
McCarty, P.L. 2001. The development of anaerobic treatment and its future. Wat. Sci. Technol. 44(8): 149–156.
McGrath, R.J. & Mason, I.G. 2004. An observation for the assessment of biogas production from an anaerobic waste stabilisation pond treating dairy farm wastewater. Biosys. Eng. 87: 471–478.
McInerney, M.J. 1988. Anaerobic hydrolysis and fermentation of fats and proteins. In: Zehnder, A.J.B. (ed.), Biology of Anaerobic Microorganisms: 373–415. John Wiley & Sons, Inc., New York, USA.
Metcalf & Eddy. 1991. Wastewater Engineering – Treatment, Disposal and Reuse, 3rd edition. McGraw Hill, New York, USA. 1334 p.
Miron, Y., Zeeman, G., van Lier, J.B. & Lettinga, G. 2000. The role of sludge residence time in the hydrolysis of lipids, carbohydrates and proteins during the anaerobic treatment of domestic sewage. Wat. Res. 34: 1705–1713.

80
Monroy, O., Famá, G., Meraz, M., Montoya, L. & Macarie, H. 2000. Anaerobic digestion for wastewater treatment in Mexico: state of the technology. Wat. Res. 34: 1803–1816.
Nandi, R. & Sengupta, S. 1998. Microbial production of hydrogen: an overview. Crit. Rev. Microbiol. 24: 61–84.
Noike, T., Ko, I.B., Yokoyama, S., Kohno, Y. & Li, Y.Y. 2005. Continuous hydrogen production from organic waste. Wat. Sci. Technol. 52(1–2): 145–151.
Nozhevnikova, A.N., Hollinger, C., Ammann, A. & Zehnder, A.J.B. 1997. Methanogenesis in sediments from deep lakes at different temperatures (2–70 °C). Wat. Sci. Technol. 36(6–7): 57–64.
Nozhevnikova, A.N., Zepp, K., Vazquez, F., Zehnder, A.B.J. & Hollinger, C. 2004. Evidence for the existence of psychrophilic methanogenic communities in anoxic sediments of deep lakes. Appl. Environ. Microbiol. 69: 1823–1835.
Ødegaard, H., Rusten, B. & Westrum, T. 1994. A new moving bed biofilm reactor – applications and results. Wat. Sci. Technol. 29(10–11): 157–165.
Omil, F., Garrido, J.M., Arrojo, B. & Mendez, R. 2003. Anaerobic filter reactor performance for the treatment of complex dairy wastewater at industrial scale. Wat. Res. 37: 4099–4108.
Oremland, R.S. 1988. Biogeochemistry of methanogenic bacteria. In: Zehnder, A.J.B. (ed.), Biology of Anaerobic Microorganisms: 641–705. John Wiley & Sons, Inc., New York, USA.
Pastorelli, G., Andreottola, G., Canziani, R., Darriulat, D., de Fraja Frangipane, E. & Rozzi, A. 1997. Organic carbon and nitrogen removal in moving-bed biofilm reactors. Wat. Sci. Technol. 35(6): 91–99.
Pastorelli, G., Canziani, R., Pedrazzi, L. & Rozzi, A. 1999. Phosphorous and nitrogen removal in moving bed sequencing batch biofilm reactors. Wat. Sci. Technol. 40(4–5): 169–176.
Pavlostathis, S.G. & Giraldo-Gomez, E. 1991. Kinetics of anaerobic treatment: a critical review. Crit. Rev. Environ. Control. 21: 411–490.
Perstorp Analytical/Tecator AB. 1995. Determination of nitrogen according to kjeldahl using block digestion and steam distillation. Tecator application note.
Ramasamy, E.V., Gajalakshmi, S., Sanjeevi, R., Jithesh, M.N. & Abbasi, S.A. 2004. Feasibility study on the treatment of dairy wastewaters with upflow anaerobic sludge blanket reactors. Biores. Technol. 93: 209–212.
Rebac, S., Ruskova, J., Gerbens, S., van Lier, J.B., Stams, A.J.M. & Lettinga, G. 1995. High-rate anaerobic treatment of wastewater under psychrophilic conditions. J. Ferment. Bioeng. 80: 499–506.
Rebac, S., van Lier, J.B., Janssen, M.G.J., Dekkers, F., Swinkels, K.T.M. & Lettinga, G. 1997. High-rate anaerobic treatment of malting wastewater in a pilot-scale EGSB system under psychrophilic conditions. J. Chem. Tech. Biotechnol. 68: 135–146.

81
Ren, N.Q., Gong, M.L. & Xing, D.F. 2004. Start-up of hydrogen bio-production reactor seeded with sewage sludge and its microbial community dynamics. In: Proceedings of 10th World Congress on Anaerobic Digestion, Vol. II: 761–766. Montreal, Canada.
Rezania, B., Oleszkiewicz, J.A., Cicek, N. & Mo, H. 2005. Hydrogen-dependent denitrification in an alternating anoxic-aerobic SBR membrane bioreactor. Wat. Sci. Technol. 51(6–7): 403–409.
Rusten, B., Ødegaard, H. & Lundar, A. 1992. Treatment of dairy wastewater in a novel moving bed biofilm reactor. Wat. Sci. Technol. 26(3–4): 703–711.
Rusten, B., Siljudalen, J.G. & Nordeidet, B. 1994. Upgrading to nitrogen removal with KMT moving bed biofilm process. Wat. Sci. Technol. 29(12): 185–195.
Rusten, B., Kolkinn, O. & Ødegaard, H. 1997. Moving bed biofilm reactors and chemical precipitation for high efficiency treatment of wastewater from small communities. Wat. Sci. Technol. 35(6): 71–79.
Rusten, B., Eikebrokk, B., Ulgenes, Y. & Lygren, E. 2005. Design and operations of the Kaldnes moving bed biofilm reactors. Aquacult. Eng. In press.
Sanders, W.T.M. 2001. Anaerobic hydrolysis during digestion of complex substrates. Ph.D. thesis. Wageningen University, the Netherlands.
Sanders, W.T.M., Geerink, M., Zeeman, G. & Lettinga, G. 2000. Anaerobic hydrolysis kinetics of particulate substrates. Wat. Sci. Technol. 41(3): 17–24.
Sasaki, K., Yamamoto, Y., Tsumura, K., Ouchi, S. & Mori, Y. 1996. Development of 2-reactor intermittent-aeration activated sludge process for simultaneous removal of nitrogen and phosphorous. Wat. Sci. Technol. 34(1–2): 111–118.
Sayed, S.K.I. & Fergala, M.A.A. 1995. Two-stage UASB concept for treatment of domestic sewage including sludge stabilization process. Wat. Sci. Technol. 32: 55–63.
Seghezzo, L., Zeeman, G., van Lier, J.B., Hamelers, H.V.M. & Lettinga, G. 1998. A review: The anaerobic treatment of sewage in UASB and EGSB reactors. Biores. Technol. 65: 175–190.
SFS 5504. 1988. Determination of chemical oxygen demand (CODCr) in water with the closed tube method, oxidation with dichromate. Finnish Standards Association. Helsinki, Finland.
SFS-EN 1189. 1997. Determination of phosphorous – ammonium molybdate spectrometric method. Finnish Standards Association. Helsinki, Finland.
SFS-EN 1899-1. 1998. Determination of biochemical oxygen demand after 7 days (BOD7). Dilution and seeding method with allylthiourea addition. Finnish Standards Association. Helsinki, Finland.
Shizas, I. & Bagley, D.M. 2005. Fermentative hydrogen production in a system using anaerobic digester sludge without heat treatment as a biomass source. Wat. Sci. Technol. 52 (1–2): 139–144.
Simankova, M.V., Kotsyurbenko, O.R., Lueders, T., Nozhevnikova, A.N., Wagner, B., Conrad, R. & Friedrich, M.W. 2003. Isolation and

82
characterisation of new strains of methanogens from cold terrestrial habitats. System. Appl. Microbiol. 26: 312–318.
Singh, K.S. & Viraraghavan, T. 1998. Start-up and operation of UASB reactors at 20 °C for municipal wastewater treatment. J. Ferm. Bioeng. 85: 609–614.
Singh, K.S. & Viraraghavan, T. 2003. Impact of temperature on performance, microbiological, and hydrodynamic aspects of UASB reactors treating municipal wastewater. Wat. Sci. Technol. 48(6), 211–217.
Sleat, R. & Mah, R. 1987. Hydrolytic bacteria. In: Chynoweth, D.P. & Isaacson, R. (eds), Anaerobic Digestion of Biomass: 15–33. Elsevier Science Publishing Co., New York, USA.
Subramaniam, K., Greenfield, P.F., Ho, K.M., Johns, M.R. & Keller, J. 1994. Efficient biological nutrient removal in high strength wastewater using combined anaerobic-sequencing batch reactor treatment. Wat. Sci. Technol. 30(6): 315–321.
Surampalli, R., Tyagi, R., Scheible, O. & Heidman, J. 1997. Nitrification, denitrification and phosphorous removal in sequencing batch reactors. Biores. Technol. 61: 151–157.
Uemura, S. & Harada, H. 2000. Treatment of sewage by a UASB reactor under moderate to low temperature conditions. Biores. Technol. 72: 275–282.
Väisänen, A., Suontamo, R., Silvonen, J. & Rintala, J. 2002. Ultrasound-assisted extraction in the determination of arsenic, cadmium, copper, lead, and silver in contaminated soil samples by inductively coupled plasma atomic emission spectrometry. Anal. Bioanal. Chem. 373: 93–97.
Valio Ltd. 1998. Wastewaters from Dairy Farms. Maitotilan jätevedet. Valio Ltd. Publications 2/98, Finland. (In Finnish)
Veeken, A. 1998. Removal of heavy metals from biowaste. Modelling heavy metal behaviour and development of removal technologies. Ph.D. thesis. Wageningen University, the Netherlands.
Veeken, A. & Hamelers, B. 1999. Effect of temperature on hydrolysis rates of selected biowaste compounds. Biores. Technol. 69: 249–254.
Villaverde, S., Lacalle, M.L., Garcia-Encina, P.A. & Fdz-Polanco, F. 2001. Nitrification-denitrification of UASB effluents highly loaded with nitrogen in an activated sludge reactor operated with short cycled aeration. Wat. Sci. Technol. 44(4): 279–286.
Viraraghavan, T. & Varadarajan, R. 1996. Low-temperature kinetics of anaerobic-filter wastewater treatment. Biores. Technol. 57: 165–171.
de Vrije, T. & Claassen, P.A.M. 2003. Dark hydrogen fermentations. In: Reith, J.H., Wijffels, R.H. & Barten, H. (eds), Bio-methane & Bio-hydrogen – Status and Perspectives of Biological Methane and Hydrogen Production: 103–123. Dutch Biological Hydrogen Foundation. Smiet Offset. The Hague, the Netherlands.
Wang, K. 1994. Integrated anaerobic and aerobic treatment of sewage. Ph.D. thesis. Wageningen University, the Netherlands.
Welander, U. & Mattiasson, B. 2003. Denitrification at low temperatures using suspended carrier biofilm process. Wat. Res. 37: 2394–2398.

83
Welander, U., Henrysson, T. & Welander, T. 1997. Nitrification of landfill leachate using suspended-carrier biofilm technology. Wat. Res. 31: 2351–2355.
Widdel, F. 1988. Microbiology and ecology of sulphate- and sulphur-reducing bacteria. In: Zehnder, A.J.B. (ed.), Biology of Anaerobic Microorganisms: 469–585. John Wiley & Sons, Inc., New York, USA.
Wilderer, P. A. & Schreff, D. 2000. Decentralised and centralised wastewater management: a challenge for technology developers. Wat. Sci. Technol. 41(1): 1–8.
Wu, S-Y., Lin, C-N. & Chang, J-S. 2003. Hydrogen production with immobilized sewage sludge in three-phase fluidised-bed bioreactors. Biotechnol. Prog. 19: 828–832.
Zeeman, G. & Lettinga, G. 1999. The role of anaerobic digestion of domestic sewage in closing water and nutrient cycle at community level. Wat. Sci. Technol. 39(5): 187–194.
Zeeman, G., Sanders, W.T.M., Wang, K.Y. & Lettinga, G. 1997. Anaerobic treatment of complex wastewater and waste activated sludge – application of an upflow anaerobic solid removal reactor for the removal and pre-hydrolysis of suspended COD. Wat. Sci. Technol. 35(10): 121–128.
Zeeman, G., Kujawa-Roeleveld, K. & Lettinga, G. 2001. Anaerobic treatment systems for high strength domestic waste(water) streams. In: Lens, P., Zeeman, G. & Lettinga, G. (eds.), Decentralised Sanitation and Reuse – Concepts, Systems and Implementation: 218–234. IWA Publishing, UK.