Embed Size (px)
Citation preview
Anaerobic Digestion of Agri- Food By- Products
Robert Bedoić
Boris Ćosić
Tomislav Pukšec
Neven DuićUniversity of Zagreb, Croatia
https:// doi .org/ 10 .21061/ IntroBiosystemsEngineering/ Anerobic _Digestion
How to cite this chapter:Bedoić, R., Ćosić, B., Pukšec, T., Duić, N. (2020). Anaerobic Digestion of Agri- Food By- Products. In Holden, N. M., Wolfe, M. L., Ogejo, J. A., & Cummins, E. J. (Ed.), Introduction to Biosystems Engineering. https:// doi .org/ 10 .21061/ IntroBiosystemsEngineering/ Anerobic _Digestion
This chapter is part of Introduction to Biosystems EngineeringInternational Standard Book Number (ISBN) (PDF): 978- 1- 949373- 97- 4International Standard Book Number (ISBN) (Print): 978- 1- 949373- 93- 6https:// doi .org/ 10 .21061/ IntroBiosystemsEngineering
Copyright / license:© The author(s)This work is licensed under a Creative Commons Attribution (CC BY) 4.0 license. https:// creativecommons .org/ licenses/ by/ 4 .0
The work is published jointly by the American Society of Agricultural and Biological Engineers (ASABE) www .asabe .org and Virginia Tech Publishing publishing .vt .edu.
1
Anaerobic Digestion of Agri- Food By- ProductsRobert BedoićUniversity of Zagreb, Faculty of Mechanical Engineering and Naval ArchitectureZagreb, Croatia
Boris ĆosićUniversity of Zagreb, Faculty of Mechanical Engineering and Naval ArchitectureZagreb, Croatia
Tomislav PukšecUniversity of Zagreb, Faculty of Mechanical Engineering and Naval ArchitectureZagreb, Croatia
Neven DuićUniversity of Zagreb, Faculty of Mechanical Engineering and Naval ArchitectureZagreb, Croatia
KEY TERMS
Substrates and feedstocks
Pretreatment of feedstock
Operating modes
Biogas chemistry
Inhibition parameters
Biogas yield
Biogas utilization
Products
Digestate management
Variables
a, b, c, and d = number of atoms of carbon, hydrogen, oxygen, and nitrogen, respectively
msubstrate = mass of substrate
Q = feedstock input in the digester
V = digester volume
VN,biogas = normalized cumulative volume of biogas
Introduction
Anaerobic digestion is a set of biochemical processes where complex organic matter is decomposed by the activity of bacteria in an oxygen- free atmosphere into biogas and digestate. Understanding the basic principles of anaerobic digestion (AD), and its role in the production of renewable energy sources,
2 • Anaerobic Digestion of Agri- Food By- Products
requires familiarity with the chemical composition of substrates, degrada-tion stages in the process, and use of the products, both biogas and digestate. Agri- food by- products are recognized as a sustainable source of biomass for AD. Post- harvesting residues, food industry by- products and decomposed food can be utilized for AD to achieve environmental benefits (including a reduction of landfilling and greenhouse gas emissions) with added production of green energy. Biogas is a mixture of gaseous compounds, with the highest portion being methane (about 50– 70% by volume), followed by carbon dioxide (30– 50%). In a large- scale operation, biogas is usually utilized as a fuel to run a gas engine in the combined production of heat and electricity (CHP), or to produce biomethane (a gas similar in its characteristics to natural gas), through biogas upgrade processes. Digestate, another product of anaerobic digestion, is usually nutrient- rich, non- degraded organic material that can be used as a soil conditioner and replacement for conventional synthetic organic fertilizers.
ConceptsAnaerobic Digestion Pathway
The concepts that underlie the AD process can be presented as a multi- step process (Lauwers et al., 2013), usually consisting of four main stages: hydrolysis, acidogenesis, acetogenesis, and methanogenesis.
Hydrolysis is the first stage of the AD process. In hydrolysis, large poly-mers (complex organic matter) are decomposed in the presence of hydro-lytic enzymes into basic monomers: monosaccharides, amino acids, and long chain fatty acids. Hydrolysis can be represented using the following simplified chemical reaction:
C6H10O4 + 2H2O → C6H12O6 + H2
The intensity of the hydrolysis process can be monitored through hydrogen production in the gas phase. Hydrolysis occurs at low rates because polymer molecules are not easily degradable into basic monomer compounds. Usually,
OutcomesAfter reading this chapter, you should be able to:
• Describe the chemistry of the AD (anaerobic digestion) process
• Calculate biogas production from different substrates based on their elemental composition
• Describe the factors influencing the AD process, including process inhibition
• Identify substrates suitable for direct use in the AD process and substrates that need pre- treatment before feeding the digester
• Describe methods of biogas and digestate utilization in the production of renewable energy
Anaerobic Digestion of Agri- Food By- Products • 3
this stage is also the rate- limiting stage of the overall AD process. The lower the rate of hydrolysis, the lower the production of biogas.
The second stage of AD, acidogenesis, includes conversion of monosac-charides, amino acids, and long chain fatty acids resulting from hydrolysis into carbon dioxide, alcohols, and volatile fatty acids (VFAs). The following two reac-tions illustrate the breakdown of monomers into ethanol and propionic acid:
C6H12O6 ⇌ 2CH3CH2OH + 2CO2
C6H12O6 + 2H2 ⇌ 2CH3CH2COOH + 2H2O
Accumulation of VFAs caused by the acidogenesis process leads to a decrease in pH value. This phenomenon can contribute to significant problems in the operation of the AD process since it affects bacteria responsible for biogas production.
Acetogenesis is the third stage of the AD process, characterized by the pro-duction of hydrogen and acetic acid from basic monomers and VFAs. The reac-tions that describe the chemical processes occurring during acetogenesis are:
CH3CH2COO− + 3H2O ⇌ CH3COO− + HCO3− +H+ + 3H2
C6H12O6 + 2H2O ⇌ 2CH3COOH + 4H2 + 2CO2
CH3CH2OH + 2H2O ⇌ CH3COO− + 3H2 +H+
Acetogenesis and acidogenesis occur simultaneously; there is no time delay between the two processes. Hydrogen formed in acetogenesis could inhibit metabolic activity of acetogenic bacteria and decrease the reaction. On the other hand, hydrogen formed in acetogenesis could become the reactant for the last stage of AD.
Methanogenesis is the fourth stage of the AD process. In general, metha-nogenic bacteria can form methane from acetic acid, alcohols, hydrogen, and carbon dioxide, according to Bochmann and Montgomery (2013):
CH3COOH ⇌ CH4+ CO2
CH3OH + H2 ⇌ CH4 + H2O
CO2 + 4H2 ⇌ CH4+ 2H2O
Biogas production is usually expressed in terms of a biogas yield— the amount of biogas produced by the mass of substrate. Al Seadi et al. (2008) and Frigon and Guiot (2010) have determined that each compound of biomass can be characterized by its theoretical biogas content and theoretical biogas yield, as presented in table 1.
Data in table 1 show that fats produce more biogas than proteins and car-bohydrates, and that proteins and fats produce biogas with a higher methane
4 • Anaerobic Digestion of Agri- Food By- Products
content than carbohydrates. The share of methane is rele-vant, since the efficiency of biogas utilization is based on the share of methane in the biogas. A gas analyzer is used to determine the composi-tion of biogas— not only its methane content, but also its content of other compo-nents such as carbon dioxide, water, hydrogen sulphide,
etc. The volume of biogas produced can be measured by several methods; the water displacement method is the most common one (Bedoić et al., 2019a). The recorded biogas volume is then usually adjusted to 0°C and 101,325 Pa pressure so that it can be compared to other reported values.
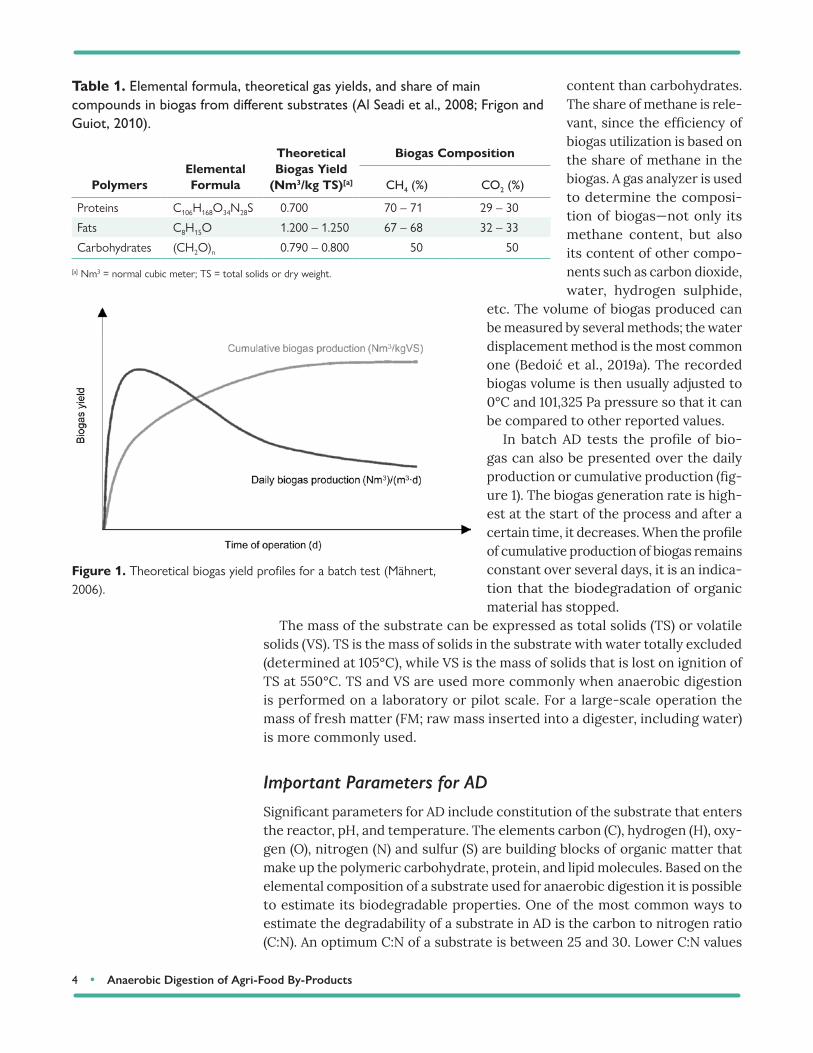
In batch AD tests the profile of bio-gas can also be presented over the daily production or cumulative production (fig-ure 1). The biogas generation rate is high-est at the start of the process and after a certain time, it decreases. When the profile of cumulative production of biogas remains constant over several days, it is an indica-tion that the biodegradation of organic material has stopped.
The mass of the substrate can be expressed as total solids (TS) or volatile solids (VS). TS is the mass of solids in the substrate with water totally excluded (determined at 105°C), while VS is the mass of solids that is lost on ignition of TS at 550°C. TS and VS are used more commonly when anaerobic digestion is performed on a laboratory or pilot scale. For a large- scale operation the mass of fresh matter (FM; raw mass inserted into a digester, including water) is more commonly used.
Important Parameters for AD
Significant parameters for AD include constitution of the substrate that enters the reactor, pH, and temperature. The elements carbon (C), hydrogen (H), oxy-gen (O), nitrogen (N) and sulfur (S) are building blocks of organic matter that make up the polymeric carbohydrate, protein, and lipid molecules. Based on the elemental composition of a substrate used for anaerobic digestion it is possible to estimate its biodegradable properties. One of the most common ways to estimate the degradability of a substrate in AD is the carbon to nitrogen ratio (C:N). An optimum C:N of a substrate is between 25 and 30. Lower C:N values
Table 1. Elemental formula, theoretical gas yields, and share of main compounds in biogas from different substrates (Al Seadi et al., 2008; Frigon and Guiot, 2010).
PolymersElemental Formula
Theoretical Biogas Yield
(Nm3/kg TS)[a]
Biogas Composition
CH4 (%) CO2 (%)
Proteins C106H168O34N28S 0.700 70 – 71 29 – 30
Fats C8H15O 1.200 – 1.250 67 – 68 32 – 33
Carbohydrates (CH2O)n 0.790 – 0.800 50 50
[a] Nm3 = normal cubic meter; TS = total solids or dry weight.
Figure 1. Theoretical biogas yield profiles for a batch test (Mähnert, 2006).
Anaerobic Digestion of Agri- Food By- Products • 5
indicate a high nitrogen content, which could lead to ammonia generation and inhibition in the process. Higher C:N values indicate high levels of carbohydrates in a substrate, which makes it harder to disintegrate and produce biogas.
The pH range in the reactor depends on the feedstock used and its chemical properties. Liu et al. (2008) found that the optimum pH range inside the reactor is between 6.8 and 7.2, while the AD process can tolerate a range of 6.5 up to 8.0.
The anaerobic digestion process is highly sensitive to temperature changes. Van Lier et al. (1997) have studied the impact of temperature on the growth rate of bacteria in methanogenesis. In general, psychrophilic (2°C to 20°C) digestion is not used for commercial purposes, due to a high retention time of substrates. Feedstock co- digestion is usually performed in mesophilic (35°C to 38°C) or thermophilic (50°C to 70°C) conditions. Mesophilic anaerobic digestion is the most common system. It has a more stable operation than thermophilic anaerobic digestion, but a lower biogas production rate. Thermophilic anaerobic digestion shows advantages in terms of pathogen reduction during the process. Increasing the temperature of the process increases the organic acids inside the fermenter, but at the same time makes the process more unstable. Degra-dation of the feedstock under thermophilic conditions requires an additional heat supply to achieve and maintain such conditions in the digester.
Estimation of Biogas Yield of the Substrate Based on the Elemental Composition
The theoretical production of biogas can be estimated by knowing the elemental composition of the substrate. Gerike (1984) has determined an approach to find a molecular formula that represents the composition of the substrate in the form of CaHbOcNd where a, b, c, and d represent the number of carbon, hydrogen, oxygen, and nitrogen atoms, respectively; this is estimated from the elemental composition of the substrate, on a dry basis (TS). To represent the entire AD process in one stage, the following chemical reaction is used:
a b c d 2 4 2 34 - - 2 + 3 4 + - 2C H O N H O H - 3 4 - + 2 + 3 + CO ++ C
8 HN
4 8a b c d a b c d a b c d d�
The reaction estimates that the entire organic compound, CaHbOcNd, is decom-posed during the AD process into three products: methane, carbon dioxide and ammonia.
Substrates in AD are usually characterized through the value of oxygen demand. There are several types of oxygen demand; the ones usually used are the following.
• Biochemical oxygen demand (BOD) is the measure of the oxygen equiva-lent of the organic substrate that can be oxidized biochemically using aerobic biological organisms.
• Chemical oxygen demand (COD) is the measure of the oxygen equivalent of the organic substrate that can be oxidized chemically using dichromate
6 • Anaerobic Digestion of Agri- Food By- Products
in an acid solution. The amount of methane produced in the anaerobic digestion per unit COD is around 0.40 Nm3/kgO2.
• Theoretical oxygen demand (ThOD) is the oxygen required to oxidize the organics to end products based on the elemental composition of the substrate. ThOD is used to estimate the oxygen demand of different substrates.
Koch et al. (2010) established a formula to estimate the ThOD of the substrate based on the molecular formula CaHbOcNd:
2
a b c d
O
C H O N
kg16 (2 0.5( -3 ) - )ThOD12 16 14 kgTS
� �� �� � �� �� � � � �
a b d ca b c d
(1)
It does not reflect the fact that the organic substrate is not 100% degradable at any time.
Li et al. (2013) showed a way to estimate the theoretical biochemical methane potential (TBMP) of the organic substrate based on the elemental composition of the substrate, as:
4
a b c d
3CH
C H O N
322.4 Nm2 8 4 8TBMP12 16 14 kgVS
a b c d
a b c d
� �� � � �� � � �� �� � �� �� � � � � (2)
Since the organic matter cannot always be fully degraded during the AD process, it is valuable to conduct measurements (usually lab- scale) on the pro-duction of biogas, in order to investigate the actual degradability of the sample. For those purposes, biochemical gas potential (BGP) and biochemical methane potential (BMP) tests are used.
The BGP laboratory test is used in assessing the potential yield of a substrate in terms of biogas production and process stability (based upon pH and con-centration of ammonia):
BGP = VN,biogas /msubstrate (3)
where VN,biogas = normalized cumulative volume of biogas (Nm3) msubstrate = mass of substrate put in a reactor (kg FM or kg TS or kg VS).
The BMP test is usually used in assessing the feedstock potential, but in terms of biomethane production:
BMP = VN,CH4 /msubstrate (4)
where VN,CH4 = normalized cumulative volume of biomethane (Nm3)
msubstrate = mass of substrate put in a reactor (kg FM or kg TS or kg VS).
Anaerobic Digestion of Agri- Food By- Products • 7
Both tests contribute to the evaluation of the use of prepared feedstock in the AD process. The ratio of BMP and BGP represents the share of the most important compound of biogas, methane:
CH4 in biogas = BMP/BGP (5)
Degradation of a substrate is expressed as the ratio of the actual BMP to the TBMP, which depends on the chemical constitution of the substrate, as:
BMPDegradation (%) = ×100TBMP
(6)
Large- Scale AD
Parameters that need to be considered during design, and controlled during the operation of the AD process in a large- scale biogas production at a satisfactory level, are organic load rate and hydraulic retention time.
Organic load rate (OLR) represents the quantity of organic material fed into the digester. It is usually higher for co- digestion compared to mono- digestion. If OLR is too high, foaming and instability of the process can occur due to higher levels of acidic components in the digester. OLR can be calculated based on the input volume of feedstock:
OLR = Q / V (7)
where Q = raw feedstock input in the digester per day (m3 d−1) V = digester volume (m3)
A more common way to present the organic load rate is through the chemi-cal oxygen demand:
OLRCOD = OLR × COD (8)
where COD = chemical oxygen demand of feedstock per unit volume of feedstock (kg O2 m−3).
Interpretation of the input feedstock through COD includes taking into con-sideration the chemical properties of substrates in the feedstock.
Hydraulic retention time (HRT) represents the time (days) that a certain quantity of feedstock remains in the digester:
HRT = V /Q (9)
The required HRT depends on parameters such as feedstock composi-tion, the operating conditions in the digester, and digester configuration. In order to avoid instability in the process usually caused by VFA accumulation, HRT should be >20 days.
8 • Anaerobic Digestion of Agri- Food By- Products
Products of Anaerobic Digestion
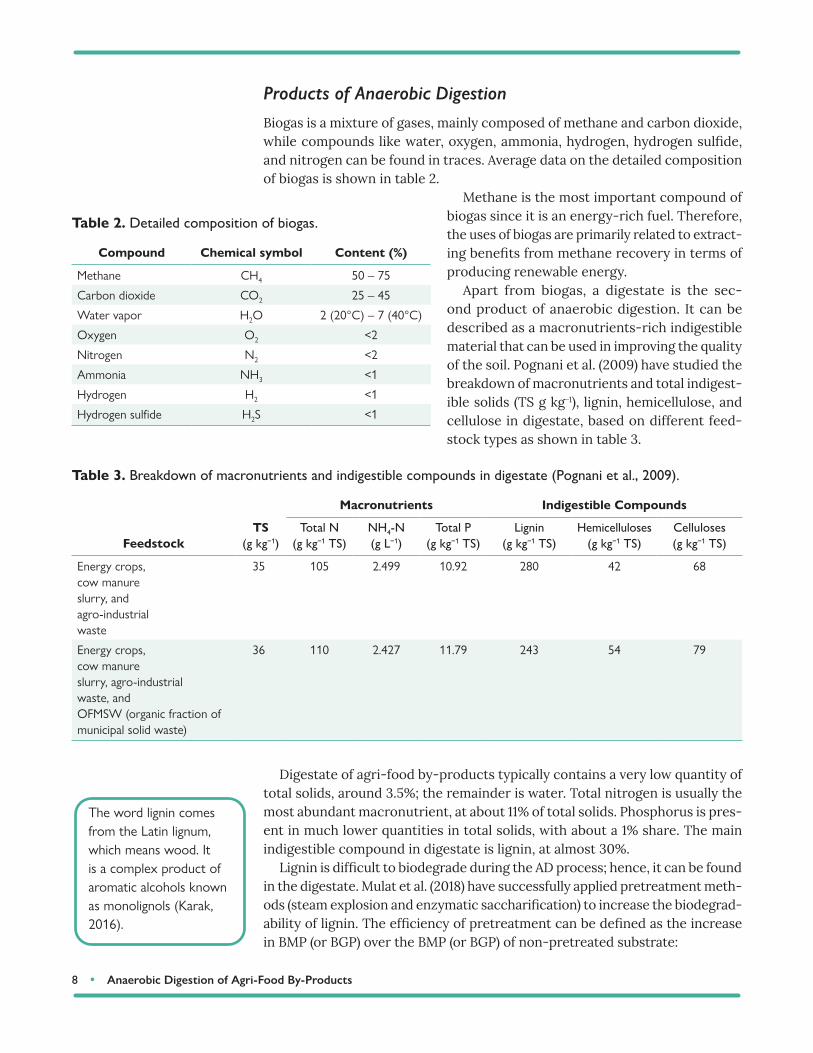
Biogas is a mixture of gases, mainly composed of methane and carbon dioxide, while compounds like water, oxygen, ammonia, hydrogen, hydrogen sulfide, and nitrogen can be found in traces. Average data on the detailed composition of biogas is shown in table 2.
Methane is the most important compound of biogas since it is an energy- rich fuel. Therefore, the uses of biogas are primarily related to extract-ing benefits from methane recovery in terms of producing renewable energy.
Apart from biogas, a digestate is the sec-ond product of anaerobic digestion. It can be described as a macronutrients- rich indigestible material that can be used in improving the quality of the soil. Pognani et al. (2009) have studied the breakdown of macronutrients and total indigest-ible solids (TS g kg− 1), lignin, hemicellulose, and cellulose in digestate, based on different feed-stock types as shown in table 3.
Digestate of agri- food by- products typically contains a very low quantity of total solids, around 3.5%; the remainder is water. Total nitrogen is usually the most abundant macronutrient, at about 11% of total solids. Phosphorus is pres-ent in much lower quantities in total solids, with about a 1% share. The main indigestible compound in digestate is lignin, at almost 30%.
Lignin is difficult to biodegrade during the AD process; hence, it can be found in the digestate. Mulat et al. (2018) have successfully applied pretreatment meth-ods (steam explosion and enzymatic saccharification) to increase the biodegrad-ability of lignin. The efficiency of pretreatment can be defined as the increase in BMP (or BGP) over the BMP (or BGP) of non- pretreated substrate:
The word lignin comes from the Latin lignum, which means wood. It is a complex product of aromatic alcohols known as monolignols (Karak, 2016).
Table 2. Detailed composition of biogas.
Compound Chemical symbol Content (%)
Methane CH4 50 – 75
Carbon dioxide CO2 25 – 45
Water vapor H2O 2 (20°C) – 7 (40°C)
Oxygen O2 <2
Nitrogen N2 <2
Ammonia NH3 <1
Hydrogen H2 <1
Hydrogen sulfide H2S <1
Table 3. Breakdown of macronutrients and indigestible compounds in digestate (Pognani et al., 2009).
FeedstockTS
(g kg− 1)
Macronutrients Indigestible Compounds
Total N(g kg− 1 TS)
NH4- N(g L−1)
Total P(g kg− 1 TS)
Lignin(g kg− 1 TS)
Hemicelluloses(g kg− 1 TS)
Celluloses(g kg− 1 TS)
Energy crops,cow manureslurry, andagro- industrialwaste
35 105 2.499 10.92 280 42 68
Energy crops,cow manureslurry, agro- industrialwaste, andOFMSW (organic fraction of municipal solid waste)
36 110 2.427 11.79 243 54 79
Anaerobic Digestion of Agri- Food By- Products • 9
BMP (after pretreatment) - BMP (without pretreatment)Efficiency (%) = ×100
BMP (without pretreatment) BMP (after pretreatment) - BMP (without pretreatment)Efficiency (%) = ×100
BMP (without pretreatment) (10)
Inhibition Parameters in AD
Many factors influence inhibition, i.e., reduced biogas production, of the AD process, but the most frequent is the use of inadequate substrates and their high loads. According to Xie et al. (2016), inhibition of the AD process is a result of the accumulation of several intermediates:
• free ammonia (FA), (NH3)• volatile fatty acids (VFAs)• long- chain fatty acids (LCFAs)• heavy metals (HMs).
Ammonia is a compound generated by the biological degradation of organic matter that contains nitrogen— primarily proteins. Typical protein- rich sub-strates for AD are slaughterhouse by- products (blood, rumen, stomach and intestinal content) and decomposed food (milk, whey, etc.). Process instability due to ammonia accumulation usually indicates accumulation of VFAs, which points to a decreasing of pH value (Sung and Liu, 2003). The critical ammonia toxicity range depends on the type of feedstock used in biogas production, but it goes from 3 to 5 g(NH4- N) L−1 and higher.
Inhibition limited by VFAs relates to the conversion of VFAs into acetic acid before methane is formed in the process of acetogenesis. Butyric acid is more likely to be converted into acetic acid compared to propionic acid. The ratio of concentrations of propionic and acetic acid in the digester is used as a valu-able indicator of inhibition by VFAs; if the indicator is above 1.4, inhibition is present in the system.
Formation of LCFAs is more intense if the substrate contains more lip-ids. Examples of lipid- rich substrates are domestic sewage, oil- processing effluents, and slaughterhouse by- products. Ma et al. (2015) implied that a high concentration of LCFAs results in the accumulation of VFAs and lower methane yield. LCFAs can cause biochemical inhibition, increasing the deg-radation of microorganisms. Zonta et al. (2013) found that LCFAs could cause physical inhibition as a result of the adsorption of LCFAs on the surface of the microorganisms.
Heavy metals (HMs) are non- biodegradable inorganic compounds that can be found in the feedstock. Usually, municipal sewage and sludge are most dominant HM- rich substrates. During the AD process, HMs remain in the bulk volume in the digester. Therefore, the accumulation of HMs can reach a poten-tially dangerous concentration that can cause failure in the anaerobic digester operation. Some of the most notable HMs that could cause inhibition in the AD are Hg (mercury), Cd (cadmium), Cr (chromium), Cu (copper), As (arsenic), Zn (zinc), and Pb (lead).
10 • Anaerobic Digestion of Agri- Food By- Products
Applications
Operating Modes of Anaerobic Digestion
Based on the number of substrates used in AD, there are two operating modes, mono- digestion and co- digestion. Mono- digestion is related to the use of only one substrate in AD, while co- digestion reflects the use of two or more sub-strates in preparing feedstock.
Usually, mono- digestion is an applicable method only on a farm level, where a single type of agricultural by- product is present, such as animal manure. Digestion of animal manure is usually performed in a small- scale digester that replaces inefficient storage of animal manure and contributes to the mitigation of greenhouse gas emissions (GHG).
Co- digestion involves mixing substrates in different ratios to keep proper-ties of the mixture suitable for running the process with an optimum range. Co- digestion is a more advantageous method of energy recovery from organic material due to several benefits: better C:N ratio of the mixed feedstock, efficient pH and moisture content regulation, and higher biodegradability, thus a higher production of biogas (Das and Mondal, 2016). Patil and Deshmukh (2015) found that other variables important for the adequate running of AD could easily be adjusted through co- digestion performance, including moisture content and pH. Compared to mono- digestion, co- digestion has higher biogas yield, which is associated with the synergistic effects of the microorganisms present in the substrates.
AD processes are also classified by the moisture content of the feedstock into wet AD and dry AD. Wet AD is characterized by feedstock that can be mixed and pumped as liquid slurries, due to a low solid content (3% to 15%). Dry AD (sometimes called high solids AD) is performed in a pile, with the feedstock in stackable form. Tanks for large- scale AD are usually built of concrete with a corrosive- protective layer applied to the inner tank wall, in order to ensure longer durability in the gas/water interface zone.
AD processes can operate as large- scale continuous processes and as lab- scale batch processes, as well as intermediate fed- batch and semi- continuous pro-cesses. Large- scale biogas production processes (digester volume > 1,000 m3) are performed in biogas plants. Energy production in biogas plants is directly linked to the efficiency of biological conversion of feedstock in a digester. OLR and feedstock properties are controlled to maintain a stable and efficient process. Biogas produced can be utilized in various ways, to produce heat, electricity, or natural- gas like biomethane.
Laboratory (lab- scale; digester volume <1 L) AD is usually performed in a batch mode with a goal to investigate the BMP of substrates for the purposes of AD. The basic principle of batch AD is to put feedstock in a small reactor, add inoculum (colony of bacteria), seal it well, deaerate it to remove oxygen from the digester atmosphere, and monitor the production and the quality of biogas over time by certain laboratory methods (generally water displacement or eudiometer with a pressure gauge). Bedoić et al. (2019a) studied co- digestion of residue grass and maize silage with animal manure in a 250 mL reactor with
Anaerobic Digestion of Agri- Food By- Products • 11
biogas measurement by a water displacement method. A heated bath was used to maintain the constant temperature in the reactor, since AD is a temperature- sensitive process. As the AD process ran, the generated biogas left the reactor through the outlet hose and entered the upside- down graduated measuring jug filled with water. The volume of the water ejected from the measuring jug represented the volume of the biogas generated in the AD.
In addition to the continuous process in large scale digesters and the batch process usually performed at a laboratory scale, Ruffino et al. (2015) described two additional operating modes for AD: fed- batch and semi- continuous. The fed- batch process is usually considered in a semi- pilot setup, where the digester is started as batch and after a certain period of time products are withdrawn from the reactor. These modes are in between large- scale continuous mode and a lab- scale batch mode. A certain portion of new substrates is added, and the process continues. If repeated several times, this operating mode is known as a repeated fed- batch. The semi- continuous process is considered as a pilot setup, where the process is driven in the continuous mode, but operates with a lower volume digester. Semi- continuous AD has shown many advantages com-pared to the batch operation when investigating AD, mainly due to a dynamic component in the process, which reflects the behavior of continuous- large scale operation.
AD of Agri- Food By- Products
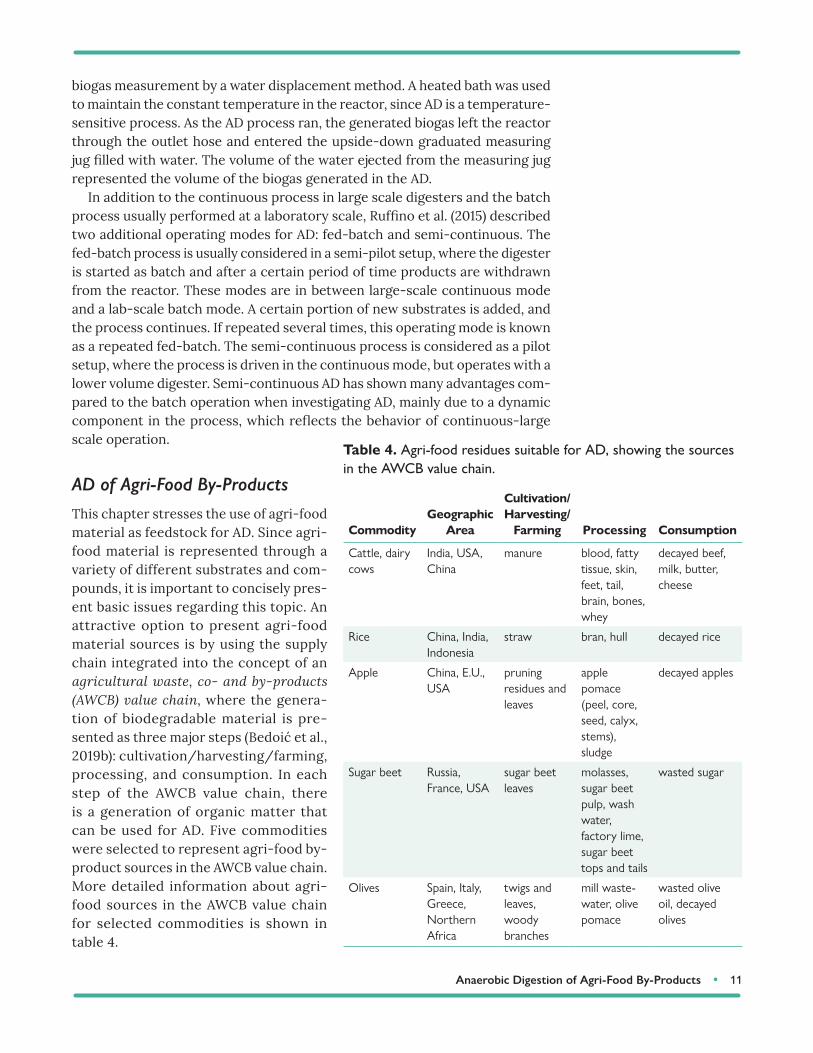
This chapter stresses the use of agri- food material as feedstock for AD. Since agri- food material is represented through a variety of different substrates and com-pounds, it is important to concisely pres-ent basic issues regarding this topic. An attractive option to present agri- food material sources is by using the supply chain integrated into the concept of an agricultural waste, co- and by- products (AWCB) value chain, where the genera-tion of biodegradable material is pre-sented as three major steps (Bedoić et al., 2019b): cultivation/harvesting/farming, processing, and consumption. In each step of the AWCB value chain, there is a generation of organic matter that can be used for AD. Five commodities were selected to represent agri- food by-product sources in the AWCB value chain. More detailed information about agri- food sources in the AWCB value chain for selected commodities is shown in table 4.
Table 4. Agri- food residues suitable for AD, showing the sources in the AWCB value chain.
CommodityGeographic
Area
Cultivation/Harvesting/
Farming Processing Consumption
Cattle, dairy cows
India, USA, China
manure blood, fatty tissue, skin, feet, tail, brain, bones, whey
decayed beef, milk, butter, cheese
Rice China, India, Indonesia
straw bran, hull decayed rice
Apple China, E.U., USA
pruning residues and leaves
apple pomace (peel, core, seed, calyx, stems), sludge
decayed apples
Sugar beet Russia, France, USA
sugar beet leaves
molasses, sugar beet pulp, wash water, factory lime, sugar beet tops and tails
wasted sugar
Olives Spain, Italy, Greece, Northern Africa
twigs and leaves, woody branches
mill waste-water, olive pomace
wasted olive oil, decayed olives
12 • Anaerobic Digestion of Agri- Food By- Products
During the first stage of the AWCB value chain (cultivation and harvesting), a certain amount of commodity is eaten or destroyed by animals (e.g., birds, rabbits, deer, wasps) or due to bad weather conditions and cannot be used as food (Bedoić et al., 2019b). By- products from this first stage of the AWCB value chain are mainly lignocellulosic matter, except for the case of manure. Since lignocellulosic matter contains an indigestible compound (lignin), inten-sive pretreatment methods are needed to enhance the degradation of this particular organic matter. On the other side, manure has a lower potential for biogas production compared to lignocellulosic matter, but it is important as a valuable source of nutrients.
The second stage of the AWCB value chain is the processing of commodi-ties where additional residues are generated. Since there are many options to process a commodity, AWCB products in this stage require special consider-ation for AD. The most interesting, but at the same time the most challenging, AWCBs characterized by high oxygen demand are slaughterhouse remains. Slaughterhouse remains are characterized by an inappropriate (low) C:N of 6– 14, which usually causes ammonia inhibition during AD (Moukazis et al., 2018). Co- digestion of olive pomace and apple co- products with cow slurry has demonstrated feasibility and economic attractiveness. Results of semi- continuous anaerobic co- digestion with different OLRs have shown that the mixture of this kind of substrates shows energy potential similar to mixtures of some energy crops and livestock combinations. Aboudi et al. (2016) studied mono- digestion of sugar beet cossettes and co- digestion with cow manure operating under mesophilic conditions in the semi- continuous anaerobic system. The results showed that co- digestion produced higher methane gen-eration and no inhibition phenomena, compared to mono- digestion of sugar beet cossettes. Industrial crop by- products have shown potential to produce biogas through dry- AD with implemented technologies for pretreatment of substrates.
The third stage of the AWCB value chain is consumption, which includes materials such as food waste or spoiled food, mainly generated in households. It is quite difficult to estimate the composition of decayed food, due to the variety of different substrates present. However, some general facts about agri- food by- products as a feedstock for AD are that they are an ever present, everyday, nutrient rich, sustainable energy source. The nutrient- rich composition provides the potential for applying the digestate as a valuable soil conditioner. On the other side, some pretreatment techniques are required to increase relatively low biodegradability of food waste feedstock.
Pretreatment of Agri- Food By- Products to Enhance Biogas ProductionSome organic compounds show low degradability if they enter the digester in their raw form. Ariunbaatar et al. (2014) presented several groups of pretreat-ment techniques that can be applied to increase the biodegradability of those substrates:
Anaerobic Digestion of Agri- Food By- Products • 13
• mechanical — disintegration and grinding solid parts of the substrates, which result in releasing cell compounds and increasing the specific surface area for degradation
• thermal — used for pathogen removal, improving dewatering perfor-mance, and reducing the viscosity of the digestate; the most studied pretreatment method, applied at industrial scale
• chemical — used for destructing the organic compounds by means of strong acids, alkalis, or oxidants
• biological — includes both anaerobic and aerobic methods along with the addition of specific enzymes such as peptidase, carbohydrolase, and lipase
Pretreatments may be combined for further enhancement of biogas production and faster kinetics of AD. Usually, the applied combined pretreatment techniques are thermo- chemical and thermo- mechanical.
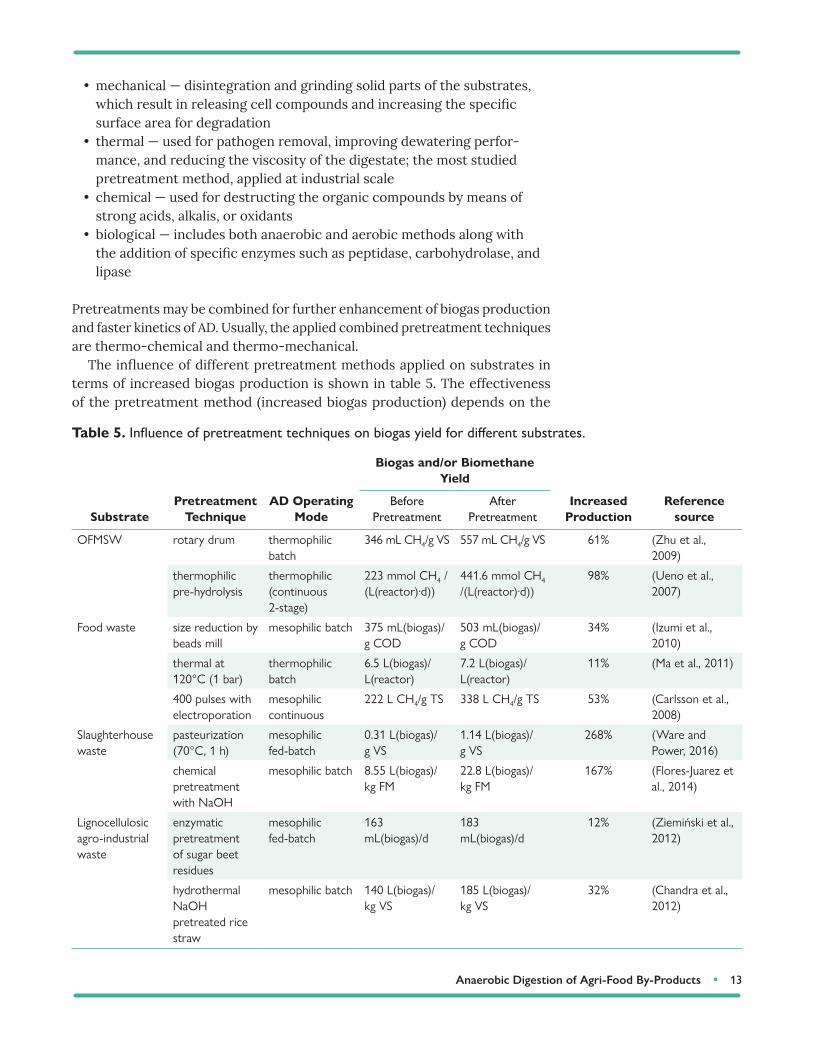
The influence of different pretreatment methods applied on substrates in terms of increased biogas production is shown in table 5. The effectiveness of the pretreatment method (increased biogas production) depends on the
Table 5. Influence of pretreatment techniques on biogas yield for different substrates.
SubstratePretreatment
TechniqueAD Operating
Mode
Biogas and/or Biomethane Yield
Increased Production
Reference source
Before Pretreatment
After Pretreatment
OFMSW rotary drum thermophilic batch
346 mL CH4/g VS 557 mL CH4/g VS 61% (Zhu et al., 2009)
thermophilic pre- hydrolysis
thermophilic(continuous 2- stage)
223 mmol CH4 /(L(reactor)∙d))
441.6 mmol CH4 /(L(reactor)∙d))
98% (Ueno et al., 2007)
Food waste size reduction by beads mill
mesophilic batch 375 mL(biogas)/ g COD
503 mL(biogas)/ g COD
34% (Izumi et al., 2010)
thermal at 120°C (1 bar)
thermophilic batch
6.5 L(biogas)/L(reactor)
7.2 L(biogas)/L(reactor)
11% (Ma et al., 2011)
400 pulses with electroporation
mesophilic continuous
222 L CH4/g TS 338 L CH4/g TS 53% (Carlsson et al., 2008)
Slaughterhouse waste
pasteurization (70°C, 1 h)
mesophilic fed- batch
0.31 L(biogas)/ g VS
1.14 L(biogas)/ g VS
268% (Ware and Power, 2016)
chemical pretreatment with NaOH
mesophilic batch 8.55 L(biogas)/kg FM
22.8 L(biogas)/kg FM
167% (Flores- Juarez et al., 2014)
Lignocellulosic agro- industrial waste
enzymatic pretreatment of sugar beet residues
mesophilic fed- batch
163 mL(biogas)/d
183 mL(biogas)/d
12% (Ziemiński et al., 2012)
hydrothermal NaOH pretreated rice straw
mesophilic batch 140 L(biogas)/kg VS
185 L(biogas)/kg VS
32% (Chandra et al., 2012)
14 • Anaerobic Digestion of Agri- Food By- Products
applied pretreatment technique and substrate type. Significant effectiveness of pretreatment methods has been reported for slaughterhouse waste; since this material is not easily degradable, any process for biogas enhancement would be beneficial.
Biogas Utilization
Biogas generated from anaerobic digestion is an environmentally friendly, clean, renewable fuel. There are two basic end uses for biogas: production of heat and electricity (combined heat and power generation, or CHP), and replacement of natural gas in transportation and the gas grid. Raw biogas contains impurities such as water, hydrogen sulphide, ammonia, etc., which must be removed to make it usable in some applications.
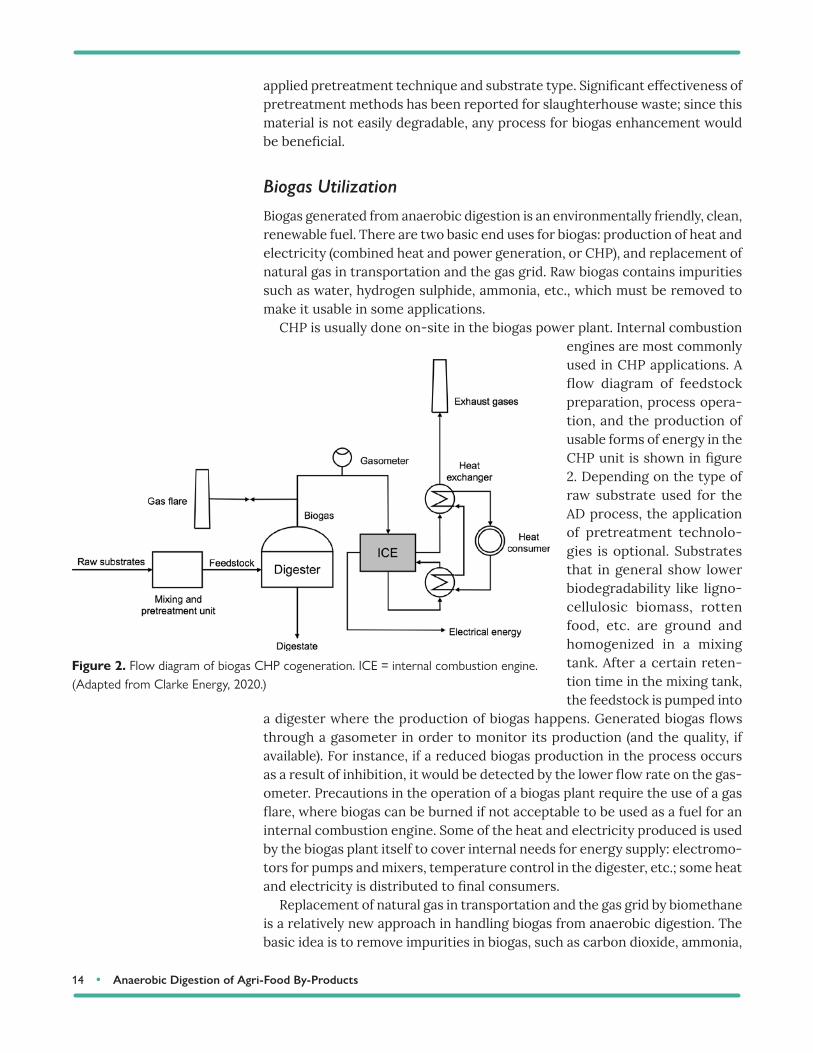
CHP is usually done on- site in the biogas power plant. Internal combustion engines are most commonly used in CHP applications. A flow diagram of feedstock preparation, process opera-tion, and the production of usable forms of energy in the CHP unit is shown in figure 2. Depending on the type of raw substrate used for the AD process, the application of pretreatment technolo-gies is optional. Substrates that in general show lower biodegradability like ligno-cellulosic biomass, rotten food, etc. are ground and homogenized in a mixing tank. After a certain reten-tion time in the mixing tank, the feedstock is pumped into
a digester where the production of biogas happens. Generated biogas flows through a gasometer in order to monitor its production (and the quality, if available). For instance, if a reduced biogas production in the process occurs as a result of inhibition, it would be detected by the lower flow rate on the gas-ometer. Precautions in the operation of a biogas plant require the use of a gas flare, where biogas can be burned if not acceptable to be used as a fuel for an internal combustion engine. Some of the heat and electricity produced is used by the biogas plant itself to cover internal needs for energy supply: electromo-tors for pumps and mixers, temperature control in the digester, etc.; some heat and electricity is distributed to final consumers.
Replacement of natural gas in transportation and the gas grid by biomethane is a relatively new approach in handling biogas from anaerobic digestion. The basic idea is to remove impurities in biogas, such as carbon dioxide, ammonia,
Figure 2. Flow diagram of biogas CHP cogeneration. ICE = internal combustion engine. (Adapted from Clarke Energy, 2020.)
Anaerobic Digestion of Agri- Food By- Products • 15
and hydrogen sulphide, and produce biomethane, which further can be used as a replacement for natural gas in the gas grid or as a transportation fuel, either as CNG (compressed natural gas) or LNG (liquid natural gas). There are several technological solutions for removal of non- methane components from biogas.
• In pressure swing adsorption (PSA), carbon dioxide is removed from biogas by alternating pressure levels and its adsorption/desorption on zeolites or activated carbon.
• In chemical solvent scrubbing (CSS), carbon dioxide is trapped in dis-solved compounds or liquid chemical, i.e., alkaline salt solutions and amine solutions.
• In pressurized water scrubbing (PWS), removal of carbon dioxide and hydrogen sulphide is based on their higher solubility in water compared to methane.
• In physical solvent scrubbing (PSS), instead of trapping carbon dioxide and hydrogen sulphide in water, some organic compounds can be used, i.e., glycols.
• Membrane separation is based on the different permeation rates of biogas compounds, when it undergoes high pressure across a nano- porous material (membrane) causing gas compound separation.
• Cryogenic distillation uses the condensing and freezing of carbon dioxide at low temperatures, at which methane is in the gas phase.
• Supersonic separation uses a specific nozzle to expand the saturated gas to supersonic velocities, which results in low temperature and pressure, which causes the change of aggregate state (condensation) and separa-tion of compounds.
• The industrial (ecological) “lung” uses an enzyme, carbonic anhydrase, to pull carbon dioxide into an aqueous phase and absorbed.
Due to a low investment price, high removal efficiencies, high reliability, or a wide range of contaminants removal, the most commonly applied upgrading technologies are water scrubbing, PSA, and chemical scrubbing. A combination of technologies is often used to process larger quantities of biogas to biometh-ane. However, upgrade technologies are generally expensive to purchase and can be costly to operate and maintain.
Digestate Management
A digestate is composed of two fractions, liquid and solid. After separating digestate material into fractions, different utilization methods can be applied, as Drosg et al. (2015) studied. The liquid fraction of digestate usually contains high concentrations of nitrogen and, therefore, it can be applied directly as a soil liquid fertilizer, without any processing required. Also, the liquid fraction can be re- fed to the digester and recirculated in the AD process. The solid frac-tion generally consists of non- degraded material (primarily lignin) which can cause odor emissions. To prevent this outcome, the solid fraction of digestate can be used as a feedstock for a composting process. The resulting compost is
16 • Anaerobic Digestion of Agri- Food By- Products
a biofertilizer that slowly releases nutrients and improves soil characteristics. The other option for solid digestate fraction utilization is to remove remaining moisture by drying and produce solid state fuel (pellets); this approach is not satisfactory as valuable nutrients present in solid digestate are lost. So far, using digestate as a biofertilizer seems to be the most sustainable option.
ExamplesExample 1: Theoretical oxygen demand and theoretical biochemical methane potential
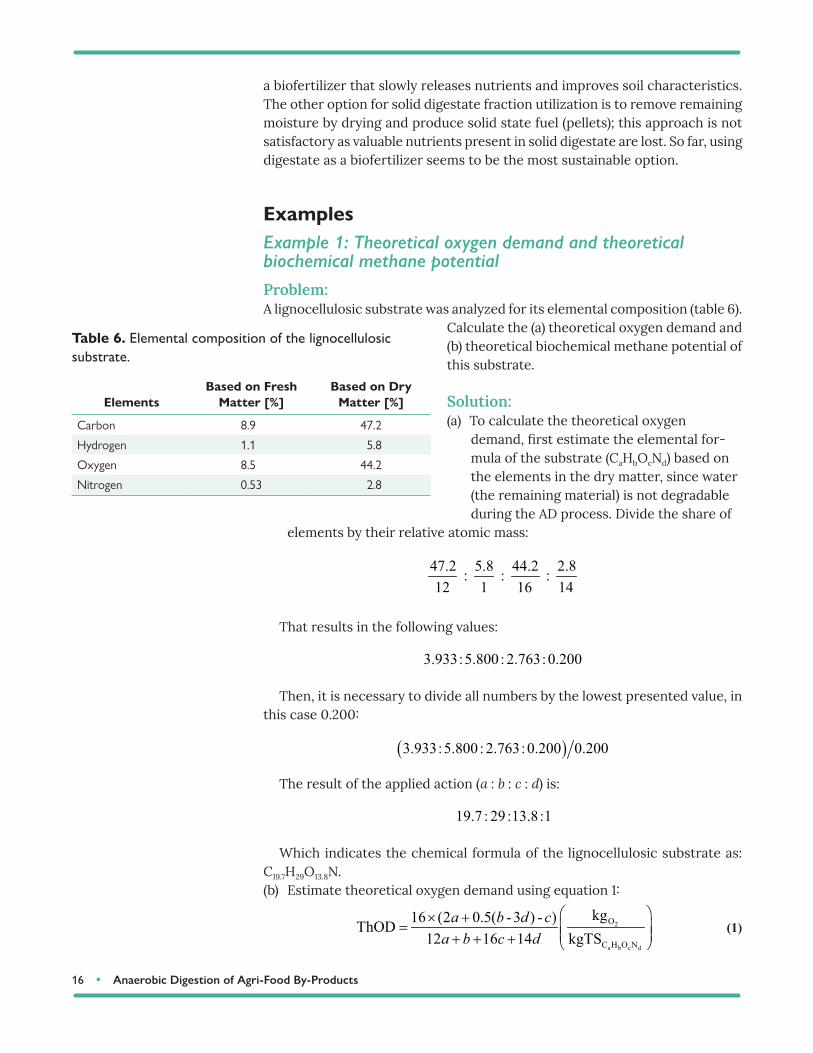
Problem:A lignocellulosic substrate was analyzed for its elemental composition (table 6).
Calculate the (a) theoretical oxygen demand and (b) theoretical biochemical methane potential of this substrate.
Solution: (a) To calculate the theoretical oxygen
demand, first estimate the elemental for-mula of the substrate (CaHbOcNd) based on the elements in the dry matter, since water (the remaining material) is not degradable during the AD process. Divide the share of
elements by their relative atomic mass:
47.2 5.8 44.2 2.8 : : : 12 1 16 14
That results in the following values:
3.933 : 5.800 : 2.763 : 0.200
Then, it is necessary to divide all numbers by the lowest presented value, in this case 0.200:
� �3.933 : 5.800 : 2.763 : 0.200 0.200
The result of the applied action (a : b : c : d) is:
19.7 : 29 : 13.8 : 1
Which indicates the chemical formula of the lignocellulosic substrate as: C19.7H29O13.8N. (b) Estimate theoretical oxygen demand using equation 1:
2
a b c d
O
C H O N
kg16 (2 0.5( -3 ) - )ThOD12 16 14 kgTS
� �� �� � �� �� � � � �
a b d ca b c d
(1)
Table 6. Elemental composition of the lignocellulosic substrate.
ElementsBased on Fresh
Matter [%]Based on Dry
Matter [%]
Carbon 8.9 47.2
Hydrogen 1.1 5.8
Oxygen 8.5 44.2
Nitrogen 0.53 2.8
Anaerobic Digestion of Agri- Food By- Products • 17
2
19.7 29 13.8
O
C H O N
1.235 kg16× (2×19.7 + 0.5× (29 - 3×1) -13.8)ThOD = =12×19.7 + 29 +16×13.8 +14×1 kgTS
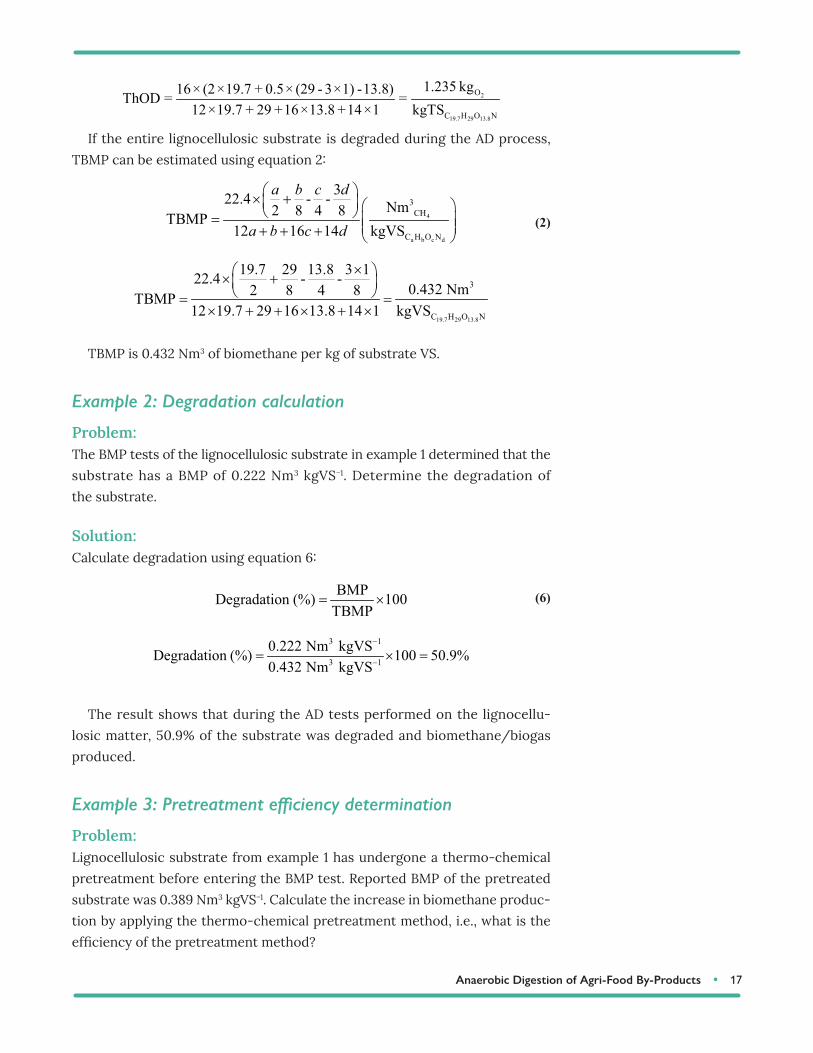
If the entire lignocellulosic substrate is degraded during the AD process, TBMP can be estimated using equation 2:
4
a b c d
3CH
C H O N
322.4 - - Nm2 8 4 8TBMP12 16 14 kgVS
a b c d
a b c d
� �� �� � � �� �� � �� �� � � � � (2)
19.7 29 13.8
3
C H O N
19.7 29 13.8 3 122.4 - -0.432 Nm2 8 4 8TBMP
12 19.7 29 16 13.8 14 1 kgVS
�� �� �� �� �� �
� � � � � �
TBMP is 0.432 Nm3 of biomethane per kg of substrate VS.
Example 2: Degradation calculation
Problem:The BMP tests of the lignocellulosic substrate in example 1 determined that the substrate has a BMP of 0.222 Nm3 kgVS−1. Determine the degradation of the substrate.
Solution:Calculate degradation using equation 6:
BMPDegradation (%) 100TBMP
� � (6)
3 1
3 1
0.222 Nm kgVS0.432
DegNm kgV
radation (%) 100 50.9S
%
�
�� � �
The result shows that during the AD tests performed on the lignocellu-losic matter, 50.9% of the substrate was degraded and biomethane/biogas produced.
Example 3: Pretreatment efficiency determination
Problem:Lignocellulosic substrate from example 1 has undergone a thermo- chemical pretreatment before entering the BMP test. Reported BMP of the pretreated substrate was 0.389 Nm3 kgVS−1. Calculate the increase in biomethane produc-tion by applying the thermo- chemical pretreatment method, i.e., what is the efficiency of the pretreatment method?
18 • Anaerobic Digestion of Agri- Food By- Products
Solution:Calculate the efficiency of the pretreatment method (increase in biomethane production) using equation 10:
BMP (after pretreatment) BMP (without pretreatment)Efficiency (%) 100
BMP (without pretreatment)�
� � BMP (after pretreatment) BMP (without pretreatment)Efficiency (%) 100
BMP (without pretreatment)�
� � (10)
3 1 3 1
3 1
0.389 Nm kgVS 0.222 Nm kg Efficiency (%) 100 75%
VS0.222 Nm kgVS
� �
�
�� � �
This case shows that the efficiency of the applied pretreatment technique is 75%.
Example 4: BGP test on anaerobic digestion of rotten food
Problem:BGP tests have been conducted on the anaerobic digestion of a rotten food mix-ture with an average C:N ratio of 12. The working volume of the laboratory reac-tor is 250 mL. The mass of raw feedstock put in the reactor was 100 g, with an
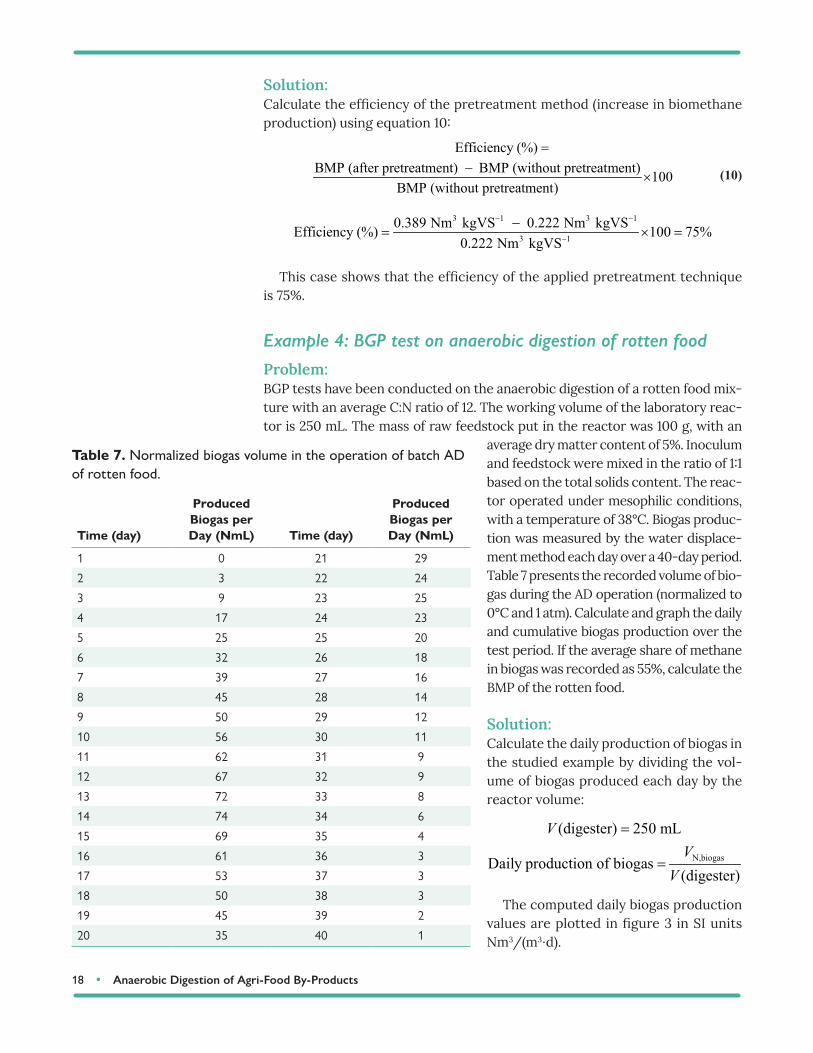
average dry matter content of 5%. Inoculum and feedstock were mixed in the ratio of 1:1 based on the total solids content. The reac-tor operated under mesophilic conditions, with a temperature of 38°C. Biogas produc-tion was measured by the water displace-ment method each day over a 40- day period. Table 7 presents the recorded volume of bio-gas during the AD operation (normalized to 0°C and 1 atm). Calculate and graph the daily and cumulative biogas production over the test period. If the average share of methane in biogas was recorded as 55%, calculate the BMP of the rotten food.
Solution:Calculate the daily production of biogas in the studied example by dividing the vol-ume of biogas produced each day by the reactor volume:
N,biogas
(digester) 250 mL
Daily production of biogas(digester)
VV
V
�
�
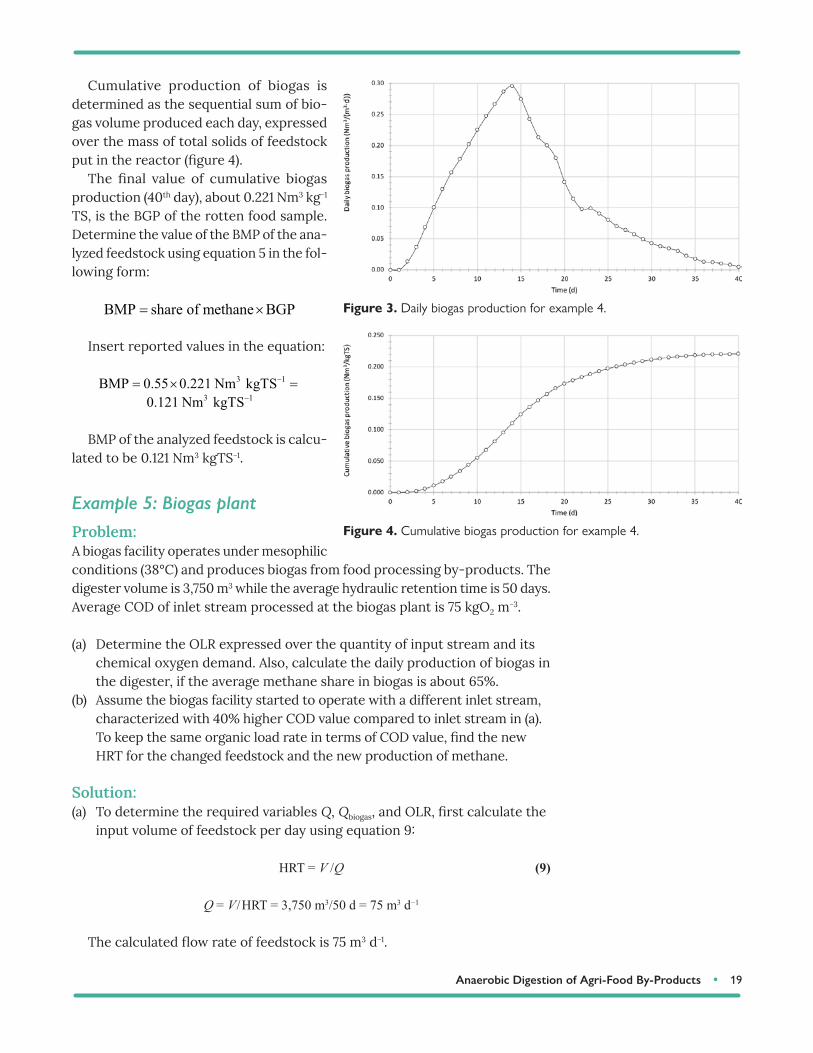
The computed daily biogas production values are plotted in figure 3 in SI units Nm3/(m3∙d).
Table 7. Normalized biogas volume in the operation of batch AD of rotten food.
Time (day)
Produced Biogas per Day (NmL) Time (day)
Produced Biogas per Day (NmL)
1 0 21 29
2 3 22 24
3 9 23 25
4 17 24 23
5 25 25 20
6 32 26 18
7 39 27 16
8 45 28 14
9 50 29 12
10 56 30 11
11 62 31 9
12 67 32 9
13 72 33 8
14 74 34 6
15 69 35 4
16 61 36 3
17 53 37 3
18 50 38 3
19 45 39 2
20 35 40 1
Anaerobic Digestion of Agri- Food By- Products • 19
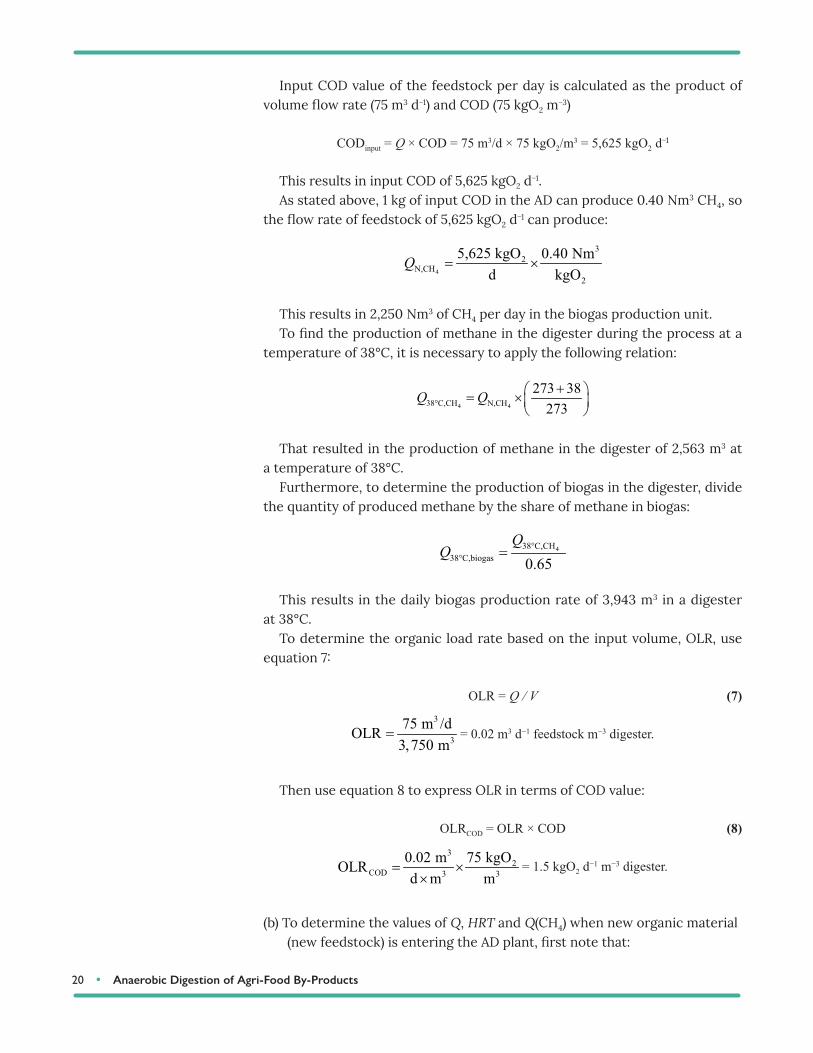
Cumulative production of biogas is determined as the sequential sum of bio-gas volume produced each day, expressed over the mass of total solids of feedstock put in the reactor (figure 4).
The final value of cumulative biogas production (40th day), about 0.221 Nm3 kg−1 TS, is the BGP of the rotten food sample. Determine the value of the BMP of the ana-lyzed feedstock using equation 5 in the fol-lowing form:
BMP share of methane BGP� �
Insert reported values in the equation:
3 1 3 10.221 Nm kgTS 0.121 NBMP 0.55 m kg S T� ��� �3 1 3 10.221 Nm kgTS 0.121 NBMP 0.55 m kg S T� ��� �
BMP of the analyzed feedstock is calcu-lated to be 0.121 Nm3 kgTS−1.
Example 5: Biogas plant
Problem:A biogas facility operates under mesophilic conditions (38°C) and produces biogas from food processing by-products. The digester volume is 3,750 m3 while the average hydraulic retention time is 50 days. Average COD of inlet stream processed at the biogas plant is 75 kgO2 m−3.
(a) Determine the OLR expressed over the quantity of input stream and its chemical oxygen demand. Also, calculate the daily production of biogas in the digester, if the average methane share in biogas is about 65%.
(b) Assume the biogas facility started to operate with a different inlet stream, characterized with 40% higher COD value compared to inlet stream in (a). To keep the same organic load rate in terms of COD value, find the new HRT for the changed feedstock and the new production of methane.
Solution: (a) To determine the required variables Q, Qbiogas, and OLR, first calculate the
input volume of feedstock per day using equation 9:
HRT = V /Q (9)
Q = V /HRT = 3,750 m3/50 d = 75 m3 d−1
The calculated flow rate of feedstock is 75 m3 d−1.
Figure 4. Cumulative biogas production for example 4.
Figure 3. Daily biogas production for example 4.
20 • Anaerobic Digestion of Agri- Food By- Products
Input COD value of the feedstock per day is calculated as the product of volume flow rate (75 m3 d−1) and COD (75 kgO2 m−3)
CODinput = Q × COD = 75 m3/d × 75 kgO2/m3 = 5,625 kgO2 d−1
This results in input COD of 5,625 kgO2 d−1.As stated above, 1 kg of input COD in the AD can produce 0.40 Nm3 CH4, so
the flow rate of feedstock of 5,625 kgO2 d−1 can produce:
4
32
N,CH2
5,625 kgO 0.40 Nmd kgO
Q � �
This results in 2,250 Nm3 of CH4 per day in the biogas production unit.To find the production of methane in the digester during the process at a
temperature of 38°C, it is necessary to apply the following relation:
4 438°C,CH N,CH273 38
273�� �� �� �
� �Q Q
That resulted in the production of methane in the digester of 2,563 m3 at a temperature of 38°C.
Furthermore, to determine the production of biogas in the digester, divide the quantity of produced methane by the share of methane in biogas:
438°C,CH 38°C,biogas 0.65
QQ �
This results in the daily biogas production rate of 3,943 m3 in a digester at 38°C.
To determine the organic load rate based on the input volume, OLR, use equation 7:
OLR = Q / V (7)3
3
75 m /dOLR3,750 m
� = 0.02 m3 d−1 feedstock m−3 digester.
Then use equation 8 to express OLR in terms of COD value:
OLRCOD = OLR × COD (8)
3
32
COD 3
md m m
0.02 75 kgOOLR � ��
= 1.5 kgO2 d−1 m−3 digester.
(b) To determine the values of Q, HRT and Q(CH4) when new organic material (new feedstock) is entering the AD plant, first note that:
Anaerobic Digestion of Agri- Food By- Products • 21
3
new old old old
3,750 mCOD COD 0.40 COD 1.4 COD
�� � � � �
V
Therefore, the COD value of a new feedstock is assumed to be 105 kgO2 m−3.Calculate the flow rate of the new feedstock using equation 8 in the follow-
ing modified form:COD
newnew
OLROLRCOD
�
23
2
1
new 3
d digesterOLR105 1.5 kgO
kgO feedstockm
m
� �
��
The new value of OLR is estimated to be 0.0143 m3 feedstock m−3 digester d−1.Calculate the input flow rate of the new feedstock using equation 7:
new newQ OLR V� �
3
33
new0.0143 m
d3,750
m mQ � �
�
The flow rate of the new feedstock is 53.63 m3 d−1. As expected, the input flow rate of the feedstock with higher COD is lower than the one in part (a) to maintain the same OLRCOD.
Since the input COD remains the same as in part (a), the production of meth-ane is not changed, 2,563 m3 at 38°C.
HRT for the new feedstock is calculated with equation 9 and found to be 70 days. Since the new feedstock has a lower flow rate compared to the one in part (a), it is necessary to prolong the period of feedstock retention to achieve the same OLRCOD.
Image Credits
Figure 1. Mähnert, P. (2020). (CC by 4.0). Theoretical biogas yield profiles for a batch test. Retrieved from https:// opus4 .kobv .de/ opus4 - slbp/ files/ 1301/ biogas03 .pdf
Figure 2. Clarke Energy. (2020). Flow diagram of biogas CHP cogeneration. ICE = internal combustion engine. Retrieved from https:// www .clarke - energy .com/ biogas/. [Fair Use].
Figure 3. Bedoić, R. (CC By 4.0). (2020). Daily biogas production for example 4.Figure 4. Bedoić, R. (CC By 4.0). (2020). Cumulative biogas production for example, 4.
References
Aboudi, K., Álvarez- Gallego, C. J., & Romero- García, L. I. (2016). Biomethanization of sugar beet byproduct by semi- continuous single digestion and co- digestion with cow manure. Bioresour. Technol., 200, 311- 319. https:// doi .org/ 10 .1016/ j .biortech .2015 .10 .051.
Al Seadi, T., Rutz, D., Prassl, H., Köttner, M., Finsterwalder, T., Volk, S., & Janssen, R. (2008). Biogas handbook. Esbjerg, Denmark: University of Southern Denmark Esbjerg.
22 • Anaerobic Digestion of Agri- Food By- Products
Ariunbaatar, J., Panico, A., Esposito, G., Pirozzi, F., & Lens, P. N. L. (2014). Pretreatment methods to enhance anaerobic digestion of organic solid waste. Appl. Energy, 123, 143- 156. https:// doi .org/ 10 .1016/ j .apenergy .2014 .02 .035.
Bedoić, R., Čuček, L., Ćosić, B., Krajnc, D., Smoljanić, G., Kravanja, Z., . . . Duić, N. (2019a). Green biomass to biogas— A study on anaerobic digestion of residue grass. J. Cleaner Prod., 213, 700- 709. https:// doi .org/ https:// doi .org/ 10 .1016/ j .jclepro .2018 .12 .224.
Bedoić, R., Ćosić, B., & Duić, N. (2019b). Technical potential and geographic distribution of agricultural residues, co- products and by- products in the European Union. Sci. Total Environ., 686, 568- 579. https:// doi .org/ 10 .1016/ j .scitotenv .2019 .05 .219.
Bochmann, G., & Montgomery, L. F. R. (2013). Storage and pre- treatment of substrates for biogas production. In A. Wellinger, J. Murphy, & D. Baxter (Eds.), The biogas handbook: Science, production and applications (pp. 85- 103). Woodhead Publishing. https:// doi .org/ 10 .1533/ 9780857097415 .1 .85.
Carlsson, M., Lagerkvist, A., & Ecke, H. (2008). Electroporation for enhanced methane yield from municipal solid waste. ORBIT 2008: Moving Organic Waste Recycling Towards Resource Management and Biobased Economy, 6, 1- 8.
Chandra, R., Takeuchi, H., & Hasegawa, T. (2012). Hydrothermal pretreatment of rice straw biomass: A potential and promising method for enhanced methane production. Appl. Energy, 94, 129- 140. https:// doi .org/ 10 .1016/ j .apenergy .2012 .01 .027.
Clarke Energy (2020). Biogas. Retrieved from https:// www .clarke -energy .com/ biogas/.Das, A., & Mondal, C. (2016). Biogas production from co- digestion of substrates: A review. Int.
Res. J. Environ. Sci., 5(1), 49- 57.Drosg, B., Fuchs, W., Al Seadi, T., Madsen, M., & Linke, B. (2015). Nutrient recovery by biogas
digestate processing. IEA Bioenergy. Retrieved from http:// www .iea -biogas .net.Flores- Juarez, C. R., Rodríguez- García, A., Cárdenas- Mijangos, J., Montoya- Herrera, L., Godinez
Mora- Tovar, L. A., Bustos- Bustos, E., . . . Manríquez- Rocha, J. (2014). Chemically pretreat-ing slaughterhouse solid waste to increase the efficiency of anaerobic digestion. J. Biosci. Bioeng., 118(4), 415- 419. https:// doi .org/ 10 .1016/ j .jbiosc .2014 .03 .013.
Frigon, J. C., & Guiot, S. R. (2010). Biomethane production from starch and lignocellulosic crops: A comparative review. Biofuels, Bioprod. Biorefin., 4(4), 447- 458. https:// doi .org/ 10 .1002/ bbb .229.
Gerike, P. (1984). The biodegradability testing of poorly water soluble compounds. Chemo-sphere, 13(1), 169- 190. https:// doi .org/ 10 .1016/ 0045 -6535 (84 )90018 -3.
Izumi, K., Okishio, Y., Nagao, N., Niwa, C., Yamamoto, S., & Toda, T. (2010). Effects of particle size on anaerobic digestion of food waste. Int. Biodeterioration and Biodegradation, 64(7), 601- 608. https:// doi .org/ 10 .1016/ j .ibiod .2010 .06 .013.
Karak, N. (2016). Biopolymers for paints and surface coatings. In F. Pacheco- Torgal, V. Ivanov, & H. Jonkers (Eds.). Biopolymers and biotech admixtures for eco- efficient construction materials (pp. 333- 368). Woodhead Publishing. https:// doi .org/ 10 .1016/ B978 -0 -08 -100214 -8 .00015 -4.
Koch, K., Lübken, M., Gehring, T., Wichern, M., & Horn, H. (2010). Biogas from grass silage— Measurements and modeling with ADM1. Bioresour. Technol., 101(21), 8158- 8165. https:// doi .org/ 10 .1016/ j .biortech .2010 .06 .009.
Lauwers, J., Appels, L., Thompson, I. P., Degrève, J., Van Impe, J. F., & Dewil, R. (2013). Math-ematical modelling of anaerobic digestion of biomass and waste: Power and limitations. Prog. Energy Combust. Sci., 39, 383- 402. https:// doi .org/ 10 .1016/ j .pecs .2013 .03 .003.
Li, Y., Zhang, R., Chen, C., Liu, G., He, Y., & Liu, X. (2013). Biogas production from co- digestion of corn stover and chicken manure under anaerobic wet, hemi- solid, and solid state con-ditions. Bioresour. Technol., 149, 406- 412. https:// doi .org/ 10 .1016/ j .biortech .2013 .09 .091.
Liu, C., Yuan, X., Zeng, G., Li, W., & Li, J. (2008). Prediction of methane yield at optimum pH for anaerobic digestion of organic fraction of municipal solid waste. Bioresour. Technol., 99, 882- 888. https:// doi .org/ 10 .1016/ j .biortech .2007 .01 .013.
Ma, J., Duong, T. H., Smits, M., Verstraete, W., & Carballa, M. (2011). Enhanced biomethanation of kitchen waste by different pre- treatments. Bioresour. Technol., 102(2), 592- 599. https:// doi .org/ 10 .1016/ j .biortech .2010 .07 .122.
Anaerobic Digestion of Agri- Food By- Products • 23
Ma, J., Zhao, Q. B., Laurens, L. L. M., Jarvis, E. E., Nagle, N. J., Chen, S., & Frear, C. S. (2015). Mechanism, kinetics and microbiology of inhibition caused by long- chain fatty acids in anaerobic digestion of algal biomass. Biotechnol. Biofuels, 8(1). https:// doi .org/ 10 .1186/ s13068 -015 -0322 -z.
Mähnert, P. (2006). Grundlagen und verfahren der biogasgewinnung. Leitfaden Biogas (FNR), 13- 25. Retrieved from https:// opus4 .kobv .de/ opus4 -slbp/ files/ 1301/ biogas03 .pdf.
Moukazis, I., Pellera, F. M., & Gidarakos, E. (2018). Slaughterhouse by- products treatment using anaerobic digestion. Waste Manage., 71, 652- 662. https:// doi .org/ 10 .1016/ j .wasman .2017 .07 .009.
Mulat, D. G., Dibdiakova, J., & Horn, S. J. (2018). Microbial biogas production from hydrolysis lignin: Insight into lignin structural changes. Biotechnol. Biofuels, 11(61). https:// doi .org/ 10 .1186/ s13068 -018 -1054 -7.
Patil, V. S., & Deshmukh, H. V. (2015). A review on co- digestion of vegetable waste with organic wastes for energy generation. Int. J. Biol. Sci., 4(6), 83- 86.
Pognani, M., D’Imporzano, G., Scaglia, B., & Adani, F. (2009). Substituting energy crops with organic fraction of municipal solid waste for biogas production at farm level: A full- scale plant study. Process Biochem., 44(8), 817- 821. https:// doi .org/ 10 .1016/ j .procbio .2009 .03 .014.
Ruffino, B., Fiore, S., Roati, C., Campo, G., Novarino, D., & Zanetti, M. (2015). Scale effect of anaerobic digestion tests in fed- batch and semi- continuous mode for the technical and economic feasibility of a full scale digester. Bioresour. Technol., 182, 302- 313. https:// doi .org/ 10 .1016/ j .biortech .2015 .02 .021.
Sung, S., & Liu, T. (2003). Ammonia inhibition on thermophilic anaerobic digestion. Chemo-sphere, 53(1), 43- 52. https:// doi .org/ 10 .1016/ S0045 -6535 (03 )00434 -X.
Ueno, Y., Tatara, M., Fukui, H., Makiuchi, T., Goto, M., & Sode, K. (2007). Production of hydro-gen and methane from organic solid wastes by phase- separation of anaerobic process. Bioresour. Technol., 98(9), 1861- 1865. https:// doi .org/ 10 .1016/ j .biortech .2006 .06 .017.
Van Lier, J. B., Rebac, S., & Lettinga, G. (1997). High- rate anaerobic wastewater treatment under psychrophilic and thermophilic conditions. Water Sci. Technol., 35, 199- 206. https:// doi .org/ 10 .1016/ S0273 -1223 (97 )00202 -3.
Ware, A., & Power, N. (2016). What is the effect of mandatory pasteurisation on the biogas transformation of solid slaughterhouse wastes? Waste Manag., 48, 503– 512. https:// doi .org/ 10 .1016/ j .wasman .2015 .10 .013.
Xie, S., Hai, F. I., Zhan, X., Guo, W., Ngo, H. H., Price, W. E., & Nghiem, L. D. (2016). Anaerobic co- digestion: A critical review of mathematical modelling for performance optimization. Bioresour. Technol., 222, 498- 512. https:// doi .org/ 10 .1016/ j .biortech .2016 .10 .015.
Zhu, B., Gikas, P., Zhang, R., Lord, J., Jenkins, B., & Li, X. (2009). Characteristics and biogas production potential of municipal solid wastes pretreated with a rotary drum reactor. Bioresour. Technol., 100(3), 1122- 1129. https:// doi .org/ 10 .1016/ j .biortech .2008 .08 .024.
Ziemiński, K., Romanowska, I., & Kowalska, M. (2012). Enzymatic pretreatment of lignocel-lulosic wastes to improve biogas production. Waste Manag., 32(6), 1131- 1137. https:// doi .org/ 10 .1016/ j .wasman .2012 .01 .016.
Zonta, Ž., Alves, M. M., Flotats, X., & Palatsi, J. (2013). Modelling inhibitory effects of long chain fatty acids in the anaerobic digestion process. Water Res., 47(3), 1369- 1380. https:// doi .org/ 10 .1016/ j .watres .2012 .12 .007.