Embed Size (px)
Citation preview
AAnacostia Active Cappingia A tive C inacost c app ng DDemonstrationemonstration StStatusatus
Danny Reible, PhD, PE, DEE, AN ESmith Chair of Environmental eH alth
EngineeringUniversity of Texas at Austin
NATO CCMS- Ljubljana, SloveniaJune 19, 2007
2
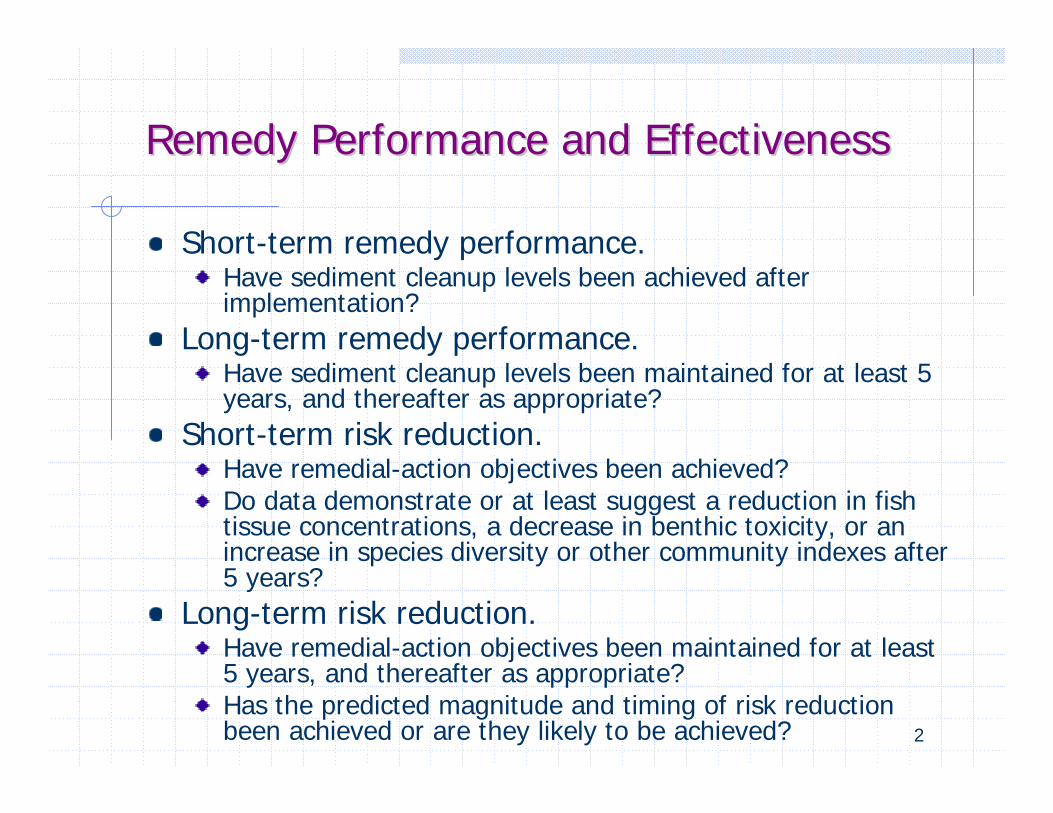
Remedy Performance and EffectivenessRemedy Performance and Effectiveness
Short-term remedy performance. Have sediment cleanup levels been achieved afterimplementation?
Long-term remedy performance. Have sediment cleanup levels been maintained for at least 5 years, and thereafter as appropriate?
Short-term risk reduction. Have remedial-action objectives been achieved? Do data demonstrate or at least suggest a reduction in fishtissue concentrations, a decrease in benthic toxicity, or anincrease in species diversity or other community indexes after5 years?
Long-term risk reduction. Have remedial-action objectives been maintained for at least 5 years, and thereafter as appropriate? Has the predicted magnitude and timing of risk reductionbeen achieved or are they likely to be achieved?
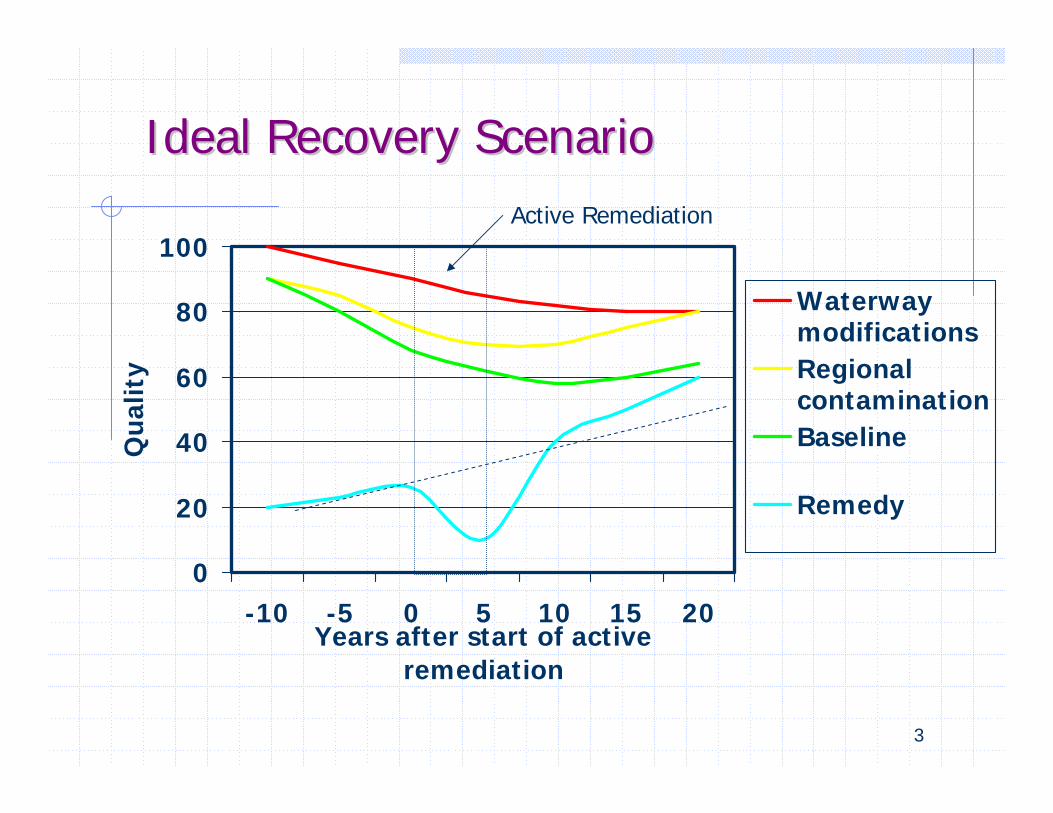
Ideal Recovery ScenarioIdeal Recovery ScenarioActive Remediation
100
80
60
40
20
0
-10
Qua
lity
Waterway modifications Regional contamination Baseline
Remedy
-5 0 5 10 15 20Years after start of active
remediation
3
4
BackgroundBackgroundDredging effectiveness uncertain
Sediment Dredging at Superfund Megasites:Assessing the Effectiveness, National Research Council Report 2007 Site factors reduce effectiveness (e.g. debris) Monitoring has been inadequate to demonstrate effectiveness
Capping with sand easy to implement but may not be sufficiently protective (e.g. groundwater upwelling) Alternative – “active” capping
Capping with sequestering or reactive components to aid cap effectiveness Demonstration of placement and containment effectiveness in Anacostia River, Washington DC Demonstration of organoclay for NAPL containment
Creosote- Portland, Oregon Manufactured gas plant wastes – New York
EPA Hazardous Substance Research CenterEPA Hazardous Substance Research Center
South and SouthwestLouisiana State University Georgia Institute of Technology Rice University Texas A&M University University of Texas www.hsrc-ssw.org www.sediments.org
• Research and Technology Transfer • Contaminated sediments and dredged material • Historically focused on in-situ processes and risk management • Unique regional (4&6) hazardous substance problems
• Outreach • Primarily regional in scope • Driven by community interests and problems
• Courses - Application of US Sediment Remediation Guidance • Next Course, September 5-7,2007 Portland, Oregon, USA
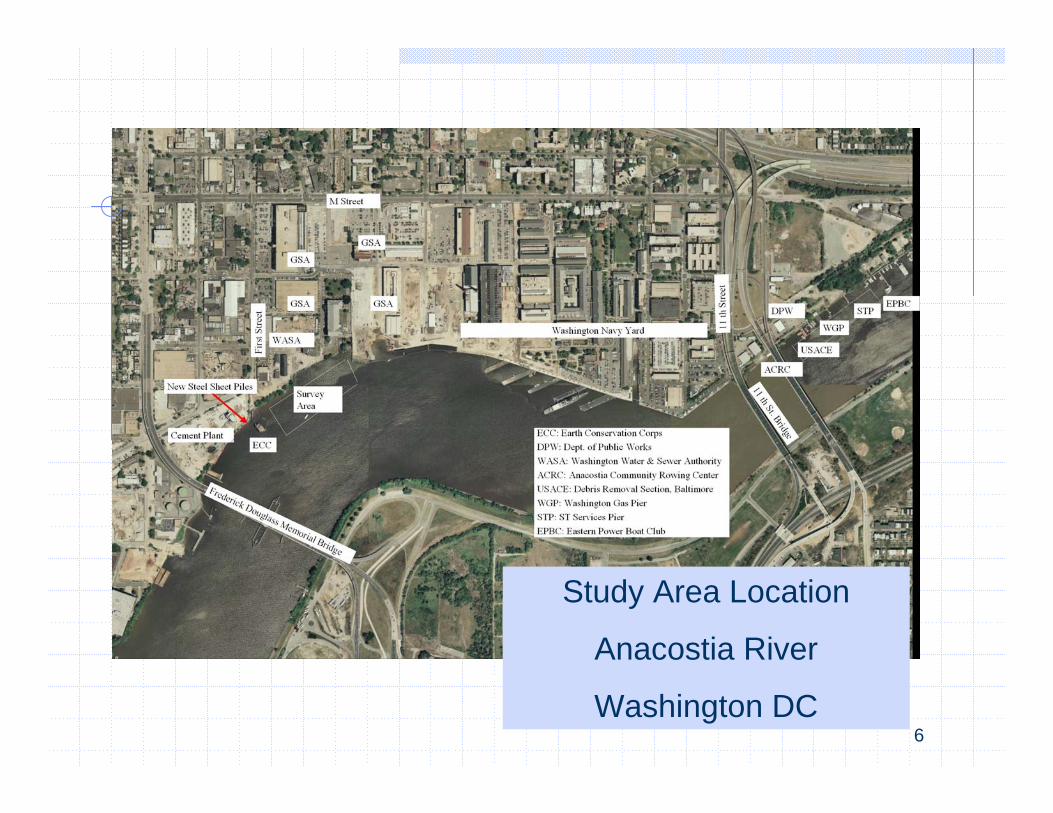
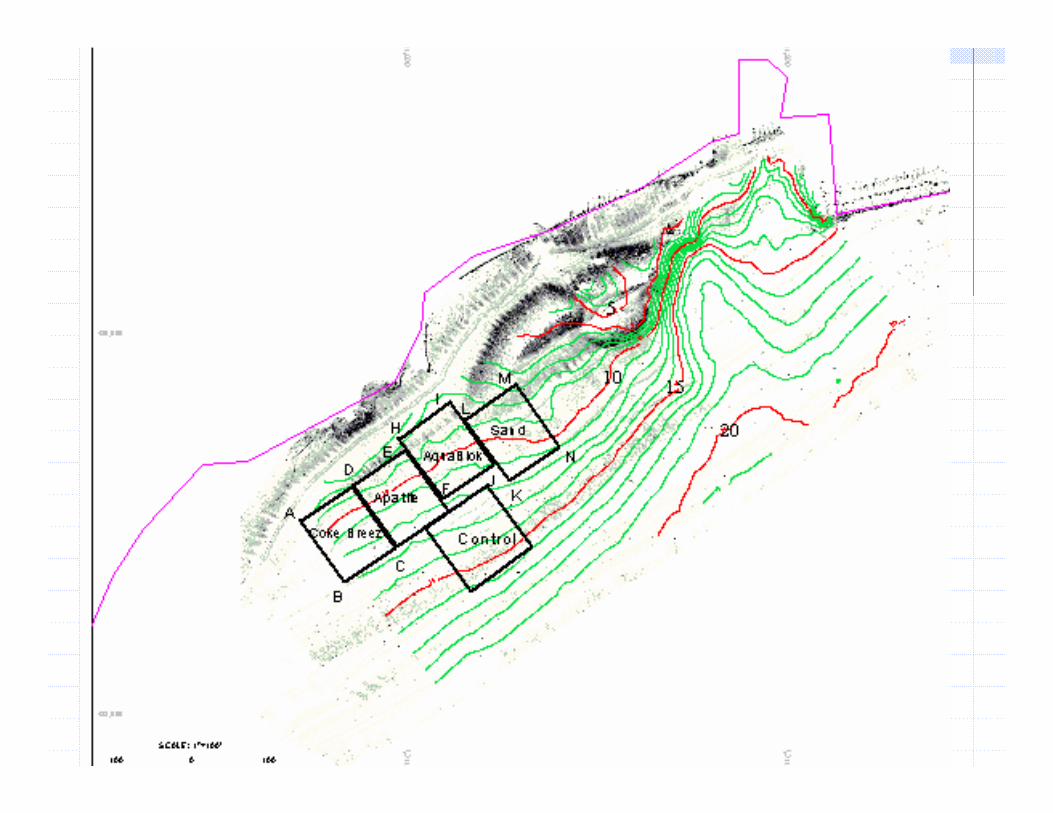
Study Area Location
Anacostia River
Washington DC6
7
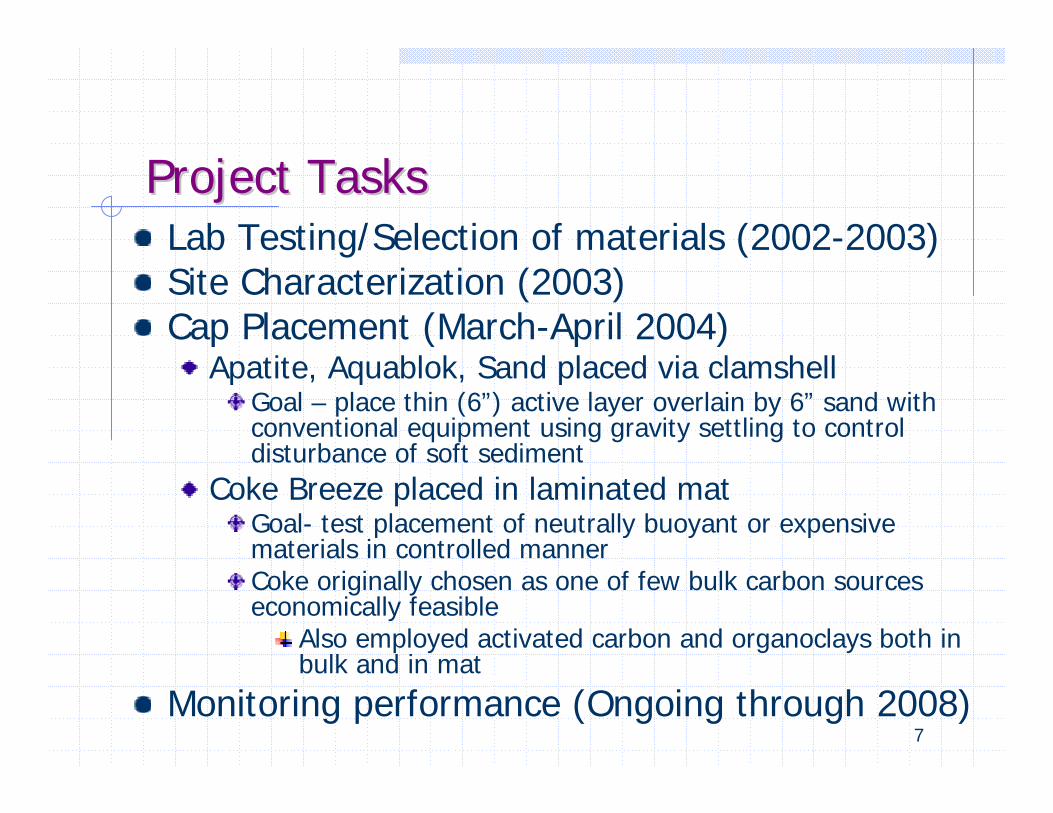
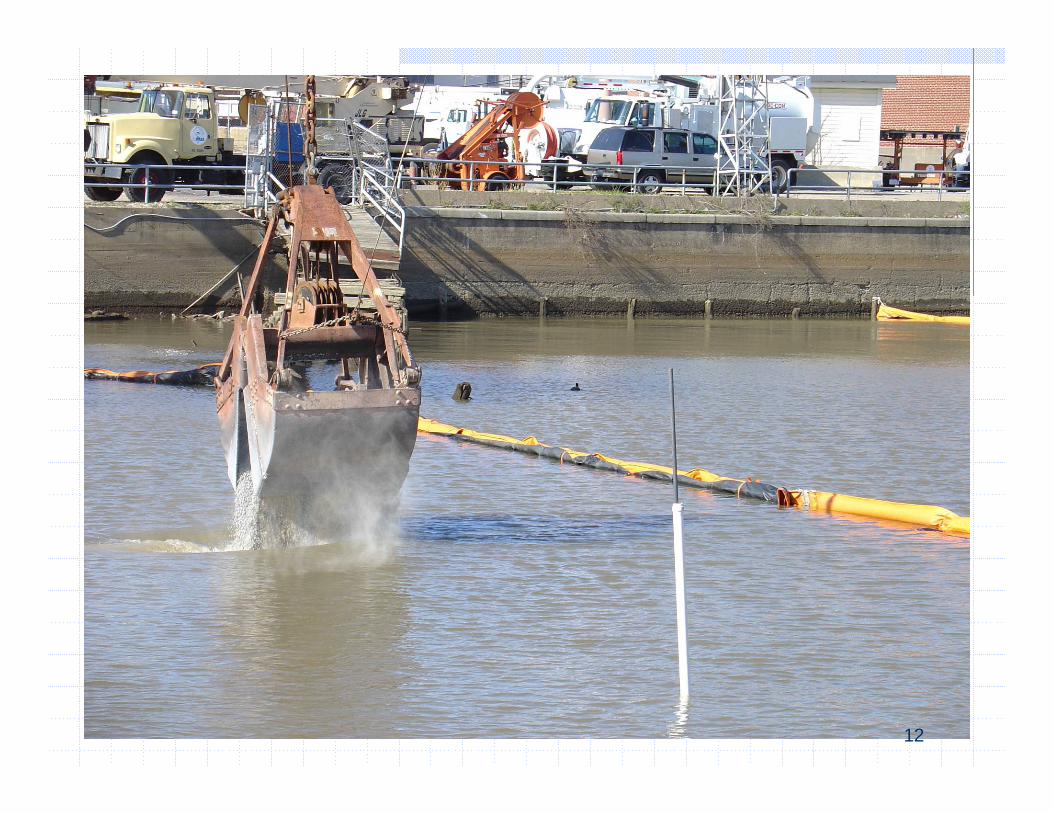
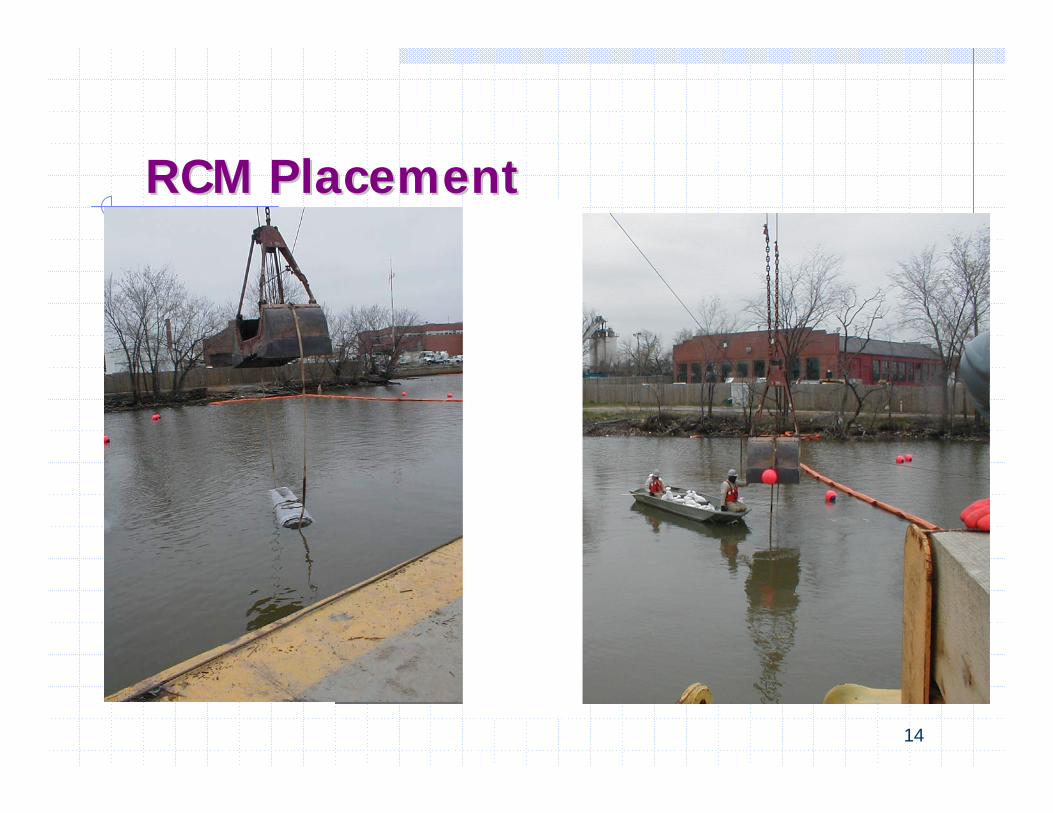
Project TasksProject TasksLab Testing/Selection of materials (2002-2003) Site Characterization (2003) Cap Placement (March-April 2004)
Apatite, Aquablok, Sand placed via clamshell Goal – place thin (6”) active layer overlain by 6” sand with conventional equipment using gravity settling to controldisturbance of soft sediment
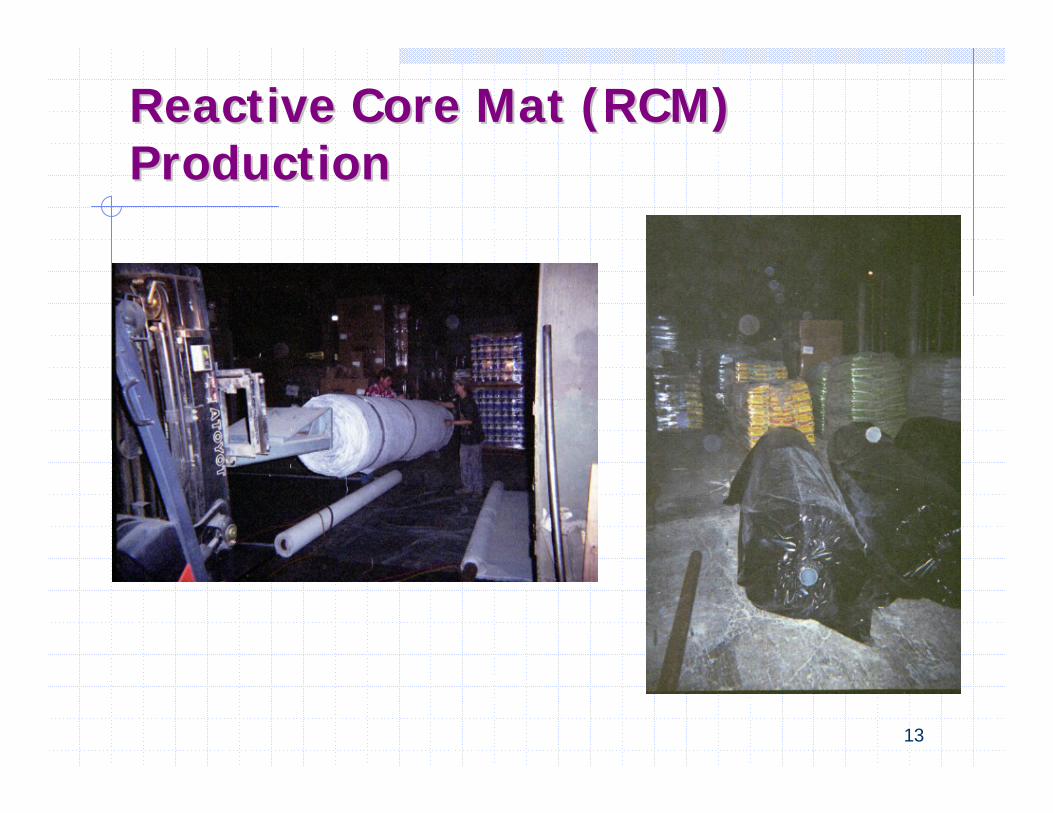
Coke Breeze placed in laminated mat Goal- test placement of neutrally buoyant or expensivematerials in controlled manner Coke originally chosen as one of few bulk carbon sourceseconomically feasible
Also employed activated carbon and organoclays both in bulk and in mat
Monitoring performance (Ongoing through 2008)
8
0
500
1000
1500
2000
2500
3000
3500
4000
4500
0 500 3500
C /foc (ppb)
Ct/f
(
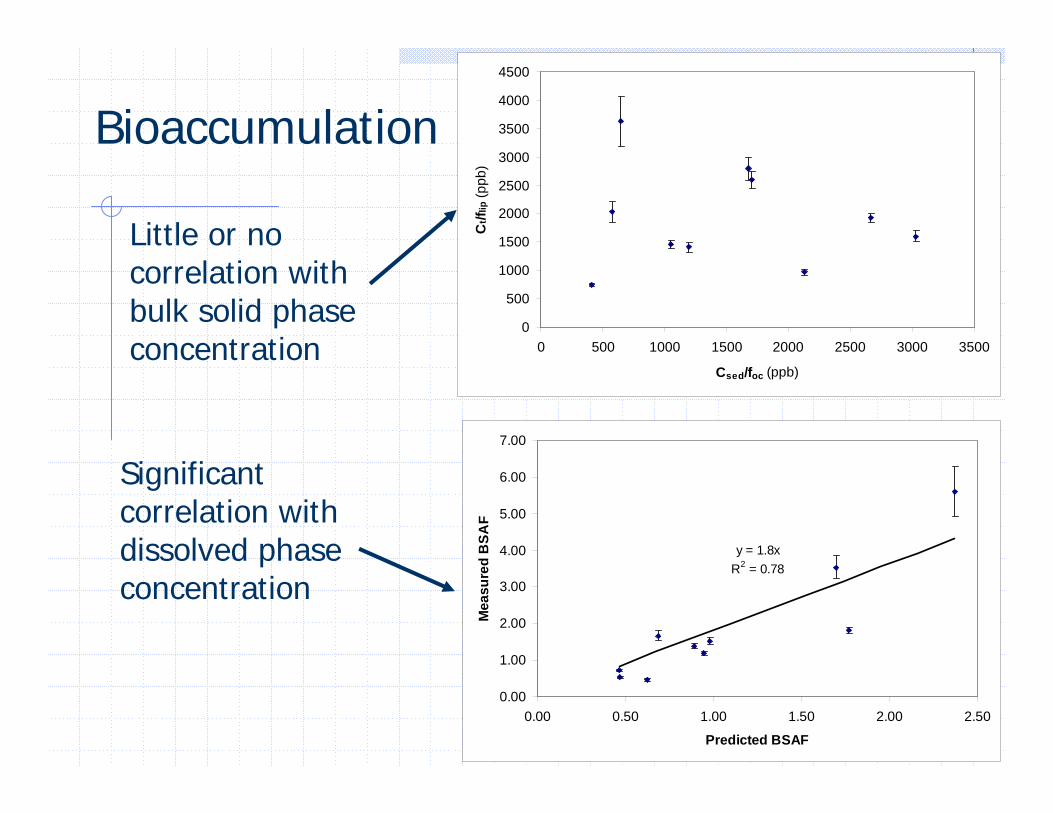
Little or no correlation with bulk solid phase concentration
R2
Bioaccumulation
Significant correlation with
concentration
1000 1500 2000 2500 3000
sed
lippp
b)
y = 1.8x = 0.78
0.00
1.00
2.00
3.00
4.00
5.00
6.00
7.00
0.00 0.50 1.00 1.50 2.00 2.50
Predicted BSAF
Mea
sure
d B
SAF
dissolved phase
9
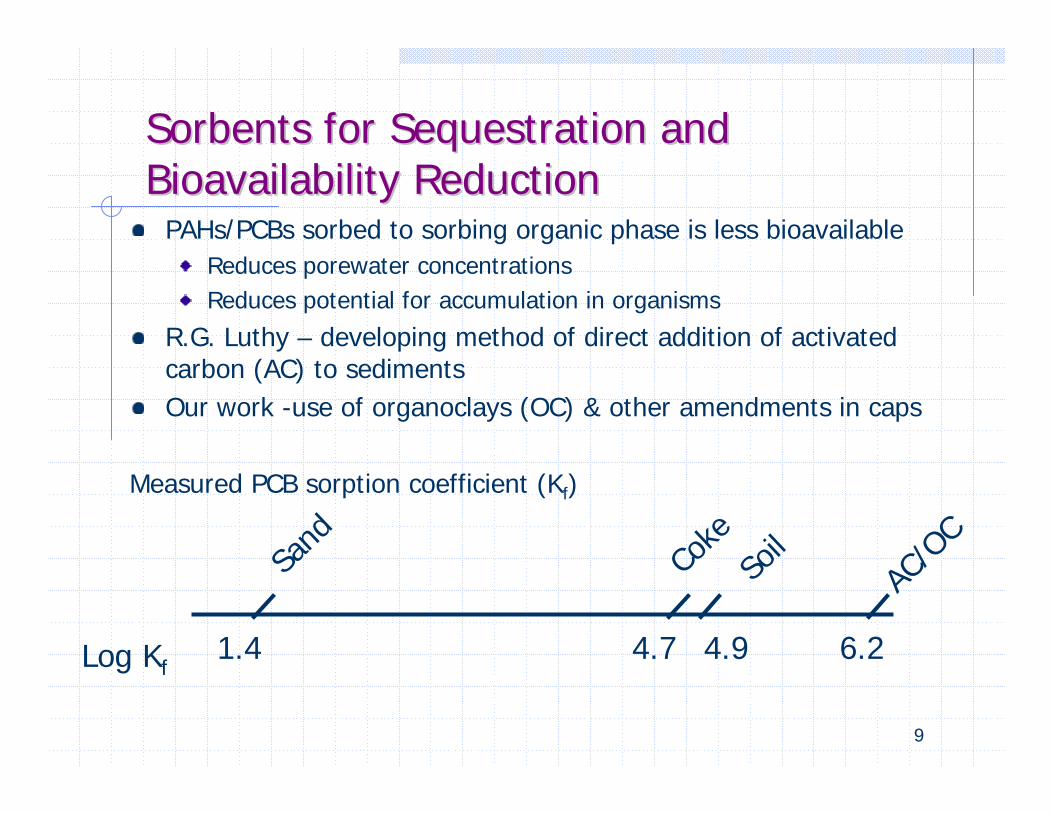
Sorbents for Sequestration andSorbents for Sequestration and Bioavailability ReductionBioavailability Reduction
1.4 4.7 4.9 6.2Log Kf
Coke
Sand
AC/O
CSo
il
PAHs/PCBs sorbed to sorbing organic phase is less bioavailable Reduces porewater concentrations Reduces potential for accumulation in organisms
R.G. Luthy – developing method of direct addition of activated carbon (AC) to sediments Our work -use of organoclays (OC) & other amendments in caps
Measured PCB sorption coefficient (Kf)
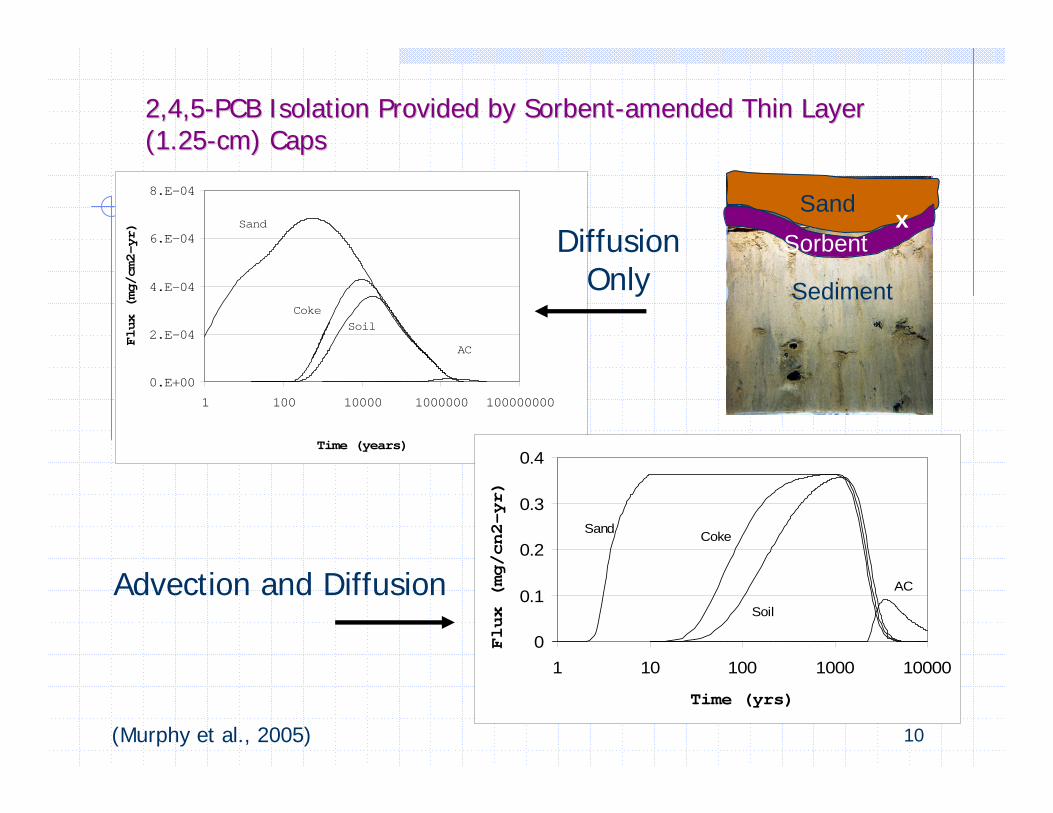
Considerable flux reduction with AC
10
2,4,52,4,5--PCB Isolation Provided by SorbentPCB Isolation Provided by Sorbent--amended Thin Layeramended Thin Layer (1.25(1.25--cm) Capscm) Caps
0.E+00
2.E-04
4.E-04
6.E-04
8.E-04
1 100 10000 1000000 100000000
Time (years)
Flux (mg/cm2-yr)
Coke
Sand
Soil
AC
Long isolation times
0
0.1
0.2
0.3
0.4
1 10 100 1000 10000
Time (yrs)
Flux (mg/cn2-yr)
Sand Coke
Soil
AC
Diffusion Only
Advection and Diffusion
(Murphy et al., 2005)
Sediment
Sand
Sorbent x
11
12
13
Reactive Core Mat (RCM)Reactive Core Mat (RCM) ProductionProduction
14
RCM PlacementRCM Placement
15
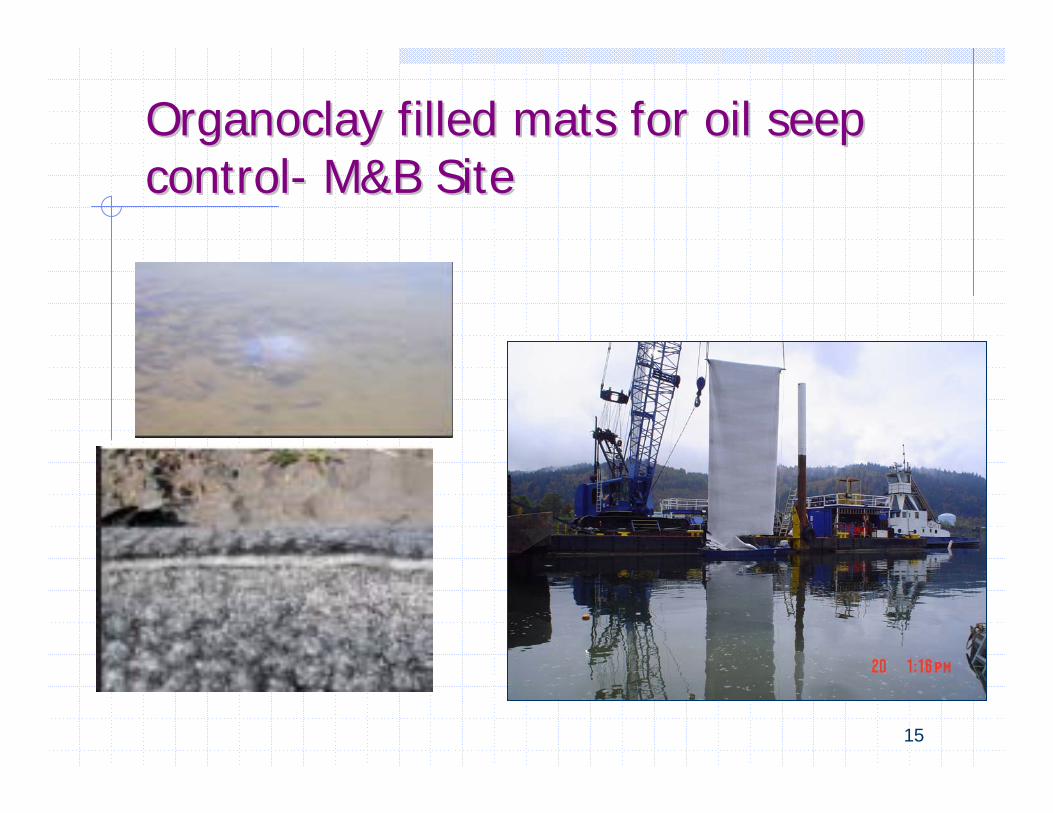
OrganoclayOrganoclay filled mats for oil seepfilled mats for oil seep controlcontrol-- M&B SiteM&B Site
16
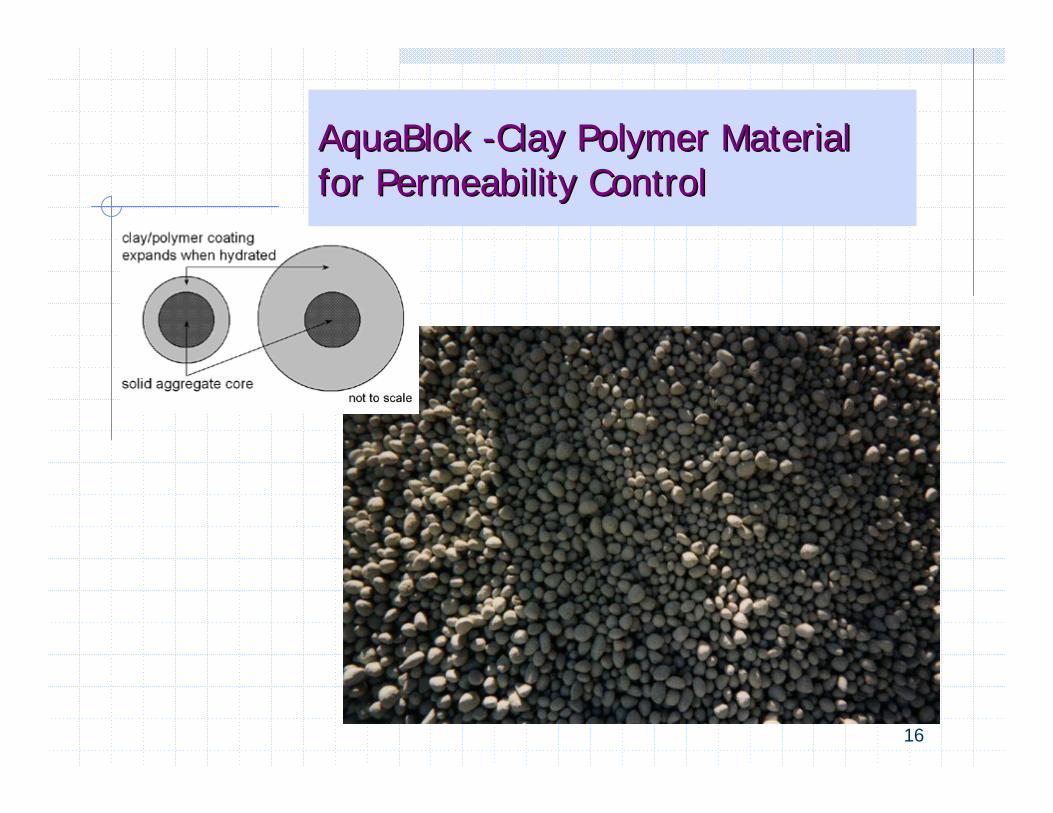
AquaBlokAquaBlok --Clay Polymer MaterialClay Polymer Material for Permeability Controlfor Permeability Control
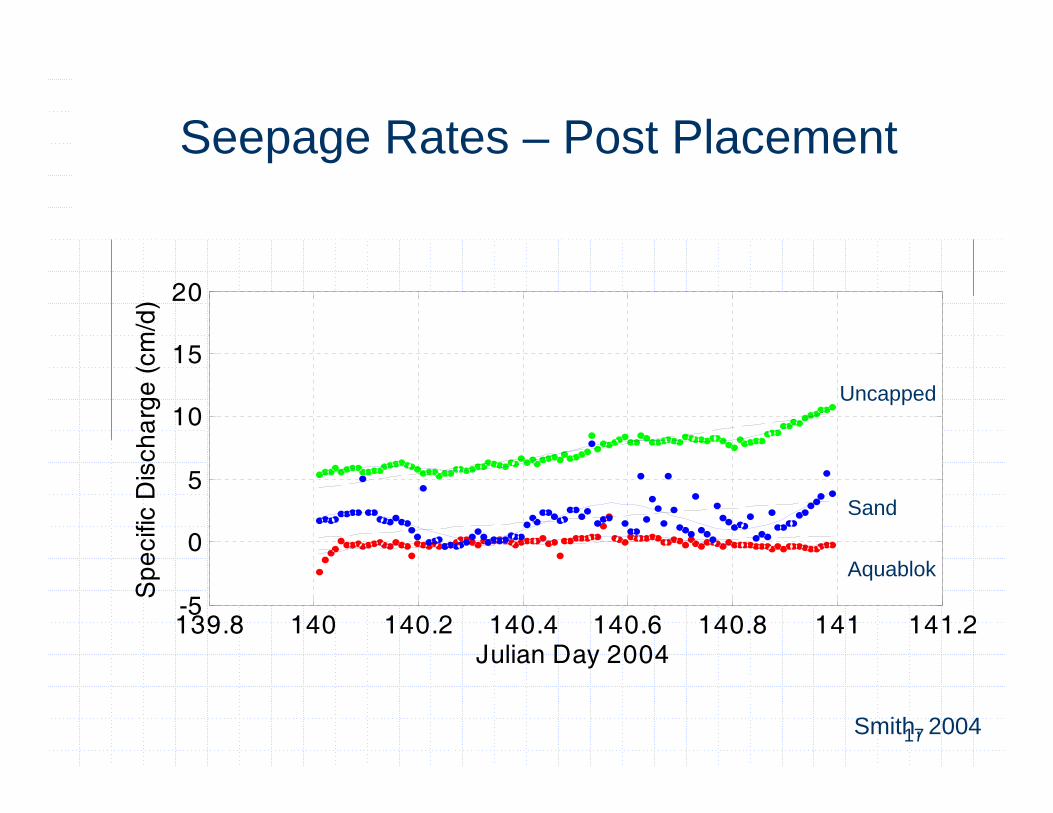
139.8 140 140.2 140.4 140.6 140.8 141 141.29
10
11
Sur
face
W See e Rates – Post Placementpag
20
/d)
sch
arg
e (
cm 15
Uncapped10
i 5
fic D Sand
i 0
Sp
ec
Aquablok
-5 139.8 140 140.2
J140.4
li140.6
2004140.8 141 141.2
u an Day
S 1mith,7 2004
18
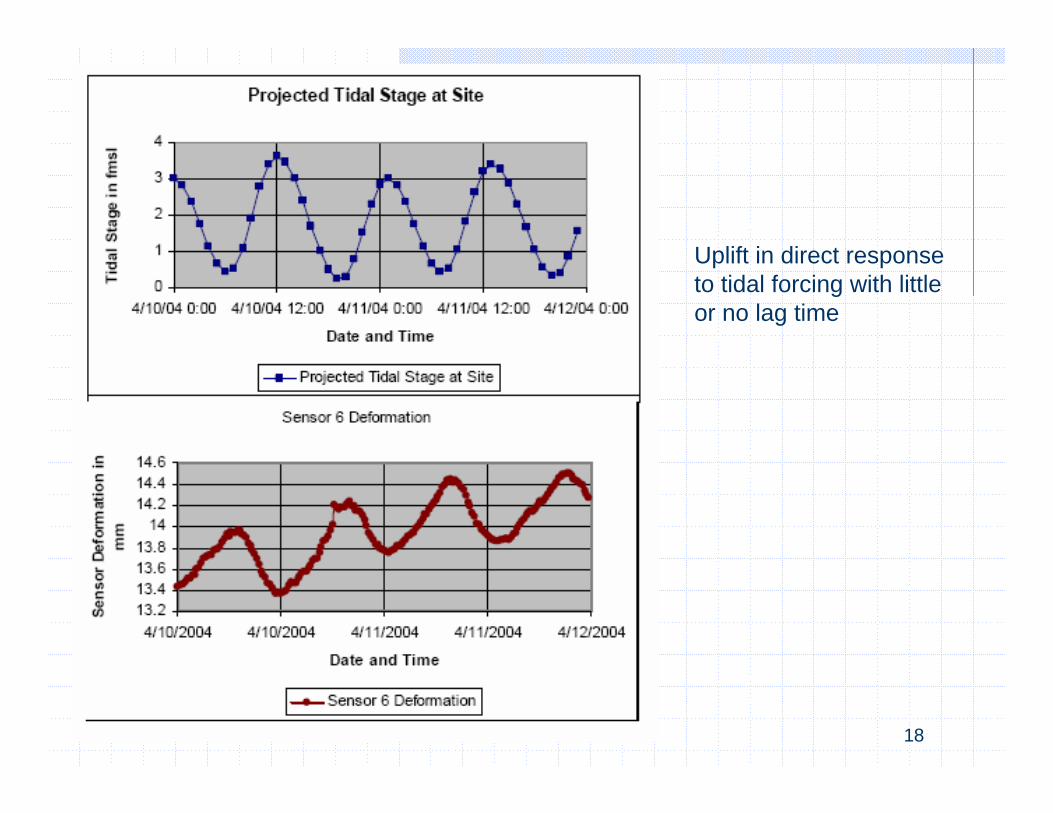
Uplift in direct response to tidal forcing with little or no lag time
19
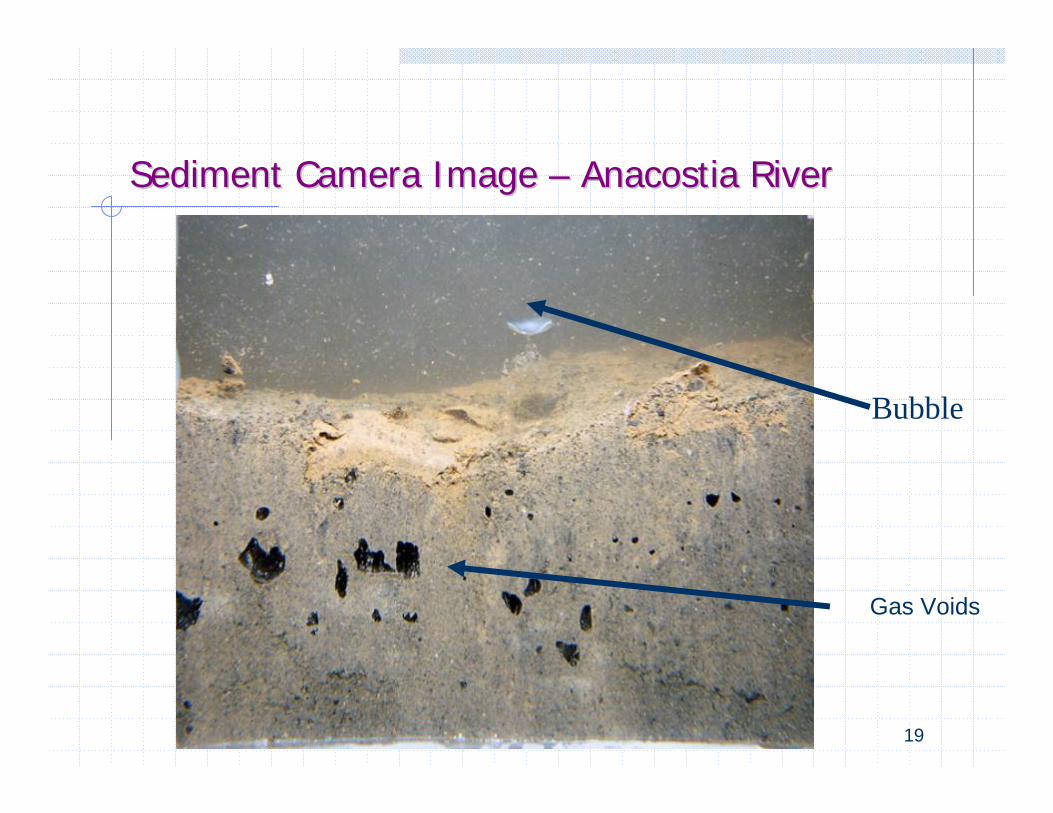
Sediment Camera ImageSediment Camera Image –– Anacostia RiverAnacostia River
Bubble
Gas Voids
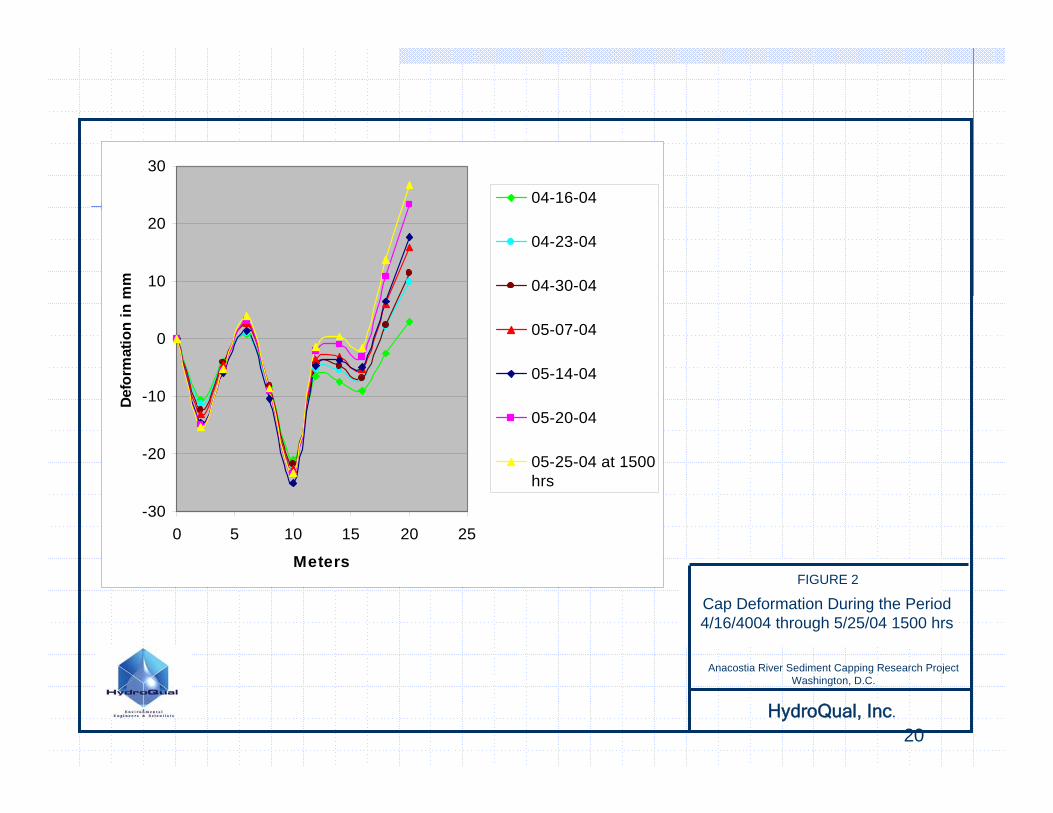
20
FIGURE 2
.
ject
0
10
20
30
0 5 10 15 20 25
04-16-04
04-23-04
04-30-04
05-07-04
05-14-04
05-20-04
hrs
Cap Deformation During the Period 4/16/4004 through 5/25/04 1500 hrs
HydroQual, Inc
Anacostia River Sediment Capping Research ProWashington, D.C.
-30
-20
-10
Meters
Def
orm
atio
n in
mm
05-25-04 at 1500
21
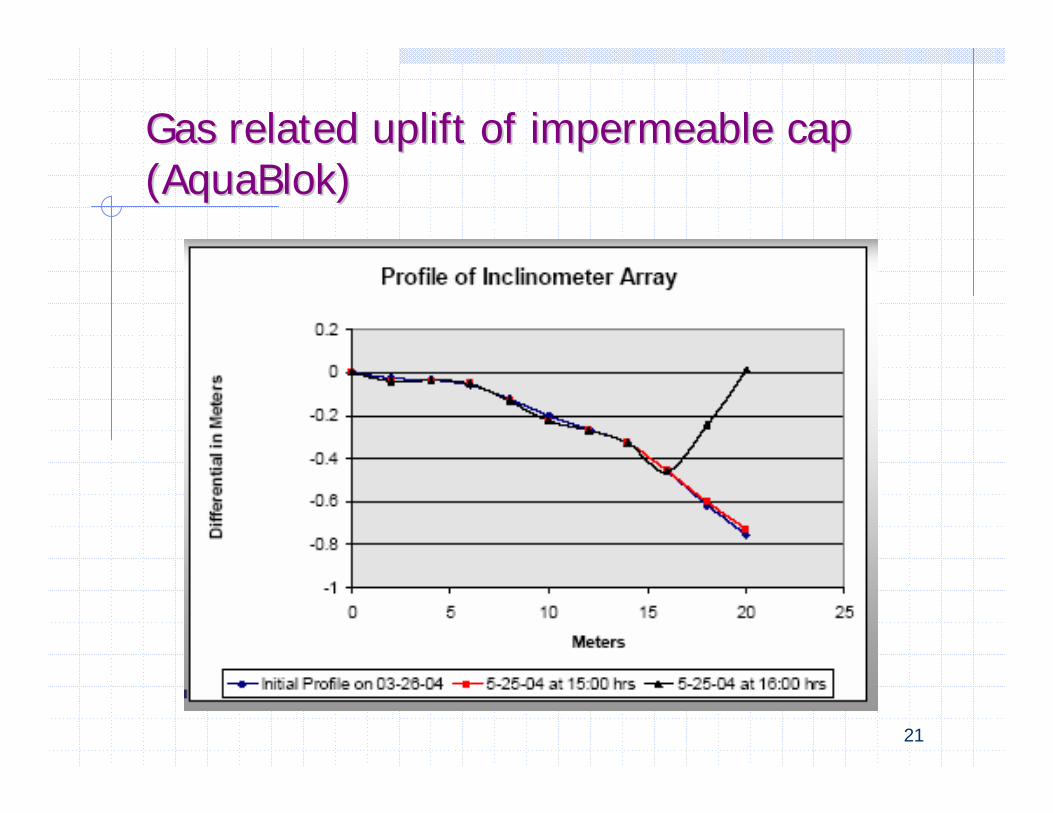
Gas related uplift of impermeable capGas related uplift of impermeable cap ((AquaBlokAquaBlok))
22
23
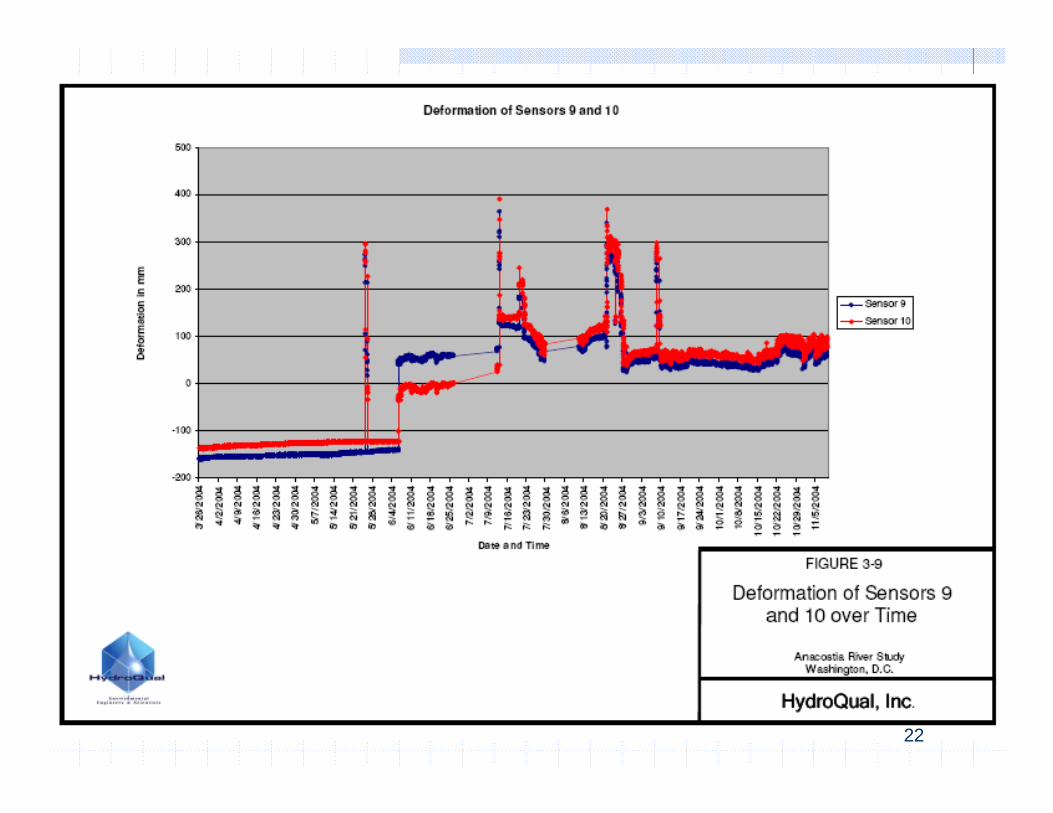
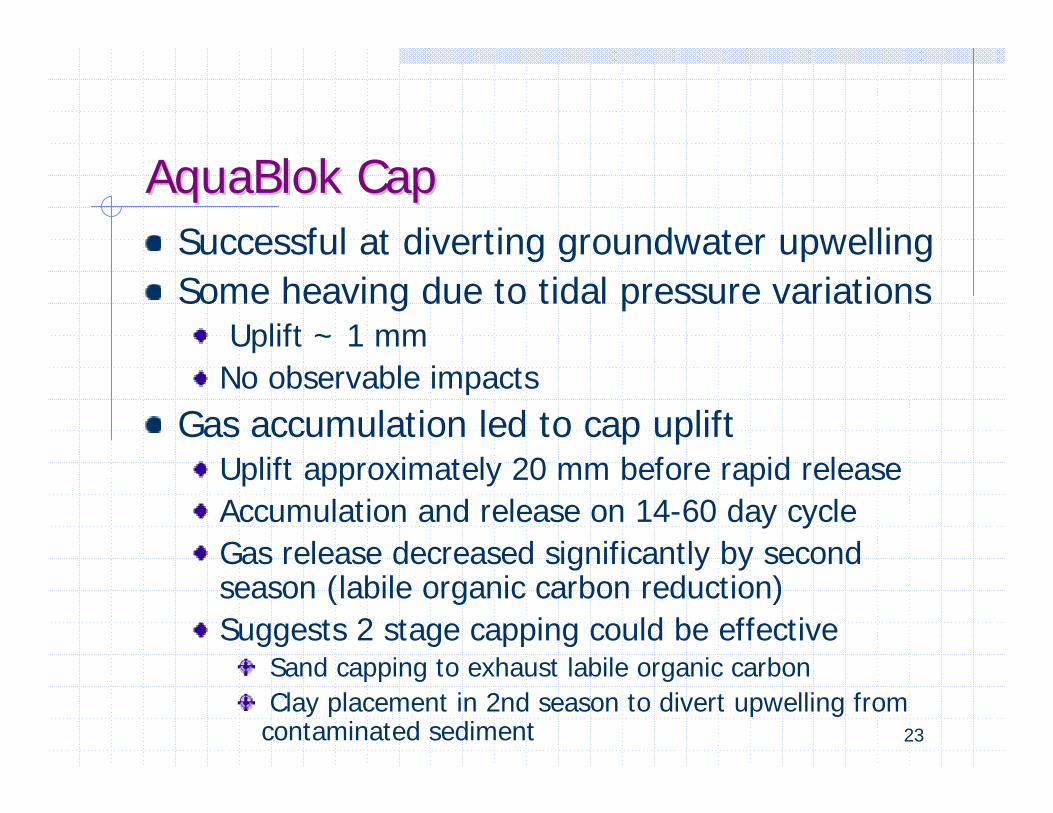
AquaBlokAquaBlok CapCapSuccessful at diverting groundwater upwelling Some heaving due to tidal pressure variations
Uplift ~ 1 mm No observable impacts
Gas accumulation led to cap uplift Uplift approximately 20 mm before rapid release Accumulation and release on 14-60 day cycle Gas release decreased significantly by second season (labile organic carbon reduction) Suggests 2 stage capping could be effective
Sand capping to exhaust labile organic carbon Clay placement in 2nd season to divert upwelling from contaminated sediment
Effectiveness of other caps?Effectiveness of other caps?
Basic Question
Are organic and metal sequestration layers more effective than sand?
24
25
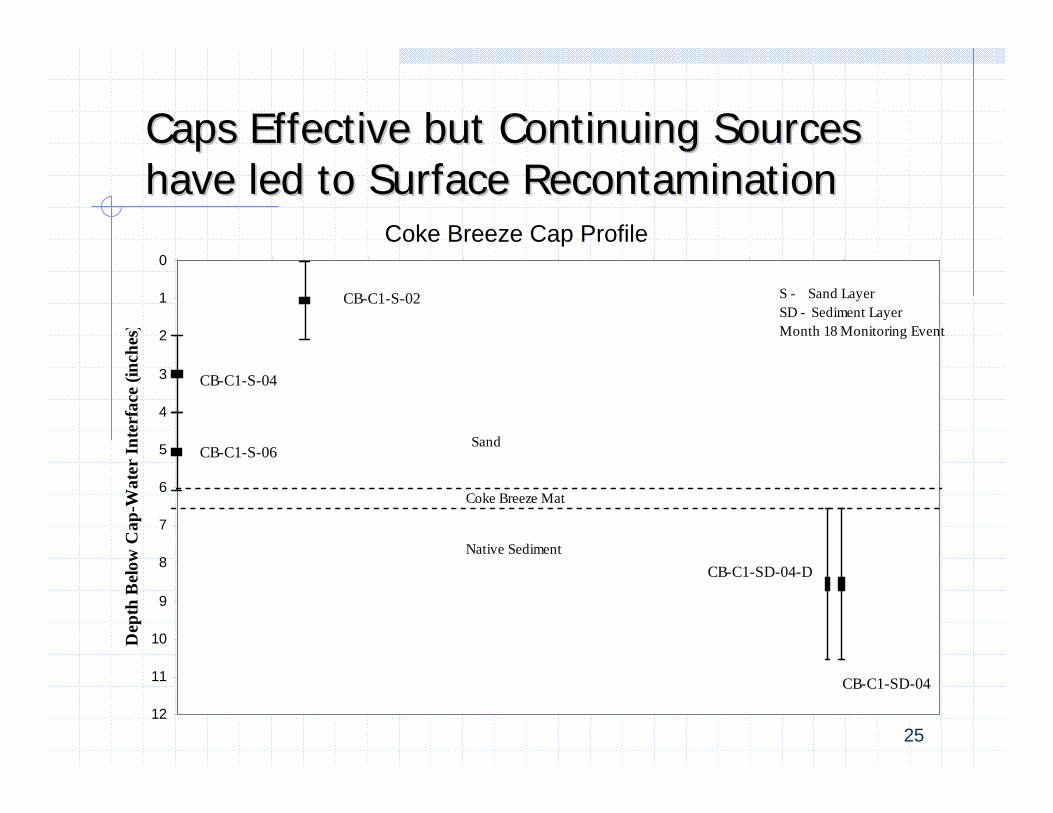
Caps Effective but ContinuingCaps Effective but Continuing SourcesSources have led tohave led to SurfaceSurface RecontaminationRecontamination
CB-C1-S-06
CB-C1-S-04
CB-C1-S-02
CB-C1-SD-04
CB-C1-SD-04-D
0
1
2
3
4
5
6
7
8
9
10
11
12
Dep
th B
elow
Cap
-Wat
er In
terf
ace
(inch
es)
S Sand Layer SD - Sediment Layer Month 18 Monitoring Event
Coke Breeze Mat
Native Sediment
Sand
Coke Breeze Cap Profile
Apatite-Sediment Interface
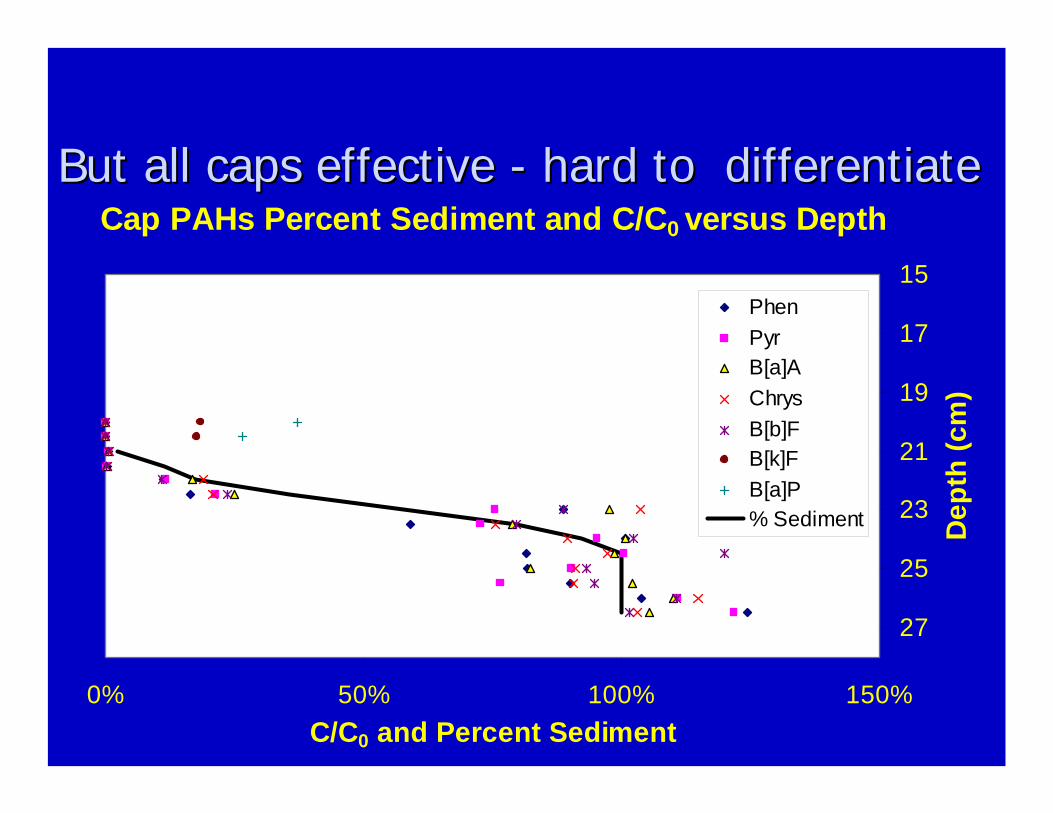
But all caps effectiveBut all caps effective -- hard tohard to differentiatedifferentiateCap PAHs Percent Sediment and C/C0 versus Depth
15
17
19
21
23
25
27
0% 50% 100% 150% C/C0 and Percent Sediment
Dep
th (c
m)
Phen Pyr B[a]A Chrys B[b]F B[k]F B[a]P % Sediment
27
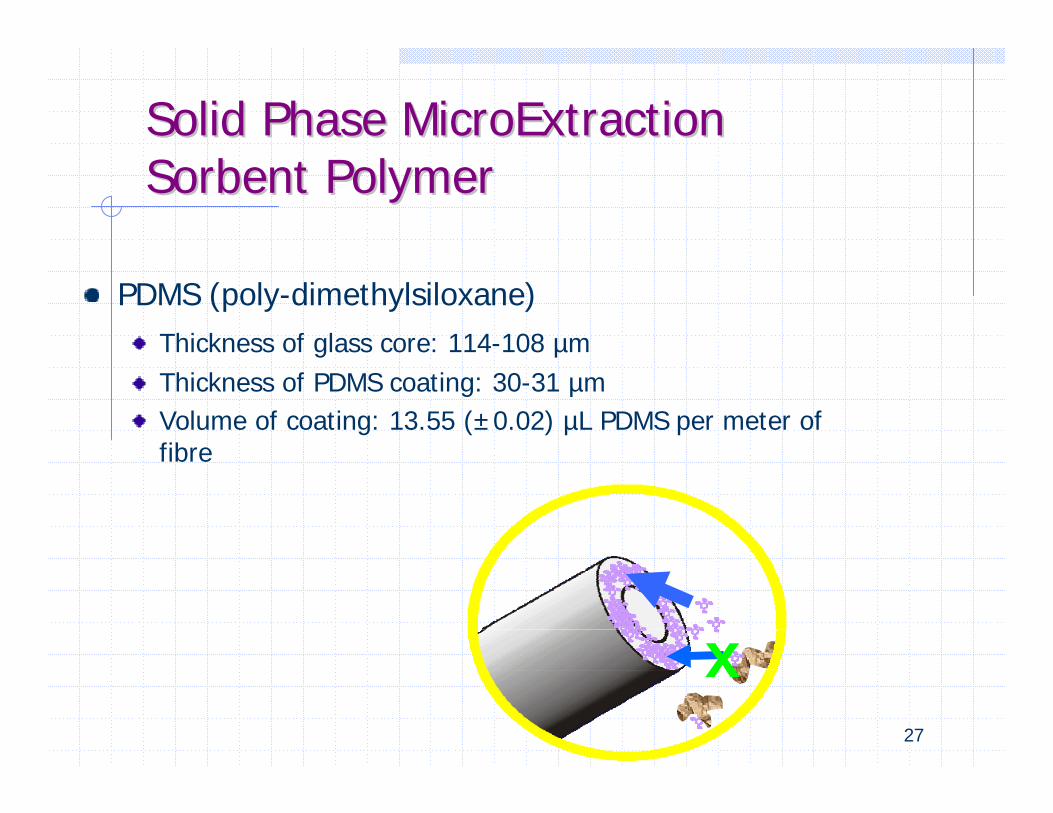
Solid PhaseSolid Phase MicroExtractionMicroExtractionSorbentSorbent PolymerPolymer
PDMS (poly-dimethylsiloxane) Thickness of glass core: 114-108 µm Thickness of PDMS coating: 30-31 µm Volume of coating: 13.55 (±0.02) µL PDMS per meter of fibre
x
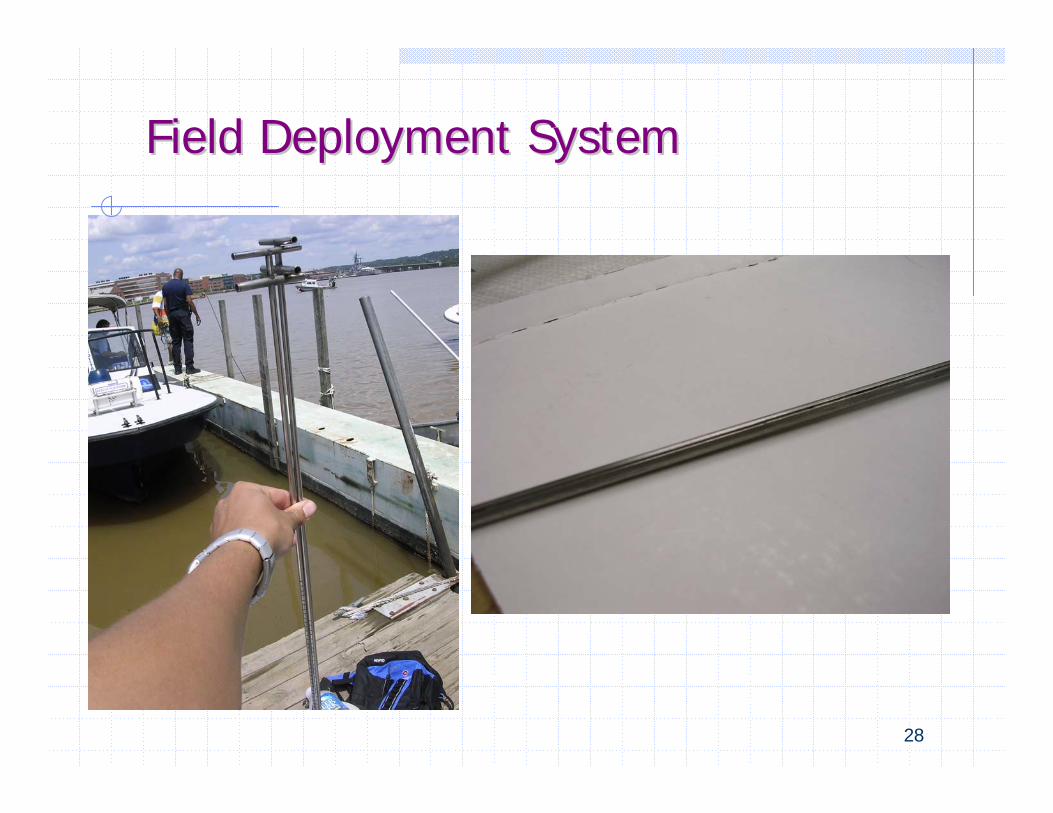
Field Deployment SystemField Deployment System
28
29
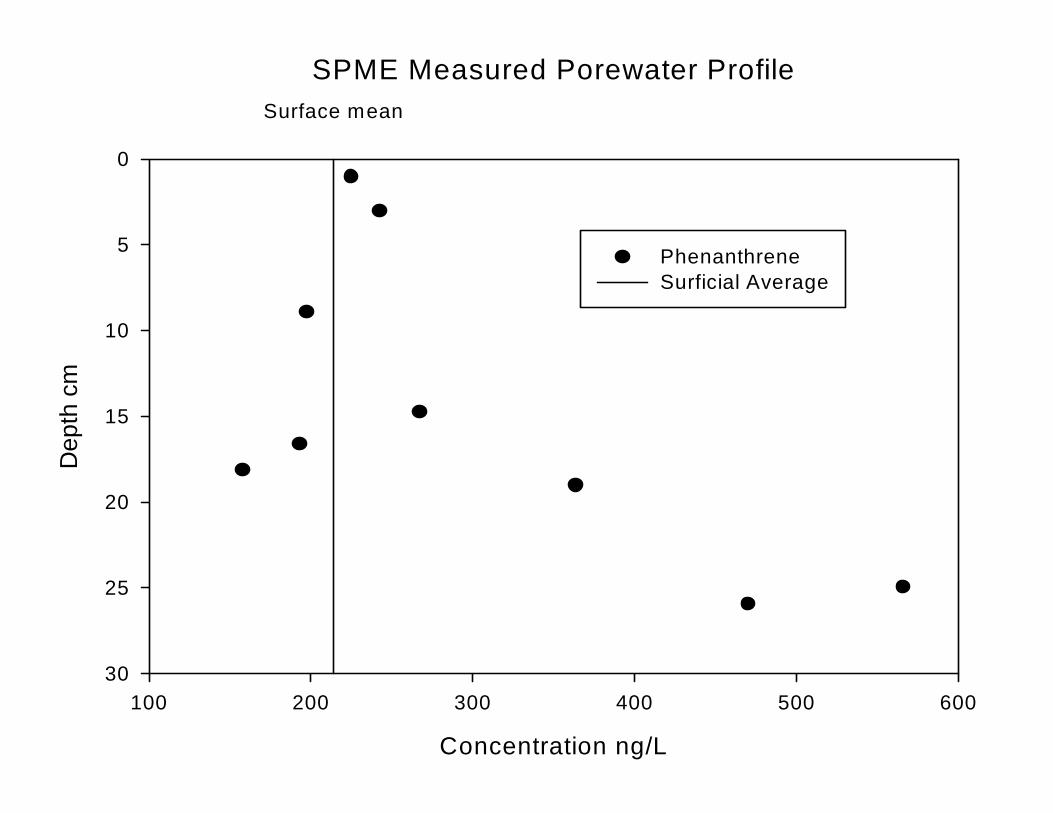
0
SPME Measured Porewater Profile Surface mean
5
10
15
20
25
30
Dep
th c
m
Phenanthrene Surficial Average
100 200 300 400 500 600
Concentration ng/L
30
Lessons being LearnedLessons being LearnedInnovative cap materials possible to place in thin layers (15cm) using conventional equipment with experienced contractor A laminated mat provides opportunities for controlled placement of light and/or high value materials Low permeability AquaBlok cap
Evidence of “heaving” with tidal fluctuations- no apparent impact Effectively diverted seepage further into river Trapped gas leading to irregular release
Conventional sand caps very effective Difficult to differentiate effectiveness of active caps Current pore water sampling initiative expected to better demonstrate effectiveness of active caps
Surficial sediments can be recontaminated w/o source control
31
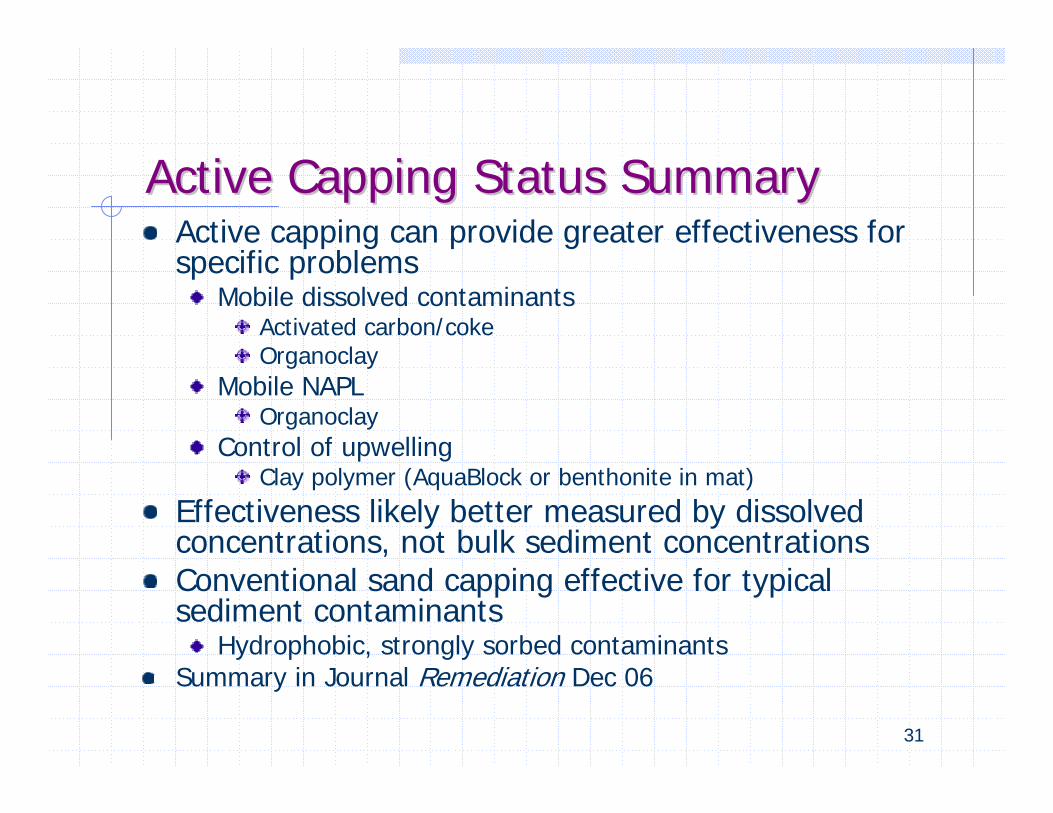
Active Capping StatusActive Capping Status SummarySummaryActive capping can provide greater effectiveness forspecific problems
Mobile dissolved contaminants Activated carbon/coke Organoclay
Mobile NAPL Organoclay
Control of upwelling Clay polymer (AquaBlock or benthonite in mat)
Effectiveness likely better measured by dissolved concentrations, not bulk sediment concentrations Conventional sand capping effective for typicalsediment contaminants
Hydrophobic, strongly sorbed contaminants Summary in Journal Remediation Dec 06