Embed Size (px)
Citation preview

PCMDI
Members selected by relevant and diverse experience, and potential to liaison with key WCRP activities:
Beth Ebert (BMRC) – JWGV/WWRP, WMO forecast metrics
Veronika Eyring (DLR Germany) – WGCM/SPARC, stratosphere
Pierre Friedlingstein (U. Exeter) – IGBP, carbon cycle
Peter Gleckler (PCMDI), chair – WGNE, atmosphere
Robert Pincus (NOAA) – GEWEX/GCSS, clouds/radiation
Karl Taylor (PCMDI) – WGCM, CMIP5
Helene Hewitt (U.K. Met Office) – WGOMD, ocean and sea-ice
An update on the WGNE/WGCM Climate Model Metrics Panel

PCMDI
Monitoring evolution of model performance: Example from Numerical Weather Prediction
Courtesy M.Miller, ECMWF
EU!
The climate modeling community does not yet have routine performance metrics
RM
S er
ror (
hPa)!
Weather Prediction Model Metrics
Year forecast was made!
DAY 5!
DAY 3!

PCMDI
What this effort is and is not about…
• Quantifying model agreement with observations, with a broad perspective, not necessarily identifying the causes of model errors
• Assessing different aspects of model skill, but not combining them into an overall measure of model performance
• Providing a useful complement to in-depth diagnosis, not a last word on model performance
• Focusing on performance metrics (comparison with observations), not projection reliability metrics
PCMDI
Questions motivating routine benchmarks for climate models
• Of direct concern to the WGNE/WGCM metrics panel:
Are models improving?
Are some models more realistic than others?
What do models simulate robustly, and what not?
Related research drivers, but not (currently) the panel’s focus:
How does skill in simulating observed climate relate to projection credibility?
Can we justify weighting model projections based on metrics of skill?
PCMDI
What opportunities are there to construct climate model performance metrics?
• Model’s externally “forced” responses on a range of time-scales:
Diurnal cycle
Annual cycle
Volcanic eruptions, changes in solar irradiance, …
• Model’s “unforced” behavior (weather, MJO, ENSO, NAO, PDO …)
• Evaluate model representation of individual processes and co-variability relationships
• Test model ability to solve the “initial value” problem
• Examine how well models perform with added complexity

PCMDI
Targeting WCRP/CMIP5 benchmarks experiments
• Panel focus on CMIP5 exps where comparing to observations is most relevant
• Primary (initial) focus:
• Historically forced AOGCMs, physical aspects of historical ESMs, and AMIP simulations
• But the panel is considering metrics for:
• Historical ESM emission driven (e.g., metrics for [CO2])
• Initial condition experiment: Transpose AMIP

PCMDI
Evaluating how well climate models simulate the annual cycle: A “Performance Portrait” of relative errors
Mea
n
Med
ian
Latent heat flux at surface Sensible heat flux at surface
Surface temperature Reflected SW radiation (clear sky)
Reflected SW radiation Outgoing LW radiation (clear sky)
Outgoing LW radiation Total cloud cover
Precipitation Total column water vapor
Sea-level pressure Meridional wind stress
Zonal wind stress Meridional wind at surface
Zonal wind at surface Specific humidity at 400 mb Specific humidity at 850 mb Meridional wind at 200 mb
Zonal wind at 200 mb Temperature at 200 mb
Geopotential height at 500 mb Meridional wind at 850 mb
Zonal wind at 850 mb Temperature at 850 mb
“Worst”
“Best”
Clim
ate
varia
ble
Gleckler, P, K. Taylor and C. Doutriaux, J.Geophys.Res. (2008)
Model used in IPCC Fourth Assessment
Median
Relative RMSE in Climatological Annual Cycle (including spatial pattern)
PCMDI
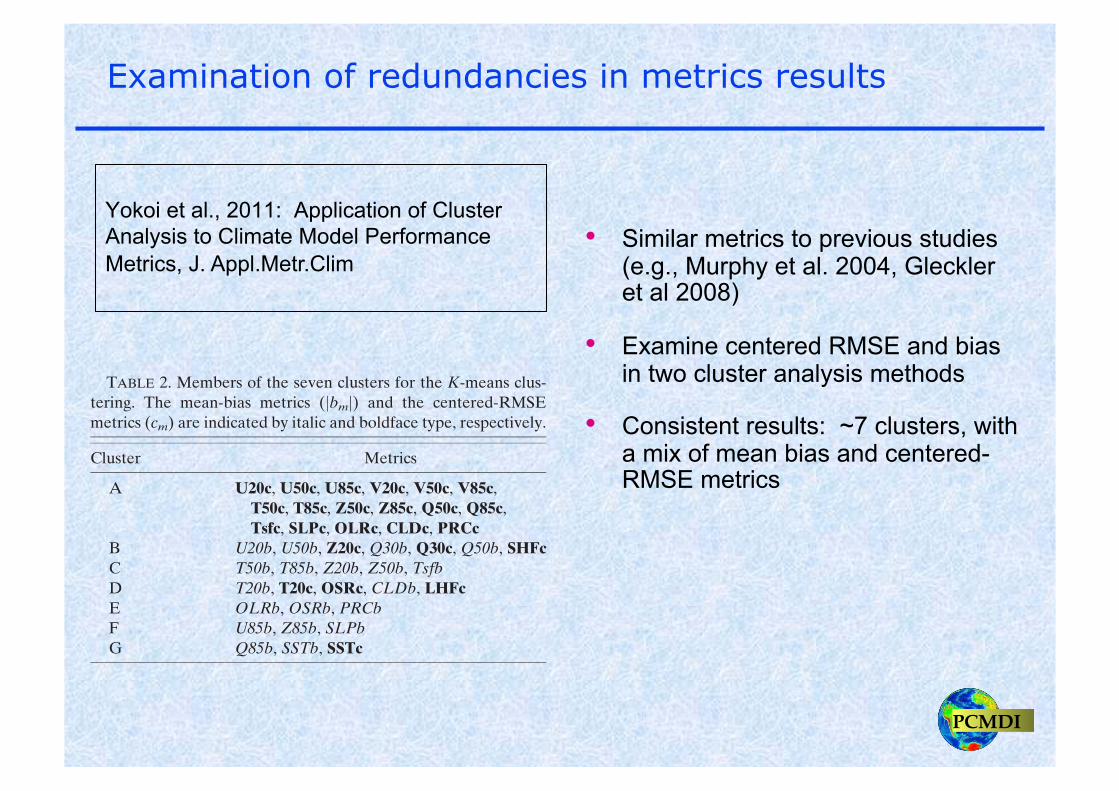
Examination of redundancies in metrics results
• Similar metrics to previous studies (e.g., Murphy et al. 2004, Gleckler et al 2008)
• Examine centered RMSE and bias in two cluster analysis methods
• Consistent results: ~7 clusters, with a mix of mean bias and centered-RMSE metrics
lower-tropospheric thermodynamic variables are includedin cluster A. This feature is probably related to the geo-strophic balance, mass continuity, and hydrostatic bal-ance that link large-scalewind, pressure, and temperaturefields. Centered-RMSE metrics of OLR, cloudiness, andprecipitation are also grouped in cluster A, possibly rep-resenting a link between the horizontal distribution in theconvection and circulation fields. In cluster C, the mean-bias metrics of temperature in the middle and lower tro-posphere and geopotential height in the middle andupper troposphere are grouped, which is associated withthe radiative–convective equilibrium and the hydrostaticbalance. In cluster E, OLRb and OSRb are grouped to-gether with PRCb, which is related to a bias in conden-sation and radiative heating. The consistency between thetwo clustering results and the conceivable physical expla-nation for the results suggest that the resultant clusters arenot merely a statistical artifact.
We also performed the K-means method for 3-month-meanfields for three other seasons (September–November,December–February, andMarch–May) and for the annual-mean field. For each of the four periods, retaining six orseven clusters is statistically appropriate. There are sev-eral features in the clustering results that are consistentwith those for the June–August season. For instance, acombination of U20c, U50c, U85c, V20c, V50c, V85c,T50c, Z50c, Z85c, and SLPc and a combination of T50b,T85b, Tsfb, Z20b, andZ50b are found in all periods. Thesesimilarities support the argument that the clustering re-sults reflect underlying physical and dynamic constraintsindependent of the seasons. On the other hand, there aresome differences in the clustering results among seasons,which suggest that it is necessary to perform the clusteranalysis to obtain themost appropriate results for a targetseason of individual studies.Because we arbitrarily selected the 43 metrics, the
appropriateness of the metric selection and the robust-ness of the clustering result against the metric selectionmay be questioned. To address this, we examined thestability of the clustering result against the removal ofsome of the 43 metrics from the Ward clustering. Weremoved several (from one to five) metrics, applied theWard method to the remaining metrics, and comparedthe results with the reference result obtained by ana-lyzing all 43 metrics. We examined all combinations ofthe removals for the one-, two-, three-, and four-metric-removal tests, and we sampled randomly 100 000 com-binations for the five-metric-removal test. Figure 3shows the ratios of the experiments in which clusteringresults are completely consistent with the reference re-sult and those in which only one, two, and three metricsare classified into different clusters. We consider thetransfer of up to three metrics as moderately consistent.For the one-metric-removal test, most of the experimentsexhibit such moderately consistent results, whereas theratio of experiments with moderately consistent resultsdecreases with an increasing number of removals. For the
FIG. 2. (a) Statistical significance of pseudo-F statistic for theWard (circles) and K-means (stars) methods, and (b) pseudo-t2
statistic for the Ward method as a function of cluster number.
TABLE 2. Members of the seven clusters for the K-means clus-tering. The mean-bias metrics (jbmj) and the centered-RMSEmetrics (cm) are indicated by italic and boldface type, respectively.
Cluster Metrics
A U20c, U50c, U85c, V20c, V50c, V85c,T50c, T85c, Z50c, Z85c, Q50c, Q85c,Tsfc, SLPc, OLRc, CLDc, PRCc
B U20b, U50b, Z20c, Q30b, Q30c, Q50b, SHFcC T50b, T85b, Z20b, Z50b, TsfbD T20b, T20c, OSRc, CLDb, LHFcE OLRb, OSRb, PRCbF U85b, Z85b, SLPbG Q85b, SSTb, SSTc
AUGUST 2011 YOKO I ET AL . 1671
Yokoi et al., 2011: Application of Cluster Analysis to Climate Model Performance Metrics, J. Appl.Metr.Clim

PCMDI
Tracking changes in model performance What will we find between CMIP5 and CMIP3?
Percentage change in total error (AMIP2-AMIP1) -50
-40
-30
-20
-10
0
10
20
30
40
50
Perc
enta
ge
Global, all seasons
MEDIAN!
AMIP!MODELS!
CLIMATE VARIABLES!

PCMDI
1
2
0
1
0
2
0
2.5
1
0.99
0.95
0.9
0.8
0.7
0.6
0.5
0.4
0.3
0.20.10
!"#$%#&%'%()*#"*+$
,+&&(-
#"*+$
. / ! 0
2
3
4
5
67
8
910
11
12
13
14
15
16
17
18
19
20
21
22
2324
25
12'344&5346157
82'4446#5494685:
;2'9<%-546157
=2'9<%-54615:
>2'9*??5#+6
@2'9*??56+%(-5(5A
B2'9*??56+%(-5(5&
C2'*#D5<9+#-?:5759
:72'*D?-546;
::2'6*&+48515A*&(?
:12'6*&+485156(%&(?
:82'6*E35(4A+59
:;2'6D*5(4A#6=
:=2'6&*5494615851#
:>2'$4#&5D46:
:@2'EF6+5A#%468
:B2'EF6+5A#%9(6:
:C2',/GH8'($?I'6(#$
,/GH8
172',#$J!/1
1:2'K#%LJ/1!,,
112'K#%LJ/1!J!
182'/G.M,!J!/
1;2'/.G!,L,/8
1=2'N+&J!/:!/
,/GH=
OI'P#$%(&(&2'7C!M4"!17::
Observations
Some early results from CMIP5 Annual cycle Taylor diagram of dynamical sea-surface height
Quantity not extensively analyzed
High quality obs: merged altimetry AVISO product
Integrates dynamical and steric annual cycle changes
Correlations are relatively low
Too early to tell if CMIP5 results are demonstrably better
Courtesy Felix Landerer, JPL

PCMDI
First look of ENSO in CMIP5 using CLIVAR Pacific Panel Metrics
-‐ Some improvement of NINO3 and 4 interannual SST variability (a and b) -‐ No clear trend for (c) ENSO spectral characteris@cs,
(d) precipita@on response and (e) SST annual cycle
(a) (b) (c) (d) (e)
(K) (K) (K2) (mm/day) (K)
Caveat: only 6 CMIP5 models Courtesy E. Guilyardi, H. Bellenger (LOCEAN/IPSL), A. Wittenberg (GFDL)
Nino3 SSTA Std dev
Nino4 SSTA Spectra RMS Nino4 precip
Std dev Nino3 SST
annual cycle

PCMDI
Gauged by simple metrics, the structure of relative model errors is complex
Santer et al., PNAS, 2009

PCMDI
mpi_echam5
miroc3_2_hires
median-c06a
gfdl_cm2_1
cnrm_cm3
miroc3_2_medres
mri_cgcm2_3_2a
ncar_pcm1
giss_model_e_r
giss_model_e_h
ipsl_cm4
ukmo_hadgem1
iap_fgoals1_0_g
ncar_ccsm3_0
csiro_mk3_0
cccma_cgcm3_1
inmcm3_0
mean-c06a
gfdl_cm2_0
ukmo_hadcm3
cccma_cgcm3_1_t63
bcc_cm1
bccr_bcm2_0
giss_aom
0
5
10
15
20
What difference does the choice of metric make? R
AN
K
Annual Mean Precipitation CMIP3 models, OBS = GPCP
RMSE MAE AVG
• Choice of metrics can impact rank
• Outliers (good/bad) robust to choice (in this example)
Better to be aware of how results are impacted by choice of metric than to rely on a single score

PCMDI
Metrics panel terms of reference (working version)
• Identify a limited set of basic climate model performance metrics
• based on comparison with observations • well established in literature, and preferably in widespread use • easy to calculate, reproduce and interpret • covering a diverse suite of climate characteristics
• large- to global-scale mean climate and some variability • atmosphere, oceans, land surface, and sea-ice
• Coordinate with other WCRP/CLIVAR working groups
• Identify metrics for more focused evaluation (e.g., modes of variability, process level) • Striving towards a community based activity by coalescing expertise
• Justify and promote these basic metrics in an attempt to
• establish routine community benchmarks • facilitate further research of increasingly targeted metrics
• Ensure that these metrics are applied in CMIP5 and widely available

PCMDI
First steps… focus on annual cycle (which is in widespread use)
Standard annual cycle:
15-20 large- to global- scale statistical or “broad-brush” metrics Domains: Global, tropical, NH/SH extra-tropics 20 year climatologies: Annual mean, 4 seasons Routine metrics: bias, centered RMS, MAE, correlation, standard deviation Field examples: OLR, T850, q, SST, SSH, sea-ice extent Observations: multiple for most cases
Extended set of metrics, coordinating with other working groups (in progress):
ENSO (CLIVAR Pacific Panel) Monsoons (CLIVAR AAMP) MJO (YOTC Task force) • Carbon cycle in emission-driven ESMs (ILAMB)

PCMDI
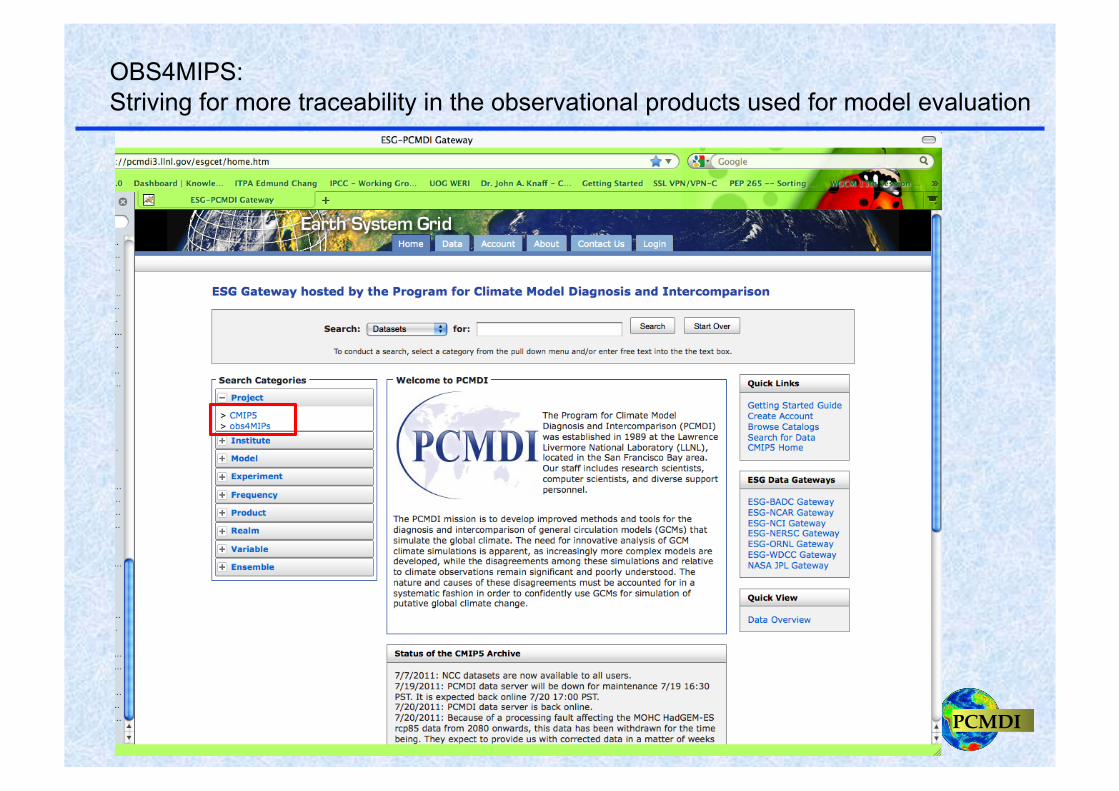
“OBS4MIPS”
• Launched by JPL/PCMDI, with NASA products being the test case
• Guidelines being developed for documenting information about observations of particular importance for model evaluation (e.g., uncertainty estimates)
• Data is ‘technically aligned’ with CMIP5 model output, i.e., in data structure and metadata
• Traceability is important for the metrics panel effort - having a clear record of exactly which observational product version is used
PCMDI
OBS4MIPS: Striving for more traceability in the observational products used for model evaluation

PCMDI
A few other possibilities…
Expertise exists to guide the panel in expanding metrics…
• CFMIP committee
• Transpose AMIP steering committee
• Working Group on Ocean Model Development (WGOMD)
Lacking connections…
• Key variability indices
• Diurnal cycle of precipitation (verified with TRMM)

PCMDI
Some scratch slides….

PCMDI
Enabling community contributions: Wiki repository
• A repository is planned for scientists to contribute metrics and diagnostics codes
• Two categories are envisioned:
• Contributions overseen by the panel, required to follow certain guidelines, (e.g., documentation). An example here is code provided for cloud property metrics following Williams & Webb (2008)
• Open contributions - minimal restrictions

PCMDI
Next steps engaging with research community
• Feedback from WGNE and WGCM (this week)
• Modeling groups to be given opportunity to comment on wiki / selected metrics
• Metrics panel wiki (to be made public in early 2012):
• Discussion of metrics, their limitations, panel goals
• Posting metrics results for all CMIP3 and CMIP5 simulations
• Openness: all observations, codes and documentation made public
• A resource for CMIP5 analysts and possibly modelers • Pointers to and possibly discussion of relevant metrics research • Repository of community contributions

PCMDI
The metrics panel effort going public
• Poster at WCRP OSC (session C34)
• Presentation at the 5th International Verification Methods Workshop (Melbourne, December 5-7)
• Wiki going public
• Possible description of panel effort in EOS (e.g., to advertise repository)
• A publication is planned to highlight CMIP5 / CMIP3 comparisons (in time for July 31 2012 deadline for AR5)

PCMDI
Several possible directions for the metrics panel
Panel’s list is gradually augmented and annually reviewed by WGNE and WGCM, along with the panel’s terms
OR
Panel tasked to finalize its metrics list, publish CMIP5 results, and disband


![Profiling Memory in Lua · 77.20 999 MB 1295 MB 1 main chunk (main.lua) 8.65 112 MB 112 MB 147 insert [C] 7.01 91 MB 91 MB 1,000,001 for iterator [C] 5.89 76 MB 76 MB 1,000,000 gmatch](https://img.pdfslide.us/doc/110x75/6020bbf0c069bf413e212b0e/profiling-memory-in-lua-7720-999-mb-1295-mb-1-main-chunk-mainlua-865-112-mb.jpg)

![1 195.337 mb 195.338 mb 2kb 195.339 mb 195.34 mb o z o U ... · 195.337 mb 195.338 mb 2kb 195.339 mb 195.34 mb o z o U.] U.] Thiel Hey 1 80.836 80.838 mb 80.84 80.842 mb Figure S7](https://img.pdfslide.us/doc/110x75/5e71a866b2da8320f30922bc/1-195337-mb-195338-mb-2kb-195339-mb-19534-mb-o-z-o-u-195337-mb-195338.jpg)