Embed Size (px)
Citation preview

An Underappreciated Zinc Asset
NEX: ZNC.H
Certain statements contained in this press release constitute forward-looking information within the meaning of applicable securities laws. These statements relate to future events or the Company’s future performance, business prospects or opportunities including, without limitation, the results of the Pre-Feasibility Study on the Accha Zinc Oxide District. Any statements that express or involve discussions with respect to predictions, expectations, beliefs, plans, projections, objectives, assumptions or future events or performance (often, but not always, using words or phrases such as “seek”, “anticipate”, “plan”, “continue”, “estimate”, “expect, “forecast”, “may”, “will”, “project”, “predict”, “potential”, “targeting”, “intend”, “could”, “might”, “should”, “believe”, “outlook” and similar expressions) are not statements of historical fact and may be forward looking information. Forward looking information involves risks and uncertainties which may cause actual results to be materially different from those expressed or implied by such forward looking information. The Pre-Feasibility Study results are estimates only, are preliminary in nature and are based on a number of assumptions, any of which, if incorrect, could materially change the projected outcome. Until a positive feasibility study has been completed, and even with the completion of a positive feasibility study, there are no assurances that Accha Zinc Oxide District will be placed into production. Factors that could affect the outcome include, among others: the actual results of development activities, project delays, inability to raise the funds necessary to complete development, general business, economic, competitive, political and social uncertainties, future prices of metals, particularly zinc, actual zinc recovery, inability to confirm specific buyers and terms for the Fume product, conclusions of economic evaluations, changes in project parameters as plans continue to be refined, accidents, labour disputes and other risks of the mining industry, political instability, insurrection or war, delays in obtaining governmental approvals, necessary permitting or in the completion of development or construction activities as well as those factors discussed in the Company’s financial statements which are filed with Canadian securities regulatory authorities and available on SEDAR (www.sedar.com).. The Company believes that the expectations reflected in such forward looking information are reasonable, but no assurance can be given that these expectations will prove to be correct and such forward-looking information should not be unduly relied upon. These statements speak only as of the date of this press release. The Company does not intend, and does not assume any obligation, to update any forward-looking information except as required by law.
2
Cautionary Statement
NEX: ZNC.H

Strong zinc market fundamentals with increasing investor interest in junior zinc companies
Relative capitalization
Opportunity to reset story after protracted company restructuring
3
Catalysts for Share Price Appreciation
NEX: ZNC.H

Zincore Metals Inc. – Overview
4
Accha Zinc Oxide District (“AZOD”) Project in the Yauri-Andahuaylas Metallogenic Belt of Southern Peru
• 100%-owned
• Excellent infrastructure
• Area of extensive mining project development and operation
• Pre-Feasibility Study Technical Report released in August 2013
• Opportunity to bypass refiners and produce SHG zinc ingot
NEX: ZNC.H

5
Source: Mining Journal

6

7
8
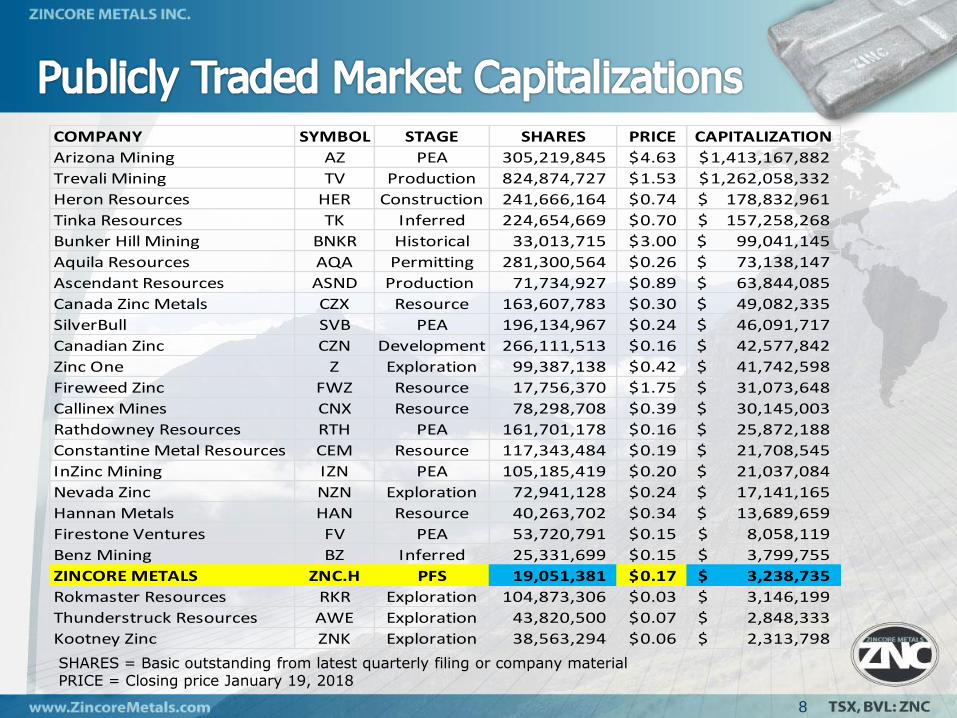
SHARES = Basic outstanding from latest quarterly filing or company material PRICE = Closing price January 19, 2018
COMPANY SYMBOL STAGE SHARES PRICE CAPITALIZATION
Arizona Mining AZ PEA 305,219,845 4.63$ 1,413,167,882$
Trevali Mining TV Production 824,874,727 1.53$ 1,262,058,332$
Heron Resources HER Construction 241,666,164 0.74$ 178,832,961$
Tinka Resources TK Inferred 224,654,669 0.70$ 157,258,268$
Bunker Hill Mining BNKR Historical 33,013,715 3.00$ 99,041,145$
Aquila Resources AQA Permitting 281,300,564 0.26$ 73,138,147$
Ascendant Resources ASND Production 71,734,927 0.89$ 63,844,085$
Canada Zinc Metals CZX Resource 163,607,783 0.30$ 49,082,335$
SilverBull SVB PEA 196,134,967 0.24$ 46,091,717$
Canadian Zinc CZN Development 266,111,513 0.16$ 42,577,842$
Zinc One Z Exploration 99,387,138 0.42$ 41,742,598$
Fireweed Zinc FWZ Resource 17,756,370 1.75$ 31,073,648$
Callinex Mines CNX Resource 78,298,708 0.39$ 30,145,003$
Rathdowney Resources RTH PEA 161,701,178 0.16$ 25,872,188$
Constantine Metal Resources CEM Resource 117,343,484 0.19$ 21,708,545$
InZinc Mining IZN PEA 105,185,419 0.20$ 21,037,084$
Nevada Zinc NZN Exploration 72,941,128 0.24$ 17,141,165$
Hannan Metals HAN Resource 40,263,702 0.34$ 13,689,659$
Firestone Ventures FV PEA 53,720,791 0.15$ 8,058,119$
Benz Mining BZ Inferred 25,331,699 0.15$ 3,799,755$
ZINCORE METALS ZNC.H PFS 19,051,381 0.17$ 3,238,735$
Rokmaster Resources RKR Exploration 104,873,306 0.03$ 3,146,199$
Thunderstruck Resources AWE Exploration 43,820,500 0.07$ 2,848,333$
Kootney Zinc ZNK Exploration 38,563,294 0.06$ 2,313,798$

The Road to Recovery
9
• February 2015 – Delisted from TSX and moved to NEX
• July 2016 - 1:5 consolidation
• February 2017 – Terminate relationship with FQM, including US$2m convertible loan
• August 2015 – May 2017 Shares for debt settlements for over C$1m
• Dec 2017 US$559k in long term credit agreements to reduce working capital deficit
• Immediate Goal: Move from NEX to TSX-V
NEX: ZNC.H

District strategy with a single facility to process zinc and lead oxide ores from multiple deposits
PFS based on Reserves and Resources identified at Accha and Yanque deposits
Located near extensive infrastructure serving prolific mining operations (Las Bambas, Haquira, Constancia and Tintaya)
PFS Technical Report published August 2013
TWO production scenarios under PFS
Base Case - Fully integrated production of (SHG) Zinc ingot and Lead sulphate bi-product
Fume Case - Sale of the Zinc/Lead oxide concentrate (Fume)
10
AZOD Project Overview
NEX: ZNC.H
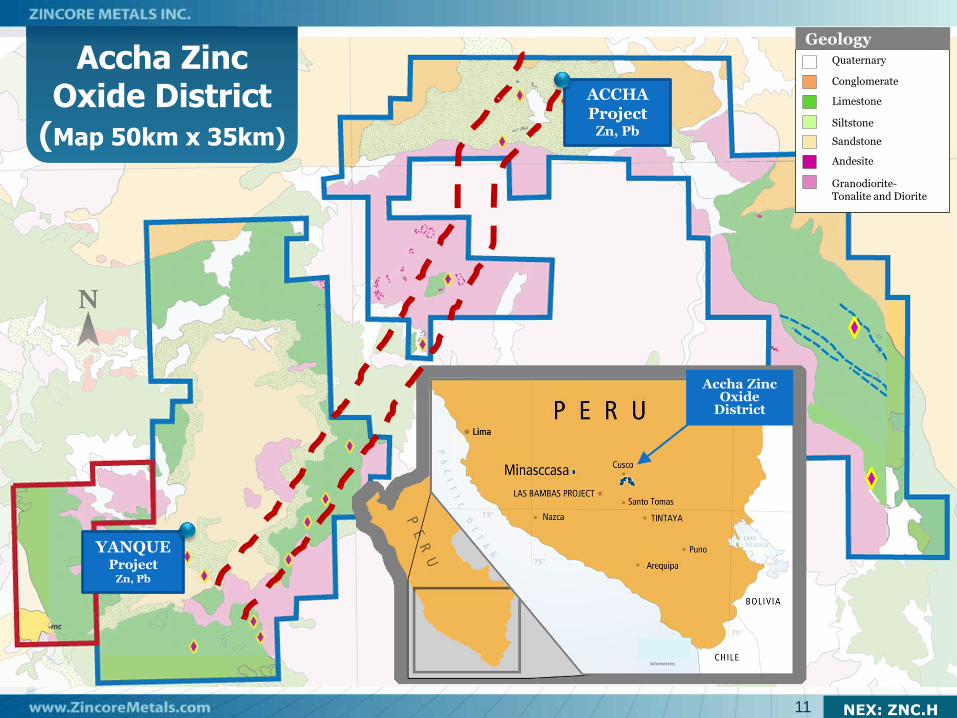
Quaternary
Conglomerate
Sandstone
Limestone
Siltstone
Granodiorite- Tonalite and Diorite
Andesite
Geology
YANQUE
Project Zn, Pb
ACCHA Project
Zn, Pb
Accha Zinc Oxide
District
Accha Zinc Oxide District
(Map 50km x 35km)
11 NEX: ZNC.H

AZOD - Extensive Area Infrastructure
12 NEX: ZNC.H

Mineral Reserves (Base Case)
Classification Tonnes (000s)
Average Zn Grade (%)
Average Pb Grade (%)
Contained Zn (mmlbs)
Contained Pb (mmlbs)
Accha Underground (P&P) 1,011 10.36 1.39 231 31
Accha Open Pit (P&P) 1,223 8.03 0.68 217 18
Yanque Open Pit (Probable) 8,338 3.97 2.60 731 477
Total Proven & Probable 10,571 5.05 2.26 1,178 526
AMEC: August, 2013
Mineral Resources (Base Case, inclusive of mineral reserves)
www.ZincoreMetals.com
• *Please see slides 26-30 for a full description of Reserves and Resources
Accha Underground (M&I) 937 5.57 0.96 115 20
Accha Open Pit (M&I) 6,613 6.37 0.78 929 114
Yanque Open Pit (Indicated) 26,491 2.37 2.18 1,386 1,270
Total Measured & Indicated 34,041 3.24 1.87 2,430 1,404
Accha Underground (Inferred) 553 5.07 0.81 62 10
Accha Open Pit (Inferred) 197 4.60 0.51 20 2
Yanque Open Pit (Inferred) 1,169 2.17 1.09 56 28
Total Inferred 1,919 3.26 0.95 138 40
NEX: ZNC.H 13

LOM Total (US$’000)
Cost per tonne milled (US$/t)
Cost per pound Zn payable (US$/lb)
Payable Metal
Cash costs
Mining 177,215 16.76 0.17
Process 533,881 50.50 0.52
G&A 51,883 4.91 0.05
Smelter deductions 31,418 2.97 0.03
Treatment charges 129,836 12.28 0.13
Concentrate transport 26,533 2.51 0.03
Sub-total 950,766 89.94 0.92
Credits
Zinc premium (82,856) (7.84) (0.08)
Lead (534,109) (50.52) (0.52)
Sub-total (616,966) (58.36) (0.60)
Adjusted cash costs Total 333,800 31.58 0.32
14
LOM Total (US$’000)
Cost per tonne milled (US$/t)
Cost per pound Zn payable (US$/lb)
Payable Metal
Cash costs
Mining 167,619 14.53 0.16
Process 415,422 36.02 0.39
G&A 42,624 3.70 0.04
Smelter deductions 362,234 31.41 0.34
Treatment charges 364,265 31.58 0.34
Concentrate transport 63,896 5.54 0.06
Sub-total 1,416,061 122.78 1.31
Credits
Zinc premium (not applicable)
Lead (666,359) (57.78) (0.62)
Sub-total (666,359) (57.78) (0.62)
Adjusted cash costs Total 749,702 65.00 0.70
Base Case Fume Case
• See slide 22 for PFS Assumptions
NEX: ZNC.H

Base Case Fume Case
After-Tax
(US$’000)
Pre-Tax
(US$’000)
After-Tax
(US$’000)
Pre-Tax
(US$’000)
Cumulative net cash flow
(undiscounted) 377,268 528,683 243,384 336,980
Net present value (2015)
Discounted at 5% 217,024 332,216 135,342 205,805
Discounted at 8% 150,123 248,917 91,073 151,221
Discounted at 10% 114,287 203,823 67,617 121,986
Discounted at 12% 84,081 165,472 48,011 97,321
Internal rate of return 20.5% 28.6% 19.2% 26.7%
Payback period (years) 3.8 3.0 3.9 3.2
Total start-up capital 345.5M 214.5M
Total life of mine capital 357.7M 225.9M
Projected life of mine (years) 8.0 9.0
15
• See slide 22 for PFS Assumptions
NEX: ZNC.H
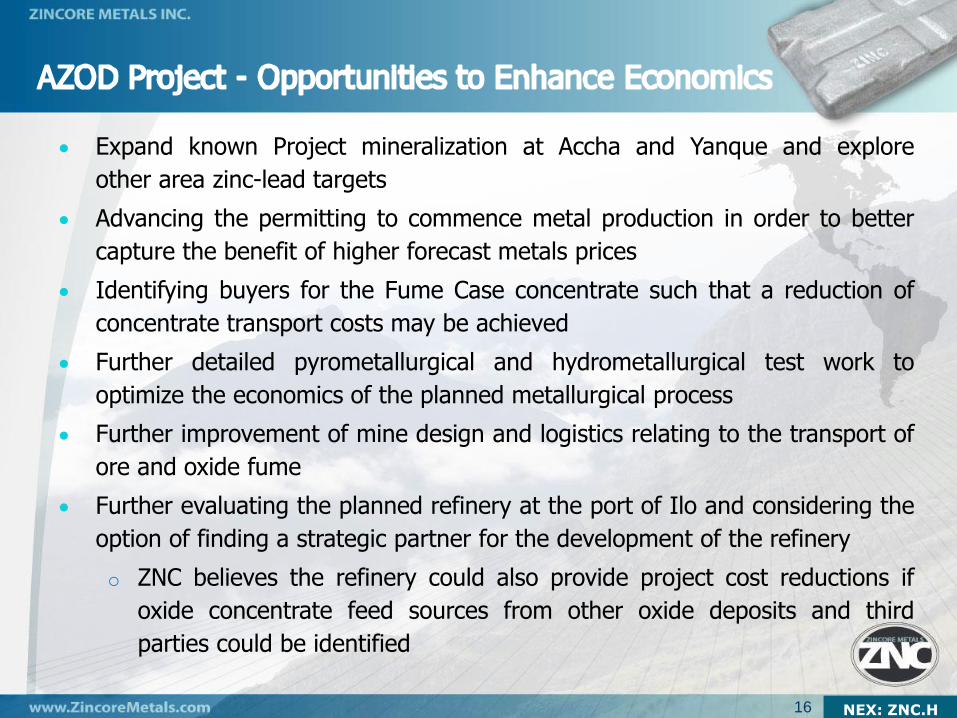
Expand known Project mineralization at Accha and Yanque and explore
other area zinc-lead targets
Advancing the permitting to commence metal production in order to better
capture the benefit of higher forecast metals prices
Identifying buyers for the Fume Case concentrate such that a reduction of
concentrate transport costs may be achieved
Further detailed pyrometallurgical and hydrometallurgical test work to
optimize the economics of the planned metallurgical process
Further improvement of mine design and logistics relating to the transport of
ore and oxide fume
Further evaluating the planned refinery at the port of Ilo and considering the
option of finding a strategic partner for the development of the refinery
o ZNC believes the refinery could also provide project cost reductions if
oxide concentrate feed sources from other oxide deposits and third
parties could be identified
16 NEX: ZNC.H

Jorge Benavides, M.Sc., B.Sc., President, CEO & Director, has more than 35 years experience in the mining industry, including 7 years leading exploration and acquisition programs for Hochschild Mining plc and 8 years with Phelps Dodge as Exploration Manager for the Andean region
David Black LLB, Director, practiced law with DuMoulin Black LLP in Vancouver, where he was a partner from 1968 to 2003 specializing in corporate and securities law
Roman Friedrich, Director, has been an investment and commercial banker to the mining and metals industries for over 35 years, with roles at Burns Fry, First Chicago, Wood Gundy and TD Securities
Adam Ho, CFO & VP, Corporate Development, has 25 years’ experience in the public markets since beginning in the financial services industry in 1993 as a Financial Advisor at Midland Walwyn Capital. He joined Zincore in 2010
17
Experienced Team
NEX: ZNC.H

Last Trade C$0.17
Basic Shares Outstanding 19,051,381
Basic Market Capitalization C$3.2M
Options 1,648,000
Warrants 437,841 Fully Diluted Shares 21,137,222
18 NEX: ZNC.H

Strong zinc market fundamentals with increasing investor interest in junior zinc companies
Relative capitalization
Opportunity to reset story after protracted company restructuring
19
Catalysts for Share Price Appreciation
NEX: ZNC.H
Zincore Metals Inc.
Suite 202 – 5626 Larch Street
Vancouver, BC V6M 4E1 CANADA
www.zincoremetals.com
Adam Ho, CFO
Telephone 1 (604) 669-6611
e-mail: [email protected]
Investor Relations and Media Contact
20 NEX: ZNC.H
Appendices
21 NEX: ZNC.H

Zinc price of US$1.26/lb and lead price of US$1.04/lb Base Case over life of mine average(weighted)
Zinc price of US$1.27/lb and lead price of US$1.04/lb Fume Case over life of mine average(weighted)
Metal prices are based on an average of prices from the World Bank and Wood Mackenzie. Prices peak from 2017 to 2022. Production is planned for 2017 but delays in production may increase the risk of not realizing the benefits of forecast high metal prices.
NPV is as of 2015. 20% contingency applied to the capital expenditure direct estimates. Corporate income tax rate of 30%
PbSO4 assumes Pb concentrate terms with 95% payability for lead, and a 3% deduction. Long term treatment charges ($284/tonne) are based on average of Wood Mackenzie treatment charge forecasts for Pb concentrate
For Fume Case bulk payability concentrate terms with 80% of zinc with 7% deduction and for lead payability of 95% with 3% deduction have been assumed
No contaminants penalties were allowed for the bulk concentrate and PbSO4
Fume long-term treatment charges ($334/t) are based on average of Wood Mackenzie treatment charge forecasts for bulk concentrate
Cash cost/pound of zinc payable is net of lead credits and includes an US$0.08/lb premium for super high grade cathode in the Base Case
Anthracite is assumed to be sourced from the north of Peru. A cost of $117/t was utilized for the anthracite and a Currency Exchange Rate $1USD = 3.00 Peruvian Nuevo Sol was utilized for anthracite. Anthracite represents 41% and 56% of total processing costs of the Base Case and Fume Case respectively
A 3% contingency has been applied to all processing costs with the exception of anthracite which is presented as sensitivity and represents a risk to the project
It should be noted that the assumed level of payabilities for lead sulphate concentrate and zinc- lead oxide concentrate (Fume) used in the PFS were derived from a market study conducted by Wood Mackenzie and commissioned by Zincore, however, no buyers have been directly approached by the Company to confirm the assumed levels of payability
22 NEX: ZNC.H

Capital Cost Estimate SummaryDescription Base Case (US $M) Fume Case (US $M)
Mining Direct Costs
Pre-Strip and pioneering 10.9 10.9
Process Plant Direct Costs
Mine infrastructure 6.9 6.9
Site development 4.5 4.1
Pyrometallurgical process plant 69.5 80.5
Hydrometallurgical refinery 79.9 0.0
Site utilities 15.4 9.2
Ancillary building 13.9 7.5
Waste storage facilities 7.5 7.5
Off project boundary services 20.1 15.4
Sub-Total Direct Mining Costs 228.6 142.0
Indirect costs
Indirect capital 62.0 39.3
Owner’s cost 11.4 7.1
Contingency – plant (20% of plant direct costs) 43.5 26.2
Sub-Total Indirect Costs 116.9 72.5
Total Project Costs 345.5 214.5
23
(1) Mining equipment is considered to be part of the contractor supply and is included as part of the operational cost summaries on slide 25. Infrastructure for the mine is included in the capital
costs (2) Project indirect costs for mining pre-strip and pioneering roads are included in the capital cost and are not broken out in the table as a line item. (3) Dehalogenation of the fume will be carried out using hydrometallurgical facilities in the Base Case and pyrometallurgical facilities in the Fume Case. (4) Contingency is based on an assumed 20% of direct costs. (5) Owner’s costs are based on an assumed 10% of direct costs. (6) Currency Exchange Rates used were $1USD = 2.78 Peruvian Nuevo Sol (7) Estimate is based on 2nd Qtr. 2013 (8) Costs have been rounded
NEX: ZNC.H
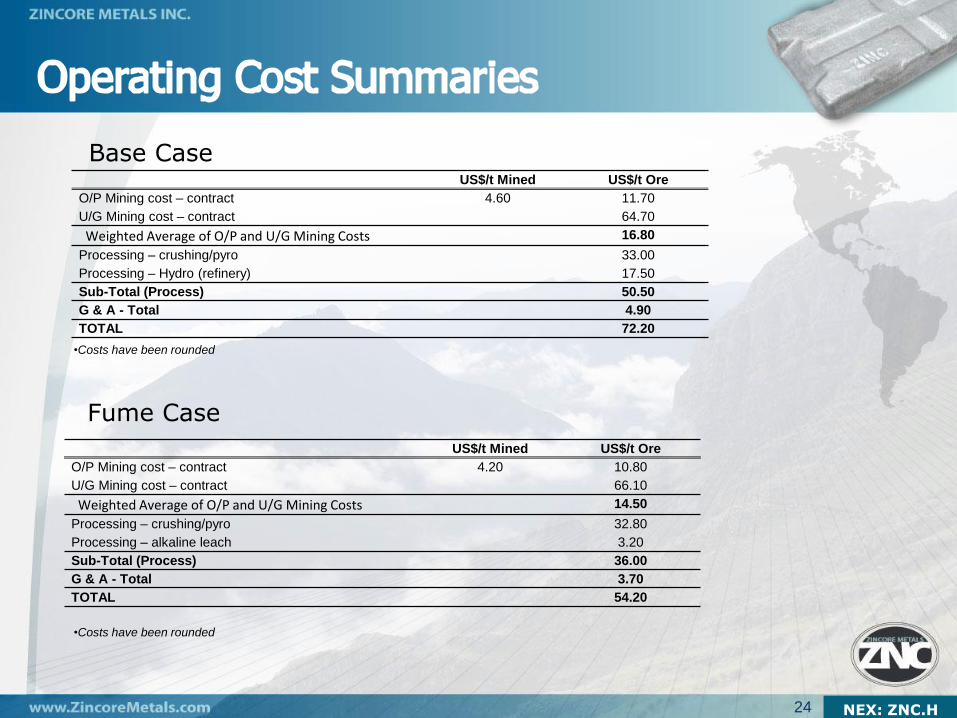
US$/t Mined US$/t Ore
O/P Mining cost – contract 4.60 11.70
U/G Mining cost – contract 64.70
Weighted Average of O/P and U/G Mining Costs 16.80
Processing – crushing/pyro 33.00
Processing – Hydro (refinery) 17.50
Sub-Total (Process) 50.50
G & A - Total 4.90
TOTAL 72.20
24
•Costs have been rounded
US$/t Mined US$/t Ore
O/P Mining cost – contract 4.20 10.80
U/G Mining cost – contract 66.10
Weighted Average of O/P and U/G Mining Costs 14.50
Processing – crushing/pyro 32.80
Processing – alkaline leach 3.20
Sub-Total (Process) 36.00
G & A - Total 3.70
TOTAL 54.20
•Costs have been rounded
Base Case
Fume Case
NEX: ZNC.H

SENSITIVITY OF NPV @ 8% Change in Factor (US$ ‘000)
(2015) -30% -20% -10% 0% 10% 20% 30%
Capital expenditure 213,943 192,783 171,509 150,123 128,678 107,132 85,573
Operating expenditure 233,379 205,975 178,280 150,123 121,603 92,814 62,670
Metal price (63,269) 12,252 83,044 150,123 216,251 281,677 346,670
Anthracite price 174,419 166,341 158,234 150,123 141,987 133,806 125,597
Grade (23,059) 36,395 94,119 150,123 205,635 260,686 315,526
25
Base Case
SENSITIVITY OF NPV @ 8% Change in Factor (US$ ‘000)
(2015) -30% -20% -10% 0% 10% 20% 30%
Capital expenditure 131,928 118,337 104,725 91,073 77,380 63,656 49,897
Operating expenditure 159,214 136,783 114,070 91,073 67,806 44,226 20,369
Metal price (125,567) (40,995) 29,491 91,073 151,599 211,439 270,774
Anthracite price 116,821 108,269 99,685 91,073 82,406 73,713 64,990
Grade (73,829) (12,658) 41,161 91,073 140,576 190,163 239,921
Fume Case
NEX: ZNC.H

Category
Tonnes
(kt)
Zn Grade
(%)
Pb Grade
(%)
Zn
(Mlb)
Pb
(Mlb)
Accha Open Pit
Proven 754 8.43 0.73 140.2 12.2
Probable 468 7.39 0.59 76.3 6.1
Proven & Probable 1,223 8.03 0.68 216.5 18.3
Accha Underground
Proven 307 11.79 1.70 79.8 11.5
Probable 704 9.74 1.25 151.3 19.4
Proven & Probable 1,011 10.36 1.39 231.1 30.9
Yanque Open Pit
Proven 0 0.00 0.00 0.0 0.0
Probable 8,338 3.97 2.60 730.5 477.1
Proven & Probable 8,338 3.97 2.60 730.5 477.1
TOTAL – Accha & Yanque
Proven 1,061 9.40 1.01 219.9 23.7
Probable 9,510 4.57 2.40 958.0 502.5
TOTAL Accha & Yanque
Proven & Probable 10,571 5.05 2.26 1,177.9 526.2
26
(1) Mineral Reserve estimates have an effective date of 11 July 2013. The Mineral Reserves estimates assuming open pit mining methods were prepared by Sergio Muñoz, Senior Mining Eng., RM
Comisión Minera (Chile) of AMEC, and by William Bagnell P.Eng. of AMEC for the estimates assuming underground mining methods. (2) Mineral Reserves are estimated using the following assumptions: a US$1.03/lb zinc price, a US$0.95/lb lead price, and an economic function that includes an average processing, G&A, and ore
haulage costs of US$60.59/t in Accha and US$37.50/t in Yanque and, marketing, treatment and refining costs of US$0.201/lb for zinc and US$0.289/lb for lead, a zinc premium of 5%, a lead
payability of 94.1%, and metallurgical recoveries for zinc of 89.6% in Accha and 86.9% in Yanque, and lead recoveries of 97% in Accha and 97.7% in Yanque. Open pit mine designs assumed
average inter-ramp pit slope angles of 37° and 46° for Accha and Yanque respectively. (3) The open pit referential cut-off grades for Accha are 3.5% Zn and for Yanque are 2.2% Zn. The referential cut-off grade for underground is 6.0% Zn (4) The projected life-of-mine strip ratio for the Accha pit is 3.32 and for the Yanque pit is 1.36 (5) The metal prices used for the Mineral Reserves estimates are based on AMEC`s internal guidelines (which are based on long-term consensus prices)
(6) Rounding as required by reporting guidelines may result in apparent summation differences between tonnes, grade and contained metal content. NEX: ZNC.H

Category
Tonnes
(kt)
Zn Grade
(%)
Pb Grade
(%)
Zn
(Mlb)
Pb
(Mlb)
Accha Open Pit
Proven 651 9.26 0.80 132.9 11.4
Probable 388 8.26 0.66 70.7 5.6
Proven & Probable 1,039 8.88 0.74 203.5 17.1
Accha Underground
Proven 237 13.78 1.97 71.9 10.3
Probable 547 11.17 1.43 134.6 17.2
Proven & Probable 783 11.96 1.59 206.5 27.5
Yanque Open Pit
Proven 0 0.00 0.00 0.0 0.0
Probable 9,711 3.57 2.86 763.3 611.5
Proven & Probable 9,711 3.57 2.86 763.3 611.5
TOTAL – Accha & Yanque
Proven 888 10.46 1.11 204.8 21.7
Probable 10,646 4.13 2.70 968.5 634.4
TOTAL Accha & Yanque
Proven & Probable 11,533 4.61 2.58 1,173.3 656.1
27
(1) Mineral Reserve estimates have an effective date of 11 July 2013. The Mineral Reserves estimates assuming open pit mining methods were prepared by Sergio Muñoz, Senior Mining Eng.,
RM Comisión Minera (Chile) of AMEC by William Bagnell P.Eng. of AMEC (for the estimates assuming underground mining methods (2) Mineral Reserves are estimated using the following assumptions: a US$1.03/lb zinc price, a US$0.95/lb lead price, and an economic function that include an average processing, G&A ore
haulage of US$60.12/t in Accha and US$36.80/t in Yanque, marketing, treatment and refining cost of US$0.290/lb for zinc and US$0.190/lb for lead, zinc payability of 79.4%, lead payability of
89%, and metallurgical recoveries for zinc of 91% in Yanque and 93.8% in Accha, and lead recoveries of 97.7% in Yanque and 97% in Accha. A percent model was used with a blocks size of
5x5x5 m. Open pit mine designs assumed average inter-ramp pit slope angles of 37° and 46° for Accha and Yanque respectively (3) The life-of-mine strip ratio for the Accha pit is 4.08 and for the Yanque pit is 1.36 (4) The Fume Case open pit referential cut-off grades for Accha are 5.5% Zn, and for Yanque are 2.9% Zn. The cut-off grade for Accha underground is 8.6% Zn (5) The metal prices used for the Mineral Reserves estimates are based on AMEC`s internal guidelines (based on long-term consensus prices) (6) Rounding as required by reporting guidelines may result in apparent summation differences between tonnes, grade and contained metal content
NEX: ZNC.H

Category
ZnEq
Cut-Off
(%)
Tonnage
(kt)
ZnEq
(%)
Zn
(%)
Pb
(%)
Contained
ZnEq
(Mlb)
Contained
Zn
(Mlb)
Contained
Pb
(Mlb)
Measured 2.20 2,119 8.75 8.11 0.93 408.8 378.9 43.4
3.00 1,983 9.17 8.49 0.97 400.7 371.4 42.6
4.00 1,751 9.91 9.18 1.06 382.6 354.4 40.9
5.00 1,527 10.71 9.91 1.16 360.4 333.5 38.9
Indicated 2.20 4,494 6.03 5.55 0.71 597.4 549.9 70.3
3.00 3,700 6.77 6.23 0.79 552.5 507.9 64.6
4.00 2,916 7.66 7.04 0.89 492.2 452.8 57.1
5.00 2,286 8.53 7.85 0.98 429.9 395.8 49.4
M & I 2.20 6,613 6.90 6.37 0.78 1,006.0 928.7 113.7
3.00 5,683 7.61 7.02 0.86 953.2 879.3 107.2
4.00 4,667 8.50 7.85 0.95 874.8 807.2 98.0
5.00 3,813 9.40 8.68 1.05 790.3 729.4 88.3
Inferred 2.20 197 4.95 4.60 0.51 21.5 20.0 2.2
3.00 151 5.66 5.25 0.60 18.8 17.5 2.0
4.00 124 6.13 5.69 0.64 16.8 15.6 1.7
5.00 89 6.77 6.29 0.69 13.3 12.3 1.4
28
• Mineral Resources have an effective date of 5 July 2013. The Mineral Resource estimates and geological models were prepared by Christopher Wright, P.Geo. of AMEC and reviewed by Stella Searston, RM SME of AMEC who is the Qualified Person as defined under NI 43-101 for the estimate.
• Mineral Resources are reported inclusive of Mineral Reserves. Mineral Resources that are not Mineral Reserves do not have demonstrated economic viability. • The estimate uses Ordinary Kriging as the interpolation method in a percent block model with a block size of 5x5x5 m. Density utilized in the mineral resource estimates
was 2.51 t/m3 for mineralization and 2.57 t/m3 for waste. • Mineral Resources are estimated using a conceptual Lerchs-Grossmann pit shell and conceptual stope outlines that assumed a US$1.28 lb zinc price, a US$1.05/lb lead
price, marketing treatment, and refining costs of US$0.201/lb for zinc and US$0.289/lb for lead, metallurgical recovery of 86.9% for zinc and 97.7% for lead, a mining cost of US$2.09/t for open pit and of US$34.92/t for underground mining, and processing, general and administrative costs of US$48.15/t
• Overall slope angle for the Accha open pit is 33o • Mineral Resources are reported above a marginal cut-off grade of 2.20% ZnEq. for the open pit estimate. Underground Mineral Resources are reported above a cut-off
grade of 2.20% ZnEq, below the resource pit shell and within conceptual stope outlines defined at a break-even cut-off grade of 3.79% ZnEq. Zinc equivalent (ZnEq) was calculated by applying the differential of metallurgical recoveries and metal prices net of selling costs to zinc and lead grades.
• Contained zinc and contained lead represent estimated metal contained in the ground and have not been adjusted for metallurgical or other recovery factors • The metal prices used for the Mineral Resources estimates are based on a combination of AMEC`s internal guidelines (based on long-term consensus prices) and those
sourced from Wood Mackenzie and the World Bank. It is industry practice to apply higher long-term metal prices used for Mineral Resources than that used for Mineral Reserves
• Rounding as required by reporting guidelines may result in apparent summation differences between tonnes, grade and contained metal content.
NEX: ZNC.H

Category
ZnEq
Cut-Off
(%)
Tonnage
(kt)
ZnEq
(%)
Zn
(%)
Pb
(%)
Contained
ZnEq
(Mlb)
Contained
Zn
(Mlb)
Contained
Pb
(Mlb)
Measured 3.79 17 5.73 4.58 1.66 2.1 1.7 0.6
4.00 17 5.74 4.60 1.66 2.2 1.7 0.6
5.00 12 6.24 5.06 1.72 1.7 1.3 0.5
Indicated 3.79 920 6.24 5.58 0.95 126.5 113.3 19.2
4.00 840 6.46 5.79 0.98 119.6 107.1 18.1
5.00 554 7.49 6.72 1.12 91.4 82.0 13.6
M & I 3.79 937 6.23 5.57 0.96 128.6 115.0 19.8
4.00 857 6.45 5.76 0.99 121.8 108.9 18.7
5.00 566 7.46 6.68 1.13 93.1 83.4 14.1
Inferred 3.79 553 5.63 5.07 0.81 68.6 61.8 9.9
4.00 514 5.76 5.19 0.82 65.3 58.8 9.3
5.00 277 6.95 6.34 0.90 42.5 38.7 5.5
29
(1) Mineral Resources have an effective date of 5 July 2013. The Mineral Resource estimates and geological models were prepared by Christopher Wright, P.Geo. of AMEC and reviewed by
Stella Searston, RM SME of AMEC who is the Qualified Person as defined under NI 43-101 for the estimate. (2) Mineral Resources are reported inclusive of Mineral Reserves. Mineral Resources that are not Mineral Reserves do not have demonstrated economic viability.
(3) The estimate uses Ordinary Kriging as the interpolation method in a percent block model with a block size of 5x5x5 m. Density utilized in the mineral resource estimates was 2.51 t/m3 for
mineralization and 2.57 t/m3 for waste.
(4) Mineral Resources are estimated using a conceptual Lerchs-Grossmann pit shell and conceptual stope outlines that assumed a US$1.28 lb zinc price, a US$1.05/lb lead price, marketing
treatment, and refining costs of US$0.201/lb for zinc and US$0.289/lb for lead, metallurgical recovery of 86.9% for zinc and 97.7% for lead, a mining cost of US$2.09/t for open pit and of
US$34.92/t for underground mining, and processing, general and administrative costs of US$48.15/t
(5) Overall slope angle for the Accha open pit is 33o
(6) Mineral Resources are reported above a marginal cut-off grade of 2.20% ZnEq. for the open pit estimate. Underground Mineral Resources are reported above a cut-off grade of 2.20% ZnEq,
below the resource pit shell and within conceptual stope outlines defined at a break-even cut-off grade of 3.79% ZnEq. Zinc equivalent (ZnEq) was calculated by applying the differential of
metallurgical recoveries and metal prices net of selling costs to zinc and lead grades.
(7) Contained zinc and contained lead represent estimated metal contained in the ground and have not been adjusted for metallurgical or other recovery factors
(8) The metal prices used for the Mineral Resources estimates are based on a combination of AMEC`s internal guidelines (based on long-term consensus prices) and those sourced from Wood
Mackenzie and the World Bank. It is industry practice to apply higher long-term metal prices used for Mineral Resources than that used for Mineral Reserves Rounding as required by reporting guidelines may result in apparent summation differences between tonnes, grade and contained metal content.
NEX: ZNC.H

Category
ZnEq
Cut-Off
(%)
Tonnage
(kt)
ZnEq
(%)
Zn
(%)
Pb
(%)
Contained
ZnEq
(Mlb)
Contained
Zn
(Mlb)
Contained
Pb
(Mlb)
Indicated 1.67 26,491 3.87 2.37 2.18 2,261.5 1,385.3 1,270.0
2.00 23,242 4.16 2.55 2.33 2,129.9 1,306.7 1,193.1
4.00 8,701 6.34 4.05 3.32 1,216.0 777.4 635.7
Inferred 1.67 1,169 2.91 2.17 1.09 75.1 55.8 28.0
2.00 1,081 3.00 2.24 1.11 71.5 53.3 26.3
4.00 20 5.21 3.32 2.75 2.3 1.5 1.2
30
(1) Mineral Resources have an effective date of 5 July 2013. The Mineral Resource estimates and geological models were prepared by Christopher Wright, P.Geo. of AMEC and reviewed
by Stella Searston, RM SME of AMEC who is the Qualified Person as defined under NI 43-101 for the estimate.
(2) Mineral Resources are reported inclusive of Mineral Reserves. Mineral Resources that are not Mineral Reserves do not have demonstrated economic viability.
(3) The estimate used Ordinary Kriging as the interpolation method in a percent block model with a block size of 5x5x5 m. The density utilized in the mineral resource estimates was 2.37
t/m3 for mineralized material and 2.49 t/m3 for waste.
(4) Mineral Resources are confined within a conceptual Lerchs–Grossmann pit shell and are estimated using a US$1.28/lb zinc price, a US$1.05/lb lead price, overall pit slope angles of 40º,
metallurgical recovery of 86.9% for zinc and 97.7% for lead, a mining cost of US$1.89/t, zinc premium of 5%, lead payability of 94.1%, marketing, treatment and refining costs of
US$0.201/lb for zinc and US$0.289/lb for lead, and processing, general and administrative costs of US$36.66/t. Zinc equivalent (ZnEq) was calculated by applying the differential of
metallurgical recoveries and metal prices net of selling costs to zinc and lead grades.
(5) Contained zinc and contained lead represent estimated metal contained in the ground and have not been adjusted for metallurgical or other recovery factors.
(6) The metal prices used for the Mineral Resources estimates are based on a combination of AMEC`s internal guidelines (based on long-term consensus prices) and those sourced from
Wood Mackenzie and the World Bank. It is industry practice to apply higher long-term metal prices used for Mineral Resources than that used for Mineral Reserves.
Rounding as required by reporting guidelines may result in apparent summation differences between tonnes, grade and contained metal content.
NEX: ZNC.H
31
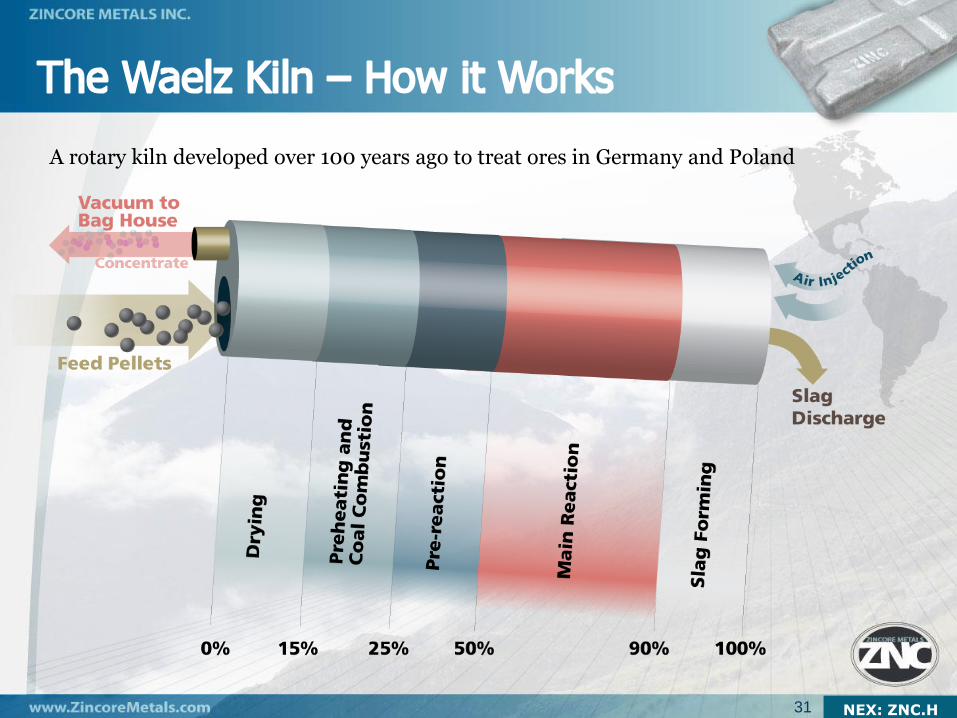
A rotary kiln developed over 100 years ago to treat ores in Germany and Poland
NEX: ZNC.H
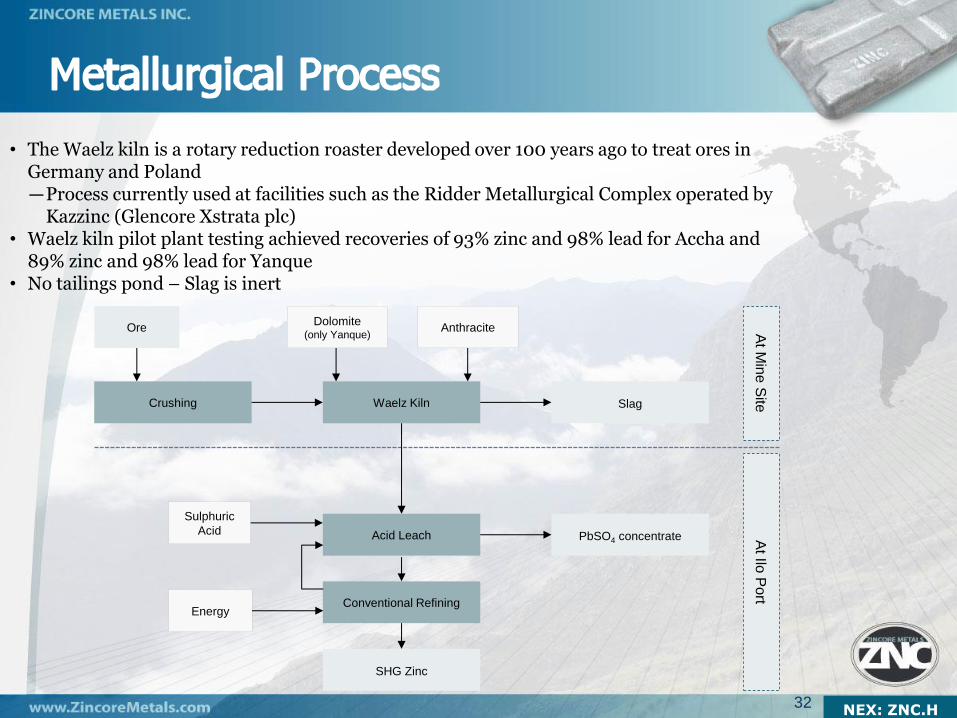
• The Waelz kiln is a rotary reduction roaster developed over 100 years ago to treat ores in Germany and Poland —Process currently used at facilities such as the Ridder Metallurgical Complex operated by
Kazzinc (Glencore Xstrata plc) • Waelz kiln pilot plant testing achieved recoveries of 93% zinc and 98% lead for Accha and
89% zinc and 98% lead for Yanque • No tailings pond – Slag is inert
32
Crushing
Ore
Waelz Kiln
Slag
Dolomite (only Yanque)
Anthracite
Acid Leach
Conventional Refining
SHG Zinc
Energy
PbSO4 concentrate
Sulphuric
Acid
At M
ine S
ite
At Ilo
Po
rt
NEX: ZNC.H