Embed Size (px)
Citation preview

2012 NFEM Forum
1
An overview of the ZTEM and AirMt systems – A case study from the Nebo-Babel Ni-Cu-PGE deposit, West Musgrave, Western Australia
Jean Legault 1 , Glenn A. Wilson 2 , Alexander V. Gribenko 3 , Michael S. Zhdanov 4 ,
Shengkai Zhao 5 and Keith Fisk 6
1 Geotech ([email protected]) 2 TechnoImaging ([email protected])
3 University of Utah & TechnoImaging ([email protected]) 4 University of Utah & TechnoImaging ([email protected])
5 Geotech ([email protected]) 6 Geotech Airborne ([email protected])
Introduction
Over the last decade, airborne electromagnetic (AEM) acquisition systems have evolved, many adopting higher moments to achieve greater depth penetration, whilst sensor calibration and post-acquisition processing technologies have also improved data quality significantly. As an alternative to conventional AEM, the Z-axis Tipper Electromagnetic (ZTEM) and Airborne Magnetic Tensor (AirMt) systems were developed to measure the transfer functions of audio-frequency natural electromagnetic sources from airborne platforms. The ZTEM system measures tipper transfer functions, and the AirMt system measures the rotational invariant of the transfer functions. Ancillary data measured by both systems include radar altimeter, receiver coil altitude, GPS elevation, and total magnetic intensity. For both ZTEM and AirMt, data are typically measured from 25-30 Hz to 600-720 Hz, giving detection depths to 1 km or more, depending on the terrain conductivity. This makes it practical for these systems to be used for mapping large-scale geological structures. The first commercial surveys for ZTEM were commissioned in 2006, and the first commercial surveys for AirMt were commissioned in 2009. Development of both systems has been aided by Geotech’s logistical and technical experience with active-source AEM systems. Presently, eight ZTEM systems and one AirMt system are in operation around the world. ZTEM and AirMt surveys have been flown in Australia, Indonesia, North America, South America, Africa and the Middle East for Sedex, VMS, IOCG, Ni-Cu-PGE, porphyry, uranium and precious metal mineralization systems for numerous major and junior exploration companies. In this paper, we present a case study for the 3D interpretation ZTEM and AirMt surveys flown over the Nebo-Babel Ni-Cu-PGE deposit in Western Australia. Background
Since the 1950s, magnetotelluric (MT) surveys have been carried out, measuring horizontal electric and magnetic fields induced from ambient (natural) sources, generally assuming that these can be treated as plane electromagnetic waves. The amplitude and phase of the primary field are unknown. By processing the electric and magnetic fields to a complex impedance tensor, the unknown source terms are removed and the transfer functions are dependent only upon frequency and the Earth’s conductivity. Magnetovariational (MV) methods are an extension of the MT concept, whereby the transfer functions between the horizontal and vertical magnetic fields:
(1) form a complex vector often called the Weiss-Parkinson vector, induction vector, or tipper. Similar to the impedance tensor for MT data, the tipper effectively removes otherwise unknown source terms. Since the vertical magnetic field is zero for plane waves vertically propagating into a 1D Earth model, non-zero vertical magnetic fields are directly related to 2D or 3D structures.
2012 NFEM Forum
2
This served as the basis for the original development of the audio-frequency magnetic (AFMAG) method (Ward, 1959) whereby two orthogonal coils were towed behind an airborne platform to determine the tilt angle of the plane of polarization of ambient (natural) magnetic fields in the 1 Hz to 20 kHz band. The natural magnetic fields of interest originate from atmospheric thunderstorm activity and propagate over large distances with little attenuation in the Earth-ionosphere waveguide. Given that the tilt angle is zero over a 1D Earth, the AFMAG method produced a non-zero response when crossing conductors. However, the direction and amplitude of the natural magnetic fields randomly varies with time and periodically with season, meaning AFMAG data were not repeatable (Ward et al., 1966). By using MT processing techniques for ground-based orthogonal horizontal magnetic field measurements, Labson et al. (1985) demonstrated that repeatable tipper data could be recovered from measured magnetic fields. The AFMAG method of Labson et al. (1985) remained largely undeveloped until the recent commercialization of ZTEM (e.g., Legault et al., 2009; Pare and Legault, 2010) (Figure 1) and subsequently, AirMt (e.g., Kaminski et al., 2010) (Figure 2) systems. ZTEM measures the tipper components as the transfer function of a vertical magnetic field measured from an airborne receiver coil to the horizontal components measured at a ground-based reference receiver coil array:
(2) AirMt directly measures the rotational invariant of the transfer function for the three magnetic fields measured from an airborne receiver coil array to the three magnetic fields measured at a ground-based (reference) location. Generalizing the Weiss-Parkinson relationship, the three components of a magnetic field measured at a receiver coil array are linearly related to the magnetic fields measured at a ground-based reference receiver coil array:
(3) If we write and as the first and second columns of the transfer function, then we can introduce the variable:
(4) and obtain the complex scalar:
(5) called the amplification parameter (AP), which can be shown to be rotationally invariant (Kuzmin et al., 2010; Dodds, 2010, pers. comms.; Wannamaker, 2010, pers. comms.). Since the amplification parameter does not depend on the orientation of the sensor, it negates the post-acquisition need to correct for the sensor orientation with the AirMt system. For both ZTEM and AirMt systems, the time series of the magnetic fields are recorded at fixed sampling rates, and the data are binned and processed to generate in-phase and quadrature transfer functions in the frequency-domain (i.e., tippers for ZTEM, amplification parameter for AirMt). The lowest frequency of the transfer functions depend upon the speed of the airborne platform, and the highest frequency depends on the sampling rate. For helicopter-borne or fixed-wing ZTEM and helicopter AirMt systems, transfer functions are typically obtained at five or six frequencies from 25 Hz to 600 Hz, giving skin depths ranging between 600 m and 2000 m for typical terrain conductivities. Instrumentation
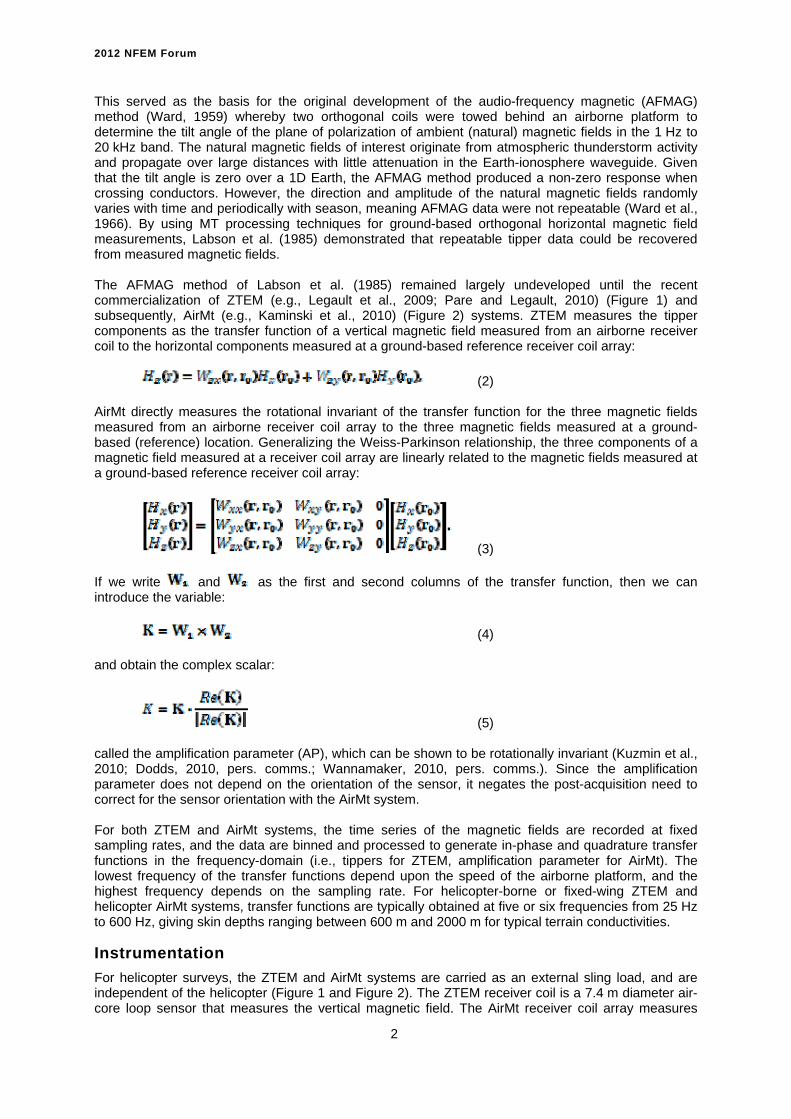
For helicopter surveys, the ZTEM and AirMt systems are carried as an external sling load, and are independent of the helicopter (Figure 1 and Figure 2). The ZTEM receiver coil is a 7.4 m diameter air-core loop sensor that measures the vertical magnetic field. The AirMt receiver coil array measures
2012 NFEM Forum
3
three components of the magnetic field using three mutually perpendicular, 3.04 m diameter air-core loops. ZTEM and AirMt receiver coils use a patented suspension system mounted inside a fibreglass shell to attenuate the majority of vibrations. The receiver coil arrays are nominally towed from the helicopter by a 90 m long cable, and are flown with a nominal ground clearance of 80 m. Altitude positioning of the receiver coil array is enabled by GPS antennas mounted on the frame in combination with GPS and radar onboard the helicopter. For both ZTEM and AirMt, the magnetic field time-series are measured with a 2 kHz sampling frequency.
Figure 1. ZTEM (Z-Axis Tipper ElectroMagnetic) system configuration.

2012 NFEM Forum
4
Figure 2. AirMt (Airborne Magnetic Tensor) system configuration. The base station for these systems is typically the AirMt sensor, consisting of three mutually perpendicular, 3.04 m diameter air-core loops, as shown in Figure 3. The base station provides a reference field which when processed with the airborne receiver coil data, produces the appropriate transfer functions which are output at 2.5 Hz, or approximately 10 m sample intervals.
2012 NFEM Forum
5
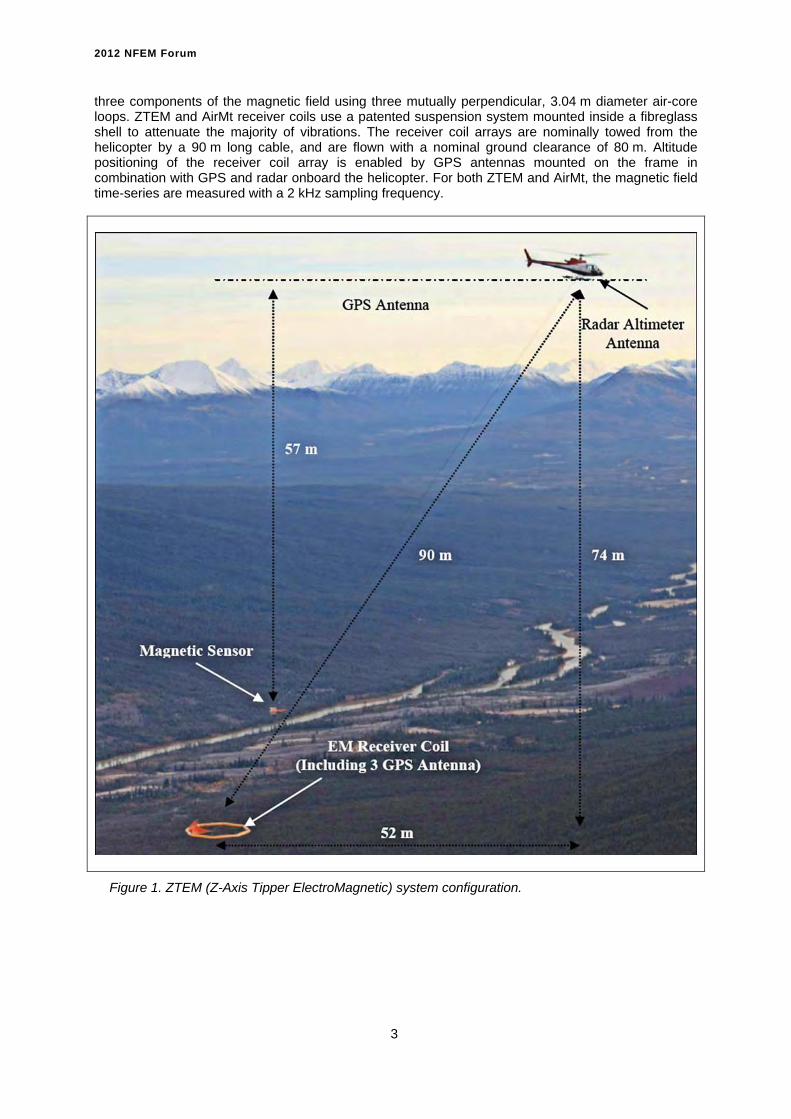
Figure 3. ZTEM and AirMt base station sensor. Interpretation
Given the use of the same assumption of plane wave source terms, modelling and inversion for ZTEM and AirMt data is similar to that of MT. However, unlike MT surveys, ZTEM and AirMt surveys typically contain hundreds to thousands of line kilometres of data with measurement locations every few metres, covering areas thousands of square kilometres in size. Geotech’s standard products for ZTEM and AirMt include total divergence and phase rotation grids, and 2D Gauss-Newton inversion based upon modifications to algorithms by Wannamaker et al. (1987), de Lugao and Wannamaker (1996), and Tarantola (1987). Third parties provide additional products such as 2D pseudo-sections by Karous-Hjelt filtering (e.g., Sattel et al., 2010) or 2D Occam inversions based on their own modifications of algorithms by Wannamaker et al. (1987) and Constable et al. (1987). Holtham and Oldenburg (2010) introduced 3D ZTEM inversion based on modifications of the 3D MT inversion by Farquharson et al. (2002). In the subsequent case study for both ZTEM and AirMt, our 3D MT inversion analog is that of Zhdanov et al. (2011). Case study – Nebo-Babel, West Musgrave, Western Australia
Geology
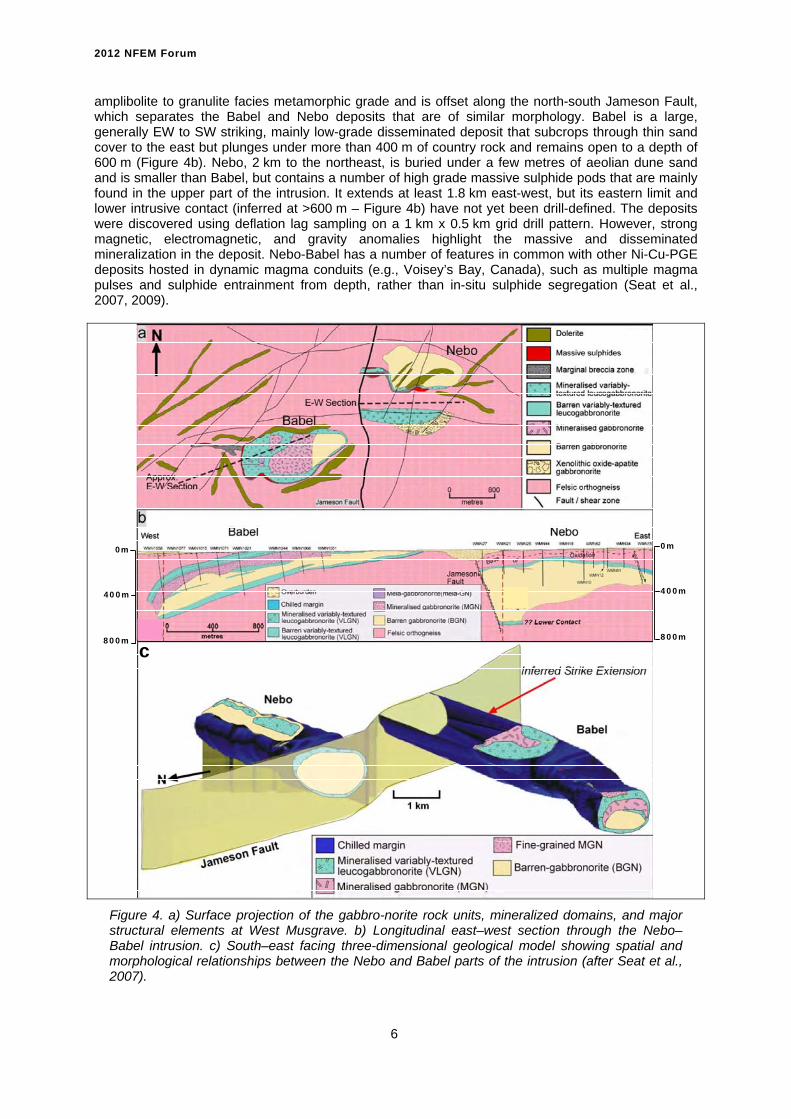
Most world-class deposits of nickel and platinum-group elements (PGE) are found in mafic igneous rocks of Proterozoic age that are part of exceptional large igneous provinces (LIPs). The West Musgrave Block, located in central Australia, is one such example, but one where the most of the prospective ground lies beneath regolith. Access for explorers has been limited in line with the wishes of the traditional landholders. However, access has become more widespread in recent years. One example of early success in the area was WMC’s (now BHP Billiton) surface geochemistry-led discovery of the Nebo-Babel Ni-Cu-PGE deposit in 2000 (Groves et al., 2007). The discovery of other large deposits in the West Musgrave region requires the identification, below cover, of the crustal-scale feeder systems of the most voluminous mafic-ultramafic magmatic events. This directly feeds back to the aforementioned need for airborne geophysical techniques capable of deep penetration beneath conductive cover, and 3D imaging of the large-scale data sets acquired. For Nebo-Babel, drill intersections include 106.5 m at 2.4% Ni, 2.7% Cu, and 0.2g/t PGE; and a resource of about 1 million tonnes contained Ni and 1 million tonnes contained Cu+Co has been released. The Nebo-Babel deposit is hosted within a concentrically-zoned, tube-like gabbronorite intrusion (1078 Ma) that has a 5 km east-west extent, a 1 x 0.5 km plan view cross section, and a shallow WSW-plunge (Figure 4). The gabbro-norite has intruded felsic orthogneissic country rocks of
2012 NFEM Forum
6
amplibolite to granulite facies metamorphic grade and is offset along the north-south Jameson Fault, which separates the Babel and Nebo deposits that are of similar morphology. Babel is a large, generally EW to SW striking, mainly low-grade disseminated deposit that subcrops through thin sand cover to the east but plunges under more than 400 m of country rock and remains open to a depth of 600 m (Figure 4b). Nebo, 2 km to the northeast, is buried under a few metres of aeolian dune sand and is smaller than Babel, but contains a number of high grade massive sulphide pods that are mainly found in the upper part of the intrusion. It extends at least 1.8 km east-west, but its eastern limit and lower intrusive contact (inferred at >600 m – Figure 4b) have not yet been drill-defined. The deposits were discovered using deflation lag sampling on a 1 km x 0.5 km grid drill pattern. However, strong magnetic, electromagnetic, and gravity anomalies highlight the massive and disseminated mineralization in the deposit. Nebo-Babel has a number of features in common with other Ni-Cu-PGE deposits hosted in dynamic magma conduits (e.g., Voisey’s Bay, Canada), such as multiple magma pulses and sulphide entrainment from depth, rather than in-situ sulphide segregation (Seat et al., 2007, 2009).
0m
400m
800m
0m
400m
800m
c
Figure 4. a) Surface projection of the gabbro-norite rock units, mineralized domains, and major structural elements at West Musgrave. b) Longitudinal east–west section through the Nebo–Babel intrusion. c) South–east facing three-dimensional geological model showing spatial and morphological relationships between the Nebo and Babel parts of the intrusion (after Seat et al., 2007).

2012 NFEM Forum
7
ZTEM and AirMt Results
Under agreement between Geotech and BHP Billiton, both ZTEM and AirMt surveys were flown over the Nebo-Babel deposit area of West Musgrave (Figure 5 and Figure 6). Previous airborne systems flown over the deposits have included GEOTEM airborne electromagnetics and FALCON airborne gravity gradiometry. A total of 541 line km of ZTEM data and 574 line km of AirMt data were acquired along both east-west and north-south flight lines (Figure 6). The survey area has minimal topographic relief, varying from 460 to 494 m above sea level. The ZTEM receiver coil was flown with a nominal ground clearance of 78 m. ZTEM data were acquired at six frequencies; 25 Hz, 37 Hz, 75 Hz, 150 Hz, 300 Hz, and 600 Hz. The AirMt receiver coil array was flown with a nominal ground clearance of 78 m. AirMt data were acquired at six frequencies; 24 Hz, 38 Hz, 75 Hz, 150 Hz, 300 Hz, and 600 Hz. Total magnetic intensity (TMI) data were also acquired using a caesium magnetometer for both surveys. Figure 7 shows the reduced-to-pole (RTP) magnetic response, which highlights a number of features, including a) a linear NS magnetic low over the Jameson fault, possibly due to alteration or overburden fill, b) NE-trending magnetic lineaments, which mostly correlate with late mafic dolerite dykes (Figure 7), c) a partial ring-like magnetic high centred on a magnetic low over the Babel deposit, that is likely responding to the increased sulphides on the outer perimeter of the intrusive, and d) a broad magnetic high that is largely centred with the Nebo intrusive that likely indicates increased magnetite content in the gabbro-norite body.
Figure 5. ZTEM and AirMt survey flight lines and base station locations over Nebo-Babel.

2012 NFEM Forum
8
Figure 6. ZTEM and AirMt flight lines over Nebo-Babel geology (modified after Seat et al., 2007).

2012 NFEM Forum
9
Figure 7. Total magnetic intensity (TMI) – reduced to pole (RTP). Examples of the 75 Hz ZTEM and AirMt data are shown in plan in Figure 8, Figure 9 and Figure 10. Multi-frequency profiles of the ZTEM and AirMt data are also presented in Figure 11, for a representative north-south flight line (L1430) across the Babel deposit. To present data from both tipper components in one image, and to compensate for the cross-over nature of ZTEM data (e.g., Figure 11 a and b), the total divergence (DT) is introduced as the horizontal derivatives of the tipper components:
(6) and is derived for each of the in-phase and quadrature components at individual frequencies. These in turn allow for minima-over-conductors and maxima-over-resistive zones. DT grids for each of the extracted frequencies were generated accordingly, using a reverse colour scheme with warm colours over conductors and cool colours over resistors (e.g., Figure 8).

2012 NFEM Forum
10
Figure 8. ZTEM 75Hz In-Phase Total Divergence (DT). Alternatively, a 90 degree phase rotation (PR) can be applied to the grids of each tipper component. This transforms bipolar (i.e., cross-over) anomalies into single pole anomalies with a maximum over conductors, while preserving long wavelength information. The two orthogonal grids are then added together:
(7) to obtain a total phase rotated (TPR) grid for each of the in-phase and quadrature components (e.g., Figure 9).

2012 NFEM Forum
11
Figure 9. ZTEM 75Hz In-Phase Total Phase Rotation (TPR). In contrast to the cross-over behaviour demonstrated by ZTEM tipper data, the AirMt amplitude parameter displays peak maxima and minima across conductive and resistive zones, respectively. Hence, no further processing of the AirMt data are required for plan-view presentation, as shown in the 75 Hz AP image in Figure 10.

2012 NFEM Forum
12
Figure 10. AirMt 75Hz In-Phase Amplitude Parameter (AP). Comparing the three images in Figure 8, Figure 9, and Figure 10, the ZTEM DT, TPR and AirMt AP results are remarkably consistent and highlight similar geologic features defined in the magnetic results, such as a) the conductive Jameson fault that extends north and south of the survey area, b) a ring-like conductive anomaly that partially coincides with the Babel deposit and, c) a smaller conductive anomaly over Nebo deposit that appears to coincide with the known massive sulphide lenses. Other ZTEM-AirMt conductive lineaments that are defined, in part, appear to correlate with either magnetic linears (e.g., Figure 7) or else mapped faults (Figure 6), and may therefore indicate increased porosity or clay in the faults or possible near-surface paleochannel or overburden relief structures (Greg Walker, 2011, pers. comm.). What seems clear from these results is that the cross-cutting behaviour in the ZTEM and AirMt clearly points to a 3-dimensional environment at Nebo-Babel. While the DT, TPR and AP grids can be used for qualitative analysis, neither they nor the raw data profiles themselves (Figure 11) are able to easily provide any quantitative information about these 3D structures. For this, inversion modelling is required.

2012 NFEM Forum
13
a)
b)
c)
ZTEM In-Phase Tzx (in-line)
ZTEM Quadrature Tzx (in-line)
ZTEM In-Phase Tzy (cross-line)
ZTEM Quadrature Tzy (cross-line)
AirMt In-Phase AP
AirMt Quadrature AP
UTM Y (metres)
UTM Y (metres)
UTM Y (metres)
BABEL DEPOSIT
BABEL DEPOSIT
BABEL DEPOSIT
0 1km
0 1km
0 1km
Figure 11. Multi-frequency (24-600Hz) In-Phase and Quadrature data profiles for L1430 a) ZTEM In-line (Tzx) component (XIP & XQD), b) ZTEM Cross-line (Tzy) component (YIP & YQD), and c) AirMt Amplitude Parameter (AIP & AQD).
Geotech’s 2D inversion is based on modifications to the MT modelling algorithm of Wannamaker et al. (1987), with sensitivities by de Lugao and Wannamaker (1996) in an iterative Gauss-Newton method (Tarantola, 1987). The algorithm is programmed to operate in serial fashion and runs on desktop computers. Each line is inverted independently. For 2D ZTEM inversion, this software only inverts the inline tipper data and assumes orthogonal and infinite strike length of all targets. For 2D AirMt inversion, the software inverts the amplification parameter assuming orthogonal and infinite strike length of all targets. This approximation is reasonable if the geological structures have strike lengths

2012 NFEM Forum
14
orthogonal to the flight line direction in the order of a skin depth; i.e., greater than the footprint or sensitivity of the ZTEM or AirMt systems. In both cases, the 2D ground topography and the air-layer thickness below the receiver coil array are accounted for. The inversions require a priori starting models that are reasonably close to the true half-space resistivity. At Nebo-Babel, 300 ohm-m was chosen for the starting half-space resistivity based on available ground AMT survey results provided by BHP Billiton. For the Nebo-Babel 2D inversions, model convergence RMS fits of 1.0 or less were achieved in 4 to 5 iterations, with data errors of 0.03 to 0.05 for ZTEM whereas considerably higher data errors of 0.1 to 0.22 were required for AirMt data fitting. This relative inability to properly fit the data in 2D is interpreted to reflect the greater sensitivity of AirMt AP measurement to 3D distortion, relative to the ZTEM in-line component data, but also an indication the 3-dimensionality of the Nebo-Babel geologic environment. Similarly, 2D inversions of data along north-south lines appear to best highlight the Nebo and Babel deposit responses, due to their dominant EW strike, with the ZTEM models seemingly more successful than AirMt. On the other hand, neither of the technologies’ 2D inversions along east-west lines (not shown) appears to have successfully resolved either deposit, possibly due to the dominance of the Jameson Fault signature. Panels a and b of Figure 12 presents 2D inversions of ZTEM and AirMt data, respectively, along the north-south L1430 profile which crosses the Babel deposit. The approximate outline of the intrusion is also shown. TechnoImaging’s 3D modelling is based on the 3D integral equation method (Hursán and Zhdanov, 2002), and the inversion itself uses a regularized re-weighted conjugate gradient (RRCG) method with focusing stabilizers (Zhdanov, 2002). Unlike smooth regularization, focusing enables the recovery of 3D models with higher contrasts and sharper boundaries. This is an analog of the 3D MT inversion described by Zhdanov et al. (2011). The software is fully parallelized for running on cluster computers, meaning that it can be scaled to invert very large survey areas. Panels d and e of Figure 12 show vertical cross-sections from the 3D inversions of ZTEM and AirMt data, respectively, along the L1430 north-south profile across the Babel deposit.

2012 NFEM Forum
15
a)
b)
c)
d)
BABEL DEPOSIT
1000m
450m2D ZTEM Inversion
2D AirMt Inversion
3D ZTEM Inversion
3D AirMt Inversion
L1430
0 500m
VIEWS LOOKING WEST
ApproximateOutline of Intrusion
Figure 12. Resistivity cross-sections for L1430 obtained from: a) ZTEM 2D Inversion, b) AirMt 2D Inversion, c) ZTEM 3D Inversion, and d) AirMt 3D Inversion.
Discussion of Results
Comparing the 3D and 2D inversion cross-sections in Figure 12, at first glance, all four appear to show a reasonably well defined anomalous conductive response over the Babel deposit, with the maximum conductivity generally offset towards the north edge and base of the intrusive. Interestingly, this increased conductivity at depth is not easily supported geologically yet is a consistent feature in all 4 models. However, the overall shape and size/extent of the semi-concentric intrusive appear to be better resolved in the 2D ZTEM, and particularly, in the 3D ZTEM and AirMt model images, the lattermost which features the best resolved and most contrasted conductivity anomaly of the four. The generally lower resistivity values found in the gabbro-norite are also consistent with ground AMT results (Greg Walker, 2011, pers. comm.). In contrast, the 2D AirMt model appears to overestimate the target depth, relative to the remaining three inversions, but this may also reflect the poorer quality model-misfits. The increased near-surface conductivity observed in all four model sections that extends south of Babel is consistent with thicker, higher conductance overburden cover that was also observed in ground AMT results.
2012 NFEM Forum
16
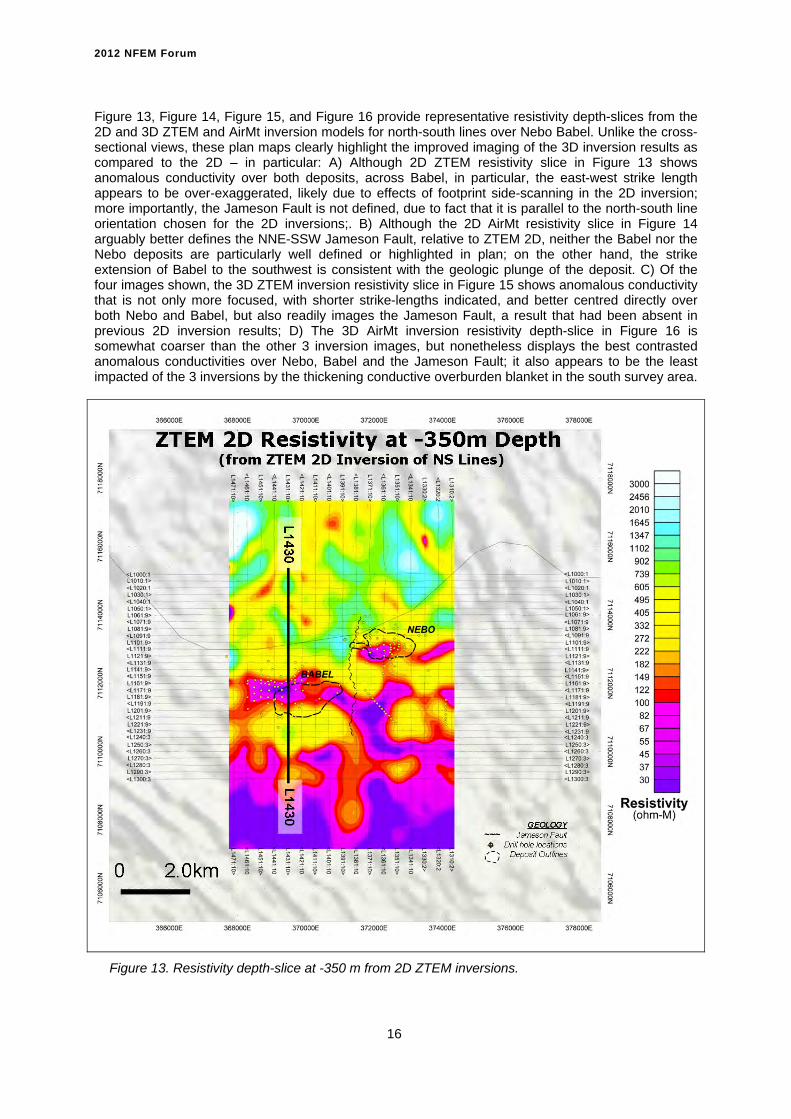
Figure 13, Figure 14, Figure 15, and Figure 16 provide representative resistivity depth-slices from the 2D and 3D ZTEM and AirMt inversion models for north-south lines over Nebo Babel. Unlike the cross-sectional views, these plan maps clearly highlight the improved imaging of the 3D inversion results as compared to the 2D – in particular: A) Although 2D ZTEM resistivity slice in Figure 13 shows anomalous conductivity over both deposits, across Babel, in particular, the east-west strike length appears to be over-exaggerated, likely due to effects of footprint side-scanning in the 2D inversion; more importantly, the Jameson Fault is not defined, due to fact that it is parallel to the north-south line orientation chosen for the 2D inversions;. B) Although the 2D AirMt resistivity slice in Figure 14 arguably better defines the NNE-SSW Jameson Fault, relative to ZTEM 2D, neither the Babel nor the Nebo deposits are particularly well defined or highlighted in plan; on the other hand, the strike extension of Babel to the southwest is consistent with the geologic plunge of the deposit. C) Of the four images shown, the 3D ZTEM inversion resistivity slice in Figure 15 shows anomalous conductivity that is not only more focused, with shorter strike-lengths indicated, and better centred directly over both Nebo and Babel, but also readily images the Jameson Fault, a result that had been absent in previous 2D inversion results; D) The 3D AirMt inversion resistivity depth-slice in Figure 16 is somewhat coarser than the other 3 inversion images, but nonetheless displays the best contrasted anomalous conductivities over Nebo, Babel and the Jameson Fault; it also appears to be the least impacted of the 3 inversions by the thickening conductive overburden blanket in the south survey area.
Figure 13. Resistivity depth-slice at -350 m from 2D ZTEM inversions.

2012 NFEM Forum
17
Figure 14. Resistivity depth-slice at -350 m from 2D AirMt inversions.

2012 NFEM Forum
18
Figure 15. Resistivity depth-slice at -350 m from 3D ZTEM inversion.

2012 NFEM Forum
19
Figure 16. Resistivity depth-slice at -350 m from 3D AirMt inversion. Conclusions
Given global industry trends towards deeper exploration under cover, ZTEM and AirMt represent practical airborne electromagnetic methods for mapping conductivity to depths in excess of 1 km in terrain of suitable conductivity. As ambient (natural) source electromagnetic methods, allowing a plane wave source to be reasonably assumed in most instances, ZTEM and AirMt data are derived from robust data processing techniques that enable 3D quantitative interpretation. Interpretation of both ZTEM and AirMt data is analogous to magnetovariational (MV) data, and in principle, similar to magnetotelluric (MT) data. We have demonstrated this with a case study involving the interpretation of over 500 line km of both ZTEM and AirMt data from BHP Billiton’s Nebo-Babel Ni-Cu-PGE deposit in Western Australia’s West Musgrave district. The analyses of the ZTEM and AirMt survey results and their interpretation using 2D and 3D inversion have shown that both passive EM technologies map the subsurface geology and structure, based on lateral resistivity contrasts, seemingly equally well. Comparisons between ZTEM DT and TPR data images against the AirMt AP data image show strong similarities between both technologies, which is perhaps to be expected. On the other hand, although both ZTEM and AirMt display anomalous responses over the Nebo and Babel deposits, neither appears to resolve or differentiate the increased conductivity associated with the massive sulphides contained in them from more weakly conductive features in the surrounding geology, notably fault-structures and lithological features. This can possibly

2012 NFEM Forum
20
be seen as an advantage by some in terms of geologic mapping of mineral deposit environments, or as a disadvantage by others in terms of the direct detection of mineral deposits themselves. In contrast with visualizing the data on their own, the process of inversion appears to significantly improve the resolution and differentiation of the Nebo and Babel mineral deposits, particularly in cross-section, where the known deposit locations feature well defined conductive anomalies in the 2D and 3D inversion models for both ZTEM and AirMt. The airborne resistivity images also generally agree with those from ground resistivity surveys. In plan, however, the weaknesses of the 2D inversions are highlighted, notably: a) the directional sensitivity of line orientation to geologic strike that affects the 2D ZTEM inversions to the greatest extent (i.e., Nebo-Babel is only properly imaged in NS lines and the Jameson Fault is only imaged in EW lines); and b) the more weakly contrasted 2D AirMt image that is due, in part, to its inherently smooth behaviour, but also because of lower model-data misfits that are, presumably, a reflection of greater sensitivity of the AirMt AP data measurement to 3D behaviour. In marked comparison to these 2D models, the 3D inversion images in plan appear to more clearly define distinctive anomalies over Nebo and Babel that can also be more easily differentiated from the NS and NE structures that are present. And in the case of ZTEM, the conductive anomalies over Nebo and Babel are better defined in the 3D inversion model; whereas for AirMt, the 3D inversion appears to produce the most contrasted anomalies over the deposits and fault zones, relative to 2D. The ZTEM and AirMt case-study and inversion comparison at Nebo-Babel has not only served to introduce two new airborne EM survey applications but has also presented field results over a well known ore deposit in a typical Australian regolith environment. It has enabled the current interpretation methodologies to be clearly described and illustrated, including initial plan view data processing, 2D inversion and culminating in the more advanced 3D inversion approaches. This should be of great value to those contemplating similar surveys or those faced with interpretation of acquired data. Acknowledgements
The authors acknowledge Geotech, TechnoImaging, and BHP Billiton for permission to publish. Gribenko and Zhdanov acknowledge support of the University of Utah’s Consortium for Electromagnetic Modeling and Inversion (CEMI). References
Constable, S. C., Parker, R. L., and Constable, C.G., 1987, Occam's inversion: A practical algorithm for generating smooth models from electromagnetic sounding data: Geophysics, 52, 289-300.
de Lugao, P.P., and Wannamaker, P.E., 1996, Calculating the two-dimensional magnetotelluric
Jacobian in finite elements using reciprocity: Geophysical Journal International, 127, 806-810. Farquharson, C. G., Oldenburg, D. W., Haber, E., and Shekhtman, R., 2002, An algorithm for the
three-dimensional inversion of magnetotelluric data: SEG Expanded Abstracts, 21, 649-652. Groves, D. I., Groves, I. M., Gardoll, S., Maier, W., and Bierlein, F. P., 2007, The West Musgrave – a
potential world-class Ni-Cu-PGE sulphide and iron oxide Cu-Au province? Presented at AIG Conference, Perth.
Holtham, E., and Oldenburg, D. W., 2010, Three-dimensional inversion of ZTEM data: Geophysical
Journal International, 182, 168-182. Hursán, G., and Zhdanov, M. S., 2002, Contraction integral equation method in three-dimensional
electromagnetic modeling: Radio Science, 37, doi: 10.1029/2001RS002513. Kaminski, V. F., Kuzmin, P., and Legault, J. M. 2010, AirMt – passive airborne EM system: Presented
at 3rd CMOS-CGU Congress, Ottawa.

2012 NFEM Forum
21
Kuzmin, P. V., Borel, G., Morrison, E. B., and Dodds, J., 2010, Geophysical prospecting using rotationally invariant parameters of natural electromagnetic fields: WIPO International Patent Application No. PCT/CA2009/001865.
Labson, V. F., Becker, A., Morrison, H. F., and Conti, U., 1985, Geophysical exploration with
audiofrequency natural magnetic fields: Geophysics, 50, 656-664. Legault, J. M., Kumar, H., Milicevic, B., and Hulbert, L., 2009, ZTEM airborne tipper AFMAG test
survey over a magmatic copper-nickel target at Axis Lake in northern Saskatchewan: SEG Expanded Abstracts, 28, 1272-1276.
Pare, P., and Legault, J. M., 2010, Ground IP-resistivity and airborne SPECTREM and helicopter
ZTEM survey results over Pebble copper-moly-gold porphyry deposit, Alaska: SEG Expanded Abstracts, 29, 1734-1738.
Sattel, D., Thomas, S., and Becken, M., 2010, An analysis of ZTEM data over the Mt Milligan porphyry
copper deposit, British Columbia: SEG Expanded Abstracts, 29, 1729-1733. Seat, Z., Beresford, S. W., Grguric, B. A., Waugh, R. S., Hronsky, J. M. A., Gee, M. A. M., Groves, D.
I., and Mathison, C. I., 2007, Architecture and emplacement of the Nebo-Babel gabbronorite-hosted magmatic Ni-Cu-PGE sulphide deposit, West Musgrave, Western Australia: Mineralium Deposita, 42, 551–581.
Seat, Z., Beresford, S. W., Grguric, B. A., Mary Gree, M. A., and Grassineau, N. V., 2009, Re-
evaluation of the role of external sulfur addition in the genesis of Ni-Cu-PGE deposits – evidence from the Nebo-Babel Ni-Cu-PGE deposit, West Musgrave, Western Australia: Economic Geology, 104, 521-538.
Tarantola, A., 1987, Inverse problem theory: Elsevier, Amsterdam. Wannamaker, P. E., Stodt, J. A., and Rijo, L., 1987, A stable finite element solution for two-
dimensional magnetotelluric modeling: Geophysical Journal of the Royal Astronomical Society, 88, 277-296.
Ward, S., 1959, AFMAG – airborne and ground: Geophysics, 24, 761-787. Ward, S. H., O’Donnell, J., Rivera, R., Ware, G. H., and Fraser, D. C., 1966, AFMAG – applications
and limitations: Geophysics, 31, 576-605. Zhdanov, M. S., 2002, Geophysical inverse theory and regularization problems: Elsevier, Amsterdam. Zhdanov, M. S., Smith, R. B., Gribenko, A., Čuma, M., and Green, A. M., 2011, Three-dimensional
inversion of large-scale EarthScope magnetotelluric data based on the integral equation method – geoelectrical imaging of the Yellowstone conductive mantle plume: Geophysical Research Letters, 37, doi:10.1029/2011GL046953.