Embed Size (px)
Citation preview
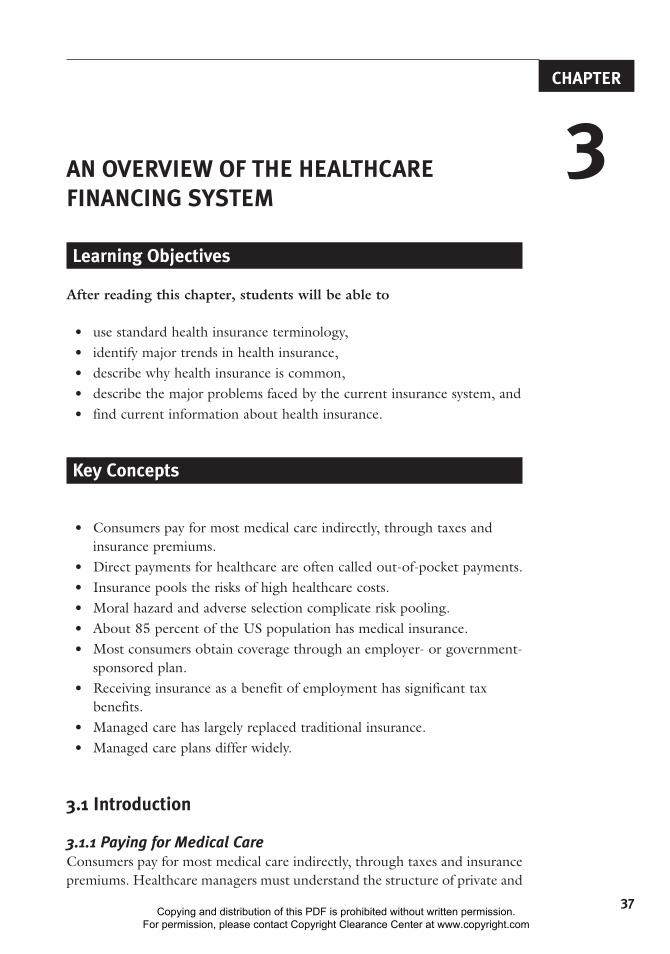
CHAPTER
37
AN OVERVIEW OF THE HEALTHCARE FINANCING SYSTEM
Learning Objectives
After reading this chapter, students will be able to
• use standard health insurance terminology,• identify major trends in health insurance,• describe why health insurance is common,• describe the major problems faced by the current insurance system, and• find current information about health insurance.
Key Concepts
• Consumers pay for most medical care indirectly, through taxes and insurance premiums.
• Direct payments for healthcare are often called out-of-pocket payments.• Insurance pools the risks of high healthcare costs.• Moral hazard and adverse selection complicate risk pooling.• About 85 percent of the US population has medical insurance.• Most consumers obtain coverage through an employer- or government-
sponsored plan.• Receiving insurance as a benefit of employment has significant tax
benefits.• Managed care has largely replaced traditional insurance.• Managed care plans differ widely.
3.1 Introduction
3.1.1 Paying for Medical CareConsumers pay for most medical care indirectly, through taxes and insurance premiums. Healthcare managers must understand the structure of private and
3
00_Lee (2266).indb 37 7/15/14 8:51 AM
Copying and distribution of this PDF is prohibited without written permission. For permission, please contact Copyright Clearance Center at www.copyright.com
Economics for Healthcare Managers38
social insurance programs because much of their organizations’ revenues will be shaped by these programs. Managers must also be aware that consumers ultimately pay for healthcare products, a key fact obscured by the complex structure of the US healthcare financing system. A prudent manager will anticipate a reaction when healthcare spending invokes higher premiums or taxes, thereby forcing consumers to spend less on other goods and services. Some consumers may drop coverage, some employers may reduce benefits, and some plans may reduce payments. This reaction need not occur if a con-sensus has emerged in support of increased spending, but even then manag-ers should be wary of the profound effects that changes to insurance plans can mean for them. Finally, managers must consider more than the amount subsidized by insurance. Even though the bulk of healthcare firms’ revenue comes from payments for products covered by insurance plans, consumers do pay directly for some products. Consumers directly spent more than $328 billion on healthcare products in 2012 (Centers for Medicare & Medicaid Services 2013b). No firm should ignore this huge market.
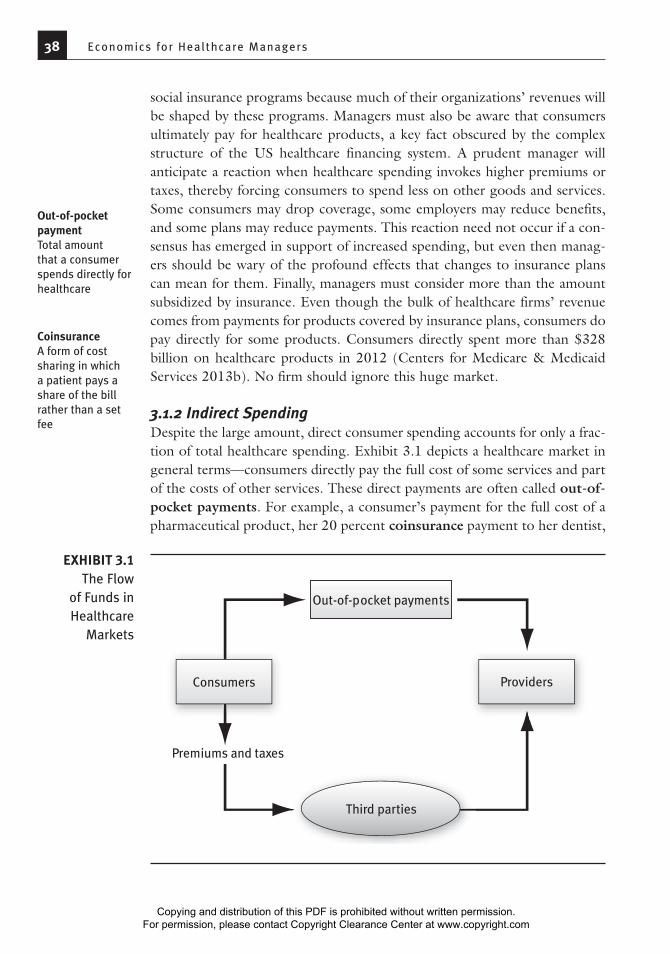
3.1.2 Indirect SpendingDespite the large amount, direct consumer spending accounts for only a frac-tion of total healthcare spending. Exhibit 3.1 depicts a healthcare market in general terms—consumers directly pay the full cost of some services and part of the costs of other services. These direct payments are often called out-of-pocket payments. For example, a consumer’s payment for the full cost of a pharmaceutical product, her 20 percent coinsurance payment to her dentist,
Out-of-pocket paymentTotal amount that a consumer spends directly for healthcare
CoinsuranceA form of cost sharing in which a patient pays a share of the bill rather than a set fee
Consumers Providers
Third parties
Premiums and taxes
Out-of-pocket payments
EXHIBIT 3.1The Flow
of Funds in Healthcare
Markets
00_Lee (2266).indb 38 7/15/14 8:51 AM
Copying and distribution of this PDF is prohibited without written permission. For permission, please contact Copyright Clearance Center at www.copyright.com
Chapter 3: An Over view of the Healthcare F inancing System 39
and her $25 copayment to her son’s pediatrician are all considered out-of-pocket payments. Insurance beneficiaries make some out-of-pocket payments for services that are not covered, for services in excess of their policy’s cov-erage limits, or for deductibles (amounts consumers are required to spend before their plan pays anything). Another name for out-of-pocket payments is cost sharing. Economics teaches us that a well-designed insurance plan usually incorporates some cost sharing. We will explore this concept in detail in the discussion of demand in Chapter 7.
Insurance payments continue to be the largest source of revenue for most healthcare providers. In 2011, they represented 97 percent of payments to hospitals, 81 percent of payments to physicians, and 67 percent of pay-ments to nursing homes (Centers for Medicare & Medicaid Services 2013b). Because indirect payments are a factor in most healthcare purchases, their structure has a profound influence on the healthcare system and healthcare organizations.
CopaymentA fee the patient must pay in addition to the amount paid by insurance
DeductibleAmount a consumer must pay before insurance covers any healthcare costs
Cost sharingThe general term for direct payments to providers by insurance beneficiaries (Deductibles, copayments, and coinsurance are forms of cost sharing.)
Boom and Bust in Home Care
The history of home care in the 1990s should be a warning to any man-ager whose business model relies on a single payer. Medicare home care spending grew rapidly between 1989 and 1997. Visits per user nearly doubled, and the number of users increased sharply (Spector, Cohen, and Pesis-Katz 2004). This boom had several causes. The intro-duction of the prospective payment system encouraged hospitals to discharge patients quickly to other settings, such as home care. Legal action in 1989 resulted in more generous eligibility and coverage, and new technology increased the number of patients who could receive adequate care at home. Some of the increased spending was for ser-vices of questionable value, and some was for services that were never delivered.
In 1997, however, the home care boom halted abruptly. Explod-ing spending and stories of fraud prodded the government to act. The Balanced Budget Act of 1997 reduced payments and eligibility for home care and reduced incentives for hospitals to discharge patients to home care. In addition, Medicare took steps to reduce fraud and abuse. The number of Medicare beneficiaries using home care fell by 20 percent, and visits per beneficiary fell by 40 percent. Home care spending fell sharply, and more than 10 percent of home care agencies
Medicare An insurance program for the elderly and disabled that is run by the Centers for Medicare & Medicaid Services
(continued)
02_Lee (2266) Chp 1-5.indd 39 7/16/14 1:59 PM
Copying and distribution of this PDF is prohibited without written permission. For permission, please contact Copyright Clearance Center at www.copyright.com
Economics for Healthcare Managers40
The extent of indirect payment in the healthcare market distinguishes it from most other markets. Indirect payment has three important effects on patients:
• It protects them against high healthcare expenses, which is one goal of insurance.
• It encourages them to use more healthcare services, which is a side effect of insurance.
• It limits their autonomy in healthcare decision making, which is not a goal of insurance.
Nonetheless, the advantages of indirect payment continue to exceed its disadvantages. As discussed in Chapter 2, the share of direct payments for healthcare has steadily fallen during the past 50 years.
3.1.3 The UninsuredFor many years the share of the population without medical insurance rose steadily, even as insurance payments rose as a share of total spending. Since the enactment of the ACA, the percentage of the population without health insurance has edged down.
Uninsured consumers enter healthcare markets with two significant disadvantages. First, they must finance their needs from their own resources or the resources of family, friends, and well-wishers. If these funds are not adequate, they must do without care or rely on charity care. The uninsured do not have access to the vast resources of modern insurance companies when large healthcare bills arrive. Second, unlike most insured consumers, unin-sured consumers may be expected to pay list prices for services. The majority of insured consumers are covered by plans that have secured discounts from providers. For example, none of the major government insurance plans and
went out of business. The boom was too good to be true, and a pru-dent manager would have anticipated a response by Medicare.
A new version of this story seems to be in the works. As a part of the Affordable Care Act (ACA), the Centers for Medicare & Medicaid Services has launched 65 trials of Medicare bundled payments that include post-acute care, of which home health care is one part (Cen-ters for Medicare & Medicaid Services 2013a). These trials almost certainly indicate that the Centers for Medicare & Medicaid Services believes that opportunities exist to reduce spending in this sector.
(continued)
02_Lee (2266) Chp 1-5.indd 40 7/16/14 2:00 PM
Copying and distribution of this PDF is prohibited without written permission. For permission, please contact Copyright Clearance Center at www.copyright.com
Chapter 3: An Over view of the Healthcare F inancing System 41
few private insurance plans pay list prices for care. Although, in principle, uninsured patients could negotiate discounts, this practice is not routine.
The uninsured tend to have low incomes. In 2012, 16 percent of Americans lacked health insurance. A quarter of those with annual household incomes below $25,000 did not have health insurance, compared with only 8 percent of those with annual household incomes above $75,000 (DeNavas-Walt, Proctor, and Smith 2013).
The combination of low income and no insurance often creates access problems. For example, in 2012, 60 percent of uninsured adults reported not filling a prescription; skipping a recommended medical test, treatment, or follow-up; not seeing a specialist when recommended; or not making a clinic visit when they had a medical problem (Collins et al. 2013). This percentage was more than double the rate for well-insured adults. Delaying or forgoing care can lead to worse health outcomes.
3.2 What Is Insurance, and Why Is It So Prevalent?
3.2.1 What Insurance DoesInsurance pools the risks of healthcare costs, which have a skewed distribu-tion. Most consumers have modest healthcare costs, but a few incur crushing sums. Insurance addresses this problem. Suppose that one person in a hun-dred has the misfortune to run up $20,000 in healthcare bills. For simplicity, let’s say no one else will have any healthcare bills. Consumers cannot predict if they will be lucky or unlucky, so they may buy insurance. If a private firm offers insurance for an annual premium of $240, many consumers would gladly buy insurance to eliminate a 1 percent chance of a $20,000 bill. (The insurer gets $4,000 extra per 100 people to cover its selling costs, claims processing costs, and profits.)
3.2.2 Adverse Selection and Moral HazardAlas, the world is more complex than the preceding scenario, and such a sim-ple plan probably would not work. To begin with, insurance tends to change the purchasing decisions of consumers. Insured consumers are more likely to use services, and providers no longer feel compelled to limit their diagnosis and treatment recommendations to amounts that individual consumers can afford. The increase in spending that occurs as a result of insurance cover-age is known as moral hazard. Moral hazard can be substantially reduced if consumers face cost-sharing requirements, and most contemporary plans have this provision.
Another, less tractable problem remains. Some consumers, notably older people with chronic illnesses, are much more likely than average to face large
Moral hazardThe incentive to use additional care that having insurance creates
00_Lee (2266).indb 41 7/15/14 8:51 AM
Copying and distribution of this PDF is prohibited without written permission. For permission, please contact Copyright Clearance Center at www.copyright.com
Economics for Healthcare Managers42
bills. Such consumers would be especially eager to buy insurance. On the other hand, some consumers, notably younger people with healthy ancestors and no chronic illnesses, are much less likely than average to face large bills. Such con-sumers would not be especially eager to buy insurance. This situation illustrates adverse selection: people with high risk are apt to be eager to buy insurance, but people with low risk may not be. Wary of this phenomenon, insurance firms have tried to assess the risks that individual consumers pose and base their premiums on those risks, a process known as underwriting. Of course under-writing drives up costs, making coverage more expensive. In the worst case, no private firm would be willing to offer insurance to the general public.
In the United States, three mechanisms reduce the effects of adverse selection: employment-sponsored medical insurance, government-sponsored medical insurance, and medical insurance subsidies. In 2012, 85 percent of the population had medical insurance. About 32 percent had government-sponsored medical insurance, and 57 percent had private medical insurance. Virtually all Americans 65 years or older have health insurance coverage through Medicare, a government insurance program. About 83 percent of those under 65 years have coverage, and most of them have private coverage (DeNavas-Walt, Proctor, and Smith 2013). More than 95 percent of privately insured consumers under 65 years obtained their coverage through their own or their spouse’s employer.
Why is the link between employment and medical insurance so strong? To begin with, insurers are able to offer lower prices on employment-based insurance because they have cut their sales costs and their adverse selection risks by selling to groups. Selling a policy to a group of 1,000 people costs only a lit-tle more than selling a policy to an individual; thus the sales cost is much lower. And because few people take jobs or stay in them just because of the medical insurance benefits, adverse selection rarely occurs (i.e., all of the employees get the insurance, whether or not they think they’ll need it soon). Medical insur-ance can also benefit employers. If coverage improves the health of employees or their dependents, workers will be more productive, thereby improving profits for the company. Companies also benefit because workers with employment-based medical insurance are less likely to quit. The costs of hiring and training employees are high, so firms do not want to lose employees unnecessarily.
The most salient factor in the link between employment and medi-cal insurance is the substantial tax savings that employment-based medical insurance provides. Medical insurance provided as a benefit is excluded from Social Security taxes, Medicare taxes, federal income taxes, and most state and local income taxes. Earning $5,000 in cash instead of a $5,000 medical insurance benefit could easily increase an employee’s tax bill by $2,500.
This system is clearly advantageous from the perspective of insur-ers, employers, and employees. From the perspective of society as a whole,
Adverse selectionHigh-risk consumers’ willingness to pay more for insurance than low-risk consumers (Organizations that have difficulty distinguishing high-risk from low-risk consumers are unlikely to be profitable.)
UnderwritingThe process of assessing the risks associated with an insurance policy and setting the premium accordingly
00_Lee (2266).indb 42 7/15/14 8:51 AM
Copying and distribution of this PDF is prohibited without written permission. For permission, please contact Copyright Clearance Center at www.copyright.com
Chapter 3: An Over view of the Healthcare F inancing System 43
however, its desirability is less clear. The subsidies built into the tax code tend to force tax rates higher, may encourage insurance for costs such as eyeglasses and routine dental checkups, and give employees an unrealistic sense of how much insurance costs.
Another disadvantage is found in the way most employers frame health insurance benefits. In 2013, less than 15 percent of private employers allowed employees to choose between plans (Kaiser Family Foundation and Health Research & Educational Trust 2013). Larger employers were more likely to offer a choice of plans. In addition, most employers pay more when an employee selects a more expensive plan, which encourages employees to choose one. Few employers share information about the quality of care offered through different plans or other aspects of plan performance. With-out this information, employees are unlikely to be able to identify plans with better provider networks or better customer service.
Understanding Health Risks and Insurance
Adverse selection is one reason for governments to intervene in health insurance markets. A persistent fear is that people with low risks will not buy insurance, pushing up premiums for people with higher risks. Once premiums go up, additional people with low risks will drop out. This sequence is called a death spiral because it will ultimately result in no one buying insurance. To prevent this, governments subsidize insurance or mandate that it be bought.
Little evidence suggests that people understand their health risks very well, and evidence shows that some consumers poorly understand health insurance plans. A study of the Medicare supple-mentary insurance market found that those with supplementary cover-age spend an average of $4,000 less than those without. One factor explaining this advantageous selection was cognitive ability (Fang, Keane, and Silverman 2008). People who did not buy coverage may not have understood the risks they were running or the benefits of having supplementary coverage. A recent survey of Americans who might seek insurance through the ACA marketplace found that many struggled with such basic concepts as a premium, a provider network, or covered services (Long et al. 2014).
A person under 65 years has a 10 percent chance of having medi-cal bills of $30,000 or more (Bernard 2013). Because such bills are not part of their experience, some people tend to underestimate the finan-cial and health risks of not having insurance.
00_Lee (2266).indb 43 7/15/14 8:51 AM
Copying and distribution of this PDF is prohibited without written permission. For permission, please contact Copyright Clearance Center at www.copyright.com
Economics for Healthcare Managers44
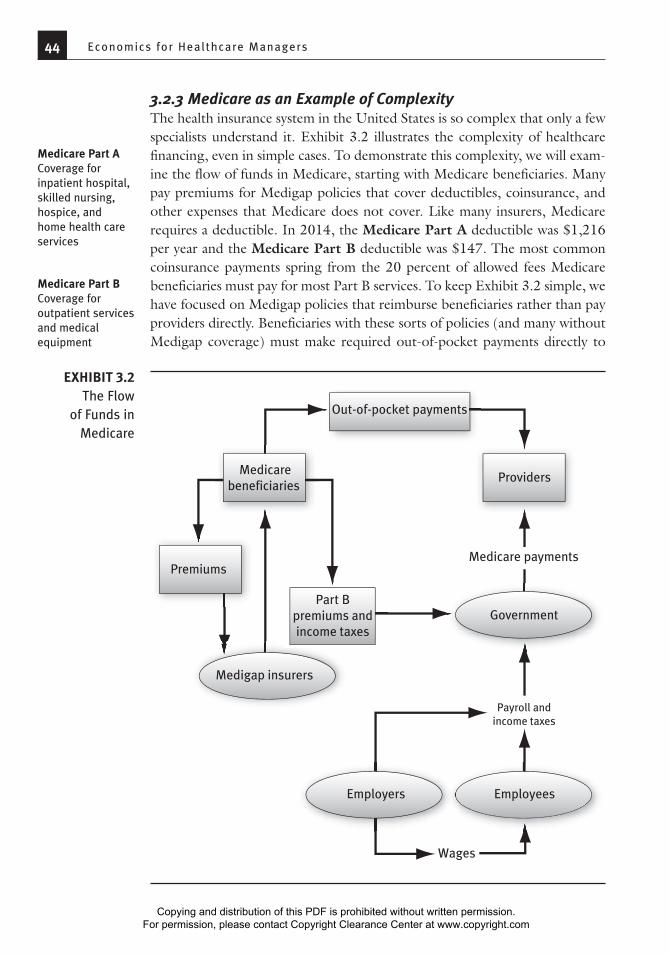
3.2.3 Medicare as an Example of ComplexityThe health insurance system in the United States is so complex that only a few specialists understand it. Exhibit 3.2 illustrates the complexity of healthcare financing, even in simple cases. To demonstrate this complexity, we will exam-ine the flow of funds in Medicare, starting with Medicare beneficiaries. Many pay premiums for Medigap policies that cover deductibles, coinsurance, and other expenses that Medicare does not cover. Like many insurers, Medicare requires a deductible. In 2014, the Medicare Part A deductible was $1,216 per year and the Medicare Part B deductible was $147. The most common coinsurance payments spring from the 20 percent of allowed fees Medicare beneficiaries must pay for most Part B services. To keep Exhibit 3.2 simple, we have focused on Medigap policies that reimburse beneficiaries rather than pay providers directly. Beneficiaries with these sorts of policies (and many without Medigap coverage) must make required out-of-pocket payments directly to
Medicare Part ACoverage for inpatient hospital, skilled nursing, hospice, and home health care services
Medicare Part BCoverage for outpatient services and medical equipment
Medicarebeneficiaries
Premiums
Part Bpremiums andincome taxes
Providers
Government
Employees
Wages
Employers
Payroll andincome taxes
Medicare payments
Medigap insurers
Out-of-pocket payments
EXHIBIT 3.2The Flow
of Funds in Medicare
00_Lee (2266).indb 44 7/15/14 8:51 AM
Copying and distribution of this PDF is prohibited without written permission. For permission, please contact Copyright Clearance Center at www.copyright.com
Chapter 3: An Over view of the Healthcare F inancing System 45
providers. Beneficiaries must also pay the Part B premiums that fund 25 per-cent of this Medicare component. Like other taxpayers, beneficiaries must also pay income taxes that cover the other 75 percent of Part B costs.
Employers and employees also pay taxes to fund the Medicare system. The most visible of these taxes is the Medicare payroll tax, which is levied on wages to fund Part A (which covers hospital, home health, skilled nursing, and hospice services). In addition, corporation and individual income taxes help fund the 75 percent of Part B costs that premiums do not cover. The Centers for Medicare & Medicaid Services, the federal agency that operates Medicare, combines these tax and premium funds to pay providers. Not surprisingly, few taxpayers, beneficiaries, or public officials understand how Medicare is financed.
3.3 The Changing Nature of Health Insurance
Traditional, open-ended fee-for-service (FFS) plans (of which pre-1984 Medicare was a classic example) have three basic problems. First, they encourage providers and consumers to use covered services as long as the direct cost to consumers is less than the direct benefit. Because the actual total cost of care is much greater than the amount consumers pay, some con-sumers may use services that are not worth as much as they actually cost. In addition, open-ended FFS plans discourage consumers from using services that are not covered, even highly effective ones. Finally, much of the system is unplanned, in that the prices paid by consumers and the prices received by providers do not reflect actual provider costs or consumer valuations.
Given the origins of traditional medical insurance, this inattention to efficiency makes sense. Medical insurance was started by providers, largely in response to consumers’ inability to afford expensive services and the unwillingness of some consumers to pay their bills once services had been rendered. The goal was to cover the costs of services, not to provide care in the most efficient manner possible and not to improve the health of the covered population.
Managed care is a varied collection of insurance plans with only one common denominator: they are different from FFS insurance plans. FFS plans covered all services if they were included in the contract and if a pro-vider, typically a physician, was willing to certify that they were medically necessary. No FFS features tried to influence the decisions of patients or physicians (aside from the effects of subsidizing higher spending).
At present, insurance takes five basic forms: FFS plans, PPOs (pre-ferred provider organizations), HMOs (health maintenance organiza-tions), point-of-service (POS) plans, and high-deductible plans. We will briefly describe each of the alternatives to FFS plans.
Fee-for-serviceA reimbursement model that pays providers on the basis of their charges for services
PPO (preferred provider organization)An insurance plan that contracts with a network of providers (Network providers may be chosen for a variety of reasons, but a willingness to discount fees is usually required.)
HMO (health maintenance organization)A firm that provides comprehensive healthcare benefits to enrollees in exchange for a premium (Originally, HMOs were distinct from other insurance firms because providers were not paid on a fee-for-service basis and because enrollees faced no cost-sharing requirements.)
Point-of-service (POS) planPlan that allows members to see any physician but increases cost sharing for physicians outside the plan’s network (This arrangement has become so common that POS plans may not be labeled as such.)
00_Lee (2266).indb 45 7/15/14 8:51 AM
Copying and distribution of this PDF is prohibited without written permission. For permission, please contact Copyright Clearance Center at www.copyright.com
Economics for Healthcare Managers46
Federal Employees Health Benefits Program as the Model for Marketplace Plans
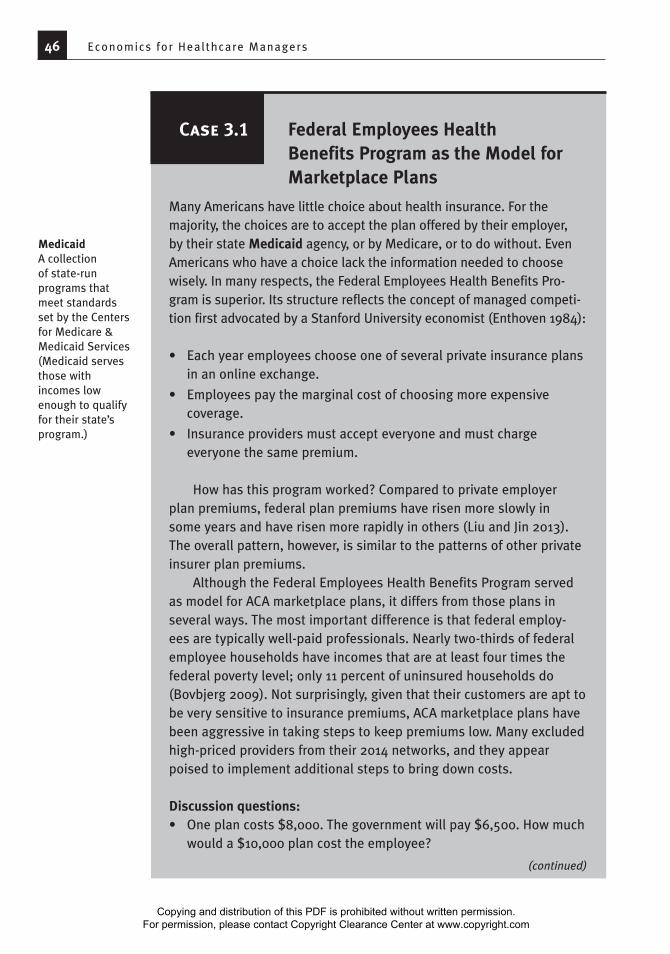
Many Americans have little choice about health insurance. For the majority, the choices are to accept the plan offered by their employer, by their state Medicaid agency, or by Medicare, or to do without. Even Americans who have a choice lack the information needed to choose wisely. In many respects, the Federal Employees Health Benefits Pro-gram is superior. Its structure reflects the concept of managed competi-tion first advocated by a Stanford University economist (Enthoven 1984):
• Each year employees choose one of several private insurance plans in an online exchange.
• Employees pay the marginal cost of choosing more expensive coverage.
• Insurance providers must accept everyone and must charge everyone the same premium.
How has this program worked? Compared to private employer plan premiums, federal plan premiums have risen more slowly in some years and have risen more rapidly in others (Liu and Jin 2013). The overall pattern, however, is similar to the patterns of other private insurer plan premiums.
Although the Federal Employees Health Benefits Program served as model for ACA marketplace plans, it differs from those plans in several ways. The most important difference is that federal employ-ees are typically well-paid professionals. Nearly two-thirds of federal employee households have incomes that are at least four times the federal poverty level; only 11 percent of uninsured households do (Bovbjerg 2009). Not surprisingly, given that their customers are apt to be very sensitive to insurance premiums, ACA marketplace plans have been aggressive in taking steps to keep premiums low. Many excluded high-priced providers from their 2014 networks, and they appear poised to implement additional steps to bring down costs.
Discussion questions:• One plan costs $8,000. The government will pay $6,500. How much
would a $10,000 plan cost the employee?
MedicaidA collection of state-run programs that meet standards set by the Centers for Medicare & Medicaid Services (Medicaid serves those with incomes low enough to qualify for their state’s program.)
Case 3.1
(continued)
00_Lee (2266).indb 46 7/15/14 8:51 AM
Copying and distribution of this PDF is prohibited without written permission. For permission, please contact Copyright Clearance Center at www.copyright.com
Chapter 3: An Over view of the Healthcare F inancing System 47
PPOs are the most common form of managed care organization. All PPOs negotiate discounts with a panel of hospitals, physicians, and other providers, but their similarities end there. Some PPOs have small panels; oth-ers have large panels. Some PPOs require that care be approved by a primary care physician; some do not.
PPOs are far less diverse than HMOs, however. Some HMOs are structured around large medical group practices and are called group model HMOs. Group model HMOs typically make a flat payment per consumer enrolled with the group. This practice is called capitation. Other HMOs, called staff model HMOs, employ physicians directly and pay them salaries. Both staff and group model HMOs still exist, but they are expensive to set up and make sense only for large numbers of enrollees.
HMO expansion largely has been fueled by the growth of indepen-dent practice association (IPA) HMOs. These plans contract with large groups of physicians, small groups of physicians, and solo practice physicians. These contracts assume many forms. Physicians can be paid per service (as PPOs usually operate) or per enrollee (as group model HMOs usually oper-ate). IPAs also pay hospitals and other providers in different ways.
The POS plan is another form of HMO. These plans are a combina-tion of PPO and IPA. Unlike an IPA, they cover nonemergency services pro-vided by nonnetwork providers, but copayments are higher. Unlike a PPO, they pay some providers using methods other than discounted FFS.
A high-deductible (HD) plan typically has a deductible of more than $1,000 for an individual. These plans are also sometimes called consumer-directed health plans. Many HD plans also incorporate health savings accounts, in which funds deposited by the worker or the employer can earn interest if not spent.
Group model HMOHMO that contracts with a physician group to provide services
CapitationPayment per person (The payment does not depend on the services provided.)
Staff model HMOHMO that directly employs staff physicians to provide services
Independent practice asso-ciation (IPA) HMOHMO that contracts with an independent practice association, which in turn contracts with physician groups
• Is equal government payment important, regardless of the plan the employee chooses?
• How does equal payment affect employees’ choices?
• Would varying premiums (such as premiums based on age) work better, so that older employees would be attractive risks for insurers?
• What problems would varying premiums cause?
• Why didn’t insurers for the Federal Employees Health Benefits Program take aggressive steps (like creating narrow networks) to bring down premiums?
• Why do the high incomes of federal employees affect their choices?
Case 3.1(continued)
00_Lee (2266).indb 47 7/15/14 8:51 AM
Copying and distribution of this PDF is prohibited without written permission. For permission, please contact Copyright Clearance Center at www.copyright.com
Economics for Healthcare Managers48
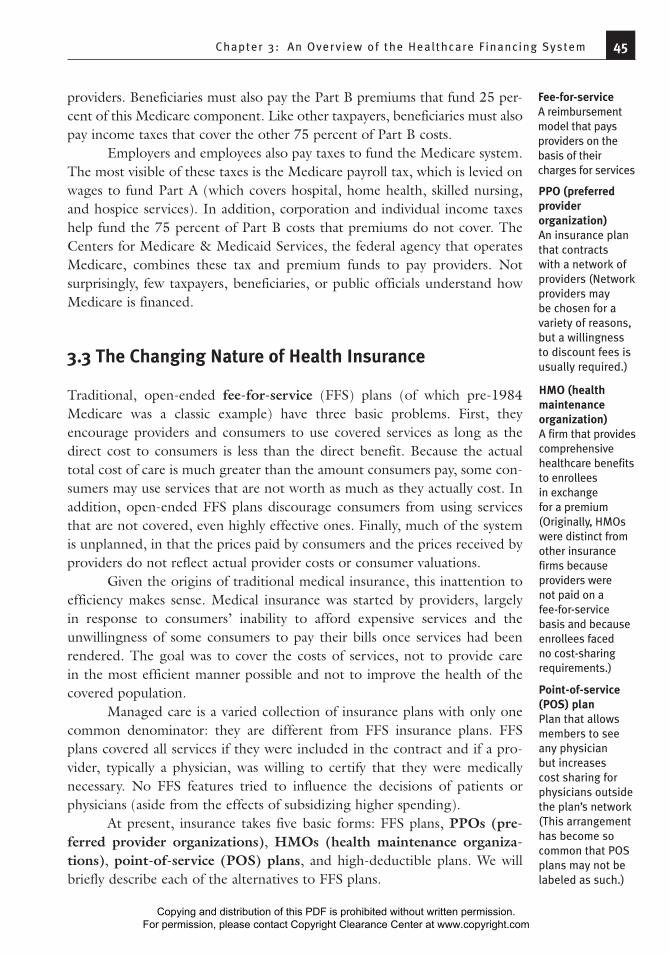
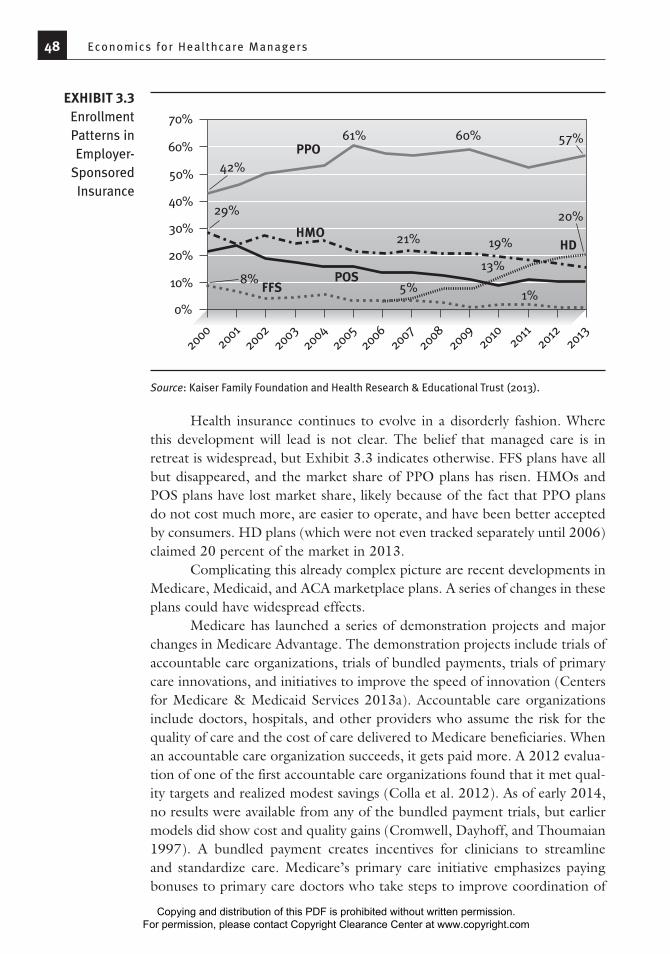
Health insurance continues to evolve in a disorderly fashion. Where this development will lead is not clear. The belief that managed care is in retreat is widespread, but Exhibit 3.3 indicates otherwise. FFS plans have all but disappeared, and the market share of PPO plans has risen. HMOs and POS plans have lost market share, likely because of the fact that PPO plans do not cost much more, are easier to operate, and have been better accepted by consumers. HD plans (which were not even tracked separately until 2006) claimed 20 percent of the market in 2013.
Complicating this already complex picture are recent developments in Medicare, Medicaid, and ACA marketplace plans. A series of changes in these plans could have widespread effects.
Medicare has launched a series of demonstration projects and major changes in Medicare Advantage. The demonstration projects include trials of accountable care organizations, trials of bundled payments, trials of primary care innovations, and initiatives to improve the speed of innovation (Centers for Medicare & Medicaid Services 2013a). Accountable care organizations include doctors, hospitals, and other providers who assume the risk for the quality of care and the cost of care delivered to Medicare beneficiaries. When an accountable care organization succeeds, it gets paid more. A 2012 evalua-tion of one of the first accountable care organizations found that it met qual-ity targets and realized modest savings (Colla et al. 2012). As of early 2014, no results were available from any of the bundled payment trials, but earlier models did show cost and quality gains (Cromwell, Dayhoff, and Thoumaian 1997). A bundled payment creates incentives for clinicians to streamline and standardize care. Medicare’s primary care initiative emphasizes paying bonuses to primary care doctors who take steps to improve coordination of
20002002
20032004
20052006
20072008
20092010
20112012
20132001
HMO
POSFFS
HD
PPO60%
70%
50%
40%
30%
20%
10%
0%
8%1%
5%
13%
19%21%
29%
42%
61% 60% 57%
20%
EXHIBIT 3.3Enrollment Patterns in Employer-
Sponsored Insurance
Source: Kaiser Family Foundation and Health Research & Educational Trust (2013).
00_Lee (2266).indb 48 7/15/14 8:51 AM
Copying and distribution of this PDF is prohibited without written permission. For permission, please contact Copyright Clearance Center at www.copyright.com
Chapter 3: An Over view of the Healthcare F inancing System 49
care. In essence, Medicare’s primary care initiative is testing medical homes. The evidence suggests that some medical homes improve care and reduce cost, but some do not (Peikes et al. 2012). As of early 2014, no results were available for the initiatives to speed innovation.
The changes to Medicare Advantage appear to have been successful. The main driver appears to have been the creation of a rating system that summarizes the performance of an insurance plan (and its network of provid-ers) using a rating of one to five stars. This system appears to have improved outcomes for Medicare Advantage customers and has increased enrollment significantly (Ayanian et al. 2013; Landon et al. 2012; Reid et al. 2013). Given the complexities of making health insurance decisions, this innovation might prove useful in other health insurance sectors.
Changes in Medicaid have taken place since the passage of the ACA in 2010. Most of these changes entail creation of managed care plans for beneficiaries who are also eligible for Medicare. These dually eligible benefi-ciaries typically face grave health problems and have very low incomes. No general results are available, although a trial of accountable care organizations for dually eligible Medicare beneficiaries showed improvements in cost and quality (Colla et al. 2012).
ACA marketplace plans are new, but most have used narrow provider networks to keep premiums down. About 70 percent of these plans have very small networks, and plans with broader networks have significantly higher premiums (McKinsey & Company 2013). Some of these innovations will likely work well, and some of them will be incorporated into standard insur-ance plans. However, it is too soon to tell which ones will become routine.
Group Health Cooperative’s Patient-Centered Medical Home
Group Health Cooperative is a nonprofit, consumer-governed health-care system that provides healthcare and health insurance coverage to residents of Idaho and Washington. Originally a staff model HMO that employed physicians, Group Health became a network HMO, meaning that it contracted with a large multispecialty medical group and with independent physicians.
Group Health had traditionally stressed primary care. But as it tran-sitioned away from being a staff model HMO, its primary care practices began showing signs of strain. Primary care patient panels kept getting larger, referrals to specialists increased, hospitalization costs rose, emergency department use mounted, evidence of workforce burnout
Network HMOHMO that has a variety of contracts (including contracts with physician groups, IPAs, and individual physicians)
Case 3.2
(continued)
00_Lee (2266).indb 49 7/15/14 8:51 AM
Copying and distribution of this PDF is prohibited without written permission. For permission, please contact Copyright Clearance Center at www.copyright.com
Economics for Healthcare Managers50
3.4 Payment Systems
In the past, most healthcare providers were paid on a simple FFS basis. Today, managed care plans have begun to experiment with alternative payment arrangements. Different payment systems are important because they create
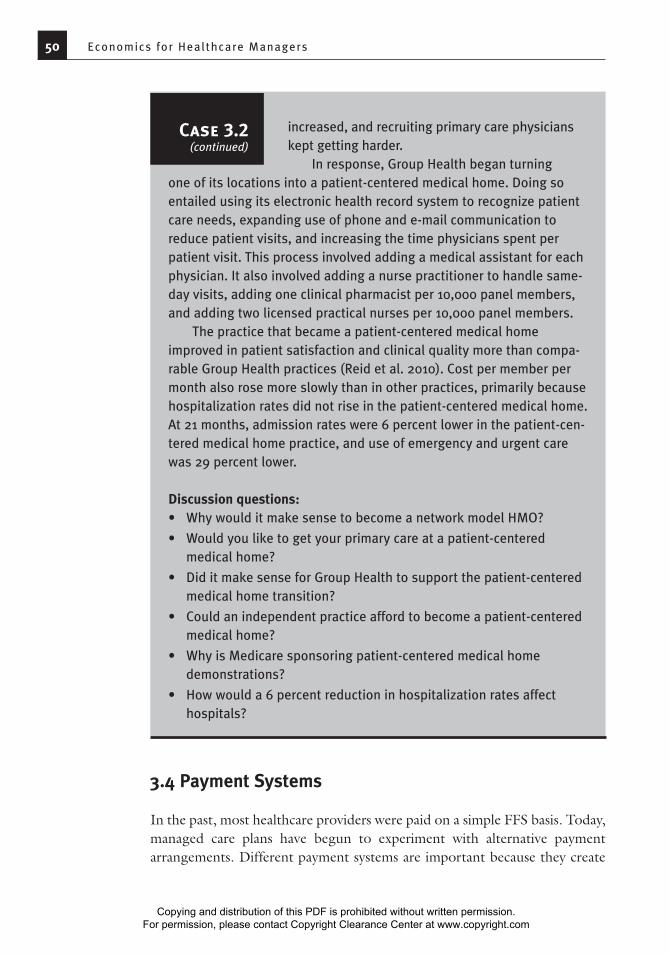
increased, and recruiting primary care physicians kept getting harder.
In response, Group Health began turning one of its locations into a patient-centered medical home. Doing so entailed using its electronic health record system to recognize patient care needs, expanding use of phone and e-mail communication to reduce patient visits, and increasing the time physicians spent per patient visit. This process involved adding a medical assistant for each physician. It also involved adding a nurse practitioner to handle same-day visits, adding one clinical pharmacist per 10,000 panel members, and adding two licensed practical nurses per 10,000 panel members.
The practice that became a patient-centered medical home improved in patient satisfaction and clinical quality more than compa-rable Group Health practices (Reid et al. 2010). Cost per member per month also rose more slowly than in other practices, primarily because hospitalization rates did not rise in the patient-centered medical home. At 21 months, admission rates were 6 percent lower in the patient-cen-tered medical home practice, and use of emergency and urgent care was 29 percent lower.
Discussion questions:• Why would it make sense to become a network model HMO?
• Would you like to get your primary care at a patient-centered medical home?
• Did it make sense for Group Health to support the patient-centered medical home transition?
• Could an independent practice afford to become a patient-centered medical home?
• Why is Medicare sponsoring patient-centered medical home demonstrations?
• How would a 6 percent reduction in hospitalization rates affect hospitals?
Case 3.2(continued)
00_Lee (2266).indb 50 7/15/14 8:51 AM
Copying and distribution of this PDF is prohibited without written permission. For permission, please contact Copyright Clearance Center at www.copyright.com
Chapter 3: An Over view of the Healthcare F inancing System 51
different incentive systems for providers. Differences in financial incentives lead to different patterns of care, so the power of changing incentives should not be underestimated. In contracting with insurers or providers, managers need to recognize the strengths and weaknesses of different systems. The four basic payment methods—salary, FFS, case-based, and capitation—can be modified by the addition of incentive payments, increasing the number of possible payment methods.
A salary is fixed compensation paid per defined period. As such, it is not directly linked to output. Typically, physicians are paid a salary when their productivity is difficult to measure (e.g., in the case of academic physicians) or when the incentives created by FFS payments are seen as undesirable (e.g., an incentive to overtreat increases costs). As stated earlier, most physicians in the United States have traditionally been paid on a fee-for-service basis, meaning that each physician has a schedule of fees and expects to be paid that amount for each unit of service provided.
Case-based payments make single payments for all covered services associated with an episode of care. Medicare’s diagnosis-related group (DRG) system is a case-based system for hospital care, although it does not include physicians’ services or posthospital care. In essence, case-based pay-ments are FFS payments for a wider range of services. Bundled payments are a form of case-based payments. Capitation is compensation paid per benefi-ciary enrolled with a physician or an organization. Capitation is similar to a salary but varies according to the number of customers.
Each of the four basic payment methods has advantages and disadvan-tages. Salaries are straightforward and incorporate no incentives to provide more care than necessary, but they do not encourage outstanding effort or exemplary service. In addition, salaries give providers incentives to use resources other than their time and effort to meet their customers’ needs. In the absence of incentives not to refer patients to other providers, salaried providers may well seek to refer substantial numbers of patients to specialists, urgent care clinics, or other sources of care.
Capitation incorporates many of the same incentives as a salary, with two important differences. One is that capitation payments drop if customers leave the practice, so physicians have more incentive to serve patients well. The other is that capitation arrangements often generate extra costs. Profits rise if these extra costs fall, so capitation encourages greater efficiency, referral to other providers, or insufficient treatment.
In contrast, FFS payments create powerful incentives to provide supe-rior service, so much that overtreatment of insured consumers often results. Services that are more costly than beneficial can be profitable in this system, as long as the benefits exceed the consumer’s out-of-pocket cost. These incentives can complicate efforts to control costs. For example, attempts to
SalaryFixed compensation paid per period
Case-based paymentA single payment for an episode of care (The payment does not change if fewer services or more services are provided.)
Diagnosis-related groups (DRGs)Case groups that underlie Medicare’s case-based payment system for hospitals
00_Lee (2266).indb 51 7/15/14 8:51 AM
Copying and distribution of this PDF is prohibited without written permission. For permission, please contact Copyright Clearance Center at www.copyright.com
Economics for Healthcare Managers52
impose or negotiate lower rates are likely to provoke providers to “unbun-dle” care by billing separately for procedures or tests that had been combined as one service.
The case-based method combines features of the FFS and capitation methods. Like FFS, it creates strong incentives to provide exceptional ser-vice, as well as an additional incentive to increase profits by reducing costs included in the case rate. Costs can be reduced by improving efficiency, shifting responsibility for therapy to “free” sources (such as the health depart-ment), and narrowing the definition of a case. The challenge is to keep pro-viders focused on improving efficiency, not on duping the system.
Any of these four basic methods can be modified by including bonuses and penalties. A base salary plus a bonus for reducing inpatient days in selected cases is not a straight salary contract. Similarly, a capitation plan with bonuses or penalties for exceeding or not meeting customer service standards (e.g., a bonus for returning more than 75 percent of after-hours calls within 15 min-utes) would not generate the same incentives a plain capitation plan would.
Capitation was previously expected to become the dominant method of payment. Experience with capitation suggests, however, that few providers (or insurers, for that matter) have the administrative skills or data that capita-tion demands. In addition, the financial risks of capitation can be substantial. Few providers have enough capitated patients for variations in average costs to cease being worrisome, and capitation payments are seldom risk-adjusted (i.e., increased when spending can be expected to be higher than average). These considerations have dampened most providers’ enthusiasm for capita-tion. Insurers also have realized that capitation is not a panacea, recognizing that providers have ways other than becoming more efficient to reduce their costs. At present, FFS payments to providers remain the norm, even in most HMOs, but incentive payments for quality are proliferating. What compensa-tion arrangements will look like in ten years remains to be seen.
3.5 Conclusion
The days of traditional, open-ended insurance plans are over. Despite the ubiquity of managed care, most consumers are enrolled in plans that are minimally managed, such as PPOs or POS plans that pay providers in familiar ways, and most providers are not part of an organized delivery system. This situation may change.
The central challenge of cost remains. In 2012 the median household income for a family of four was $66,000. This statistic means that half of the households in the country made less than $66,000. The Milliman Medical Index, which tracks all healthcare costs, shows that an average family of four
00_Lee (2266).indb 52 7/15/14 8:51 AM
Copying and distribution of this PDF is prohibited without written permission. For permission, please contact Copyright Clearance Center at www.copyright.com
Chapter 3: An Over view of the Healthcare F inancing System 53
spent $20,728 on healthcare in 2012 (Milliman 2013). Many families simply cannot afford this level of spending.
The process of change substantially increases the risks healthcare man-agers must face. The next chapter will introduce the basics of how to manage these risks.
Exercises
3.1 Why is health insurance necessary? 3.2 Explain how adverse selection and moral hazard are different, and
give an example of each. 3.3 “The United States is the land of the overinsured, the underinsured,
and the uninsured.” What do you think these concepts mean? Why might this comment be true?
3.4 Private health insurers have been slow to develop and adopt proven cost containment innovations (e.g., case rates or disease management programs). Why do you think this is the case?
3.5 A radiology firm charges $2,000 per exam. Uninsured patients are expected to pay list price. How much do they pay?
3.6 A radiology firm charges $2,000 per exam. An insurer’s allowed fee is 80 percent of charges. Its beneficiaries pay 25 percent of the allowed fee. How much does the insurer pay? How much does the beneficiary pay?
3.7 If the radiology firm raised its charge to $3,000, how much would the insurer pay? How much would the beneficiary pay?
3.8 A surgeon charges $2,400 for hernia surgery. He contracts with an insurer that allows a fee of $800. Patients pay 20 percent of the allowed fee. How much does the insurer pay? How much does the patient pay?
3.9 You have incurred a medical bill of $10,000. Your plan has a deductible of $1,000 and coinsurance of 20 percent. How much of this bill will you have to pay directly?
3.10 Why do employers provide health insurance coverage to their employees?
3.11 Your firm offers only a PPO with a large deductible, high coinsurance, and a limited network. You pay $400 per month for single coverage. Some of your employees have been urging you to offer a more generous plan. Who would you expect to choose the more generous plan and pay any extra premium?
3.12 What are the fundamental differences between HMO and PPO plans?
00_Lee (2266).indb 53 7/15/14 8:51 AM
Copying and distribution of this PDF is prohibited without written permission. For permission, please contact Copyright Clearance Center at www.copyright.com
Economics for Healthcare Managers54
3.13 Suppose that your employer offered you $4,000 in cash instead of health insurance coverage. Health insurance is excluded from state income taxes and federal income taxes. (To keep the problem simple, we will ignore Social Security and Medicare taxes.) The cash would be subject to state income taxes (8 percent) and federal income taxes (28 percent). How much would your after-tax income go up if you took the cash rather than the insurance?
3.14 How different would this calculation look for a worker who earned $500,000 and lived in Vermont? This worker would face a state income tax rate of 9.5 percent and a federal income tax rate of 35 percent.
References
Ayanian, J. Z., B. E. Landon, A. M. Zaslavsky, R. C. Saunders, L. G. Pawlson, and J. P. Newhouse. 2013. “Medicare Beneficiaries More Likely to Receive Appro-priate Ambulatory Services in HMOs Than in Traditional Medicare.” Health Affairs 32 (7): 1228–35.
Bernard, T. S. 2013. “Weighing the Risks of Going Without Health Insurance.” New York Times, November 19.
Bovbjerg, R. R. 2009. “Lessons for Health Reform from the Federal Employees Health Benefits Program.” Timely Analysis of Immediate Health Policy Issues August. Robert Wood Johnson Foundation and the Urban Institute. www.urban.org/UploadedPDF/411940_lessons_for_health_reform.pdf.
Centers for Medicare & Medicaid Services. 2013a. “Innovation Models.” http://innovation.cms.gov/.
———. 2013b. “National Health Expenditure Data.” www.cms.gov/Research- Statistics-Data-and-Systems/Statistics-Trends-and-Reports/NationalHealth ExpendData/NationalHealthAccountsHistorical.html.
Colla, C. H., D. E. Wennberg, E. Meara, J. S. Skinner, D. Gottlieb, V. A. Lewis, C. M. Snyder, and E. S. Fisher. 2012. “Spending Differences Associated with the Medicare Physician Group Practice Demonstration.” Journal of the American Medical Association 308 (10): 1015–23.
Collins, S. R., R. Robertson, T. Garber, and M. M. Doty. 2013. Insuring the Future: Current Trends in Health Coverage and the Effects of Implementing the Afford-able Care Act. New York: The Commonwealth Fund.
Cromwell, J., D. A. Dayhoff, and A. H. Thoumaian. 1997. “Cost Savings and Phy-sician Responses to Global Bundled Payments for Medicare Heart Bypass Surgery.” Health Care Financing Review 19 (1): 41–57.
DeNavas-Walt, C., B. D. Proctor, and J. C. Smith. 2013. Income, Poverty, and Health Insurance Coverage in the United States: 2012. Washington, DC: US Govern-ment Printing Office.
00_Lee (2266).indb 54 7/15/14 8:51 AM
Copying and distribution of this PDF is prohibited without written permission. For permission, please contact Copyright Clearance Center at www.copyright.com
Chapter 3: An Over view of the Healthcare F inancing System 55
Enthoven, A. C. 1984. “A New Proposal to Reform the Tax Treatment of Health Insurance.” Health Affairs 3 (1): 21–39.
Fang, H., M. P. Keane, and D. Silverman. 2008. “Sources of Advantageous Selection: Evidence from the Medigap Insurance Market.” Journal of Political Economy 116 (2): 303–50.
Kaiser Family Foundation and Health Research & Educational Trust. 2013. 2013 Employer Health Benefits Survey. Menlo Park, CA: Kaiser Family Foundation and Chicago: Health Research & Educational Trust.
Landon, B. E., A. M. Zaslavsky, R. C. Saunders, L. G. Pawlson, J. P. Newhouse, and J. Z. Ayanian. 2012. “Analysis of Medicare Advantage HMOs Compared with Traditional Medicare Shows Lower Use of Many Services During 2003–09.” Health Affairs 31 (12): 2609–17.
Liu, Y., and G. Z. Jin. 2013. Employer Contribution and Premium Growth in Health Insurance. National Bureau of Economic Research. Working Paper 19760. Published December. www.nber.org/papers/w19760.
Long, S. K., G. M. Kenney, S. Zuckerman, D. E. Goin, D. Wissoker, F. Blavin, L. J. Blumberg, L. Clemans-Cope, J. Holahan, and K. Hempstead. 2014. “The Health Reform Monitoring Survey: Addressing Data Gaps to Provide Timely Insights into the Affordable Care Act.” Health Affairs 33 (1): 161–67.
McKinsey & Company. 2013. “Hospital Networks: Configurations on the Ex- changes and Their Impact on Premiums.” Updated December 14. www. mckinsey.com/client_service/healthcare_systems_and_services/center_ for_us_health_system_reform.
Milliman. 2013. 2013 Milliman Medical Index. Published May. www.milliman.com/uploadedFiles/insight/Periodicals/mmi/pdfs/mmi-2013.pdf.
Peikes, D., A. Zutshi, J. L. Genevro, M. L. Parchman, and D. S. Meyers. 2012. “Early Evaluations of the Medical Home: Building on a Promising Start.” American Journal of Managed Care 18 (2): 105–16.
Reid, R. J., K. Coleman, E. A. Johnson, P. A. Fishman, C. Hsu, M. P. Soman, C. E. Trescott, M. Erikson, and E. B. Larson. 2010. “The Group Health Medical Home at Year Two: Cost Savings, Higher Patient Satisfaction, and Less Burn-out for Providers.” Health Affairs 29 (5): 835–43.
Reid, R. O., P. Deb, B. L. Howell, and W. H. Shrank. 2013. “Association Between Medicare Advantage Plan Star Ratings and Enrollment.” Journal of the Amer-ican Medical Association 309 (3): 267–74.
Spector, W. D., J. W. Cohen, and I. Pesis-Katz. 2004. “Home Care Before and After the Balanced Budget Act of 1997: Shifts in Financing and Services.” Geron-tologist 44 (1): 39–47.
02_Lee (2266) Chp 1-5.indd 55 7/16/14 9:00 AM
Copying and distribution of this PDF is prohibited without written permission. For permission, please contact Copyright Clearance Center at www.copyright.com