Embed Size (px)
Citation preview
An Overview of Refugee and Asylum Statistics in the
United States
Jason Schachter Chief, Net International Migration Branch, U.S. Census Bureau
UNECE/Eurostat Work Session on Migration Statistics 18-20 May, 2016, Geneva, Switzerland
This presentation is released to inform interested parties of ongoing research
and to encourage discussion of work in progress. Any views expressed are those of the authors and not necessarily those of the U.S. Census Bureau.
1

Introduction Current refugee crisis impacting Europe and
the rest of the world U.S. has increased annual quota from 70,000
in 2015 to 100,000 in 2017 U.S. Census Bureau does not collect data on
refugees, but rather data come from a number of administrative sources
2

Some questions How does the U.S. defines refugees/asylees for
legal and statistical purposes? What data sources are available? What is the relationship between refugees and
net international migration (NIM) estimates produced by the U.S. Census Bureau?
What are some possible strategies to use Census data to analyze the refugee population?
3
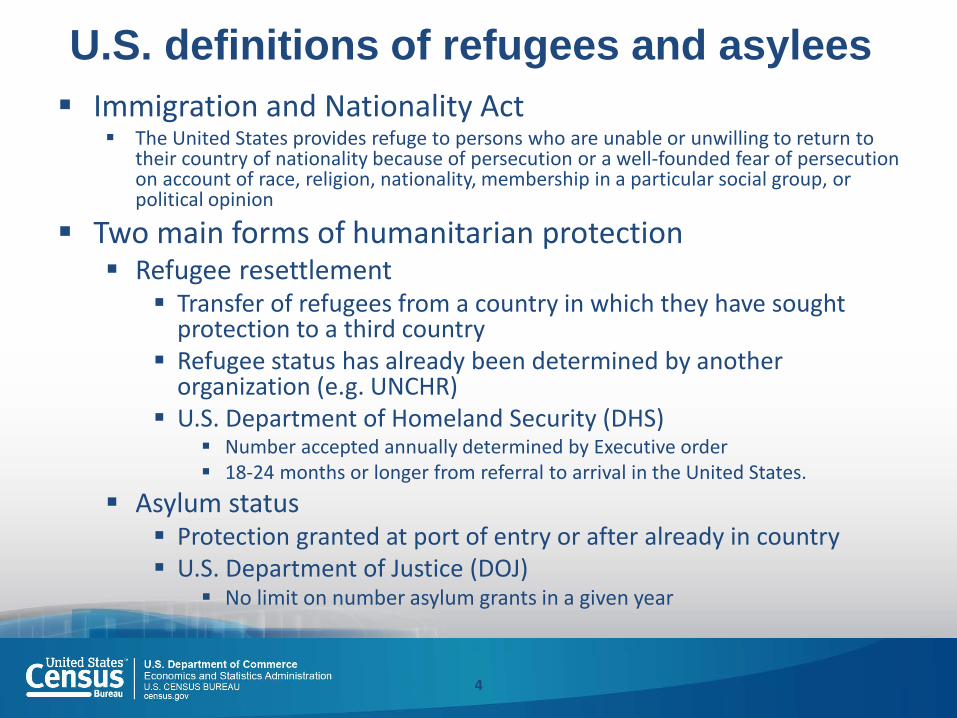
U.S. definitions of refugees and asylees Immigration and Nationality Act
The United States provides refuge to persons who are unable or unwilling to return to their country of nationality because of persecution or a well-founded fear of persecution on account of race, religion, nationality, membership in a particular social group, or political opinion
Two main forms of humanitarian protection Refugee resettlement
Transfer of refugees from a country in which they have sought protection to a third country
Refugee status has already been determined by another organization (e.g. UNCHR)
U.S. Department of Homeland Security (DHS) Number accepted annually determined by Executive order 18-24 months or longer from referral to arrival in the United States.
Asylum status Protection granted at port of entry or after already in country U.S. Department of Justice (DOJ)
No limit on number asylum grants in a given year
4
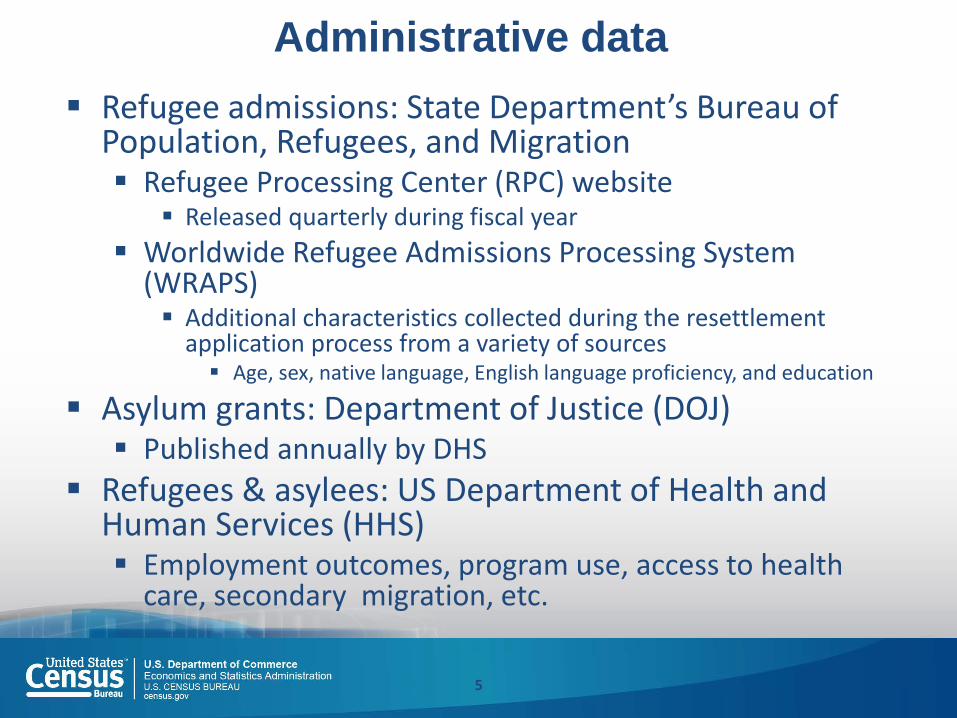
Administrative data Refugee admissions: State Department’s Bureau of
Population, Refugees, and Migration Refugee Processing Center (RPC) website
Released quarterly during fiscal year Worldwide Refugee Admissions Processing System
(WRAPS) Additional characteristics collected during the resettlement
application process from a variety of sources Age, sex, native language, English language proficiency, and education
Asylum grants: Department of Justice (DOJ) Published annually by DHS
Refugees & asylees: US Department of Health and Human Services (HHS) Employment outcomes, program use, access to health
care, secondary migration, etc.
5
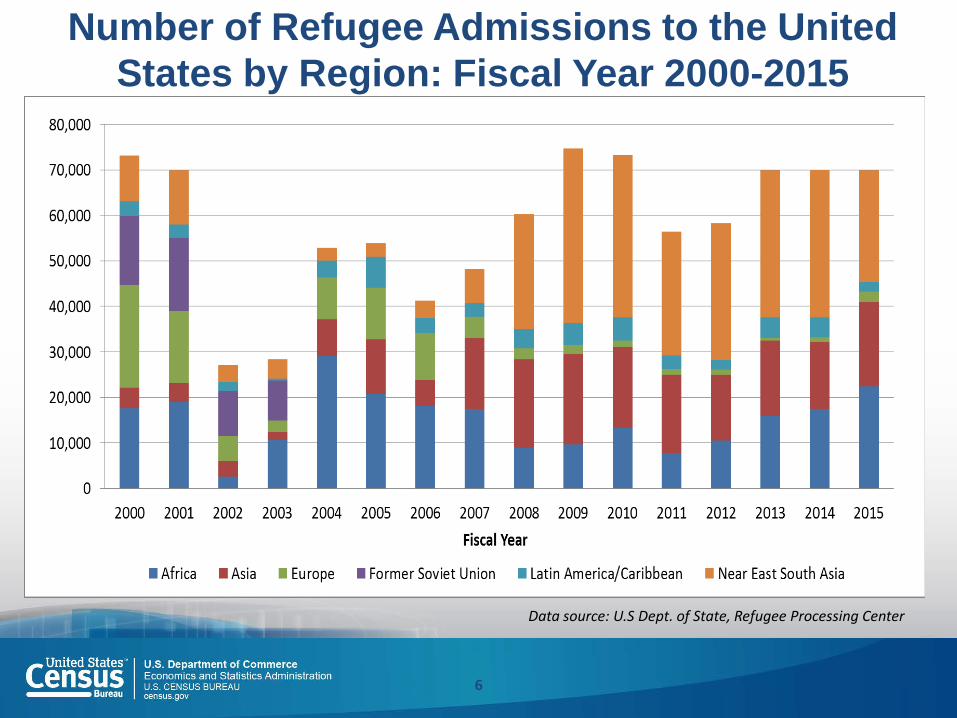
Number of Refugee Admissions to the United States by Region: Fiscal Year 2000-2015
6
Data source: U.S Dept. of State, Refugee Processing Center

Top Countries of Chargeability for Resettlement of Refugees in the United States: FY 2015
02468
101214161820
Thou
sand
s
7
Data source: U.S Dept. of State, Refugee Processing Center
8
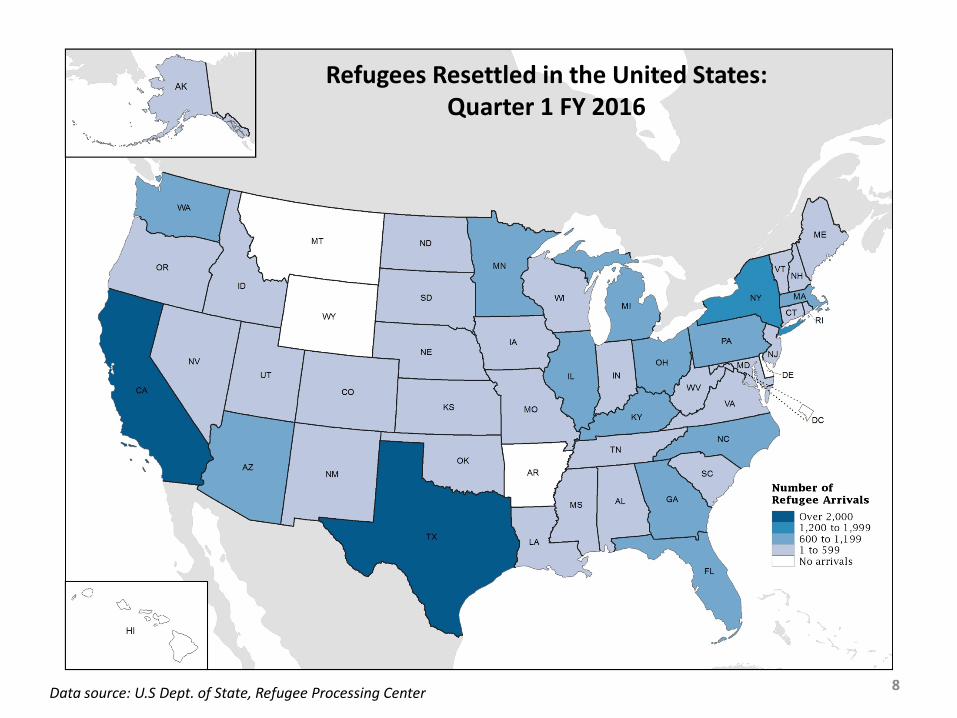
Refugees Resettled in the United States: Quarter 1 FY 2016
Data source: U.S Dept. of State, Refugee Processing Center
9
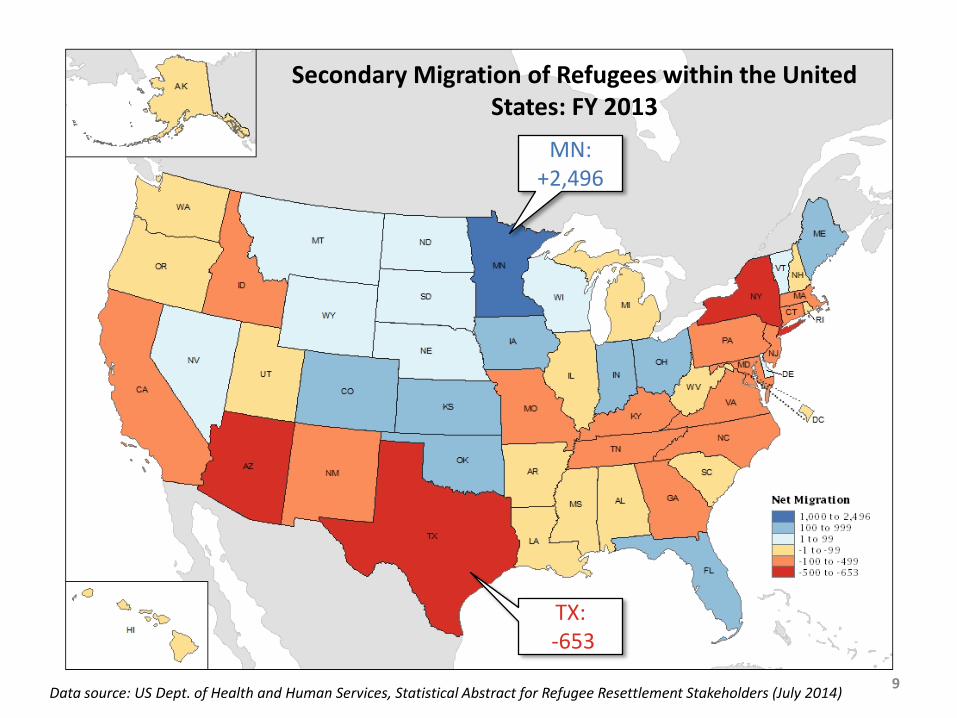
MN: +2,496
TX: -653
Data source: US Dept. of Health and Human Services, Statistical Abstract for Refugee Resettlement Stakeholders (July 2014)
Secondary Migration of Refugees within the United States: FY 2013

U.S. Census data on refugees The Census Bureau does not provide estimates of the
number refugees American Community Survey (ACS) Major source of immigration data
3.5 million households surveyed per year Country of birth, country of previous residence, year of entry, etc. 1-year (national) and 5-year files (subnational) to produce
estimates
Survey of Income and Program Participation (SIPP) Immigration status when moved to US (though refugee
status is not publically released)
10

Comparison of ACS and State Department data on refugee origin countries in a given year
ACS provides a “ceiling” of the maximum number of refugees from a country Fiscal year vs Calendar year (Year of Entry) Country of chargeability vs country of birth
2014 1-year ACS file Sample too small for specific refugee populations?
2010-2014 ACS 5-year file (smaller groups) “Year of entry” bias for earlier years in combined file Heaping around 2010
11

Refugees that entered the United States in 2013 from select Countries of Chargeability/Birth
Country
Refugee Processing
Center
1-Year ACS Percent
Difference Estimate Margin of Error
Iraq 19,488 18,870 5,203 -3.2 Burma 16,299 7,710 1,984 -52.7 Bhutan 9,134 4,830 1,739 -47.1 Somalia 7,608 5,185 2,278 -31.8 Cuba 4,205 44,950 5,965 967.9 Iran 2,578 12,265 2,525 375.7 Dem. Rep. Congo 2,563 1,615 1,281 -37.1 Sudan 2,160 1,665 782 -23.0 Eritrea 1,824 1,815 1,140 -0.4 Ethiopia 765 11,340 2,784 1,382.2
12
Data source: 2014 ACS 1-year file; U.S. Dept. of State, Refugee Processing Center FY 2013

Refugees that entered the United States in 2009 from select Countries of Chargeability/Birth
Country
Refugee Processing
Center
5-Year ACS Percent
Difference Estimate Margin of Error
Iraq 18,838 21,760 2,146 15.5 Burma 18,202 12,470 1,186 -31.5 Bhutan 13,452 11,805 1,404 -12.2 Iran 5,381 12,930 1,362 140.3 Cuba 4,800 32,700 2,396 581.3 Somalia 4,189 3,215 687 -23.2 Eritrea 1,571 1,600 462 1.9 Vietnam 1,538 24,830 1,761 1,514.4 Dem. Rep. Congo 1,135 1,500 402 32.1
13
Data source: 2010-2014 ACS 5-year file; U.S. Dept. of State, Refugee Processing Center FY 2009
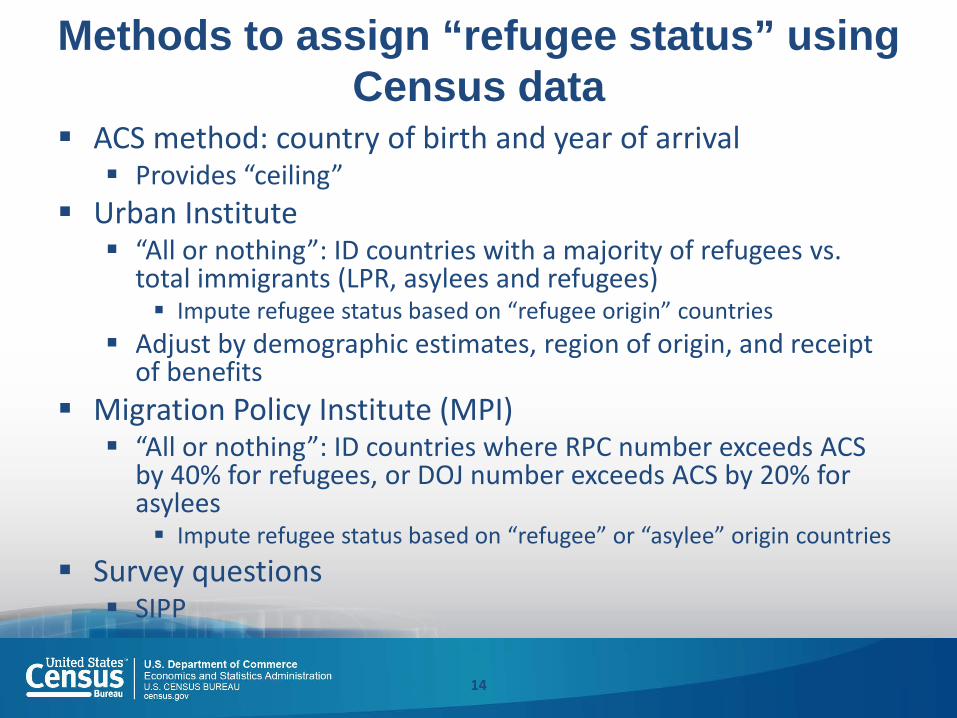
Methods to assign “refugee status” using Census data
ACS method: country of birth and year of arrival Provides “ceiling”
Urban Institute “All or nothing”: ID countries with a majority of refugees vs.
total immigrants (LPR, asylees and refugees) Impute refugee status based on “refugee origin” countries
Adjust by demographic estimates, region of origin, and receipt of benefits
Migration Policy Institute (MPI) “All or nothing”: ID countries where RPC number exceeds ACS
by 40% for refugees, or DOJ number exceeds ACS by 20% for asylees Impute refugee status based on “refugee” or “asylee” origin countries
Survey questions SIPP
14

SIPP Longitudinal survey of 50,000 households New panels normally every 2-5 years Most recent 2014 (2008 previous)
Includes “Migration History” questions “When moved to United States to live, what was
immigration status? “Granted refugee status or granted asylum”
Can be used to follow refugees over time
15
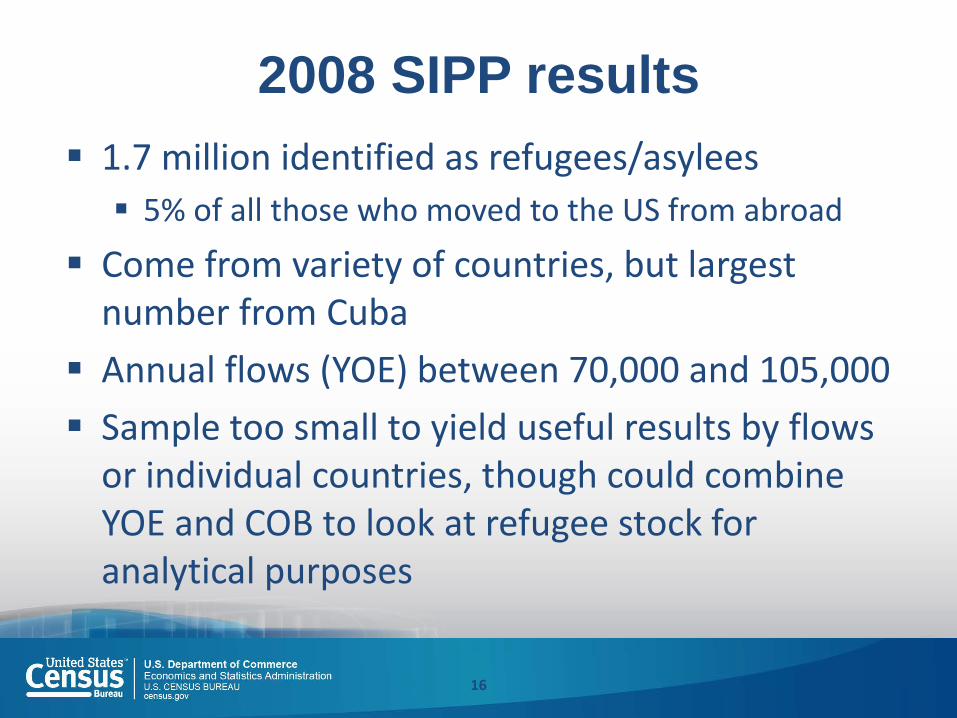
2008 SIPP results 1.7 million identified as refugees/asylees 5% of all those who moved to the US from abroad
Come from variety of countries, but largest number from Cuba
Annual flows (YOE) between 70,000 and 105,000 Sample too small to yield useful results by flows
or individual countries, though could combine YOE and COB to look at refugee stock for analytical purposes
16
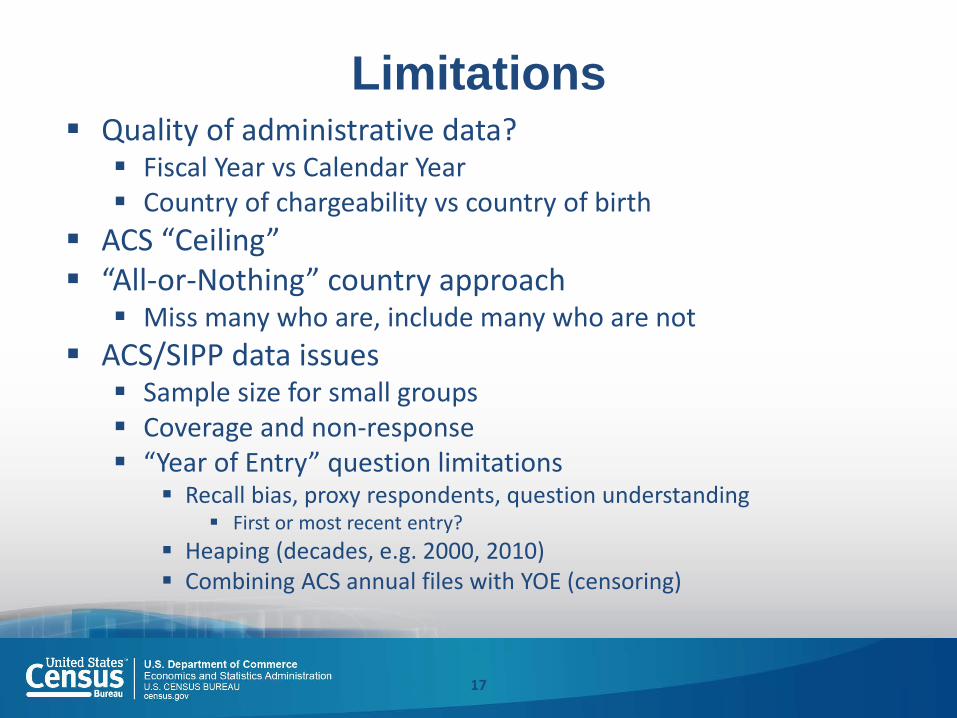
Limitations Quality of administrative data? Fiscal Year vs Calendar Year Country of chargeability vs country of birth
ACS “Ceiling” “All-or-Nothing” country approach Miss many who are, include many who are not
ACS/SIPP data issues Sample size for small groups Coverage and non-response “Year of Entry” question limitations
Recall bias, proxy respondents, question understanding First or most recent entry?
Heaping (decades, e.g. 2000, 2010) Combining ACS annual files with YOE (censoring)
17

Relationship between U.S. Census Bureau population estimates and refugees
Produce annual subnational population estimates, for which the NIM component is an important factor for growth or decline
Occasional requests to adjust population estimates by refugee component (e.g. population count challenges)
NIM estimates are primarily derived from ACS data Refugees are implicitly included in these estimates Currently not possible to separate refugees from NIM
component
18

Possible methods to measure refugees with U.S. Census Bureau data
Add survey questions for direct measurement “Reason for Move” or “Immigration Status”
Link RPC administrative data to Census survey data Refugees eligible to apply for SSN upon arrival and
begin work
Modeling through RPC administrative data Use characteristics of refugees (age, sex, country of
origin) to impute/assign refugee status to ACS data
19

Discussion Need to improve measurement of refugees and asylum
seekers: characteristics and long-term integration UN Working Group developing handbook on refugee and IDP statistics
U.S. Census Bureau investigating ways to disaggregate refugees from our estimates
Statistics derived from administrative data collected by different federal agencies
Measure refugees without double counting them Comparability issues between administrative refugee and U.S. Census
data Variations in year, countries of origin, undercoverage for some specific
refugee populations in the ACS, etc.
Without a national population register, no simple way to identify and link individuals between data sources Assign refugee status to individuals rather than to all migrants coming from
specific countries Potential to link administrative data to individual ACS records or use detailed
characteristics from administrative data to impute refugee status on ACS records Methods need more development before future implementation
20

Acknowledgements Eric Jensen, Population Evaluation, Analysis,
and Projections Branch Anthony Knapp, Net International Migration
Branch Chris Galvan, Population Estimates Branch
21
![Configuring the Quota Manager - cisco.com€¦ · † Configuring the Quota Manager—Example, page 3-9 Configuring the Quota Profile Settings The [Quota Profile.QUOTA-PROFILE-NAME]](https://img.pdfslide.us/doc/110x75/5f0783767e708231d41d5b40/configuring-the-quota-manager-ciscocom-a-configuring-the-quota-manageraexample.jpg)