Embed Size (px)
Citation preview

An Overview of New Hampshire Hospital Financial Measures Prepared by the New Hampshire Institute for Health Policy and Practice for the New Hampshire Department of Insurance Study Authors: Patrick Miller and Amy Philbrick Contact Information: Amy Philbrick, [email protected] or Leslie Ludtke, [email protected] February 13, 2006

An Overview of New Hampshire Hospital Financial Measures
2
Table of Contents
1. Introduction Page 2 2. Discussion of Data Sources Page 3 3. Setting the Stage Page 4 4. Self Pay Payer Type Page 6 5. Hospital Revenues Page 7 6. Hospital Retail Charges vs. Collected Revenues Page 10 7. Bad Debt Page 13 8. Charity Care Page 15 9. Gross Total Margin Page 22 10. General and Administrative Expenses Page 28 11. Appendices
A. Research Summary of State and Federal Actions re: Uninsured Discounts Page 29 B. Union Leader Article, Some hospitals have already made changes, 11/27/2005 Page 30 C. Analysis Methodology Page 32 D. List of Hospital Financials Reviewed Page 36 E. Study Authors Page 39
1. Introduction This report has been prepared by the New Hampshire Institute of Health Policy and Practice (NHIHPP) for the New Hampshire Insurance Department’s (NHDOI) Advisory Group. The Advisory Group has been asked to focus on several areas:
1. market pricing of healthcare services that resulted in the development of the HealthCost web site (www.nhhealthcost.org) 2. uninsured/underinsured/self-pay category of patients seeking services, which is the focus of this report.
This report was developed to paint a financial portrait of New Hampshire’s hospitals, and to lay the groundwork for additional modifications to the NH Health Cost web site (www.nhhealthcost.org). This report provides information regarding hospital revenues, overall discounts, levels of charity care, levels of bad debt, gross total margins, and the ratio of selling and administrative expenses to health care services for New Hampshire’s non-profit hospitals.

An Overview of New Hampshire Hospital Financial Measures
3
2. Discussion of Data Sources and Methodologies Multiple data sets were examined for this report. The following list contains the data sets, a description of what was examined, and the order in which they were examined:
1. 2002 and 2003 IRS 990 tax returns. For 2002 and 2003, 23 and 16 hospital returns were examined, respectively. Data was captured regarding: revenues, expenses, bad debt, charity care, and other financial measures. Not all returns were available for all years/hospitals, and the data had many inconsistencies due to different methods of reporting by the hospitals.
2. 2002, 2003, and 2004 State of New Hampshire Charitable Trust Division Community Benefit Annual Reports. A total of 53 reports were examined for 21 hospitals across the three years. There were eight reports attached to the tax returns, although they are not required as part of the 990 submissions. The remaining 45 reports were reviewed in the office of the New Hampshire Attorney General. Key data points from each report were captured into a spreadsheet. Not all reports were available for all hospitals, and inconsistencies in hospital reporting made valid comparisons across hospitals difficult.
3. 2002 and 2003 inpatient and outpatient hospital claims discharge data sets. Data sets were provided by NH DHHS. The data sets were specifically used to examine the percent of charges by payer type1, and to calculate the number of unique patients treated by the hospitals in 2002 and 2003.
4. 2003 and 2004 audited hospital financials. Audited financials for 2003 and 2004 were reviewed for 23 hospitals. Data for 2002 was found in the 2003 financials. For Memorial Hospital the 2003 financials were for the hospital only and the 2004 financials for the hospital and subsidiaries. The 2003 financials for St. Joseph Hospital’s parent company were replaced in 2004 with the consolidated financials for Covenant Health Systems, Inc. financials, thus not all 2004 numbers were available. Covenant is a conglomeration of hospitals and healthcare entities. For Wentworth-Douglass Hospital consolidated versus hospital-only financials were examined.
After analysis of each of the data sets, it was determined that only the claims discharge data sets and the audited hospital financials would be used for the final report analysis. The available data sets do not provide paid claims data from which to calculate the actual hospital discounts by payer and by payer type. From experience, it is known that hospitals in New Hampshire have varying financial contractual arrangements with the primary insurance carriers. These contractual arrangements include per diem, capitation, fee schedules, and discount from charges (retail) arrangements2. The hospital discharge data sets provide charges (retail), and the audited financials provide the overall discount amount, not generally separated by payer type. Appendix C contains all of the methodologies used for all of the calculations in this report. 1 Payer Type = the different types of payments a hospital may receive. Typically includes: Government programs (Medicare, Medicaid, etc.), private insurance (HMOs, indemnity, etc.), the uninsured or self-pay, and workers compensation. 2 Per Diem = a fixed daily rate for a specific procedure or set of procedures; Capitation = a fixed fee per patient paid to a hospital by an insurance carrier regardless of the amount of services rendered – it is a risk taking arrangement; Fee Schedules = a fixed rate for a specific procedure or set of procedures; Discount from Charges = a discount amount from the retail charge rate.

An Overview of New Hampshire Hospital Financial Measures
4
3. Setting the Stage In 2005, PricewaterhouseCoopers’ (PWC) Health Research Institute authored a report entitled “Acts of charity; Charity care strategies
for hospitals in a changing landscape”. Their data illustrated the plight that many uninsured, non-indigent patients face. It is not uncommon for the uninsured to pay more for services than privately insured patients and Medicare patients. The chart below was created for illustrative purposes to demonstrate the assumed pricing structure in New Hampshire. It shows that while the average charges for an appendectomy are $18,114, that with either a 30% or 50% discount from charges the uninsured would pay more ($12,680) for this service than do privately insured patients ($8,151) or Medicare patients ($4,891).
DRG 166 Appendectomy w/out Complications
ILLUSTRATIVE ONLY
$12,680
$9,057 $8,151
$4,891
$18,114
02,0004,0006,0008,000
10,00012,00014,00016,00018,00020,000
Average
Charges (List
Price) (2003
Discharge
Data Set)
Uninsured
Non-Indigent
(assumed
discount)-
30%
Uninsured
Indigent
(assumed
discount)-
50%
Private
Insurance
(assumed
discount)-
55%
Medicare
(source:
PWC) - 73%
An Overview of New Hampshire Hospital Financial Measures
5
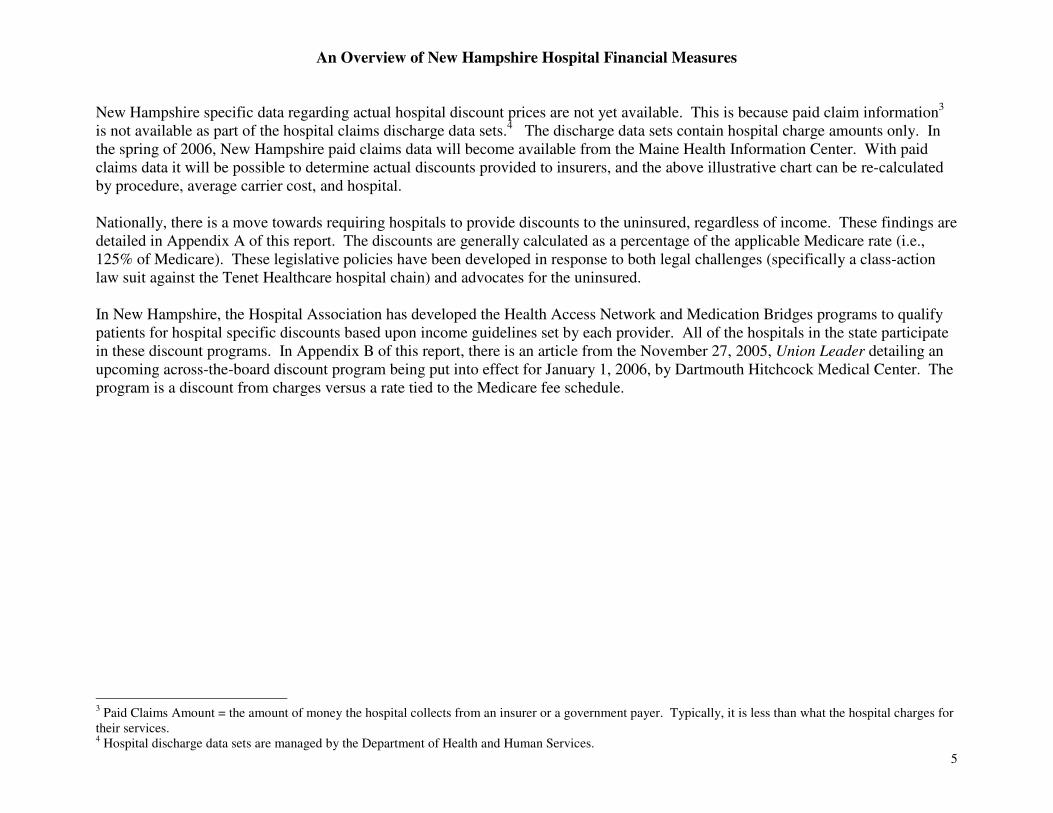
New Hampshire specific data regarding actual hospital discount prices are not yet available. This is because paid claim information3 is not available as part of the hospital claims discharge data sets.4 The discharge data sets contain hospital charge amounts only. In the spring of 2006, New Hampshire paid claims data will become available from the Maine Health Information Center. With paid claims data it will be possible to determine actual discounts provided to insurers, and the above illustrative chart can be re-calculated by procedure, average carrier cost, and hospital. Nationally, there is a move towards requiring hospitals to provide discounts to the uninsured, regardless of income. These findings are detailed in Appendix A of this report. The discounts are generally calculated as a percentage of the applicable Medicare rate (i.e., 125% of Medicare). These legislative policies have been developed in response to both legal challenges (specifically a class-action law suit against the Tenet Healthcare hospital chain) and advocates for the uninsured. In New Hampshire, the Hospital Association has developed the Health Access Network and Medication Bridges programs to qualify patients for hospital specific discounts based upon income guidelines set by each provider. All of the hospitals in the state participate in these discount programs. In Appendix B of this report, there is an article from the November 27, 2005, Union Leader detailing an upcoming across-the-board discount program being put into effect for January 1, 2006, by Dartmouth Hitchcock Medical Center. The program is a discount from charges versus a rate tied to the Medicare fee schedule.
3 Paid Claims Amount = the amount of money the hospital collects from an insurer or a government payer. Typically, it is less than what the hospital charges for their services. 4 Hospital discharge data sets are managed by the Department of Health and Human Services.

An Overview of New Hampshire Hospital Financial Measures
6
4. Self Pay Payer Type The following bar graph depicts the percentage of total hospital5 charges (retail charges) by payer type, and it is derived from the inpatient and outpatient data sets. The self-pay payer type accounted for 5.5% of the total charges in 2002 (orange bar) and 5.7% in 2003 (yellow bar). For the purposes of this report, the self-pay payer type is equivalent to the uninsured population.
Hospital Charges by Payer Type 2002 and 2003
42.7% 42.0%
6.2%
1.6% 1.3% 0.5% 0.2%
5.5%0.2%0.5%1.4%1.5%
5.7%6.5%
42.1% 42.2%
0.0%
5.0%
10.0%
15.0%
20.0%
25.0%
30.0%
35.0%
40.0%
45.0%
Private
Insura
nce
Medic
are
Medic
aid
Self
Pay
Work
ers
Com
p
Oth
er
Govern
ment
Medic
aid
Managed
Care
Medic
are
Managed
Care
2002 2003
5 Includes all hospitals in New Hampshire, including Parkland Medical Center and Portsmouth Regional Hospital (two, for-profit hospitals). These two hospitals are not included in the remainder of the analyses in this document.

An Overview of New Hampshire Hospital Financial Measures
7
5. Hospital Revenues Total gross patient services revenues6 (retail charges) for New Hampshire hospitals7 for 2002, 2003, and 2004, were $3.1, $3.6, and $3.9 billion, respectively. For the same years, the total net patient services revenues8 equaled $1.9, $2.1, and $2.2 billion, respectively. The chart below compares the unweighted average gross patient service revenues to the unweighted average net patient services revenues for all three years. There is a consistent upward trend for both.
Unweighted Average Gross Patient Service Revenues vs. Net Patient Services
Revenues (2002-04)
$147.1$169.9
$195.3
$88.2 $98.7 $110.1
$0
$50
$100
$150
$200
$250
2002 2003 2004
Mil
lio
ns
Gross Patient Service Revenues Net Patient Services Revenue
6 Gross Patient Services Revenues = Hospital retail charges for services rendered. 7 Excludes Frisbie and Wentworth-Douglas Hospitals as they did not report their gross and operating revenues. 8 Net Patient Services Revenues = Gross Patient Services Revenues minus Contractual Allowances minus Provision for Charity Care
An Overview of New Hampshire Hospital Financial Measures
8
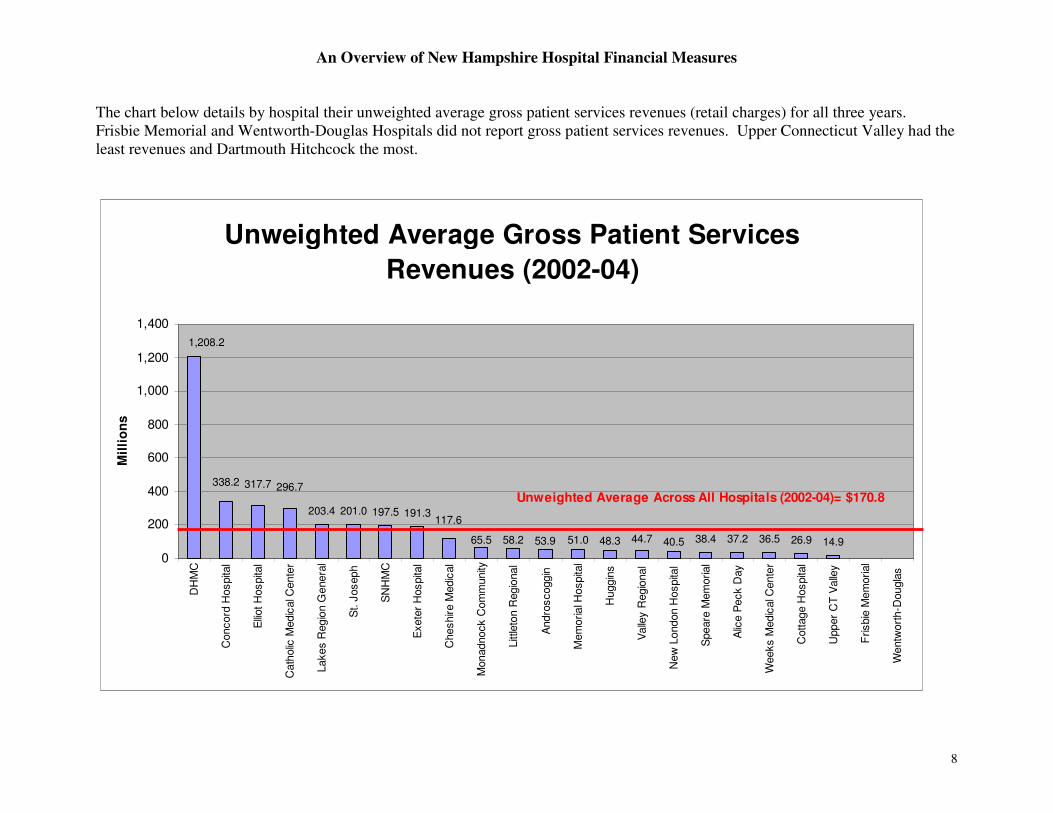
The chart below details by hospital their unweighted average gross patient services revenues (retail charges) for all three years. Frisbie Memorial and Wentworth-Douglas Hospitals did not report gross patient services revenues. Upper Connecticut Valley had the least revenues and Dartmouth Hitchcock the most.
Unweighted Average Gross Patient Services
Revenues (2002-04)
203.4 201.0 197.5 191.3
38.4 37.2 36.5 26.9 14.9
338.2 317.7 296.7
117.6
40.544.748.351.053.958.265.5
1,208.2
0
200
400
600
800
1,000
1,200
1,400
DH
MC
Concord
Hospita
l
Elliot H
ospita
l
Cath
olic
Medic
al C
ente
r
Lakes R
egio
n G
enera
l
St. J
oseph
SN
HM
C
Exete
r H
ospita
l
Cheshire M
edic
al
Monadnock C
om
munity
Litt
leto
n R
egio
nal
Andro
scoggin
Mem
orial H
ospita
l
Huggin
s
Valle
y R
egio
nal
New
London H
ospita
l
Speare
Mem
orial
Alic
e P
eck D
ay
Weeks M
edic
al C
ente
r
Cottage H
ospita
l
Upper
CT
Valle
y
Frisbie
Mem
orial
Wentw
ort
h-D
ougla
s
Mil
lio
ns
Unweighted Average Across All Hospitals (2002-04)= $170.8

An Overview of New Hampshire Hospital Financial Measures
9
The chart below details by hospital their unweighted average net revenues for all three years. Frisbie Memorial and Wentworth-Douglas Hospitals did not report gross patient services revenues. There are some differences in the descending order of the hospitals from the prior chart. These are attributed to the hospitals marking up their charges by differing amounts. The next section of the report details hospital markup in more detail.
Unweighted Average Net Patient Services
Revenues (2002-04)
688.5
200.3 187.5152.2
122.2 115.2 111.4 103.865.0
9.718.523.524.626.427.427.529.032.533.438.240.2
0
100
200
300
400
500
600
700
800
DH
MC
Concord
Hospita
l
Elliot H
ospita
l
Cath
olic
Medic
al
Cente
r
Exete
r H
ospita
l
SN
HM
C
Lakes R
egio
n
Genera
l
St. J
oseph
Cheshire M
edic
al
Monadnock
Com
munity
Litt
leto
n R
egio
nal
Mem
orial H
ospita
l
Andro
scoggin
Valle
y R
egio
nal
Huggin
s
New
London
Hospita
l
Alic
e P
eck D
ay
Speare
Mem
orial
Weeks M
edic
al
Cente
r
Cottage H
ospita
l
Upper
CT
Valle
y
Frisbie
Mem
orial
Wentw
ort
h-D
ougla
s
Millio
ns
Unweighted Average Across All Hospitals (2002-04)= $98.9
An Overview of New Hampshire Hospital Financial Measures
10
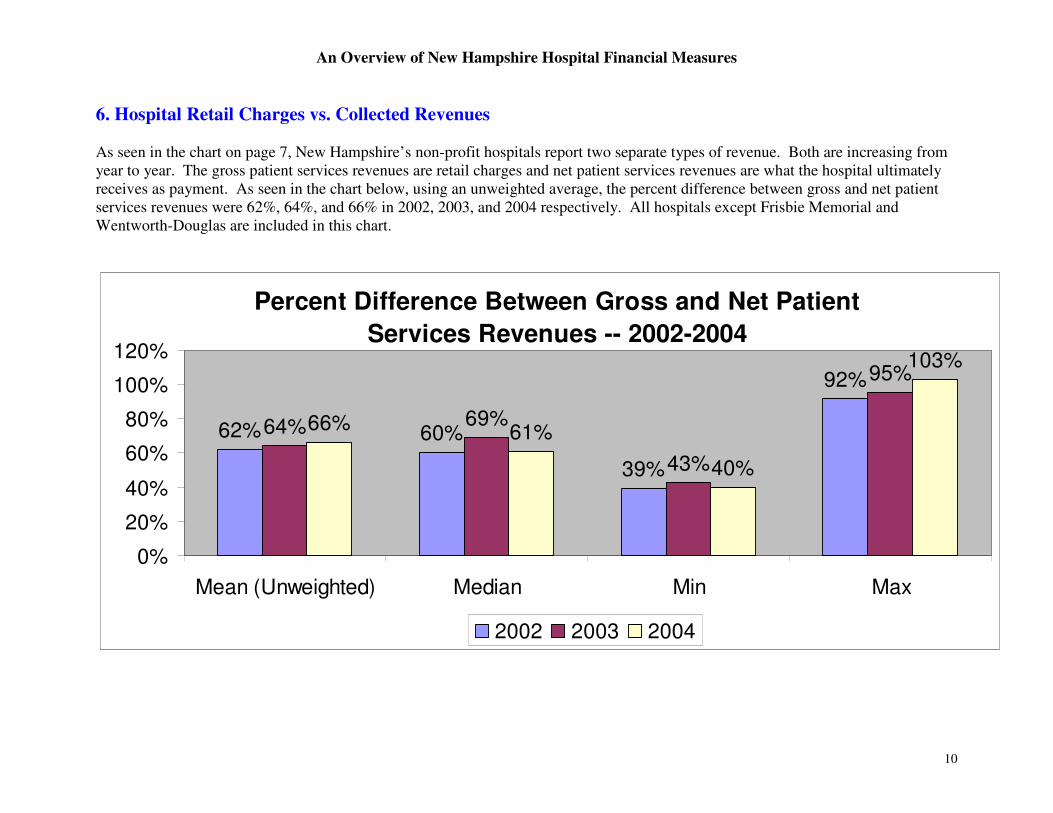
6. Hospital Retail Charges vs. Collected Revenues As seen in the chart on page 7, New Hampshire’s non-profit hospitals report two separate types of revenue. Both are increasing from year to year. The gross patient services revenues are retail charges and net patient services revenues are what the hospital ultimately receives as payment. As seen in the chart below, using an unweighted average, the percent difference between gross and net patient services revenues were 62%, 64%, and 66% in 2002, 2003, and 2004 respectively. All hospitals except Frisbie Memorial and Wentworth-Douglas are included in this chart.
Percent Difference Between Gross and Net Patient
Services Revenues -- 2002-2004
62% 60%
39%
92%
64% 69%
43%
95%
66% 61%
40%
103%
0%
20%
40%
60%
80%
100%
120%
Mean (Unweighted) Median Min Max
2002 2003 2004
An Overview of New Hampshire Hospital Financial Measures
11
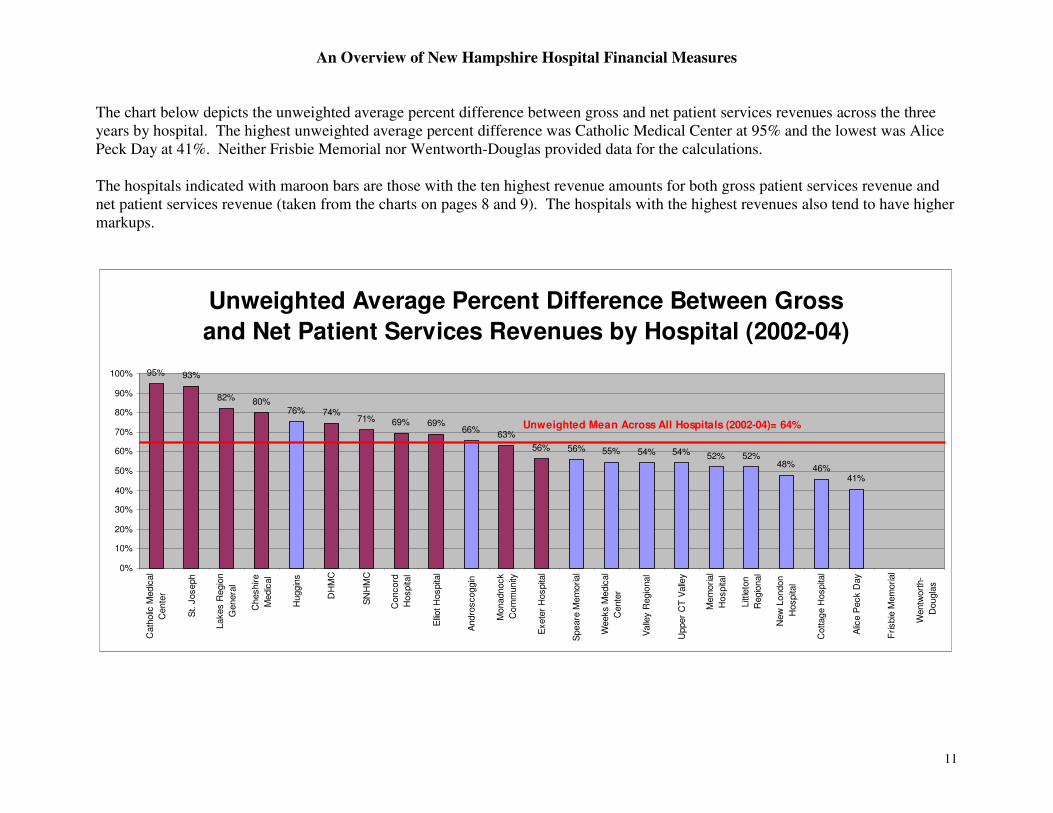
The chart below depicts the unweighted average percent difference between gross and net patient services revenues across the three years by hospital. The highest unweighted average percent difference was Catholic Medical Center at 95% and the lowest was Alice Peck Day at 41%. Neither Frisbie Memorial nor Wentworth-Douglas provided data for the calculations. The hospitals indicated with maroon bars are those with the ten highest revenue amounts for both gross patient services revenue and net patient services revenue (taken from the charts on pages 8 and 9). The hospitals with the highest revenues also tend to have higher markups.
Unweighted Average Percent Difference Between Gross
and Net Patient Services Revenues by Hospital (2002-04)
95% 93%
82% 80%76% 74%
71% 69% 69%66%
63%
56% 56% 55% 54% 54% 52% 52%48% 46%
41%
0%
10%
20%
30%
40%
50%
60%
70%
80%
90%
100%
Cath
olic
Medic
al
Cente
r
St. J
oseph
Lakes R
egio
n
Genera
l
Cheshire
Medic
al
Huggin
s
DH
MC
SN
HM
C
Concord
Hospita
l
Elliot H
ospita
l
Andro
scoggin
Monadnock
Com
munity
Exete
r H
ospita
l
Speare
Mem
orial
Weeks M
edic
al
Cente
r
Valle
y R
egio
nal
Upper
CT
Valle
y
Mem
orial
Hospita
l
Litt
leto
n
Regio
nal
New
London
Hospita
l
Cottag
e H
ospita
l
Alic
e P
eck D
ay
Frisbie
Mem
orial
Wentw
ort
h-
Dougla
s
Unweighted Mean Across All Hospitals (2002-04)= 64%
An Overview of New Hampshire Hospital Financial Measures
12
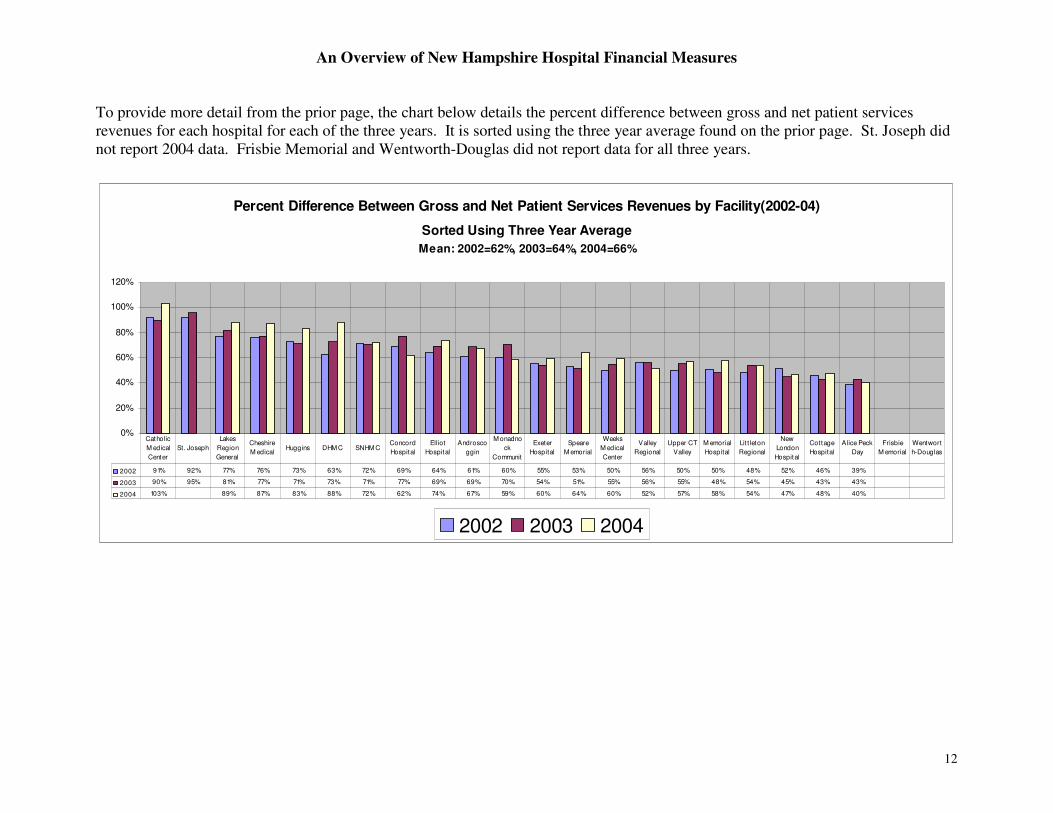
To provide more detail from the prior page, the chart below details the percent difference between gross and net patient services revenues for each hospital for each of the three years. It is sorted using the three year average found on the prior page. St. Joseph did not report 2004 data. Frisbie Memorial and Wentworth-Douglas did not report data for all three years.
Percent Difference Between Gross and Net Patient Services Revenues by Facility(2002-04)
Sorted Using Three Year Average
Mean: 2002=62%, 2003=64%, 2004=66%
0%
20%
40%
60%
80%
100%
120%
2002 2003 2004
2002 91% 92% 77% 76% 73% 63% 72% 69% 64% 61% 60% 55% 53% 50% 56% 50% 50% 48% 52% 46% 39%
2003 90% 95% 81% 77% 71% 73% 71% 77% 69% 69% 70% 54% 51% 55% 56% 55% 48% 54% 45% 43% 43%
2004 103% 89% 87% 83% 88% 72% 62% 74% 67% 59% 60% 64% 60% 52% 57% 58% 54% 47% 48% 40%
Catholic
M edical
Center
St. Joseph
Lakes
Region
General
Cheshire
M edicalHuggins DHM C SNHM C
Concord
Hospital
Elliot
Hospital
Androsco
ggin
M onadno
ck
Communit
Exeter
Hospital
Speare
M emorial
Weeks
M edical
Center
Valley
Regional
Upper CT
Valley
M emorial
Hospital
Lit t leton
Regional
New
London
Hospital
Cottage
Hospital
Alice Peck
Day
Frisbie
M emorial
Wentwort
h-Douglas

An Overview of New Hampshire Hospital Financial Measures
13
7. Bad Debt The chart below shows the unweighted average percentage of bad debt to gross patient services revenues for each hospital for all three years combined. Neither Frisbie Memorial nor Wentworth-Douglas provided gross patient services revenue data for the calculations. The hospitals indicated with maroon bars are those with the ten highest revenue amounts for both gross patient services revenue and net patient services revenue (taken from the charts on pages 8 and 9).
Unweighted Average Bad Debt to Gross Patient Services Revenue by Hospital (2002-04)
6.6%6.3%
5.3%
4.8% 4.7%4.5%
4.3%
2.9%
2.2%2.0%
1.4%
3.8% 3.7%3.4%
3.5%
3.0%3.1%3.1%
3.2%
3.0%
3.3%
0.0%
1.0%
2.0%
3.0%
4.0%
5.0%
6.0%
7.0%
8.0%
Up
pe
r C
T V
alle
y
SN
HM
C
Va
lle
y R
eg
ion
al
Co
nco
rd H
osp
ita
l
Sp
ea
re M
em
ori
al
Ellio
t H
osp
ita
l
La
ke
s R
eg
ion
Ge
ne
ral
Me
mo
ria
l H
osp
ita
l
Co
tta
ge
Ho
sp
ita
l
Exe
ter
Ho
sp
ita
l
Hu
gg
ins
An
dro
sco
gg
in
Ch
esh
ire
Me
dic
al
We
eks M
ed
ica
l
Ce
nte
r
Ca
tho
lic M
ed
ica
l
Ce
nte
r
St. J
ose
ph
Mo
na
dn
ock
Co
mm
un
ity
Little
ton
Re
gio
na
l
Ne
w L
on
do
n
Ho
sp
ita
l
DH
MC
Alice
Pe
ck D
ay
Fri
sb
ie M
em
ori
al
We
ntw
ort
h-
Do
ug
las
Unweighted Mean Across All Hospitals (2002-04)= 3.7%

An Overview of New Hampshire Hospital Financial Measures
14
To provide more detail from the prior page, the following chart shows the percentage of bad debt to gross patient services revenue by hospital for each of the three years. It is sorted using the three year average found on the prior page.
Bad Debt to Gross Patient Services Revenue by Hospital
Sorted Using Three Year Average
Mean: 2002=3.7%, 2003=3.6%, 2004=3.8%
0.0%
1.0%
2.0%
3.0%
4.0%
5.0%
6.0%
7.0%
8.0%
2002 5.8% 4.8% 4.9% 5.5% 4.4% 3.8% 3.9% 3.8% 3.9% 3.6% 2.7% 3.4% 3.6% 3.2% 3.3% 3.5% 2.8% 4.5% 2.9% 2.0% 1.4%
2003 7.0% 7.0% 4.5% 4.2% 4.6% 5.0% 4.3% 3.2% 3.5% 3.5% 3.6% 3.3% 3.1% 3.2% 3.0% 2.5% 3.3% 1.7% 2.0% 2.0% 1.6%
2004 7.1% 7.1% 6.5% 4.7% 5.1% 4.7% 4.6% 4.3% 3.6% 3.3% 3.9% 3.1% 2.7% 3.0% 2.8% 2.9% 2.5% 1.7% 2.1% 1.3%
Upper
CT
Valley
SNHMCValley
Regional
Concord
Hospital
Speare
Memorial
Elliot
Hospital
Lakes
Region
General
Memorial
Hospital
Cottage
Hospital
Exeter
HospitalHuggins
Androsc
oggin
Cheshire
Medical
Weeks
Medical
Center
Catholic
Medical
Center
St.
Joseph
Monadno
ck
Communi
Littleton
Regional
New
London
Hospital
DHMC
Alice
Peck
Day
Frisbie
Memorial
Wentw o
rth-
Douglas

An Overview of New Hampshire Hospital Financial Measures
15
The bad debt figures in the hospital financials are reported in terms of charges versus actual costs associated with bad debt. Due to this, it was necessary to adjust the data in order to provide a truer picture of the percentage of bad debt services delivered. To adjust the data, the net patient services revenues were divided by the gross patient services revenues. This ratio was then multiplied by the bad debt charges reported by the hospital. As shown in the below chart, the adjusted data of the unweighted average ratio of bad debt to gross patient services is less than the unadjusted data.
Unweighted Average Bad Debt and Adjusted Bad Debt as Percentage of
Gross Patient Services Revenues
2002-2004
3.7% 3.6% 3.8%
2.3% 2.2% 2.3%
0.0%
1.0%
2.0%
3.0%
4.0%
5.0%
2002 2003 2004
Bad Debt to Gross Patient Services Revenues Adjusted Bad Debt to Gross Patient Services Revenues

An Overview of New Hampshire Hospital Financial Measures
16
Ratio of Adjusted Bad Debt to Gross Patient Services Revenues 2002-04
Sorted Using Three Year Average
Mean 2002=2.3%, 2003=2.2%, 2004=2.3%
0.0%
0.5%
1.0%
1.5%
2.0%
2.5%
3.0%
3.5%
4.0%
4.5%
5.0%
2002 3.8% 2.8% 3.1% 2.9% 3.2% 2.3% 2.6% 2.5% 2.2% 2.3% 2.1% 2.1% 3.1% 1.6% 1.8% 2.1% 1.7% 1.8% 1.9% 1.2% 1.0%
2003 4.5% 4.1% 2.9% 3.0% 2.4% 2.9% 2.5% 2.2% 2.4% 2.2% 2.1% 2.0% 1.1% 2.1% 1.9% 1.8% 1.6% 1.3% 1.4% 1.2% 1.1%
2004 4.5% 4.1% 4.3% 3.1% 2.9% 2.7% 2.4% 2.7% 2.4% 2.1% 1.9% 1.9% 1.6% 2.1% 1.8% 1.5% 1.4% 1.2% 1.1% 0.9%
Upper
CT
Valley
SNHM
C
Valley
Region
al
Spear
e
Memori
Conco
rd
Hospit
Elliot
Hospit
al
Cottag
e
Hospit
Memori
al
Hospit
Lakes
Region
Gener
Exeter
Hospit
al
Weeks
Medica
l
Andro
scoggi
n
Littleto
n
Region
Huggin
s
Monad
nock
Comm
Cheshi
re
Medica
Catholi
c
Medica
St.
Josep
h
New
Londo
n
DHMC
Alice
Peck
Day
Frisbie
Memori
al
Went
w orth-
Dougla

An Overview of New Hampshire Hospital Financial Measures
17
8. Charity Care9
All of the hospitals examined reported the amount of charity care10 provided in terms of charges to render services versus cost11. The chart below depicts the unweighted average ratio of charity care charges to gross patient services revenues (retail charges).
Unweighted Average Ratio of Charity Charges to Gross
Patient Services Revenues
(2002-04)
1.9%
2.1%2.1%
1.00%
1.20%
1.40%
1.60%
1.80%
2.00%
2.20%
2002 2003 2004
9 Community benefits reporting is different from charity care. Several of the audited financial statements reviewed provided high level community benefits information. 10 Charity Care = Services for which hospitals neither expected to receive nor did receive payment for services rendered. 11 St. Josephs Hospital charity care charges data for 2004 was not reported.

An Overview of New Hampshire Hospital Financial Measures
18
All 23 of the hospitals in this report stated their total charity charges for each of the three years, with the exception of St. Joseph Hospital that did not report 2004 charity care charges. In contrast, traditional charity care costs were reported by 13 of the 23 hospitals (57%). The following 10 hospitals did not report charity care costs: Catholic Medical Center, Cheshire, Concord, Elliot, Exeter, LRGH, Memorial Hospital, Southern New Hampshire Medical Center, St. Joseph Hospital, and Wentworth-Douglas Hospital. Because only 13 of the hospitals reported charity care costs in addition to charity care charges, and because hospital patient services revenues are retail charges that individual hospitals may set, the following chart was developed as a way to adjust the data so that the highly variable, individually-set hospital charge amounts had less impact on the percentage of charity care actually delivered. To adjust the data, the net patient services revenues were divided by the gross patient services revenues. This ratio was then multiplied by the total charity care charges reported by the hospital. As shown in the below chart, the adjusted data of the unweighted average ratio of charity charges to gross patient services is less than the unadjusted data shown on page 17.
Adjusted Ratio of Charity Charges to Revenues
(2002-04)
1.2%
1.3% 1.3%
1.00%
1.20%
1.40%
1.60%
1.80%
2.00%
2.20%
2002 2003 2004

An Overview of New Hampshire Hospital Financial Measures
19
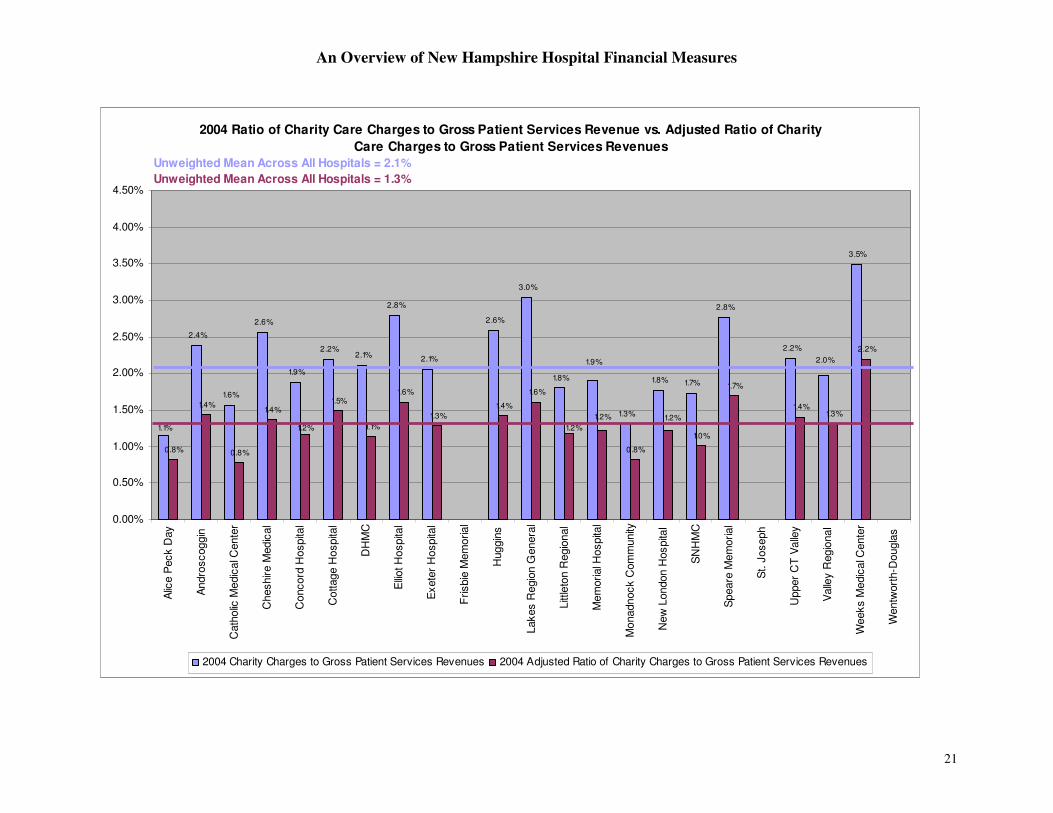
The following three charts provide 2002, 2003, and 2004 hospital-specific ratios comparing charity care charges to gross patient services revenues with the adjusted charity care charges to gross patient services revenues. The charts show that the specific relationship to the main may change when the revenue is adjusted. For example, Speare Memorial is at the mean for adjusted revenues, while it is below the mean when the revenues are not adjusted. Both Frisbie Memorial and Wentworth-Douglass Hospital did not report gross patient services revenues for the calculation.
2002 Ratio of Charity Care Charges to Gross Patient Services Revenue vs. Adjusted Ratio of Charity
Care Charges to Gross Patient Services Revenues
1.0%
1.6%
1.3%
1.4%
2.5%
1.9%
2.1%
1.6%
2.3%
1.6%
2.2%
1.2% 1.2%
3.0%
1.1%
4.1%
1.6%
1.9%
0.7%
0.8%
1.3%1.2%
1.3%
1.4%
0.8% 0.8%
1.1%
0.6%
1.9%
1.7%
1.7%
1.3%
2.8%
1.7%
0.7%
1.0% 1.0%
1.2%
0.9%
1.1%
1.0%
1.8%
0.00%
0.50%
1.00%
1.50%
2.00%
2.50%
3.00%
3.50%
4.00%
4.50%
Alic
e P
eck D
ay
Andro
scoggin
Cath
olic
Medic
al C
ente
r
Cheshire M
edic
al
Concord
Hospita
l
Cottage H
ospita
l
DH
MC
Elliot H
ospita
l
Exete
r H
ospita
l
Frisbie
Mem
orial
Huggin
s
Lakes R
egio
n G
enera
l
Litt
leto
n R
egio
nal
Mem
orial H
ospita
l
Monadnock C
om
munity
New
London H
ospita
l
SN
HM
C
Speare
Mem
orial
St. J
oseph
Upper
CT
Valle
y
Valle
y R
egio
nal
Weeks M
edic
al C
ente
r
Wentw
ort
h-D
ougla
s
2002 Charity Charges to Gross Patient Services Revenues 2002 Adjusted Ratio of Charity Charges to Gross Patient Services Revenues
Unweighted Mean Across All Hospitals = 1.9%
Unweighted Mean Across All Hospitals = 1.2%

An Overview of New Hampshire Hospital Financial Measures
20
2003 Ratio of Charity Care Charges to Gross Patient Services Revenue vs. Adjusted Ratio of Charity
Care Charges to Gross Patient Services Revenues
1.5%
2.7%
1.3%
2.3% 2.3% 2.3%
1.7%
2.7%
1.5%
2.6%
0.9%
2.3%
2.8%
2.4%
1.7%
3.0%
2.7%
2.1%
1.1%
1.6%
0.7%
1.1% 1.1%
1.6%
1.3%
1.5%
1.0%
1.5%
1.0%
1.7%
0.5%
1.6%1.7%
1.6%
0.9%
1.9%
1.7%
1.4%
2.0%2.0%2.0%
1.2%
0.00%
0.50%
1.00%
1.50%
2.00%
2.50%
3.00%
3.50%
4.00%
4.50%
Alic
e P
eck D
ay
Andro
scoggin
Cath
olic
Medic
al C
ente
r
Cheshire M
edic
al
Concord
Hospita
l
Cottage H
ospita
l
DH
MC
Elliot H
ospita
l
Exete
r H
ospita
l
Frisbie
Mem
orial
Huggin
s
Lakes R
egio
n G
enera
l
Litt
leto
n R
egio
nal
Mem
orial H
ospita
l
Monadnock C
om
munity
New
London H
ospita
l
SN
HM
C
Speare
Mem
orial
St. J
oseph
Upper
CT
Valle
y
Valle
y R
egio
nal
Weeks M
edic
al C
ente
r
Wentw
ort
h-D
ougla
s
2003 Charity Charges to Gross Patient Services Revenues 2003 Adjusted Ratio of Charity Charges to Gross Patient Services Revenues
Unweighted Mean Across All Hospitals = 2.1%
Unweighted Mean Across All Hospitals = 1.3%
An Overview of New Hampshire Hospital Financial Measures
21
2004 Ratio of Charity Care Charges to Gross Patient Services Revenue vs. Adjusted Ratio of Charity
Care Charges to Gross Patient Services Revenues
2.4%
1.6%
2.6%
1.9%
2.2%2.1%
2.8%
2.1%
2.6%
3.0%
1.8%
1.3%
1.8% 1.7%
2.8%
2.2%
3.5%
0.8%
1.4%
0.8%
1.4%1.5%
1.1%
1.6%
1.3%
1.4%
1.6%
0.8%
1.0%
1.7%
1.4%1.3%
2.2%
1.1%
2.0%1.9%
1.2%1.2%
1.2%1.2%
0.00%
0.50%
1.00%
1.50%
2.00%
2.50%
3.00%
3.50%
4.00%
4.50%
Alic
e P
eck D
ay
Andro
scoggin
Cath
olic
Medic
al C
ente
r
Cheshire M
edic
al
Concord
Hospita
l
Cottage H
ospita
l
DH
MC
Elliot H
ospita
l
Exete
r H
ospita
l
Frisbie
Mem
orial
Huggin
s
Lakes R
egio
n G
enera
l
Litt
leto
n R
egio
nal
Mem
orial H
ospita
l
Monadnock C
om
munity
New
London H
ospita
l
SN
HM
C
Speare
Mem
orial
St. J
oseph
Upper
CT
Valle
y
Valle
y R
egio
nal
Weeks M
edic
al C
ente
r
Wentw
ort
h-D
ougla
s
2004 Charity Charges to Gross Patient Services Revenues 2004 Adjusted Ratio of Charity Charges to Gross Patient Services Revenues
Unweighted Mean Across All Hospitals = 2.1%
Unweighted Mean Across All Hospitals = 1.3%
An Overview of New Hampshire Hospital Financial Measures
22
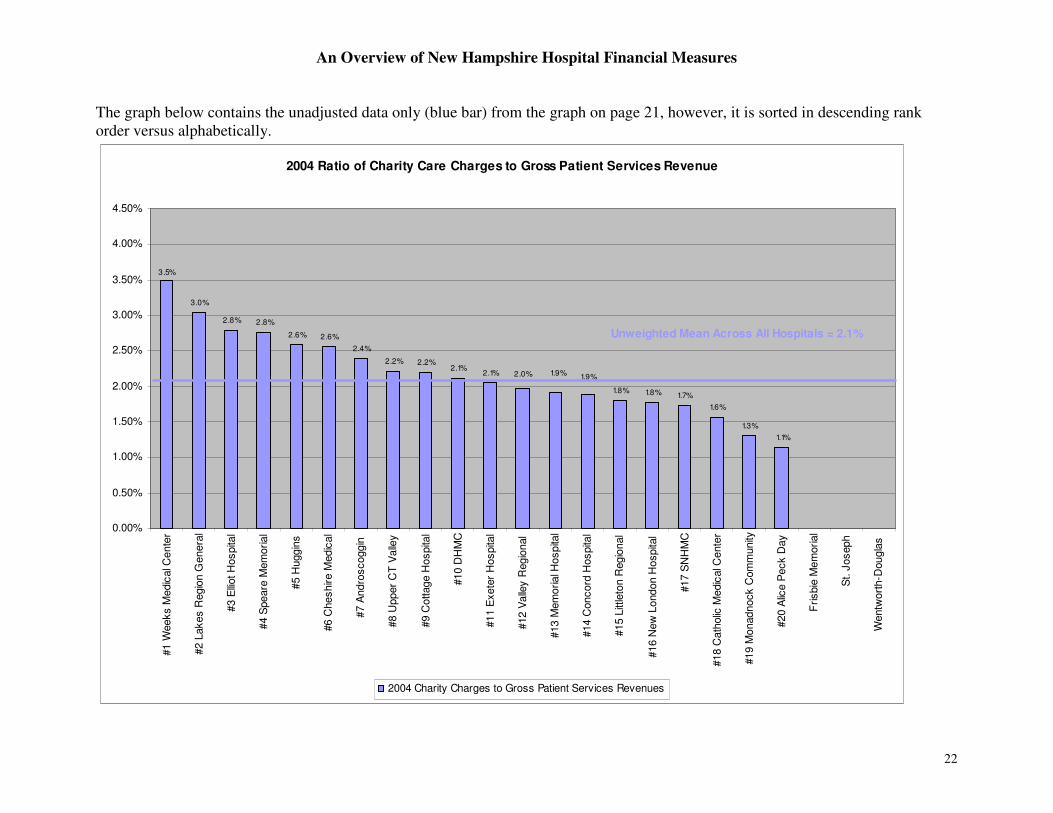
The graph below contains the unadjusted data only (blue bar) from the graph on page 21, however, it is sorted in descending rank order versus alphabetically.
2004 Ratio of Charity Care Charges to Gross Patient Services Revenue
3.0%
2.8% 2.8%
2.6% 2.6%
2.4%
2.2% 2.2%2.1%
2.1%
1.8% 1.8% 1.7%
1.6%
1.3%
1.1%
1.9%2.0%
3.5%
1.9%
0.00%
0.50%
1.00%
1.50%
2.00%
2.50%
3.00%
3.50%
4.00%
4.50%
#1 W
eeks M
edic
al C
ente
r
#2 L
akes R
egio
n G
enera
l
#3 E
lliot H
ospita
l
#4 S
peare
Mem
orial
#5 H
uggin
s
#6 C
heshire M
edic
al
#7 A
ndro
scoggin
#8 U
pper
CT
Valle
y
#9 C
ottage H
ospita
l
#10 D
HM
C
#11 E
xete
r H
ospita
l
#12 V
alle
y R
egio
nal
#13 M
em
orial H
ospita
l
#14 C
oncord
Hospita
l
#15 L
ittle
ton R
egio
nal
#16 N
ew
London H
ospita
l
#17 S
NH
MC
#18 C
ath
olic
Medic
al C
ente
r
#19 M
onadnock C
om
munity
#20 A
lice P
eck D
ay
Frisbie
Mem
orial
St. J
oseph
Wentw
ort
h-D
ougla
s
2004 Charity Charges to Gross Patient Services Revenues
Unweighted Mean Across All Hospitals = 2.1%
An Overview of New Hampshire Hospital Financial Measures
23
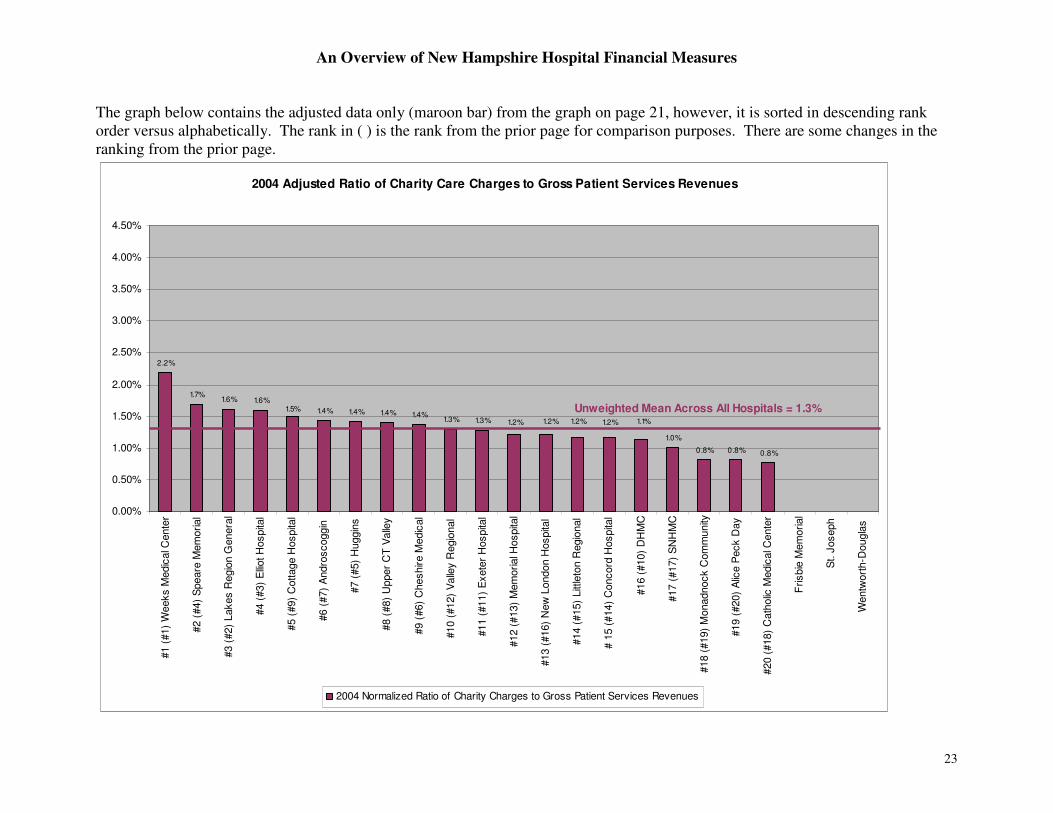
The graph below contains the adjusted data only (maroon bar) from the graph on page 21, however, it is sorted in descending rank order versus alphabetically. The rank in ( ) is the rank from the prior page for comparison purposes. There are some changes in the ranking from the prior page.
2004 Adjusted Ratio of Charity Care Charges to Gross Patient Services Revenues
2.2%
1.7%1.6% 1.6%
1.4% 1.4% 1.4% 1.4%1.3% 1.3%
1.0%
0.8% 0.8% 0.8%
1.2%1.2% 1.1%1.2%1.2%
1.5%
0.00%
0.50%
1.00%
1.50%
2.00%
2.50%
3.00%
3.50%
4.00%
4.50%
#1 (
#1)
Weeks M
edic
al C
ente
r
#2 (
#4)
Speare
Mem
orial
#3 (
#2)
Lakes R
egio
n G
enera
l
#4 (
#3)
Elliot H
ospita
l
#5 (
#9)
Cottage H
ospita
l
#6
(#7)
Andro
scoggin
#7 (
#5)
Huggin
s
#8 (
#8)
Upper
CT
Valle
y
#9 (
#6)
Cheshire M
edic
al
#10 (
#12)
Valle
y R
egio
nal
#11 (
#11)
Exete
r H
ospita
l
#12 (
#13)
Mem
orial H
ospita
l
#13 (
#16)
New
London H
ospita
l
#14 (
#15)
Litt
leto
n R
egio
nal
# 1
5 (
#14)
Concord
Hospita
l
#16 (
#10)
DH
MC
#17 (
#17)
SN
HM
C
#18 (
#19)
Monadnock C
om
munity
#19 (
#20)
Alic
e P
eck D
ay
#20 (
#18)
Cath
olic
Medic
al C
ente
r
Frisbie
Mem
orial
St. J
oseph
Wentw
ort
h-D
ougla
s
2004 Normalized Ratio of Charity Charges to Gross Patient Services Revenues
Unweighted Mean Across All Hospitals = 1.3%

An Overview of New Hampshire Hospital Financial Measures
24
9. Gross Total Margin
The following chart shows the unweighed gross total margin12 calculated across all New Hampshire hospitals for 2002-200413.
Gross Total Margin for all NH Hospitals
(2002-04)
2.5%
3.5%
4.3%
0.0%
0.5%
1.0%
1.5%
2.0%
2.5%
3.0%
3.5%
4.0%
4.5%
5.0%
2002 2003 2004
12 Hospital Gross Total Margin calculated as: (Gross Revenues less Gross Expenses) / Gross Revenues 13 The NH Hospital Association calculates Operating Margin on their trending reports posted quarterly to http://www.nhha.org/nhha/healthcare_data/index.php#Trend. The Operating Margin calculated by NHHA was 4.6%, 6.1%, and 5.6% for 2002, 2003, and 2004, respectively.

An Overview of New Hampshire Hospital Financial Measures
25
The following chart shows that the unweighted gross total margins for New Hampshire hospitals for years 2002, 2003, and 2004. The majority of the hospitals demonstrate increasing total margins from year to year. Lakes Region consistently demonstrates a loss.
Gross Total Margin by NH Hospital -- 2002-04Gross Total Margin Across All Hospitals=2.5%, 2003=3.5%, 2004=4.3%
-25.0%
-20.0%
-15.0%
-10.0%
-5.0%
0.0%
5.0%
10.0%
15.0%
2002 2.5% 2.9% 4.9% 1.3% 1.4% 0.6% 1.3% 2.1% 9.8% 1.8% -0.7% -4.3% 3.0% 3.3% 1.3% -21.3% 7.7% 3.7% 10.7% -6.1% -2.0% -0.4% 6.3%
2003 -1.0% 3.8% 9.6% 2.8% 2.1% 1.9% 0.0% 10.5% 9.0% -1.1% 1.9% -5.0% 3.9% 1.6% 0.1% -12.2% 7.8% 4.9% 11.4% 2.4% 0.7% 1.9% 8.2%
2004 4.7% -0.1% 8.5% 3.7% 2.5% 1.7% 2.0% 10.1% 10.3% 2.3% -2.0% -4.7% 3.6% 1.9% 4.9% 0.5% 8.6% 0.4% 11.2% 5.3% 0.3% 1.7% 4.9%
Alice
Peck
Day
Andro
scoggi
n
Catholi
c
M edic
Cheshi
re
M edic
Conco
rd
Hospit
Cottag
e
Hospit
DHM C
Elliot
Hospit
al
Exeter
Hospit
al
Frisbie
M emor
ial
Huggin
s
Lakes
Region
Genera
Lit t leto
n
Region
M emor
ial
Hospit
M onad
nock
Comm
New
Londo
n
SNHM
C
Speare
M emor
ial
St .
Joseph
Upper
CT
Valley
Valley
Region
al
Weeks
M edic
al
Wentw
orth-
Dougla

An Overview of New Hampshire Hospital Financial Measures
26
The following chart describes the unweighted gross total margins by hospital for 2004, sorted in descending order. The number format “#x (#x)” proceeding the name of the hospital is for comparative purposes. The first “#” is the ranking gross total margin. The second “(#)” is the ranking of the Adjusted Ratio of Charity Care Charges to Gross Patient Services Revenues. Frisbie Memorial, St. Josephs and Wentworth-Douglas Hospital do not have a ranking due to unreported data.
NH Hospital Gross Total Margins - 2004
11.2%
10.3% 10.1%
8.6% 8.5%
5.3%4.9% 4.9% 4.7%
2.5% 2.3%2.0% 1.9% 1.7% 1.7%
0.5% 0.4% 0.3%
3.7% 3.6%
-2.0%-0.1% -4.7%
-6.0%
-4.0%
-2.0%
0.0%
2.0%
4.0%
6.0%
8.0%
10.0%
12.0%
#1 (
no d
ata
) S
t.
Joseph
#2 (
#11)
Exete
r
Hospita
l
#3 (
#4)
Elliot H
ospita
l
#4 (
#17)
SN
HM
C
#5 (
#20)
Cath
olic
Medic
al C
ente
r
#6 (
#8)
Upper
CT
Valle
y
#7 (
no d
ata
)
Wentw
ort
h-D
ougla
s
#8 (
#18)
Monadnock
Com
munity
#9 (
#19)
Alic
e P
eck
Day
#10 (
#9)
Cheshire
Medic
al
#11 (
#14)
Litt
leto
n
Regio
nal
#12 (
#15)
Concord
Hospita
l
#13 (
no d
ata
) F
risbie
Mem
orial
#14 (
#16)
DH
MC
#15 (
#12)
Mem
orial
Hospita
l
#16 (
#1)
Weeks
Medic
al C
ente
r
#17 (
#5)
Cottage
Hospita
l
#18 (
#13)
New
London H
ospita
l
#19 (
#2)
Speare
Mem
orial
#20 (
#10)
Valle
y
Regio
nal
#21 (
#6)
Andro
scoggin
#22 (
#7)
Huggin
s
#23 (
#3)
Lakes
Regio
n G
enera
l
Mean - 4.3%
An Overview of New Hampshire Hospital Financial Measures
27
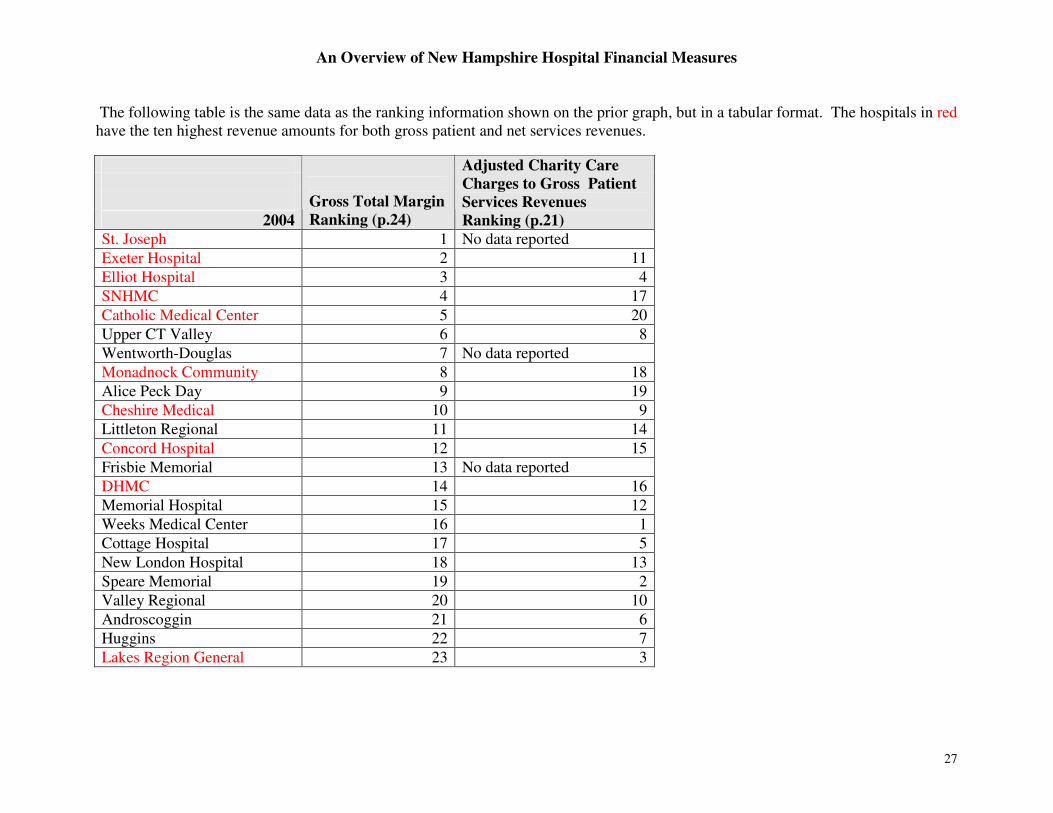
The following table is the same data as the ranking information shown on the prior graph, but in a tabular format. The hospitals in red have the ten highest revenue amounts for both gross patient and net services revenues.
2004
Gross Total Margin
Ranking (p.24)
Adjusted Charity Care
Charges to Gross Patient
Services Revenues
Ranking (p.21)
St. Joseph 1 No data reported
Exeter Hospital 2 11
Elliot Hospital 3 4
SNHMC 4 17
Catholic Medical Center 5 20
Upper CT Valley 6 8
Wentworth-Douglas 7 No data reported
Monadnock Community 8 18
Alice Peck Day 9 19
Cheshire Medical 10 9
Littleton Regional 11 14
Concord Hospital 12 15
Frisbie Memorial 13 No data reported
DHMC 14 16
Memorial Hospital 15 12
Weeks Medical Center 16 1
Cottage Hospital 17 5
New London Hospital 18 13
Speare Memorial 19 2
Valley Regional 20 10
Androscoggin 21 6
Huggins 22 7
Lakes Region General 23 3

An Overview of New Hampshire Hospital Financial Measures
28
This final chart displays summary data for adjusted bad debt, adjusted charity care, and ranking of gross total margin. The chart below shows the cumulative amount of adjusted bad debt and adjusted charity care as percentages of gross patient services revenues for 2004 data. It is sorted in cumulative descending order. The “# x” next to each hospital name represents the ranking for that hospital in terms of gross total margin. For example, Upper Connecticut Valley has the highest bad debt and charity care percentages, but was #6 in terms of gross total margin.
Adjusted Bad Debt and Adjusted Charity Care as a % of Gross Patient
Services Revenues 2004 - Cumulative Descending Sort
1.4% 1.3%1.0%
1.7% 1.6%2.2%
1.6%1.2%
1.5% 1.2% 1.4% 1.3% 1.4% 1.4% 1.2%0.8%
1.2% 1.1%0.8% 0.8%
4.5%4.3%
4.1%3.1%
2.7%1.9%
2.4%2.9% 2.4% 2.7% 2.1%
2.1% 1.9%1.5% 1.6%
1.8% 1.2% 1.1%1.4%
0.9%
0.0%
1.0%
2.0%
3.0%
4.0%
5.0%
6.0%
7.0%
#6 U
pper
CT
Valle
y
#20
Valle
y R
egio
nal
#4 S
NH
MC
#19 S
peare
Mem
orial
#3 E
lliot H
ospita
l
#16 W
eeks M
edic
al
Cente
r
#23 L
ake
s R
egio
n
Gen
era
l
#12 C
on
cord
Hospita
l
#17 C
ottag
e H
ospita
l
#15 M
em
oria
l Hosp
ital
#22 H
uggin
s
#2 E
xete
r H
ospita
l
#2
1 A
ndro
scog
gin
#10 C
he
shire M
edic
al
#11 L
ittle
ton R
egio
nal
#8 M
onadno
ck
Com
munity
#18 N
ew
Lo
ndon
Ho
spita
l
#14 D
HM
C
#5 C
ath
olic
Me
dic
al
Cente
r
#9 A
lice P
eck D
ay
#13 F
risbie
Mem
ori
al
#1 S
t. J
osep
h
#7 W
en
twort
h-
Dou
gla
s
Adjusted Charity Care/Gross Patient Services Revenues Adjusted Bad Debt/Gross Patient Services Revenues

An Overview of New Hampshire Hospital Financial Measures
29
The following table is the same data as the ranking information shown on the prior graph, but in a tabular format. The hospitals in red have the ten highest revenue amounts for both gross patient and net services revenues.
2004
Gross Total Margin
Ranking (p.24)
Bad Debt and
Adjusted Charity Care
as a % of Gross
Patient Services
Revenues Cumulative
Ranking (p.26)
St. Joseph 1 Not reported
Exeter Hospital 2 12
Elliot Hospital 3 5
SNHMC 4 2
Catholic Medical Center 5 17
Upper CT Valley 6 1
Wentworth-Douglas 7 Not reported
Monadnock Community 8 15
Alice Peck Day 9 20
Cheshire Medical 10 14
Littleton Regional 11 16
Concord Hospital 12 7
Frisbie Memorial 13 Not reported
DHMC 14 18
Memorial Hospital 15 8
Weeks Medical Center 16 10
Cottage Hospital 17 11
New London Hospital 18 19
Speare Memorial 19 4
Valley Regional 20 3
Androscoggin 21 13
Huggins 22 9
Lakes Region General 23 6

An Overview of New Hampshire Hospital Financial Measures
30
10. General & Administrative Expenses The average ratio of functional selling and general expenses (G&A) to functional healthcare expenses was 27%, 25%, and 23% for 2002, 2003, and 2004 respectively. Dartmouth Hitchcock Medical Center did not report selling and general expenses. Catholic Medical Center’s total functional expenses reported for 2003 differed between the 2003 and 2004 financial statements. The 2004 Catholic Medical Center statement figures were used for this report. Overall, selling and general expenses are decreasing, which suggests that they are becoming more administratively efficient.
Unweighted Average of Functional G&A Expenses to
Health Care Services (2002-04)
27%
25%
23%
21%
22%
23%
24%
25%
26%
27%
28%
2002 2003 2004
An Overview of New Hampshire Hospital Financial Measures
31
11. Appendices
Appendix A: Research Summary of State and Federal Actions re: Uninsured Discounts - Updated August 15, 2005
A brief review of legislative efforts in other states and at the federal level was conducted in order to determine if other states were requiring hospital providers to provide discounts to their uninsured patients. There does appear to be movement in this direction in several states. Additionally, both HCA and Tenet Healthcare, two of the nation’s largest for-profit hospital chains, both have discount programs for the uninsured. Tenet Healthcare’s discount was announced in March of 2005 as part of a settlement that guarantees uninsured patients discounts to those equal of managed care providers regardless of the patient’s income. The NH Health Access and NH Medication Bridge programs both have income restrictions. HCA announced on their website in 2005 a “managed care like discount” for the uninsured. The following synopsis includes the web links to the core articles and references:
1. The NH Health Access Network and the NH Medication Bridge programs provide assistance to NH residents seeking medical care and pharmaceuticals. These programs are restricted to residents under certain income guidelines. http://www.healthynh.com/fhc/initiatives/access/NHHAN.php and http://www.healthynh.com/fhc/initiatives/access/medicationbridge.php
2. February 2004, CMS’ Tommy Thompson issues letter to American Hospital Association blasting AHA and setting the record straight that hospitals can discount to uninsured. Source: http://www.hhs.gov/news/press/2004pres/20040219.html
3. CMS issues guidelines on uninsured and clarifies in Question 5 that discounting to uninsured is no different than other payer discounts. Source: http://www.cms.hhs.gov/FAQ_Uninsured.pdf
4. March 2004, Advocates from Council of United Latinos (a CA group) in Florida argue that the uninsured should receive discounts of “about 135 percent of Medicare's required reimbursement rates.” The CUL accuses Florida hospitals of “economic racism.”14 Source: http://www.cahi.org/article.asp?id=136
5. April 2004: 108th Congress introduces HB 4092. Title: To amend title XIX of the Social Security Act to require fair billing for hospital services provided to uninsured patients as a condition of Medicaid funding for a hospital. Would place a cap of 125% of payment amount on uninsured bills. Referred to House Subcommittee on Health. Source: http://www.theorator.com/bills108/hr4092.html
6. 2005: HCA announces a new, four part, charity policy including a “managed care like discount” for the uninsured. Source: www.hcahealthcare.com/cpm/Uninsured%20web%20document.doc
14 Group is also in Wall Street Journal article “Activist for Uninsured Needles Hospitals -- And Draws Blood” June 19, 2003.

An Overview of New Hampshire Hospital Financial Measures
32
7. March 2005: Tenet Healthcare announces that under a court settlement: “uninsured patients would be guaranteed discounts equal to those of managed care providers, regardless of the patient's income”. Source: http://www.medicalnewstoday.com/medicalnews.php?newsid=21105
8. In 2005, TN SB 1903 passed senate to house; limits hospitals to charging 120 percent of Medicare for certain self-pay patients. Full copy of bill text cannot be found. Am unclear if signed into law. Source: http://www.ncsl.org/programs/health/uninsleg.htm -- National Conference of State Legislatures
9. May 2005, Congress examines nonprofit hospital status in wake of record earnings. Source: http://www.political-news.org/breaking/11221/congress-examines-nonprofit-hospitals.html
10. Maine’s Dirigo Health reimburses providers the same rates paid by private insurers. Goal of covering uninsured is to “reduce bad debt and charity care costs.” Source: http://www.umaine.edu/mcsc/MPR/Vol12No3/Treat/Treat.htm
Appendix B: Union Leader Article November 27, 2005
Some hospitals have already made changes Lebanon - Beginning Jan. 1, Dartmouth-Hitchcock Medical Center will offer a 30 percent discount for uninsured patients. The discounts will apply to services provided by both the Lebanon hospital and physicians affiliated with Dartmouth-Hitchcock Clinic around the state. "We are doing this because we believe it's the right thing to do for our patients," said Mary Kay Boudewyns, vice president for revenue management at Dartmouth-Hitchcock. "It's really a fairness issue. Why should the uninsured have to pay more for their service than what most patients under insurance plans have to pay?" Boudewyns said the change was triggered by a recognition of the growing number of uninsured individuals who don't qualify for financial assistance. She said one study found that households making $50,000 and more a year account for 90 percent of the increase in the numbers of uninsured over the past 10 years. "There's a shift in who the uninsured are, and in response to that, we need to think differently about how we help people be able to pay their bills for the care they need."
An Overview of New Hampshire Hospital Financial Measures
33
As the state's insurance market has consolidated, Boudewyns noted, the companies that remain have been able to negotiate ever-deeper discounts. She said the 30 percent rate represents the average discount for the insurers that contract with the hospital and clinic doctors. Boudewyns said the change also comes from a recognition that uninsured patients are less likely to seek medical care. "By offering a discount, it makes it more affordable for them, and hopefully they can get the care they need to keep them in a good state of health." Concord Hospital also changed its billing policy for uninsured patients this past summer, according to Michael Green, the chief executive officer. "We recognized it was time to change," Green said. While the hospitals' financial counselors have previously negotiated "unique arrangements" with many individual patients who did not have health insurance, he said, "We decided to put into formal policy a lot of what we were doing informally, so more people would more easily qualify." There are several components to the comprehensive new program, including a catastrophic assistance program that gives up to a 50 percent discount for uninsured individuals who make up to 500 percent of the federal poverty level (FPL), based on the amount of the hospital bill. "It's scaled so that the lower you happen to be in comparison to the federal poverty guidelines, the greater your discount is on larger bills," Green explained. For a family of five, 500 percent of the FPL would be about $113,000 in annual income, he noted. For a single person, it would be $47,850. Concord Hospital also offers a 20 percent discount for uninsured patients who pay within 30 days of when they receive their bills. And there's a 10 percent discount for those who pay within 60 days. "Concord Hospital has been very well supported by this community and we feel a very strong sense of obligation to give back to this community, and give back to those people who need us the most," Green said.

An Overview of New Hampshire Hospital Financial Measures
34
Appendix C: Analysis Methodology
The methodology used for the analysis in this report is outlined in this section. All calculations are transparent. This section is divided into each major section of the report. The source data is identified and the calculation is explained.
Report Section Calculation Description Source Data Calculation Explanation
3.1 Appendectomy average charges of $18,114.
2002 and 2002 inpatient and outpatient data sets supplied by NHDHHS.
All claims data for DRG 166 was selected. This data set was grouped by unique patient identifier to provide total charges per patient identifier. The average charge was then calculated.
3. Setting the Stage
3.2 Values assigned to each of the payer types (blue bars).
Created for the report. The $18,114 average charge amount was multiplied by each of the assumed discounts. This number was subtracted from the $18,114 figure for each of the payer types.
4. Self Pay Payer
Type
4.1 Percentage of hospital charges by payer type.
2002 and 2002 inpatient and outpatient data sets supplied by NHDHHS.
All claims data were selected. The data were grouped by payer type field and total charges were summed for each payer type. The percent total by payer type for each year was then calculated. Note: payer type of “Other” had approximately $250,000 in charges, but equated to zero percent of the total amounts (in excess of $2 billion in total charges).
5.1 Unweighted average gross patient services revenues by year
2002, 2003, and 2004 audited hospital financials
All gross patient services revenues for each hospital were added separately by year and the unweighted averages for each year were calculated.
5.2 Unweighted average net patient services revenues by year
2002, 2003, and 2004 audited hospital financials
All gross net patient services revenues for each hospital were added by year and the unweighted averages for each year were calculated. The net patient services revenues are the result of subtracting contractual allowances and provision for charity care from gross patient services revenues.
5. Hospital Revenues
5.3 Unweighted average 2002, 2003, and 2004 All gross patient services revenues for each hospital

An Overview of New Hampshire Hospital Financial Measures
35
Report Section Calculation Description Source Data Calculation Explanation
gross patient services revenues for 2002-2004 combined.
audited hospital financials
were added separately by year. An unweighted average for all three years was calculated by hospital.
5.4 Unweighted average net patient services revenues for 2002-2004 combined.
2002, 2003, and 2004 audited hospital financials
All gross net patient services revenues for each hospital were added separately by year. An unweighted average for all three years was calculated by hospital. The net patient services revenues are the result of subtracting contractual allowances and provision for charity care from gross patient services revenues.
6.1 Mean (unweighted), median minimum, and maximum percent difference between gross and net patient services reveneues for each year 2002-2004.
2002, 2003, and 2004 audited hospital financials
This is calculated as the percent difference between gross patient services revenue (A) and net patient services revenue (B) as shown in the formula (A-B)/B. The calculation was performed for each hospital for each year and then mean, median, min, and max were calculated for each year.
6.2 Unweighted average percent difference between gross and net patient services reveneues by hospital for 2002-2004 combined.
2002, 2003, and 2004 audited hospital financials
This is calculated as the percent difference between gross patient services revenue (A) and net patient services revenue (B) as shown in the formula (A-B)/B. The calculation was performed for each hospital for each year. The unweighted average was then calculated for the three years for each hospital and then displayed.
6. Hospital Retail
Charges vs.
Collected Revenues
6.3 Percent difference between gross and net patient services reveneues by facility for each year 2002-2004.
2002, 2003, and 2004 audited hospital financials
This is calculated as the percent difference between gross patient services revenue (A) and net patient services revenue (B) as shown in the formula (A-B)/B. The calculation was performed for each hospital for each year and then displayed.
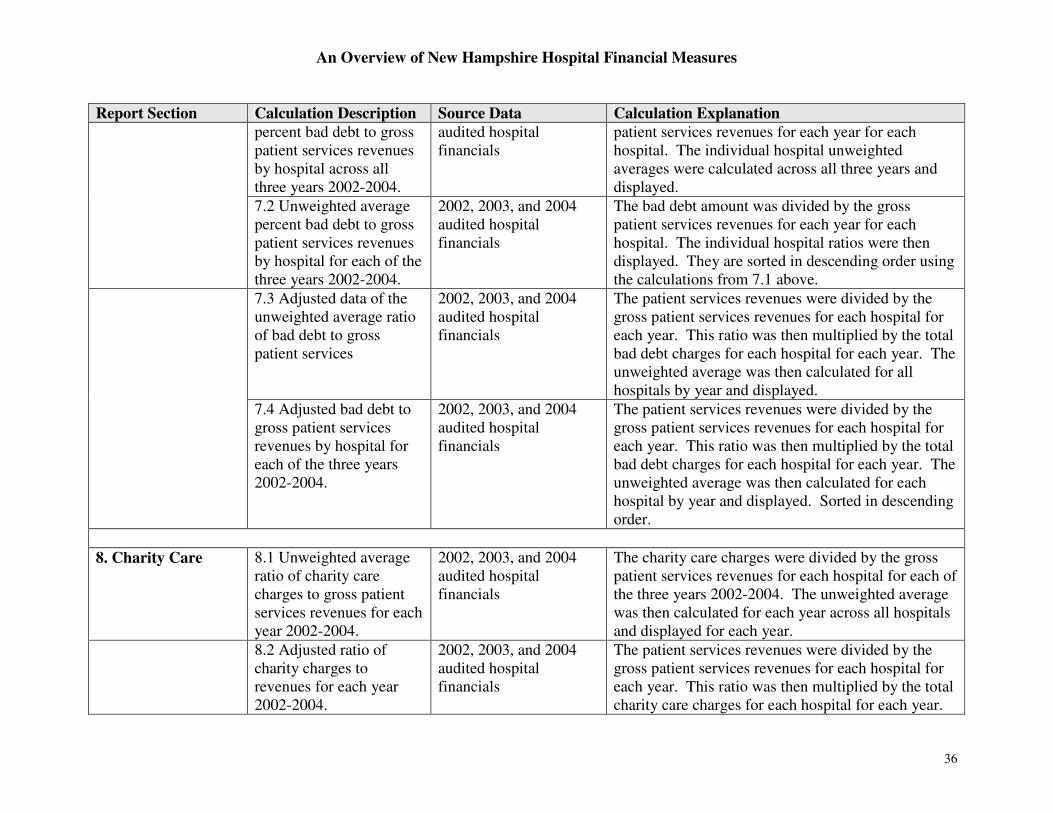
7. Bad Debt 7.1 Unweighted average 2002, 2003, and 2004 The bad debt amount was divided by the gross
An Overview of New Hampshire Hospital Financial Measures
36
Report Section Calculation Description Source Data Calculation Explanation
percent bad debt to gross patient services revenues by hospital across all three years 2002-2004.
audited hospital financials
patient services revenues for each year for each hospital. The individual hospital unweighted averages were calculated across all three years and displayed.
7.2 Unweighted average percent bad debt to gross patient services revenues by hospital for each of the three years 2002-2004.
2002, 2003, and 2004 audited hospital financials
The bad debt amount was divided by the gross patient services revenues for each year for each hospital. The individual hospital ratios were then displayed. They are sorted in descending order using the calculations from 7.1 above.
7.3 Adjusted data of the unweighted average ratio of bad debt to gross patient services
2002, 2003, and 2004 audited hospital financials
The patient services revenues were divided by the gross patient services revenues for each hospital for each year. This ratio was then multiplied by the total bad debt charges for each hospital for each year. The unweighted average was then calculated for all hospitals by year and displayed.
7.4 Adjusted bad debt to gross patient services revenues by hospital for each of the three years 2002-2004.
2002, 2003, and 2004 audited hospital financials
The patient services revenues were divided by the gross patient services revenues for each hospital for each year. This ratio was then multiplied by the total bad debt charges for each hospital for each year. The unweighted average was then calculated for each hospital by year and displayed. Sorted in descending order.
8. Charity Care 8.1 Unweighted average ratio of charity care charges to gross patient services revenues for each year 2002-2004.
2002, 2003, and 2004 audited hospital financials
The charity care charges were divided by the gross patient services revenues for each hospital for each of the three years 2002-2004. The unweighted average was then calculated for each year across all hospitals and displayed for each year.
8.2 Adjusted ratio of charity charges to revenues for each year 2002-2004.
2002, 2003, and 2004 audited hospital financials
The patient services revenues were divided by the gross patient services revenues for each hospital for each year. This ratio was then multiplied by the total charity care charges for each hospital for each year.

An Overview of New Hampshire Hospital Financial Measures
37
Report Section Calculation Description Source Data Calculation Explanation
The unweighted average was then calculated for all hospitals by year and displayed.
8.3, 8.4, 8.5 2002, 2003, and 2004 audited hospital financials
Comparison of 8.1 and 8.2 was displayed for each year and for each hospital.
9. Gross Total
Margin
9.1 Gross Total Margin for all NH hospitals
2002, 2003, and 2004 audited hospital financials –statement of operations
The gross revenues and expenses for all hospitals were summed. Then the following formula was calculated (Gross Revenues less Gross Expenses) / Gross Revenues.
9.2 Gross Total Margin by NH Hospital
2002, 2003, and 2004 audited hospital financials –statement of operations
The following formula was calculated for each individual hospital (Gross Revenues less Gross Expenses) / Gross Revenues.
9.3 NH Hospital Gross Total Margin by Hospital for 2004
2002, 2003, and 2004 audited hospital financials –statement of operations
The following formula was calculated for each individual hospital (Gross Revenues less Gross Expenses) / Gross Revenues. The hospitals were then sorted in descending order.
9.4 Adjusted Bad Debt and Adjusted Charity Care as a % of Gross Patient Services Revenues 2004
2002, 2003, and 2004 audited hospital financials
Data from Section 7 and Section 8 was represented in a stacked bar format.
10. General and
Administrative
Expenses
10.1 Unweighted average of functional G&A expenses to health care services
2002, 2003, and 2004 audited hospital financials
The functional general and administrative expenses were divided by the functional health care services for each hospital for each year. The unweighted average was then calculated for all hospitals by year and then displayed.

An Overview of New Hampshire Hospital Financial Measures
38
Appendix D: List of Hospital Financials Reviewed
The following table contains the list of the audited financials used for the report.
Hospital Name 2003 Financials Title Hospital
Only?
2004 Financials Title Hospital
Only?
Alice Peck Day Alice Peck Day Health Systems Corporation and Subsidiaries Consolidated Financial Statements
No Alice Peck Day Health Systems Corporation and Subsidiaries Consolidated Financial Statements
No
Androscoggin Androscoggin Valley Hospital, Inc. Financial Statements
Yes Androscoggin Valley Hospital, Inc. Financial Statements
Yes
Catholic Medical Center
Catholic Medical Center Financial Statements
Yes Catholic Medical Center Financial Statements
Yes
Cheshire Medical The Cheshire Medical Center Financial Statements
Yes The Cheshire Medical Center Financial Statements
Yes
Concord Hospital Concord Hospital, Inc. and Subsidiaries Consolidated Financial Statements and Additional Information
No Concord Hospital, Inc. and Subsidiaries Consolidated Financial Statements and Additional Information
No
Cottage Hospital Cottage Hospital Financial Statements
Yes Cottage Hospital Financial Statements
Yes
DHMC Dartmouth-Hitchcock and Subsidiaries Consolidated Financial Statements
No Dartmouth-Hitchcock and Subsidiaries Consolidated Financial Statements
No
Elliot Hospital Elliot Hospital Financial Statements
Yes Elliot Hospital Financial Statements
Yes
Exeter Hospital Exeter Hospital, Inc. Yes Exeter Hospital, Inc. Yes

An Overview of New Hampshire Hospital Financial Measures
39
Hospital Name 2003 Financials Title Hospital
Only?
2004 Financials Title Hospital
Only?
Financial Statements Financial Statements
Frisbie Memorial Frisbie Memorial Hospital and Subsidiaries Consolidated Financial Statements
No Frisbie Memorial Hospital and Subsidiaries Consolidated Financial Statements
No
Huggins Huggins Hospital and Subsidiary Financial Statements and Additional Information
No Huggins Hospital and Subsidiary Financial Statements and Additional Information
No
Lakes Region General (including Franklin)
LRGHealthcare Audit Report
No LRGHealthcare Audit Report
Yes
Littleton Regional Littleton Regional Hospital Financial Statements
Yes Littleton Regional Hospital and Affiliate Financial Statements
Yes
Memorial Hospital The Memorial Hospital at North Conway, NH Financial Statements
No The Memorial Hospital at North Conway, NH and Subsidiaries Consolidated Financial Statements
No
Monadnock Community
Monadnock Community Hospital Consolidated Financial Statements
No Monadnock Community Hospital Consolidated Financial Statements
No
New London Hospital
New London Hospital Association, Inc. and Subsidiaries Consolidated Financial Statements
No New London Hospital Association, Inc. and Subsidiaries Consolidated Financial Statements
No
SNHMC Southern New Hampshire Medical Center Financial
Yes Southern New Hampshire Medical
Yes

An Overview of New Hampshire Hospital Financial Measures
40
Hospital Name 2003 Financials Title Hospital
Only?
2004 Financials Title Hospital
Only?
Statements Center Financial Statements
Speare Memorial Speare Memorial Hospital Association, Inc. and Subsidiaries Financial Statements
No Speare Memorial Hospital Association, Inc. and Subsidiaries Financial Statements
No
St. Joseph St. Joseph Hospital Financial Statements
No Covenant Health Systems, Inc. Consolidated Financial Statements and Supplemental Consolidating Financial Statements
No
Upper CT Valley Upper Connecticut Valley Hospital Association Financial Statements
Yes Upper Connecticut Valley Hospital Association Financial Statements
Yes
Valley Regional Valley Regional Hospital Financial Statements
Yes Valley Regional Hospital Financial Statements
Yes
Weeks Medical Center
Weeks Medical Center Financial Statements
Yes Weeks Medical Center Financial Statements
Yes
Wentworth-Douglas
Wentworth-Douglas Hospital and Subsidiaries Audited Consolidate Financial Statements
Yes Wentworth-Douglas Hospital and Subsidiaries Audited Consolidate Financial Statements
Yes

An Overview of New Hampshire Hospital Financial Measures
41
Appendix E: Study Authors
Patrick Miller, MPH is a Principal with the Pero Consulting Group, LLC. He has both a management and technical background, having served in a variety of senior positions, including Chief Information Officer for Choicelinx Corporation and Director of Research and Process Design for CIGNA. He founded Pero Consulting Group in 1999. Patrick's background includes product development, information management and analysis, health plan operations, business planning, and project management. Amy Philbrick, MPH is a Senior Policy Analyst with the New Hampshire Institute for Health Policy and Practice at the University of New Hampshire. Prior to joining the Institute, she was the Vice President of Provider Network Management for the Neighborhood Health Plan, a Medicaid HMO in Boston, Massachusetts. In addition, she held executive level positions at Regence Blue Shield in Seattle, Washington and has experience and expertise in contracting, rate negotiation, cost containment, pricing, and health care financing.