Embed Size (px)
Citation preview
1
An overview of Integrated CAE activities for an effective design of ITER TBM
(Integrated multi-physics analysis in a multi-code environment)
Manmeet Narula, Alice Ying, Ryan Hunt and Mohamed Abdou
Fusion Engineering Sciences, UCLA, Los Angeles, USA
Presented at CBBI-14
Petten, The NetherlandsSeptember 6-8, 2006

2
The US HCCB concept for ITER testingThe US HCCB concept for ITER testing
• To demonstrate that the HCCB blanket is capable of:
– Withstanding cyclic surface heat flux:• of up to 0.5 MW/m2, and a neutron wall load of
0.78 MW/m2 with accumulated fluence of 0.1 MW·y/m2;
– Operating for extended periods:• Up to 3 years and for significant thermal
cycles (9,000 cycles) at ferritic steel temperatures in the range of 300-550°C
• Ceramic breeder in the range of 375-900°C and beryllium in the range of 375-600°C; (establishing lower- and higher temperature limits, i.e. temperature window for ceramic breeders operation)
– Effectively transferring heat between breeder and multiplier and cooling plates:
• within aforementioned material temperature windows;
– Generating high grade heat:• With a helium outlet temperature of 500°C with
simultaneous release and control of tritium; – Generating tritium:
• At a rate that extrapolates to tritium self- sufficiency in future facilities.
Edge-on configuration shown
Ceramic breeder
Be pebbles
FW panel with He
channels
Internal cooling plateHe-coolant
manifolds
US HCCB TBM sub-module (710 ×
389 ×
510 mm)

3
Helium cooling schemes for US HCCB ITER sub-module design
FW manifold
Breeding zone manifold
• Allows double snake design to occur– Green diverts flow from top & bottom
caps– Orange transfers flow from one pass
to the next– Blue is outlet collector– Tan tubes distribute flow poloidally to
all parallel channels• Uneven coolant flow will make manifold
design challenging

4
EM module design starts with EM module design starts with thermofluidthermofluid analysis for analysis for manifold design to ensure uniform flow distributionmanifold design to ensure uniform flow distribution
Year of ITER operation 1 2 3 4 5 6 7 8 9 10Plasma phase D-DHCCB
H-H Low Duty D-T Cycle High Duty D-T Cycle EM Module NT Module TM Module Integrated Module
Four sequential sub-modules for different ITER operating phases minimizes technical risks
Objectives and characteristics of the HObjectives and characteristics of the H--H subH sub--modulemodule• The first sub-module of a series
A design that embodies the general geometrical architecture of the D-T test sub-modules.
• Addresses one of the most critical engineering feasibility issues concerning blanket structure thermomechanics and response to off-normal operations.
• Provides fusion-relevant testing data to verify the design approach, fabrication technique and structural support of the TBM,
• Supports subsequent nuclear-grade test sub-module designs and ITER D-T licensing.

5
Basic Analysis Platforms for H-H sub-module:• CAD/Thermo-fluid /structural thermo-mechanics • CAD/Electro-magnetism/structural analysis • Neutronics
CAD/CAE flow diagram for an integrated design analysis
An exhaustive integrated CAE effort is an An exhaustive integrated CAE effort is an indispensable part of the EDA for the TBMindispensable part of the EDA for the TBM
Temperature in solid domain
CAD Model Input
CAD to Analysis Intermediaries
Fix CAD model
Neutronics Electromagnetics
Thermo Fluid
Mass Transfer Structural
Stress and Strain in solid domain

6
Helium flow path in the validation model
Structure temperature in validation model
Effect of mesh resolution at the flow channel walls on numerical results
Heat transfer coefficient on channel walls
Average h from Dittus Boelter correlation: 2779 W/m2K
Two layers of prismatic elements were placed in the fluid domain at the fluid-solid interface .The mesh resolution in the table corresponds to the size of the wall prismatic elements. The logarithmic law of the wall was used to calculate turbulent heat transfer at the walls.
Validity range of log law:
Validation study for Thermo-fluid analysis using SC/Tetra

7
SC/Tetra thermo-fluid analysis for Inlet/FW collection manifold design: Design A
Flow vectors in the inlet manifold
Helium temperature distribution

8
Helium temperature distributionThe coolant temperature in the bottom leg is higher than in the other ‘hot’ legs in this cooling scheme
Velocity distribution in the inlet manifold
Inlet/FW collection manifold design B

9

10
Manifold design A Manifold
design B
Top view with thecross sectional cut
Coolant distribution in first wall
0.02
0.0205
0.021
0.0215
0.022
0.0225
0.023
0.0235
0.024
0.0245
1 2 3 4 5 6 7 8 9 10 11 12 13 14 15 16
Channel number
Mas
s flo
w ra
te (k
g/s)
Even though, design B is an improvement over design A, the three channels in the middle of the first wall remain underfed and require some further modifications to the inlet manifold design
Velocity distribution in first wall cooling channels
Mass flow rate in the 16 first wall channels for the two designs

11
Temperature variation on the Be first wall. A hot spot forms at the bottom of the wall in the current cooling scheme. The hot and cold temperature bands correspond to the hot and cold legs of the three pass Helium cooling loop in the first wall.
Be layer and First wall structure temperature distribution from SC/Tetra

12
First simulation of one fifth scale of FW cooling channels followed by coolant flow in 16 parallel channels in the breeder zone demonstrates that the software can handle extremely complex flow geometry involving numerous channels and distribution manifolds.

13
Helium flow velocity distribution at a middle cross section
Helium coolant temperature at a middle cross section
Example breeding zone He flow and thermal characteristics

14
Integrated thermo-fluid/thermal stress analysis through mesh based code coupling
• SC/Tetra is used to calculate the temperature field in the fluid and solid parts of the domain.
• SC/Tetra mesh is optimized towards a reliable calculation of helium flow distribution as well as conjugate heat transfer from the solid structure to the helium coolant.
• The thermal stress analysis in the solid structure is done by using ANSYS.
• The ANSYS mesh is tailored towards an effective calculation of thermal stresses in the solid structures and is different from the SC/Tetra mesh used to obtain the temperature field in the solid.
• Temperature data exchange across the meshes is undertaken by a special utility FLDUTIL from CRADLE
15
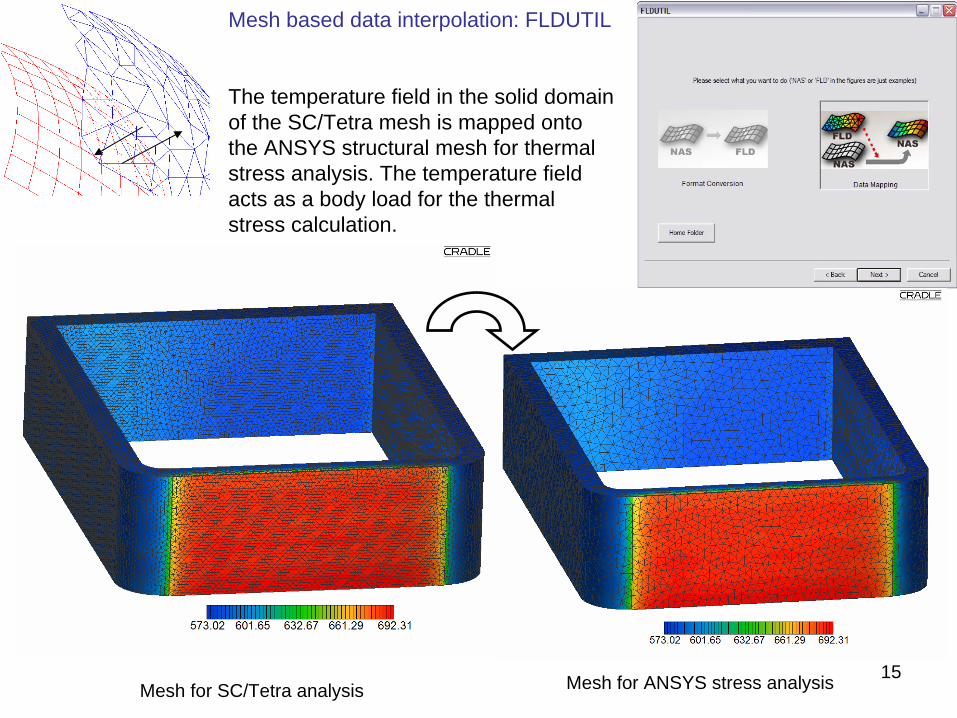
Mesh based data interpolation: FLDUTIL
The temperature field in the solid domain of the SC/Tetra mesh is mapped onto the ANSYS structural mesh for thermal stress analysis. The temperature field acts as a body load for the thermal stress calculation.
Mesh for ANSYS stress analysisMesh for SC/Tetra analysis

16
From temperature field in SC/Tetra
To Von-Mises stress field and deformation in ANSYS
SC/Tetra temperature field provides the body load, which is mapped onto the ANSYS mesh using FLDUTIL

17
Tungsten Experiment
(Attila’s Model and Calculation under benchmarking)
Cells and three iso-surfaces are shown
Locations for multi-foils
Tungsten(DENSIMET-176)
Tungsten(DENSIMET-180) 14 MeV
anisotropic Source and Target Case
Air49
19.9
3.5
22.55.3Solid Work Model
1/4 of the Mock-up
From SINBAD 2000 Archive Data Base
Tungsten Mock-up Configuration
From Youssef’s presentation on 8- 23-2006 at UCLA

18
Final comments• The design of a complex system like the ITER TBM requires an
exhaustive CAE effort encompassing multiple simulation codes supporting multi-physics modeling.
• The integration of multiple codes for TBM design can be viewed as a precursor to a larger effort towards developing VTBM.
• Integrated Data/multi-code multi-physics modeling activities, or Virtual TBM, is key for ITER TBM R&D activity.
– As an efficient design tool: A platform for fast, streamlined and optimized TBM design effort through identification and isolation of potential design flaws.
– As an effective operations aide: Facilitate simulation of normal and off normal operational scenarios. A tool for use to design the CODAS system