Embed Size (px)
Citation preview

An Overview of Indian Power Sector and
Challenges & Opportunities for Ensuring Efficient, Reliable Electricity
14th November 2017
By
Vivek Goel
Chief Engineer
Central Electricity Authority

Generators
Central/State GENCOs, IPPs, Captive
Consumers
Industries, Household, Agriculture etc
System Operator
(POSOCO)
STU
Intra-State Trans./Sub-Trans. System
CTU Inter-State Trans. System, Open Access
DISCOMs
Traders
Power Exchanges
Players In The Indian Power Sector

3
Indian Power Sector since Independence
Installed Capacity ( in GW )
1.36 (1947)
329.30(30.09.2017)
Gross Electricity Generation (in BU)
4.07 (1947)
1142.9(2016-17)
Per capita consumption (in kWh)
16.3(1947)
1122(2016-17)
% T&D Losses -
21.81 %(2015-16)
% AT&C Losses-
23.98%(2015-16)
Peak Demand Met (in GW)
-160
(2017-18)

Fuelwise Generation Installed Capacity in India
(As on 30-09-2017)
Fuel Installed Capacity (MW) % Share in Total IC
Thermal 219,449 66.6%
Coal 193,427 57.8%
Gas 25,185 7.6%
Diesel 837 0.3%
Hydro 44,765 13.6%
Nuclear 6,780 2.1%
RES 58,303 17.7%
Total 329,298 100.0%

Sector-wise Generation Installed Capacity in India
(As on 30-09-2017)
SectorInstalled
Capacity (MW)% Share in Total
Central Sector 103,033 31.29%
State Sector 81,102 24.63%
Private Sector 145,162 44.08%
Total 329,298

Electricity Generation & Growth over the years

Power Supply Position
2016-17 2017-18( upto Oct 2017)
Energy Requirement (Billion Units)
1142.92 720.43
Energy Supplied (BU) 1135.33 715.24
Shortage % -0.7% -0.7%
Peak Demand GW 159.5 164.07
Peak Met GW 156.9 160.75
Shortage % -1.6% -2.0%
Sector-wise Energy met
(During 2017-18 )
SectorInstalled Capacity
(IC %age)
Energy contribution
(% age )
Thermal 66.6% 76%
Hydro 13.6% 12.5%
Nuclear 2.1% 2.5%
Renewable 17.7% 9%
Total 100% 100%

Typical Category wise
Consumption In India
Category Avg %age of consumption
(CEA General Review)
Domestic 23%
Commercial 8%
Industrial 44%
Agriculture 18%
Misc. 7%

Demand Projections of the Country
Year Peak Demand
(GW)
Energy Requirement
(BU)
2021-22 225.7 1566
2026-27 298.8 2047
2031-32 370.5 2531
Source: 19th Electric Power Survey (EPS) published by CEA

YearPeak
Demand (GW)
Energy Requireme
nt(BU)
2021-22 225.7 1,566
2026-27 298.8 2,047
DEMAND
YearEnergy
Requirement (BU)
Peak Requireme
nt (GW)
2021-22 206 9
2026-27 273 12
RES CONTRIBUTION IN TOTAL ENERGY
REQUIREMENT DURING 2017-22
ScenarioRES IC by
2022 (GW)
RES Energy Contribution (BU) in Total
Energy requirement
I 175 327 (20.19%)Total= 175 GW

Proposed Installed Capacity by 2022
(As per Draft National Electricity Plan )
Source Capacity in GW
Coal 217.3
Hydro 51.3
Gas 25.7
Nuclear 10.1
Renewable 175.0
Total IC 479.4
IC of non-fossil fuel/Total IC (%)
49.3%

Proposed Installed Capacity by 2027
(As per Draft National Electricity Plan )
Source Capacity in GW
Coal 238
Hydro 63
Gas 26
Nuclear 17
Renewable 275
Total IC 619
IC of non-fossil fuel/Total IC (%)
57.4%

14
India’s Intended Nationally Determined Contribution (INDC)40 % cumulative power installed capacity from non-fossil fuels
by 2030.
YearLikely IC
(GW)
Likely IC of Fossil Fuel
(GW)
Likely IC of Non-Fossil Fuel (GW)
% of Non-Fossil Fuel in IC
March2022
479.5 243.1 236.4 49.3%
March2027
619.1 263.9 355.2 57.4%

Year kWh
2006-07 672
2007-08 717
2008-09 734
2009-10 779
2010-11 819
2011-12 883
2012-13 914
2013-14 957
2014-15 1010
2015-16 1075
2016-17 1122
PER CAPITA CONSUMPTIONAll INDIA

Year kWh ( Target)*
2017-18 1276
2018-19 1372
2019-20 1473
2020-21 1568
2021-22 1668
PER CAPITA CONSUMPTIONINDIA ( Target)
* Tentative

Country kWh
World Average 3104
USA 12988
Australia 10134
Japan 7836
Germany 7019
Italy 5159
Brazil 2529
China 3762
India 1100
PER CAPITA CONSUMPTIONAvg World

Transmission System – As of Today
• Strong back bone of 400 kV – Overlay of 765 kV & high capacity HVDC
• All India synchronous grid – One of the largest synchronous electricity grid in the World
• Green energy corridor for facilitating transmission of about 40,000 MW RE power
• PMU ( Phase Measurement Units ) have been installed at various locations by CTU (PGCIL) for Grid security
• Establishment of Renewable Energy Management Centres enabling forecasting of renewable generation, real time monitoring, etc

Development of Synchronous National Grid
Electrical Grids demarcated into 5 Regional Grids
National Grid started through HVDC Inter-Regional links
Regional grids synchronised progressively through EHVAC links
Synchronous National Grid established in Dec., 2013
Strengthening of National Grid –A Continuous Process
(to match upcoming generation and increasing demand)

Total Transmission Lines (cKm) &
Transformation Capacity (MVA)(Voltage-wise)
(As on 30-09-2017)
Transmission Lines (cKm)
VoltageTotal Transmission Lines
% Share in Total(cKm)
765 kV 33,286 8.8%400 kV 166,465 44.0%220 kV 163,268 43.1%HVDC 15,556 4.1%
Total 378,575Transformation Capacity (MVA)
Voltage Total Transformation
Capacity (MVA)% Share in Total
765 kV 177,500 22.7%400 kV 261,252 33.4%220 kV 321,578 41.2%HVDC 21,000 2.7%
Total MVA 781,330

Green Energy Corridor : Integration of Renewables
• The Plan includes
– Transmission strengthening
– Dynamic reactive compensation,
– Energy Storage,
– Smart grid applications,
– Establishment of RenewableEnergy Management Centreenabling forecasting ofrenewable generation, realtime monitoring, etc.

Central Electricity Authority
Distribution Utilities in India
Electricity Departments (EDs) 10
Private Distribution Companies 25
Corporatised Distribution Companies 59
Total 94

Central Electricity Authority
Year T&D (%) AT&C (%)
2005-06 30.42 33.02
2006-07 28.65 30.62
2007-08 27.20 29.45
2008-09 25.47 27.37
2009-10 25.39 26.78
2010-11 23.97 26.04
2011-12 23.65 26.63
2012-13 23.04 25.48
2013-14 21.46 22.622014-15 22.77 25.722015-16 21.81 23.98
Target2019-20 15% 15%
T&D LOSSES AND AT&C LOSSES

Central Electricity Authority
Country T&D Losses (%)
USA 6%
UK 8%
Japan 5%
Russia 10%
Australia 6%
India 21%
World Avg 8%
T&D LOSSES OF VARIOUS COUNTRIES

Central Electricity Authority
Poor Financial Position of Distribution Companies
• High AT&C Losses
• Inadequate Metering, Billing & Collection.
Access to Electricity to All Rural HHs
Less use of IT, Energy auditing & accounting in
Distribution sector.
Overloaded & old sub-transmission and
Distribution network
Issues in Distribution Sector

Central Electricity Authority
Initiative being taken for Reduction of AT&C Losses
• 100% metering and improving billing &collection efficiency
• Metering of all 11 KV feeders &Distribution transformers for energyauditing
• Augmentation of overloaded distributionsystem under various schemes
• Implementation of HVDS
• Use of Arial bunched Conductors (ABC)
• IT initiative like SCADA, GIS, AMR etc
• Segregation of rural & agriculture feeders
• Online feeder data on power portal

Central Electricity Authority
RURAL ELECTRIFICATION
• As per census 2011, there are 5,97,464 inhabited villages in the country.
• At present about 2462 (0.4%) villages in the country are still un-
electrified and targeted to be electrified by May 2018.
• DDUGJY scheme- launched in Dec 2014 to provide funding to the states
to electrify all the un-electrified villages and to provide access to all the
households in the country. Under the scheme, more than 1,00,000
villages and more than 20 million Households have been electrified in
the country.
• At present, about 40 million HH are un-electrified in the country.
• Out of which, about 10 million HH under DDUGJY and about 30 million
under newly launched scheme SAUBHAGAYA are targeted to be
electrified by Dec 2018.
Central Electricity Authority
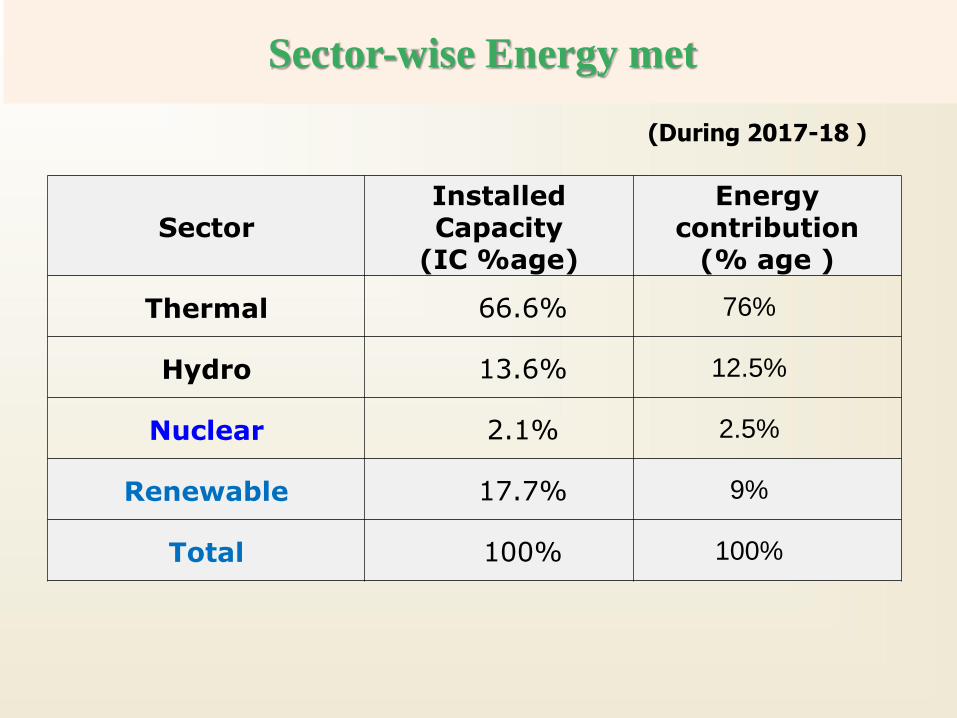
Initiatives for Energy Efficiency
• BEE ( Bureau of Energy Efficiency ) is the Nodal organization for taking energy efficiency measures
• Star labeling of Distribution Transformers
• Introduction of UJALA for providing LED to Domestic consumers for energy efficiency in domestic sector
• Introduction of LED based Street Lightning(NSLP)
• Star Rating of Consumer Appliances (A.C, Refrigerator , motors etc.)
• PAT(Perform Achieve & Trade) Scheme for Industries (Ph-I) and Discoms (Ph-II)

Central Electricity Authority
Govt. of India launched UnnatJyoti by Affordable LEDs for All (UJALA) in 2015 to
increase energy efficiency in lighting by replacing the inefficient conventional
incandescent bulbs in domestic sector and conventional street lighting by LED based
Efficient Lighting in the country.
Under UJALA , 77 Crore ( 770 Million) incandescent bulbs in the Country are
targeted to be replaced by high quality LED bulbs
Energy Efficiency Services Limited (EESL), a government company under the
administrative control of Ministry of Power is designated as the implementing agency
for UJALA .
Under UJALA, about 27.4 crores (274 Million)LED bulbs have been distributed by
10 Nov 2017 in the Country which on an average results into saving of 35600 MU
energy per year and avoiding 7128 MW peak demand .
Unnat Jyoti by Affordable LEDs for All (UJALA)

Central Electricity Authority
Govt. of India also launched Street Lighting National Programme (SLNP)
along with UJALA to increase energy efficiency in lighting by replacing
conventional street lighting by LED based Efficient Lighting in the country.
Under Street Lighting National Programme (SLNP), 3.5 crore (35 Million)
conventional street lights are targeted to be replaced with smart and energy
efficient LED street lights.
Energy Efficiency Services Limited (EESL), a government company under
the administrative control of Ministry of Power is designated as the
implementing agency for UJALA& SLNP.
Under Street Lighting National Programme (SLNP), about 38.75 lakhs (3.8
Million) energy efficient street light have been installed in the country by 10th
Nov ,2017 which on an average results into saving of 1.5MU energy per
day and avoiding 135 MW peak demand.
Street Lighting National Programme (SLNP)

Central Electricity Authority
Introduction of Smart Grid in IndiaInitiatives
India is not far behind developed nations for introduction of smart Grid in the country -rather forefront!
Journey So far - 2008-09: R-APDRP – Introduction of IT in distribution sector -basic
building blocks of Smart Grids
2011: India Smart Grid Task Force(ISTF) and India Smart Grid Forum (ISGF)
2012: approval of Smart Grid Pilot Projects
2013: release of Smart Grid Vision and Roadmap for India National Smart Grid Mission approved in 2015 for development of
smart grid in the country
Model Smart Grid Regulations approved in June 2015 by Forum of Regulators
Standards for Smart Meters (IS 16444) issued by Bureau of Indian Standards
Central Electricity Authority issued Functional requirement of Advanced Metering Infrastructure (AMI) in 2016
A SBD is being prepared by NSGM for Smart Grid projects

Central Electricity Authority
32
Initiatives
Smart Grid Pilots 15 pilot projects sanctioned with 50% funding by GOI having
functionalities like AMI for domestic and Industrial consumers, PLM, RE integration, OMS etc
12 pilots including Smart Grid Knowledge Center under implementation
~46,000 Smart Meters installed Rs.48.47 Cr. released as grant from MoP 11 Smart Grid Pilots to be completed by March 2018NSGM Projects 4 projects worth Rs.578 Cr. sanctioned for ~8.4 lakh smart meters
with 30% funding under NSGM
• Installation of smart meters is one of the operational performance parametersunder the Ujwal Discom Assurance Yojana (UDAY) launched by GOI in Nov 2015for financial turn around of the Discoms.
• As per tariff Policy 2016 and UDAY scheme, States have to install smart metersfor the consumers consuming more than 500 units/ month by Dec 2017 and forthe consumers consuming more than 200 units/ month by Dec 2019. ( about 35Million by Dec 2019)

Central Electricity Authority
Basic Functions of AMI as per Function requirement of AMI issued by CEA
Remote Meter data reading at configurable intervals(push/pull)
Time of day (TOD)/Time of use (TOU) metering
Pre paid functionality
Net Metering
Alarm/ Event detection, notification and reporting
Remote Load Limiter and connection/ disconnection at defined/on
demand conditions
Remote firmware upgrade
Integration with other existing systems like IVRS, Billing &
collection software, GIS mapping, consumer indexing, new
connection & disconnections, analysis software, Outage
Management System etc / Import of data from existing modules/
MDAS of RAPDRP where ever possible
Security features to prevent unauthorized access to the AMI
including Smart meter & meter data etc. and to ensure
authentication for all AMI elements by third party

Central Electricity Authority
General AMI System requirements
Smart Meters -Single Phase & Three Phase whole currentsmart meters shall comply with the Technical Specifications asincluded in the document (As per IS 16444/ IS 15959)
Communication infrastructure – RF/PLC/Cellular orcombination of these
Head End System(HES)
Meter Data Management System (MDMS)
Web application with updated on-line data of consumersetc.
Mobile App- through which consumer shall be able to seeinformation related to his energy consumption. App shallalso provide platform for implementation of peak loadmanagement functionality by providing existing tariff &incentives rates, participation options etc.

Central Electricity Authority
Key Components of AMI
AMI Architecture
Smart Meter RF/PLC DCU/ Access point HES
Communication Network
MDM
Data Reading
1Data Transportation
2Data acquisition & Control
3Data Analytics
4
Metering
Connect\Disconnect
Command & Control
Analytics & Response
Cellular
Revenue Protection
Outage Management
PrePayment

Central Electricity Authority
Challenges in Smart Meter Deployment in the Country
Low utility skill/ initiative to
implement the project
Upfront Capex investment a
challenge for utility
Utilities not having any proven
case – low confidence level
High meter/AMI costs₹
Information Asymmetry on
benefits of data analytics
36
Regulatory issues

Central Electricity Authority
Smart Metering –Way Forward
• EESL, a GOI agency, recently floated a tender for 50 lakh(5 million) smart meters for 2 States (Haryana and UP).
• Under this proposal, EESL will make the entire upfrontinvestment as well as maintain the entire infrastructurefor the next 7-8 years and recover its investment from thesavings accruing to the DISCOMs in subsequent yearsthrough reduction of AT&C losses.
• This approach has made the Smart Metering projectfeasible as most of the state utilities are not in a positionfor such rollouts due to their financial constraints.
• Now, all the enablers including standards and financialmodals for implementing smart metering in the countryare in place, States have to take initiatives forimplementation of Smart Metering in their respectiveDiscoms as Distribution of Electricity falls under thepurview of State Goverments in India.

Central Electricity Authority
THANK YOU