Embed Size (px)
Citation preview
Florida:An Overview of Foreclosures
Presented by:January 24, 2013
The Florida LegislatureOffice of Economic and
Demographic Research850.487.1402http://edr.state.fl.us
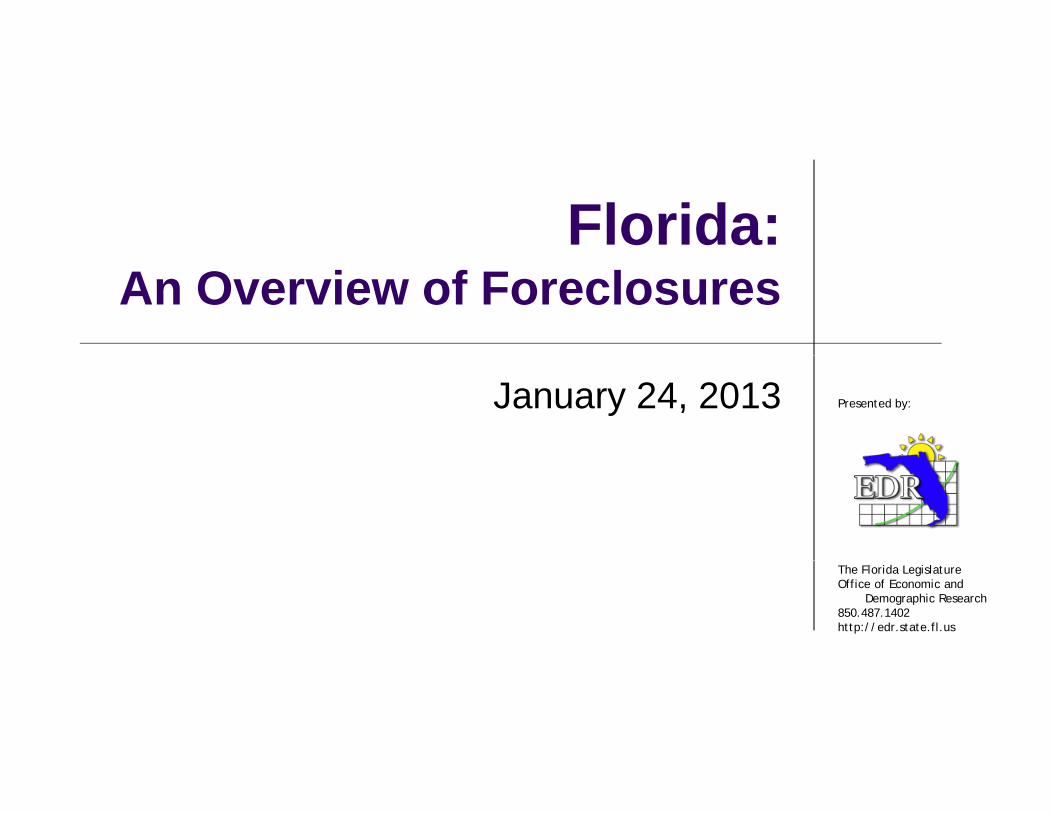
Foreclosure Activity Remains Daunting
2012 Calendar Year...2012 Calendar Year...Florida had highest Foreclosure Rate in the USfor the first time since the housing crisis began.(3.11% of housing units received at least 1 filing)
November 2012, compared to US:November 2012, compared to US:Florida foreclosure starts increased 20% from one year ago.
• 2nd Highest State for # of Filings • Highest State for Foreclosure Rate• Among US Metro Area rates: seven of the top 10
highest metro rates in the nation were in Florida. Palm Bay-Melbourne-Titusville #1Ocala #2Jacksonville #4Jacksonville #4
Data from RealtyTrac
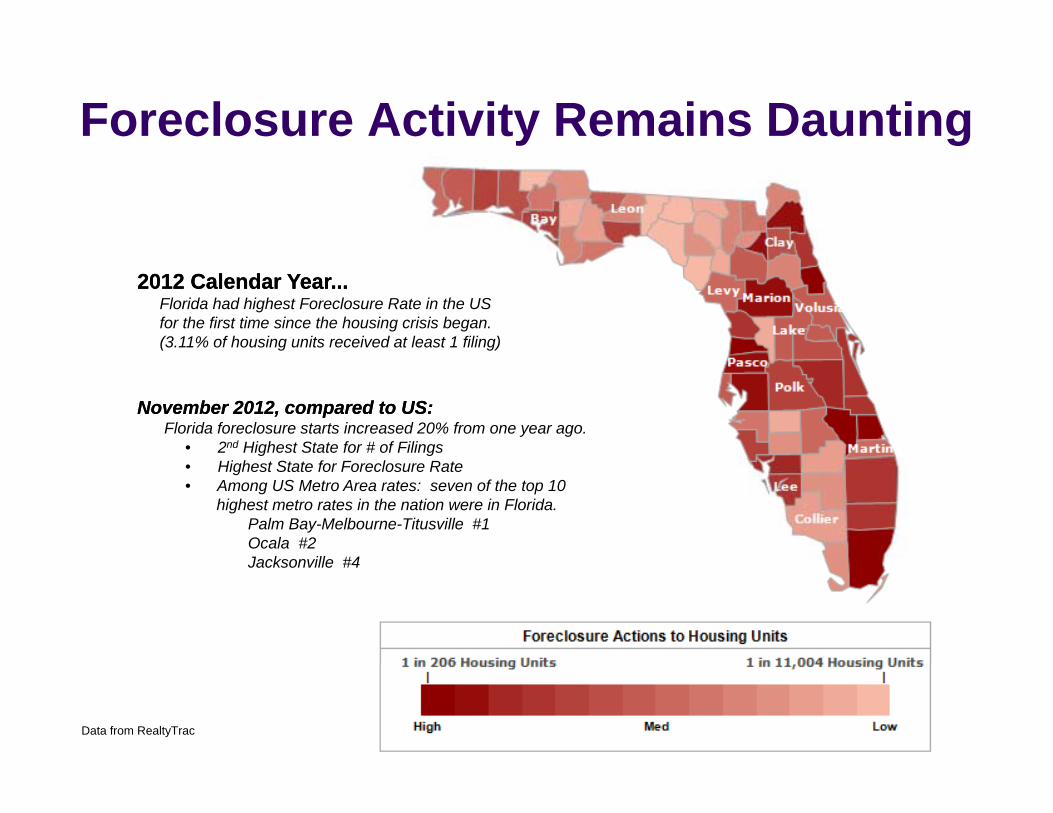
Percent of Loans in Foreclosure
Foreclosure Inventory:11.02% of Residential Loans
(N 2012)(Nov 2012)
Highest Counties:•Okeechobee at 16.78%Miami Dade at 15 65%
Lowest Counties:•Sumter at 5.26%•Alachua at 5 80%•Miami-Dade at 15.65%
•DeSoto at 15.36%•Alachua at 5.80%•St. Johns at 5.88%•Leon at 5.97%
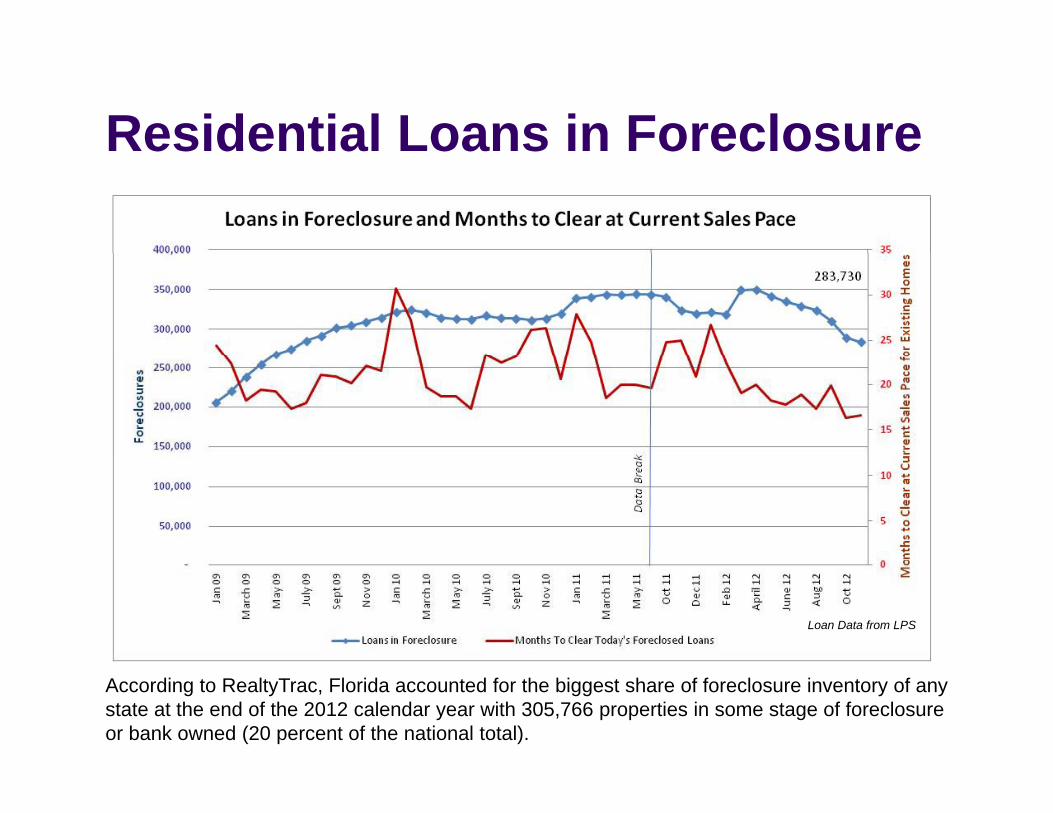
Residential Loans in ForeclosureResidential Loans in Foreclosure
Loan Data from LPS
According to RealtyTrac, Florida accounted for the biggest share of foreclosure inventory of any state at the end of the 2012 calendar year with 305,766 properties in some stage of foreclosure or bank owned (20 percent of the national total).
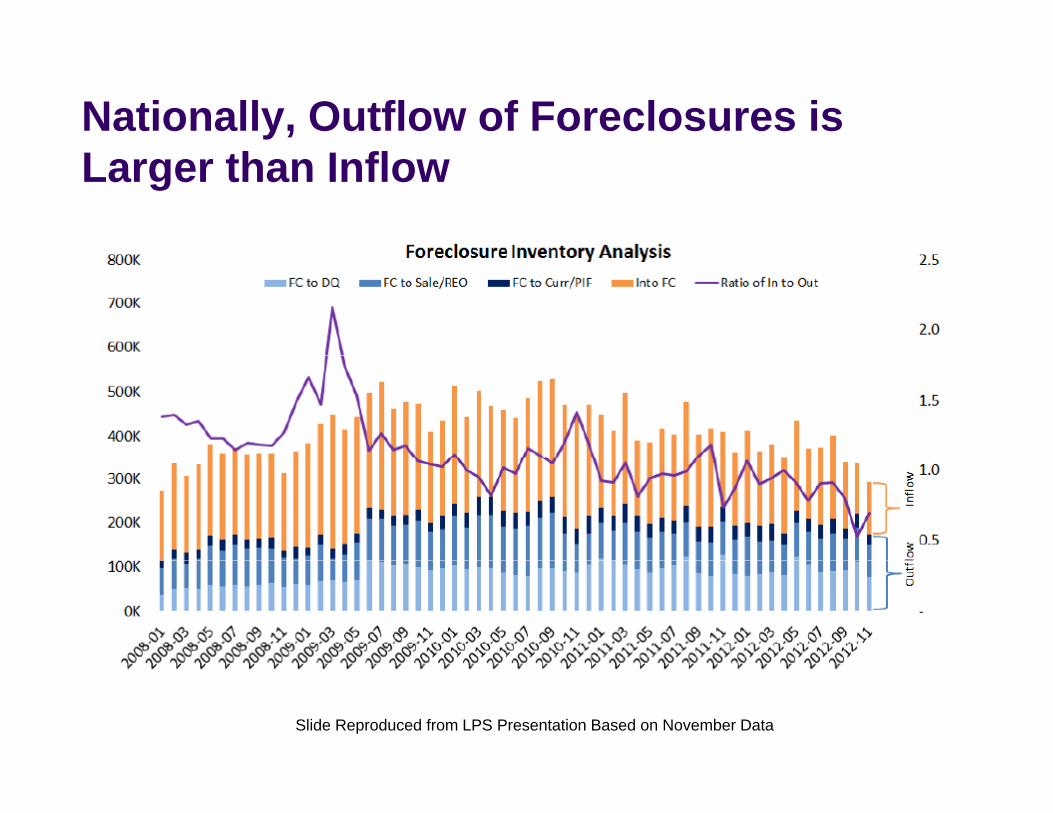
Nationally, Outflow of Foreclosures is Larger than Inflow
Slide Reproduced from LPS Presentation Based on November Data
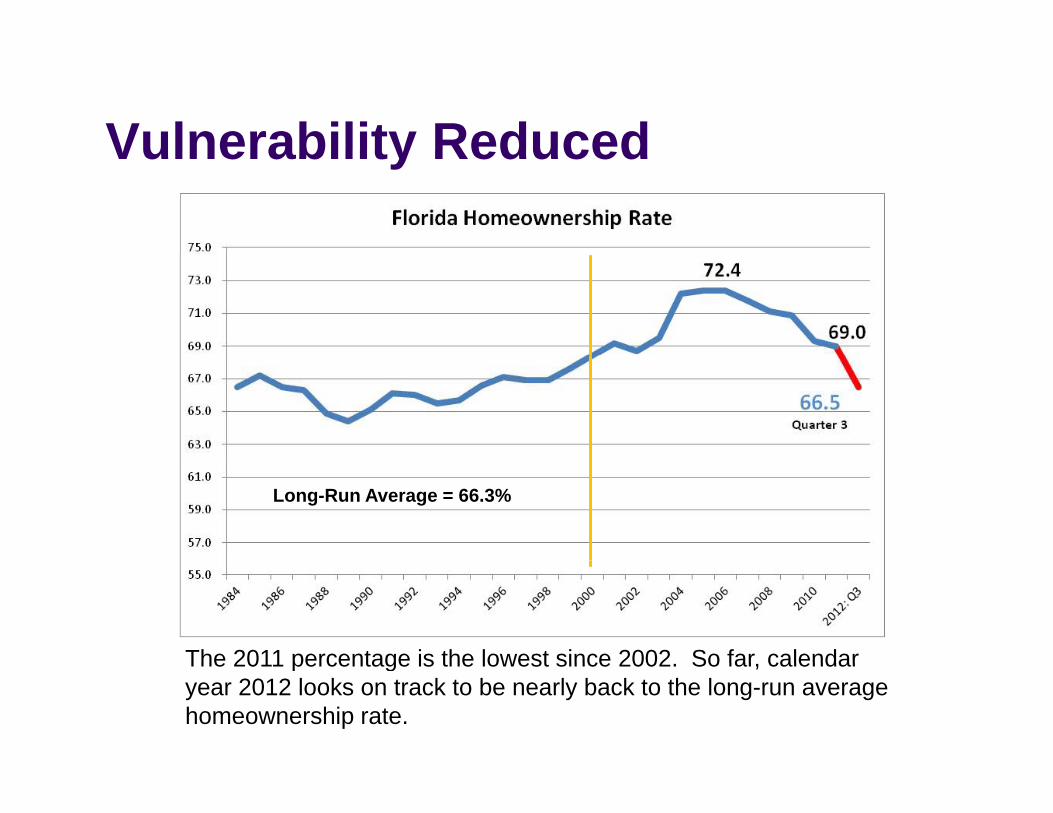
Vulnerability ReducedVulnerability Reduced
Long-Run Average = 66.3%
The 2011 percentage is the lowest since 2002 So far calendarThe 2011 percentage is the lowest since 2002. So far, calendar year 2012 looks on track to be nearly back to the long-run average homeownership rate.
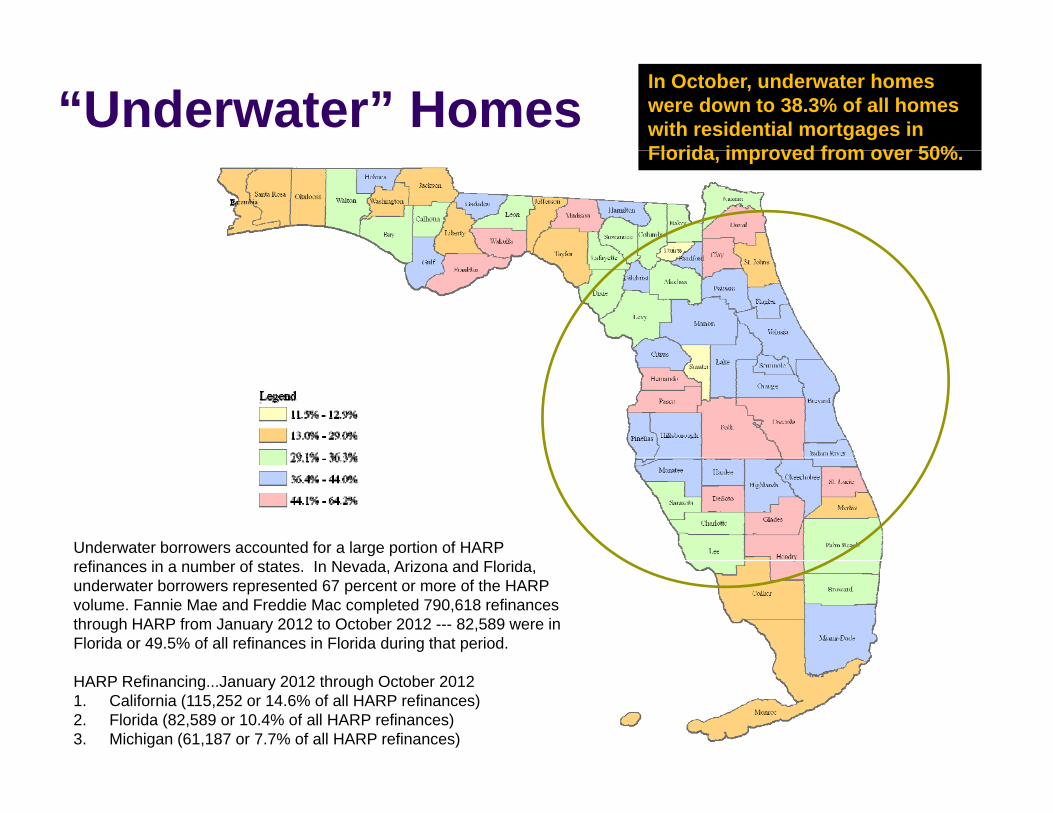
“Underwater” HomesIn October, underwater homes were down to 38.3% of all homes with residential mortgages in Florida improved from over 50%Florida, improved from over 50%.
Underwater borrowers accounted for a large portion of HARP fi i b f I N d A i d Fl idrefinances in a number of states. In Nevada, Arizona and Florida,
underwater borrowers represented 67 percent or more of the HARP volume. Fannie Mae and Freddie Mac completed 790,618 refinances through HARP from January 2012 to October 2012 --- 82,589 were in Florida or 49.5% of all refinances in Florida during that period.
HARP Refinancing...January 2012 through October 20121. California (115,252 or 14.6% of all HARP refinances) 2. Florida (82,589 or 10.4% of all HARP refinances) 3. Michigan (61,187 or 7.7% of all HARP refinances)
Upstream from Foreclosure...BetterUpstream from Foreclosure...Better“Exotic” financing practices during the boom.
In 2006, almost 47% of all mortgages in the state were considered to be innovative (interest only and pay option adjustable rate mortgages). A significant number of these have worked out of the system.
Still relatively high unemployment—and—high long-term unemployment Florida’s December unemployment rate of 8.0% was higher than the nation as a whole (7.8%), but down from the highest level in the Great Recession of 11.4% in 2010. In 2012, 50.9% of all FL unemployed were at 27 weeks or more.
Underwater Homes (owe more than the home is worth)Underwater Homes (owe more than the home is worth)In October, underwater homes were down to 38.3% of all residential mortgages in Florida. Hendry County had the highest percentage at 64.2%, followed by Glades County at 56.3%. This data has improved over the past year, but still includes about 750 000 h750,000 homes.
Declining Property Values from Peak2012 school taxable value registered a slight decline (-0.88%), but 2013 taxable value is expected to turn positive (+0 75%)is expected to turn positive (+0.75%).Florida’s December median sales price for existing homes was down 40.3% from its peak, but better than the 52.7% seen February 2011.
Foreclosure Process Itself is a FactorForeclosure Process Itself is a FactorThere are 20 states that primarily practice judicial f l Fl id i f thforeclosure --- Florida is one of them.
The judicial foreclosure process typically begins after a period of delinquency that results in an alleged default, with the lender filing a pending complaint and a LisPendens (notice of intent to begin the foreclosure ( gprocess in court) with the Clerk of the Court.
Relative to a non-judicial process:Relative to a non judicial process:Judicial process takes longer--- can be more than twice as long.Judicial process was affected to a greater degree by “Robo-Signing” scandal. In this regard, the foreclosure pipeline in judicial states is still at elevated levels as the backlog continues to be worked off.Seven of the top ten states for total non-current are judicial states.
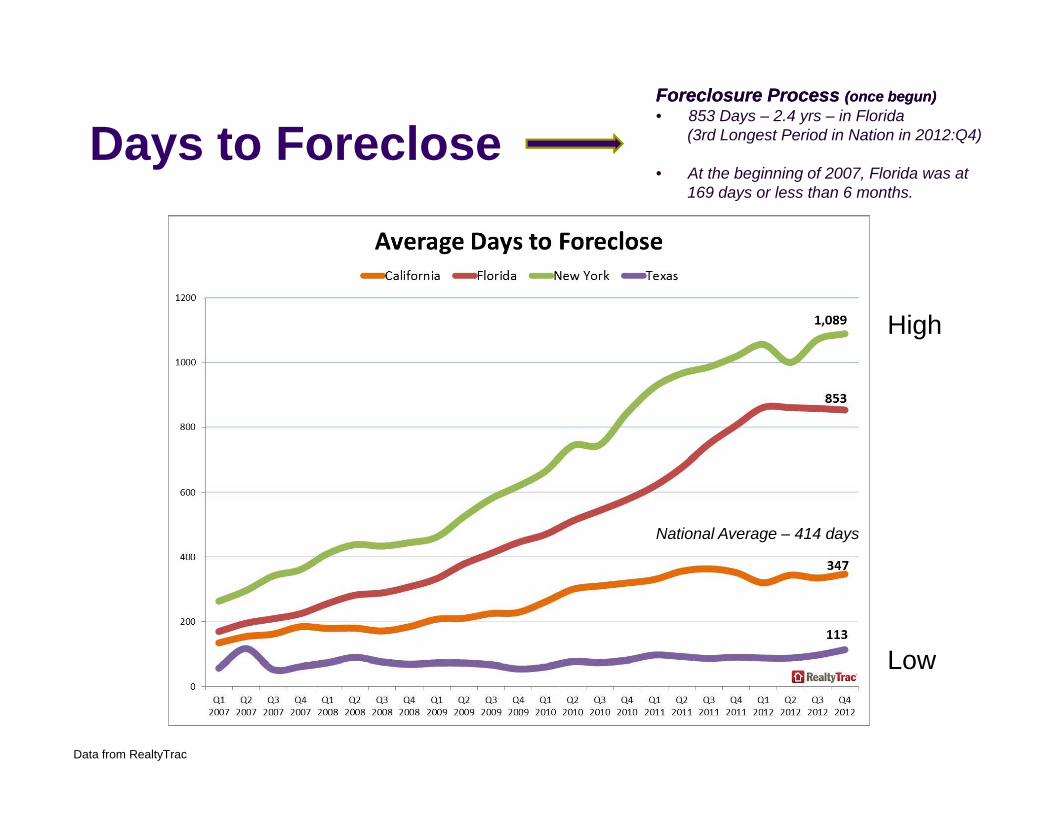
Days to ForecloseForeclosure Process Foreclosure Process (once begun)(once begun)• 853 Days – 2.4 yrs – in Florida
(3rd Longest Period in Nation in 2012:Q4)Days to Foreclose• At the beginning of 2007, Florida was at
169 days or less than 6 months.
High
National Average – 414 days
Low
Data from RealtyTrac
Low
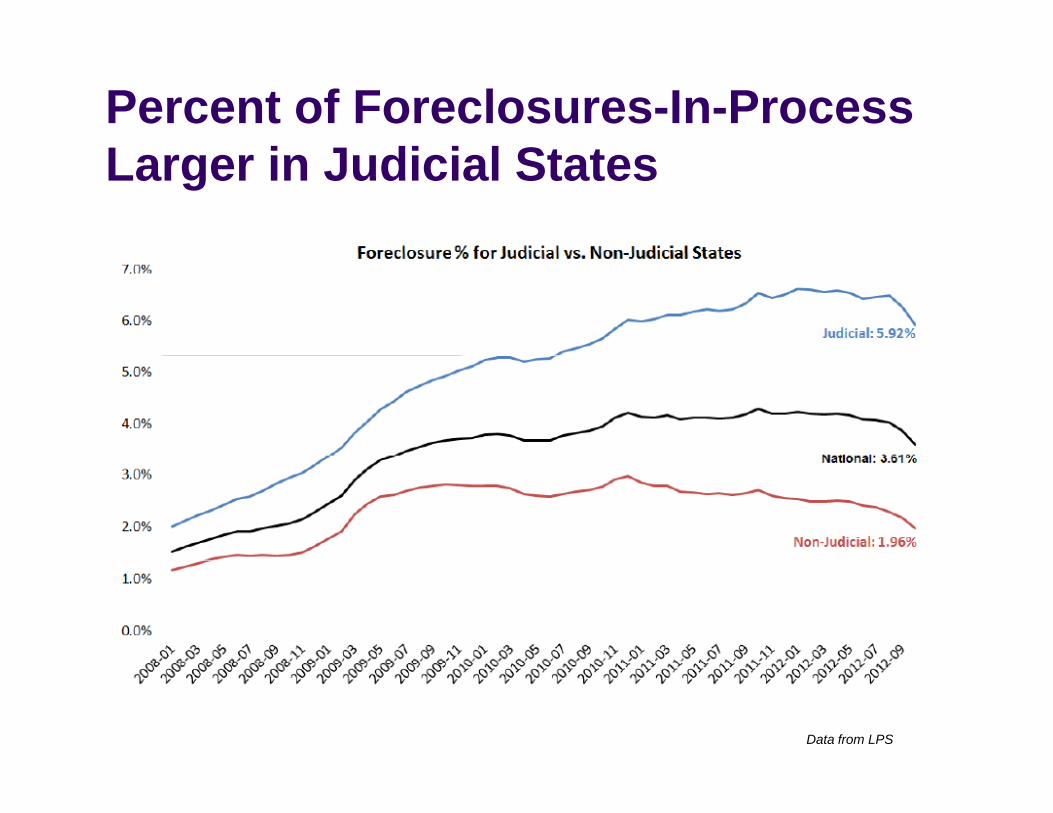
Percent of Foreclosures-In-Process L i J di i l St tLarger in Judicial States
Data from LPS
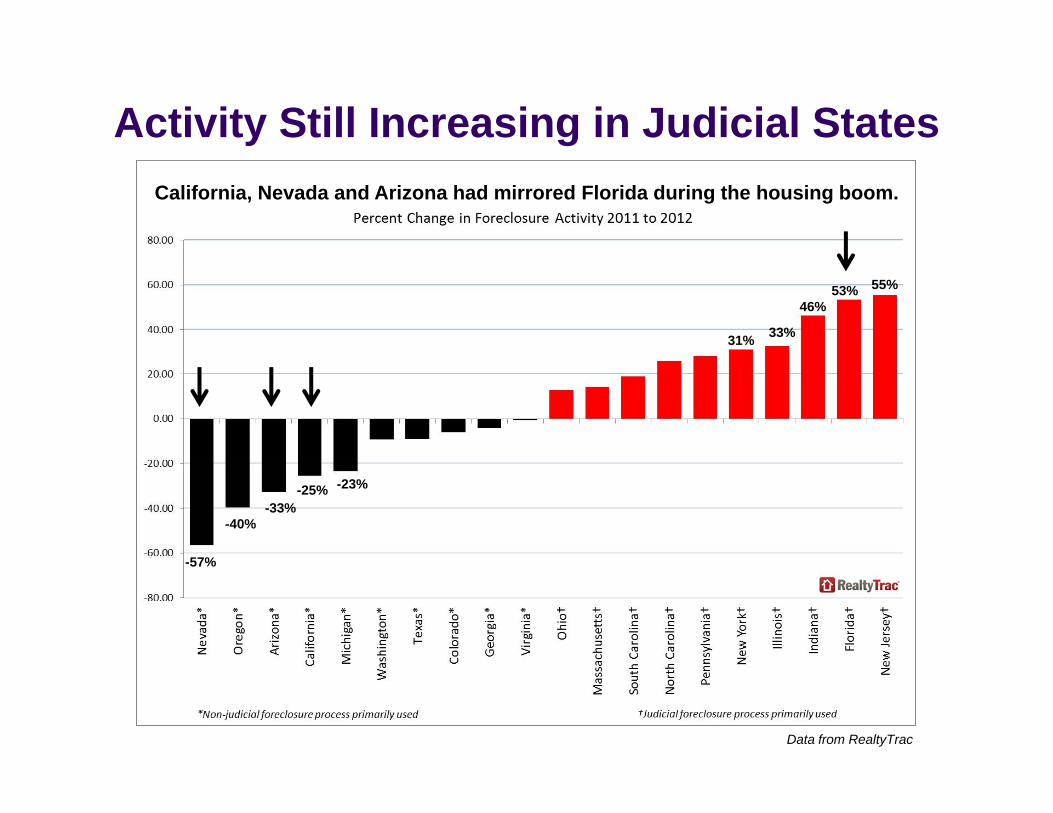
Activity Still Increasing in Judicial StatesCalifornia, Nevada and Arizona had mirrored Florida during the housing boom.
53% 55%46%
33%31%
57%
-40%-33%
-25% -23%
-57%
Data from RealtyTrac
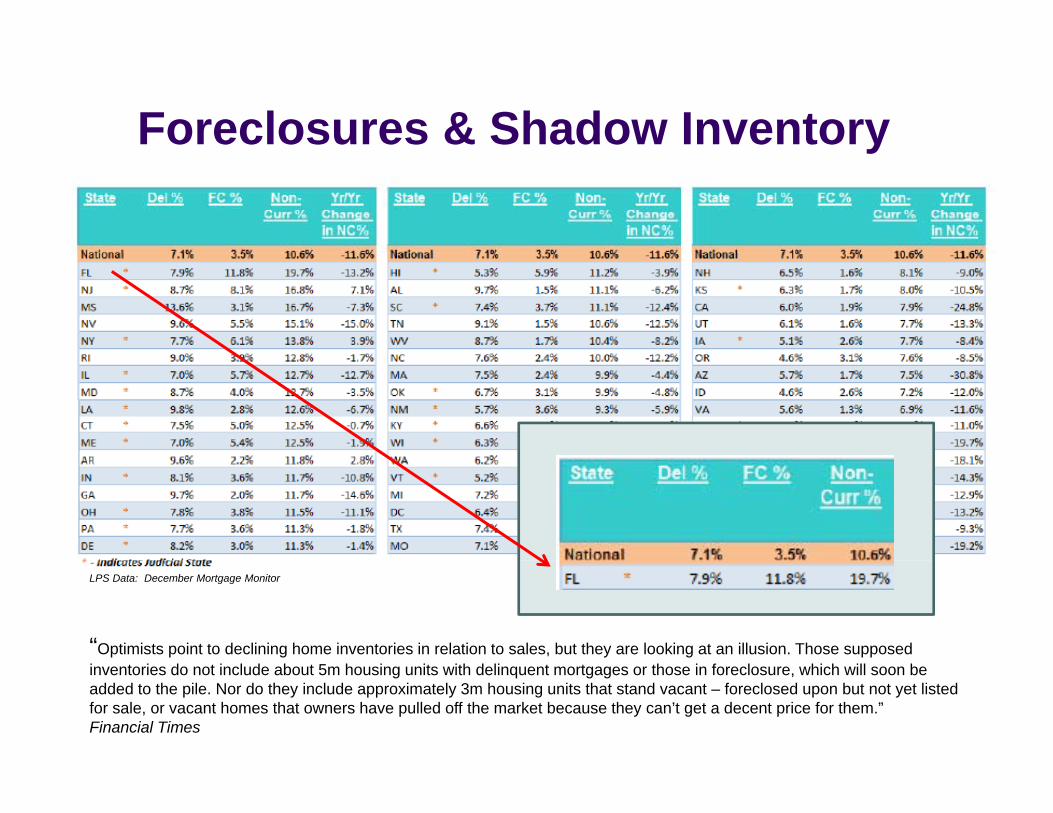
Foreclosures & Shadow Inventoryy
LPS Data: December Mortgage Monitor
“Optimists point to declining home inventories in relation to sales, but they are looking at an illusion. Those supposed inventories do not include about 5m housing units with delinquent mortgages or those in foreclosure, which will soon be added to the pile. Nor do they include approximately 3m housing units that stand vacant – foreclosed upon but not yet listed for sale, or vacant homes that owners have pulled off the market because they can’t get a decent price for them.” Financial Times
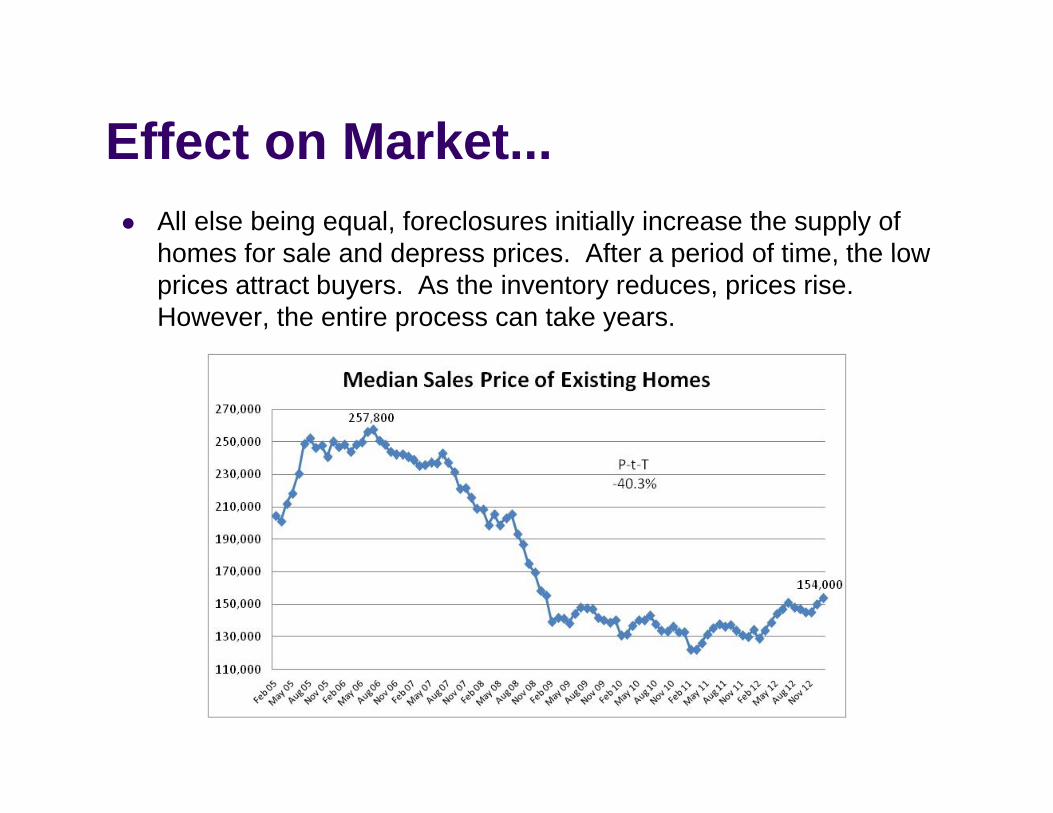
Effect on MarketEffect on Market...All else being equal, foreclosures initially increase the supply of homes for sale and depress prices After a period of time the lowhomes for sale and depress prices. After a period of time, the low prices attract buyers. As the inventory reduces, prices rise. However, the entire process can take years.

REC Foreclosure Forecast
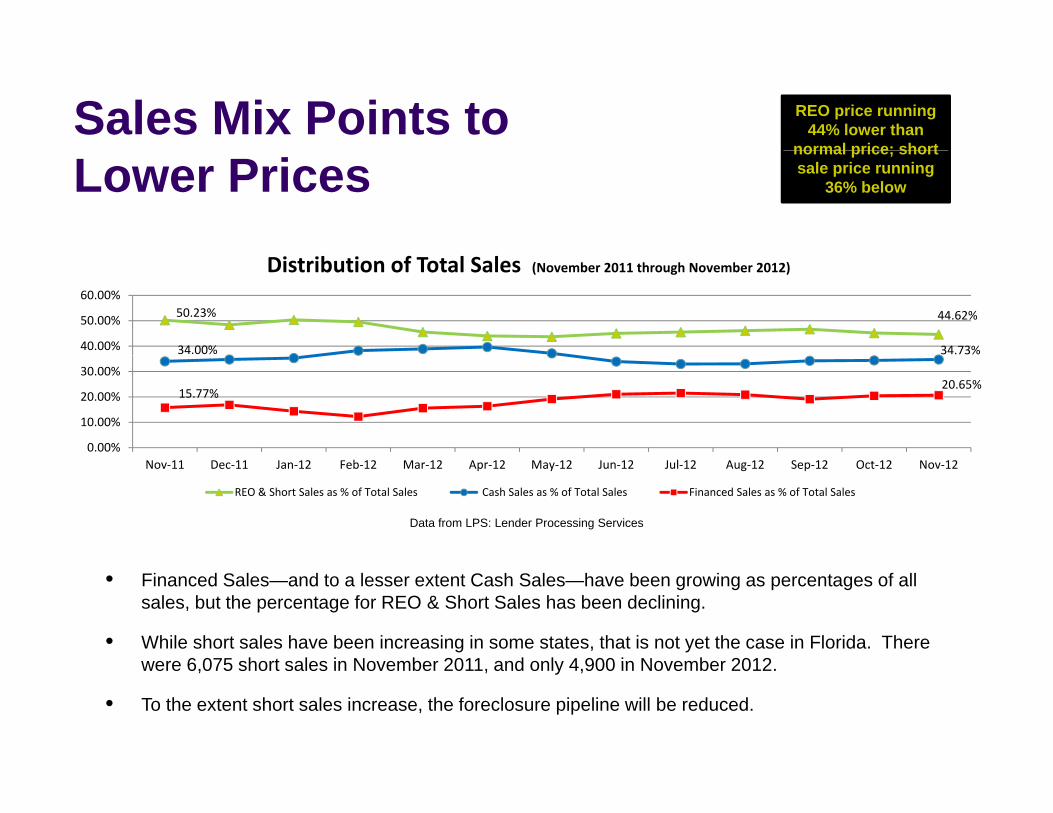
Sales Mix Points to REO price running 44% lower than
normal price; short
Lower Pricesnormal price; short sale price running
36% below
50.23% 44.62%
34.00% 34.73%40.00%
50.00%
60.00%
Distribution of Total Sales (November 2011 through November 2012)
15.77%20.65%
0.00%
10.00%
20.00%
30.00%
Data from LPS: Lender Processing Services
Nov‐11 Dec‐11 Jan‐12 Feb‐12 Mar‐12 Apr‐12 May‐12 Jun‐12 Jul‐12 Aug‐12 Sep‐12 Oct‐12 Nov‐12
REO & Short Sales as % of Total Sales Cash Sales as % of Total Sales Financed Sales as % of Total Sales
• Financed Sales—and to a lesser extent Cash Sales—have been growing as percentages of all sales, but the percentage for REO & Short Sales has been declining.
• While short sales have been increasing in some states, that is not yet the case in Florida. There were 6 075 short sales in November 2011 and only 4 900 in November 2012were 6,075 short sales in November 2011, and only 4,900 in November 2012.
• To the extent short sales increase, the foreclosure pipeline will be reduced.
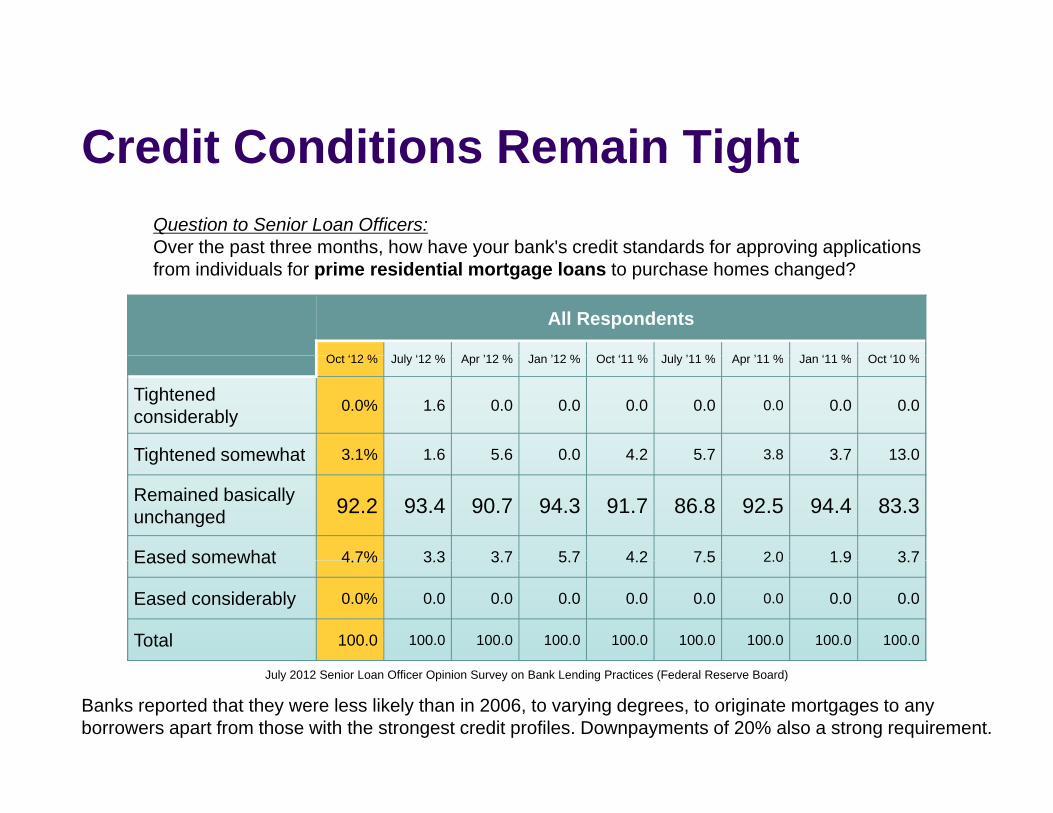
Credit Conditions Remain TightCredit Conditions Remain TightQuestion to Senior Loan Officers:Over the past three months, how have your bank's credit standards for approving applicationsOver the past three months, how have your bank s credit standards for approving applications from individuals for prime residential mortgage loans to purchase homes changed?
All Respondents
O t ‘12 % J l ‘12 % A ’12 % J ’12 % O t ‘11 % J l ’11 % A ’11 % J ‘11 % O t ‘10 %Oct ‘12 % July ‘12 % Apr ’12 % Jan ’12 % Oct ‘11 % July ’11 % Apr ’11 % Jan ‘11 % Oct ‘10 %
Tightened considerably 0.0% 1.6 0.0 0.0 0.0 0.0 0.0 0.0 0.0
Tightened somewhat 3 1% 1 6 5 6 0 0 4 2 5 7 3.8 3 7 13 0Tightened somewhat 3.1% 1.6 5.6 0.0 4.2 5.7 3.8 3.7 13.0
Remained basically unchanged 92.2 93.4 90.7 94.3 91.7 86.8 92.5 94.4 83.3
Eased somewhat 4 7% 3 3 3 7 5 7 4 2 7 5 2.0 1 9 3 7Eased somewhat 4.7% 3.3 3.7 5.7 4.2 7.5 2.0 1.9 3.7
Eased considerably 0.0% 0.0 0.0 0.0 0.0 0.0 0.0 0.0 0.0
Total 100.0 100.0 100.0 100.0 100.0 100.0 100.0 100.0 100.0
July 2012 Senior Loan Officer Opinion Survey on Bank Lending Practices (Federal Reserve Board)
Banks reported that they were less likely than in 2006, to varying degrees, to originate mortgages to any borrowers apart from those with the strongest credit profiles. Downpayments of 20% also a strong requirement.

U id Ri k f C t tiUpside Risk for Construction
Th “ h d i t ” f h th t i f lThe “shadow inventory” of homes that are in foreclosure or carry delinquent or defaulted mortgages may contain a significant number of “ghost” homes that are distressed beyond realistic
i th t th h t b h i ll i t i duse, in that they have not been physically maintained or are located in distressed pockets that will not come back in a reasonable timeframe. This means that the supply has become t ti d i bl h d i l di t d htwo-tiered – viable homes and seriously distressed homes.
To the extent that the number of viable homes is limited, new construction may come back quicker than expected.