Embed Size (px)
Citation preview
Ken Newman, USFWS, Lodiwith Denise Barnard and Lara Mitchell
5 December 2017
An overview of Enhanced Delta Smelt Monitoring (EDSM) Program
An overview of Enhanced Delta Smelt Monitoring (EDSM) Program
U.S. Fish & Wildlife Service
Outline
I. Objectives – why EDSM exists
II. EDSM Design: (a) Phases, (b) Study Area, (c) Strata, (d) GRTS selection, (e) Data Collection, (f) Data Analysis
III. Results
IV. Comments, Concerns, Criticisms
V. Final Remarks
2
U.S. Fish & Wildlife Service
I. Objectives
1. Estimate total Delta Smelt (DS) abundance for all life stages on a weekly to bi‐weekly basis, along with standard errors
2. Estimate spatial dist’n of DS at relevant spatial‐temporal resolution, e.g., proportion of adults at risk of entrainment
3. Provide early warning of potential adult DS entrainment
3

U.S. Fish & Wildlife Service
I. Objectives
4. Provide data for estimating and modeling adult entrainment
5. To compare EDSM estimates with those from existing surveys
6. To provide data for independent assessment of Life Cycle Model predictions
7. To potentially assist other studies, e.g., USBR Directed Outflow Project
4
U.S. Fish & Wildlife Service
1. Objectives and WIIN ActStart of EDSM and passage of Water Infrastructure Improvements for the Nation (WIIN) Act nearly coincided in December 2016.
One WIIN mandate (amongst many): “(Sec.4010) The bill requires Interior to conduct, with respect to Delta smelt, increased monitoring anda distribution study.”
EDSM is potentially the means of fulfilling this mandate (a view partially echoed by letters to FWS Regional Director from Sen. Feinstein, Coalition for a Sustainable Delta, and the Metropolitan Water District: with improvements suggested)
5
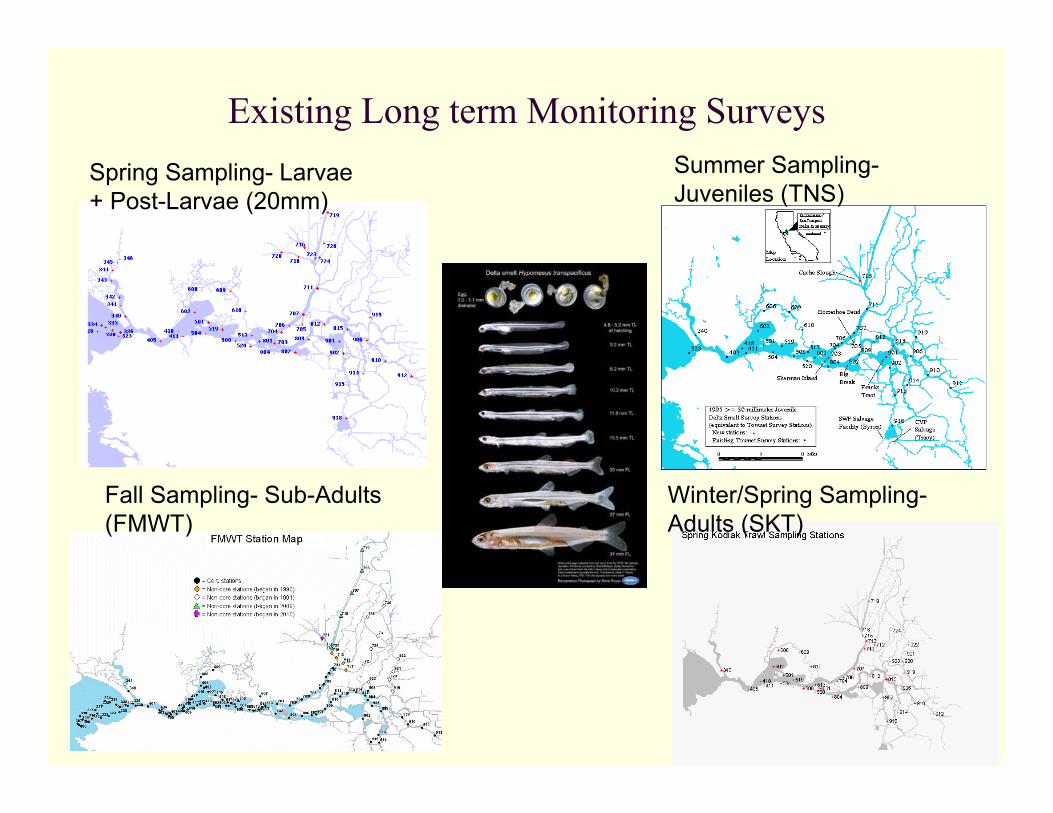
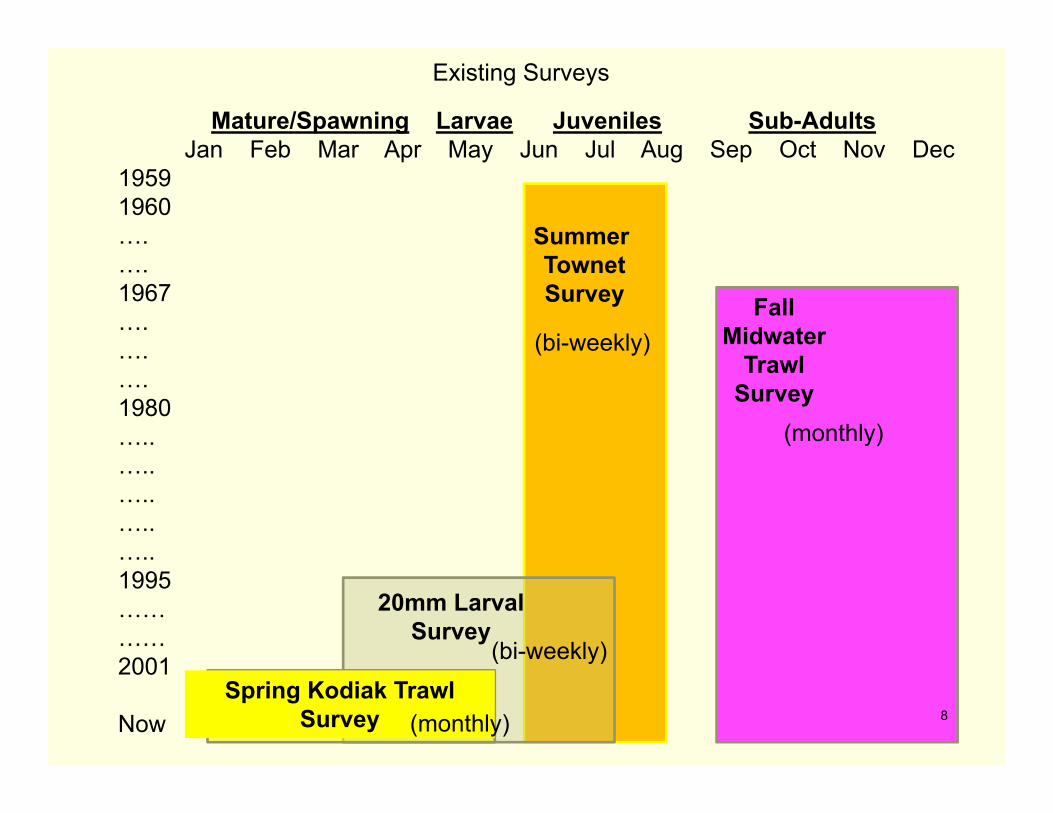
Existing Long term Monitoring Surveys
6
Spring Sampling- Larvae + Post-Larvae (20mm)
Summer Sampling-Juveniles (TNS)
Fall Sampling- Sub-Adults (FMWT)
Winter/Spring Sampling-Adults (SKT)
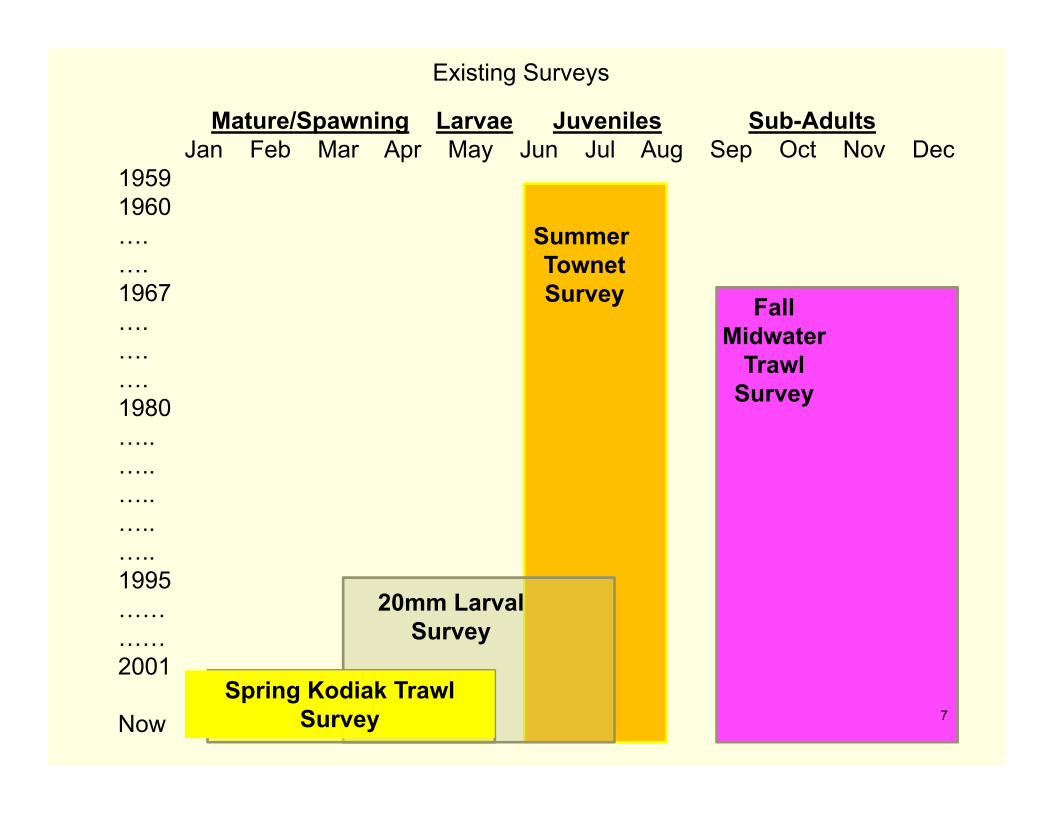
Mature/Spawning Larvae Juveniles Sub-AdultsJan Feb Mar Apr May Jun Jul Aug Sep Oct Nov Dec
19591960….….1967….….….1980…..…..…..…..…..1995…………2001
Now
Summer TownetSurvey Fall
MidwaterTrawl
Survey
20mm LarvalSurvey
Spring Kodiak Trawl Survey 7
Existing Surveys
Mature/Spawning Larvae Juveniles Sub-AdultsJan Feb Mar Apr May Jun Jul Aug Sep Oct Nov Dec
19591960….….1967….….….1980…..…..…..…..…..1995…………2001
Now
Summer TownetSurvey Fall
MidwaterTrawl
Survey
20mm LarvalSurvey
Spring Kodiak Trawl Survey 8
Existing Surveys
(bi-weekly)
(monthly)
(monthly)
(bi-weekly)
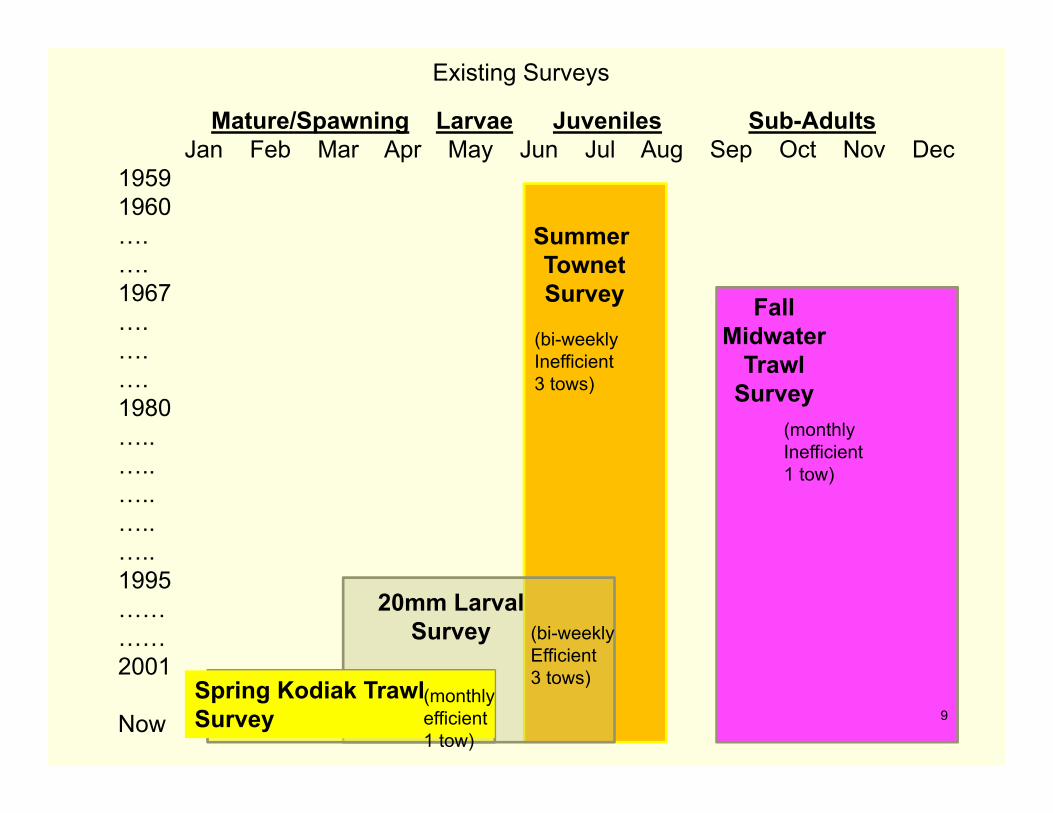
Mature/Spawning Larvae Juveniles Sub-AdultsJan Feb Mar Apr May Jun Jul Aug Sep Oct Nov Dec
19591960….….1967….….….1980…..…..…..…..…..1995…………2001
Now
Summer TownetSurvey Fall
MidwaterTrawl
Survey
20mm LarvalSurvey
Spring Kodiak Trawl Survey 9
Existing Surveys
(bi-weeklyEfficient3 tows)
(monthlyInefficient1 tow)
(monthlyefficient1 tow)
(bi-weeklyInefficient3 tows)
U.S. Fish & Wildlife Service
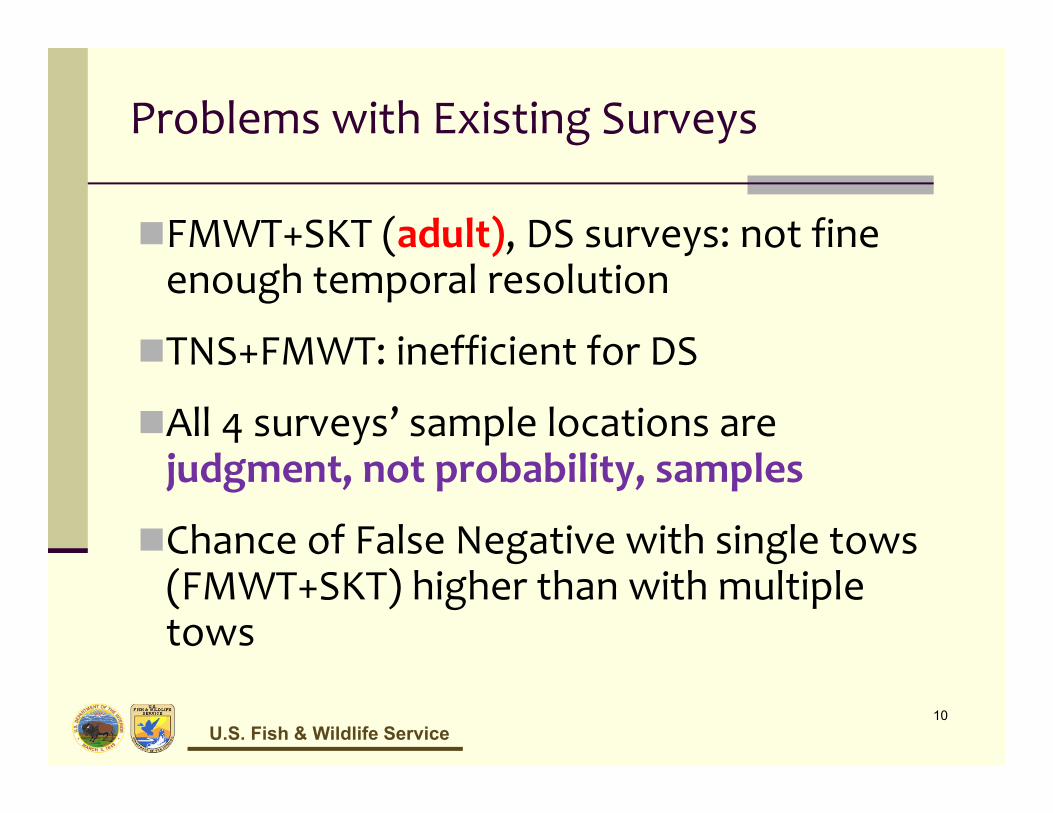
Problems with Existing Surveys
FMWT+SKT (adult), DS surveys: not fine enough temporal resolution
TNS+FMWT: inefficient for DS
All 4 surveys’ sample locations are judgment, not probability, samples
Chance of False Negative with single tows (FMWT+SKT) higher than with multiple tows
10
U.S. Fish & Wildlife Service
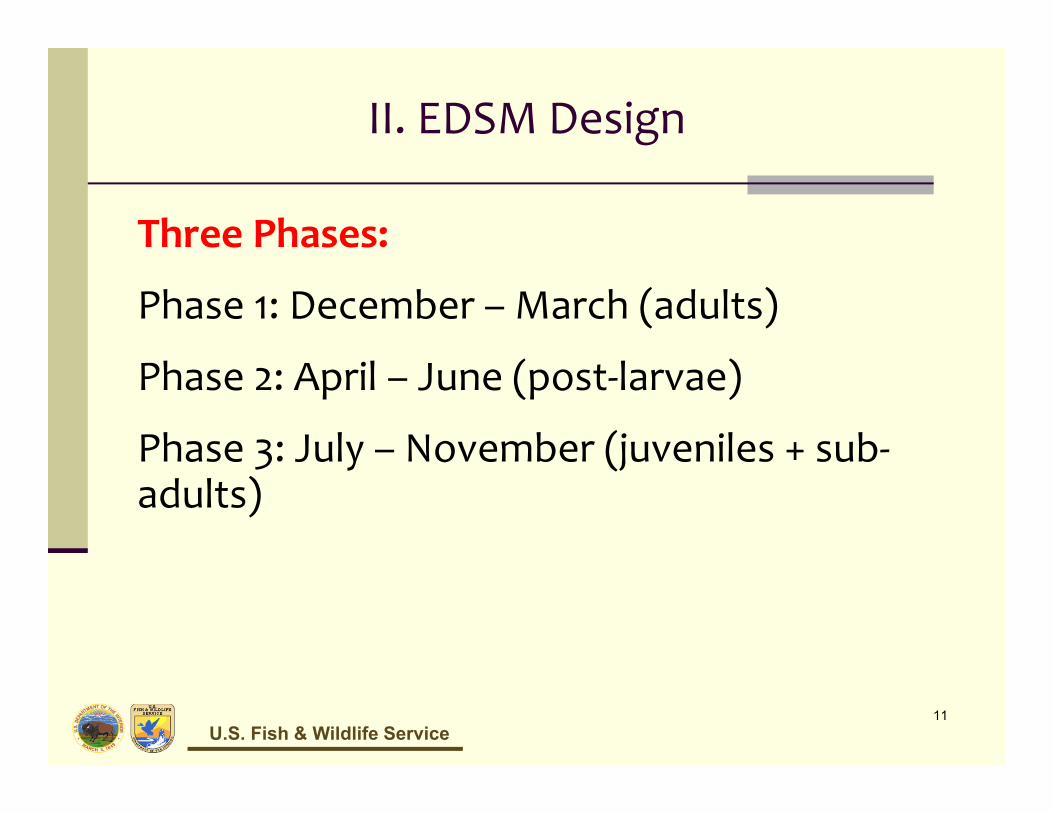
II. EDSM Design
Three Phases:
Phase 1: December – March (adults)
Phase 2: April – June (post‐larvae)
Phase 3: July – November (juveniles + sub‐adults)
11
U.S. Fish & Wildlife Service
II. EDSM Design
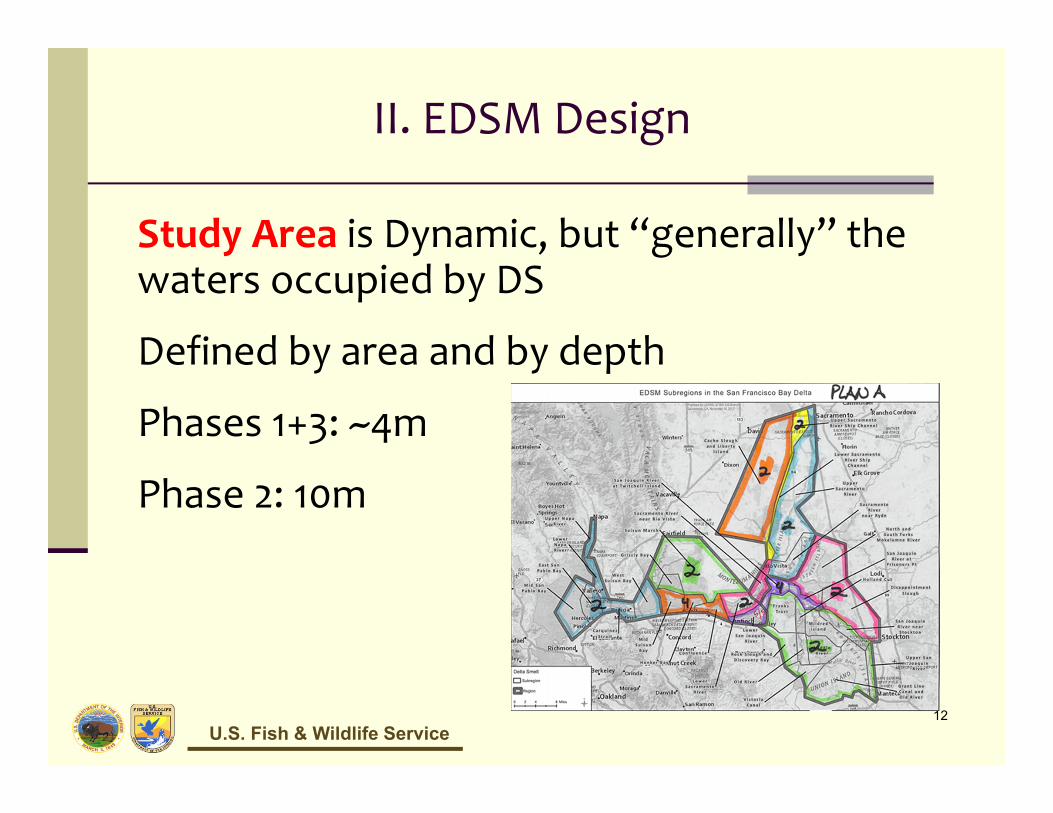
Study Area is Dynamic, but “generally” the waters occupied by DS
Defined by area and by depth
Phases 1+3: ~4m
Phase 2: 10m
12
U.S. Fish & Wildlife Service
II. EDSM Design
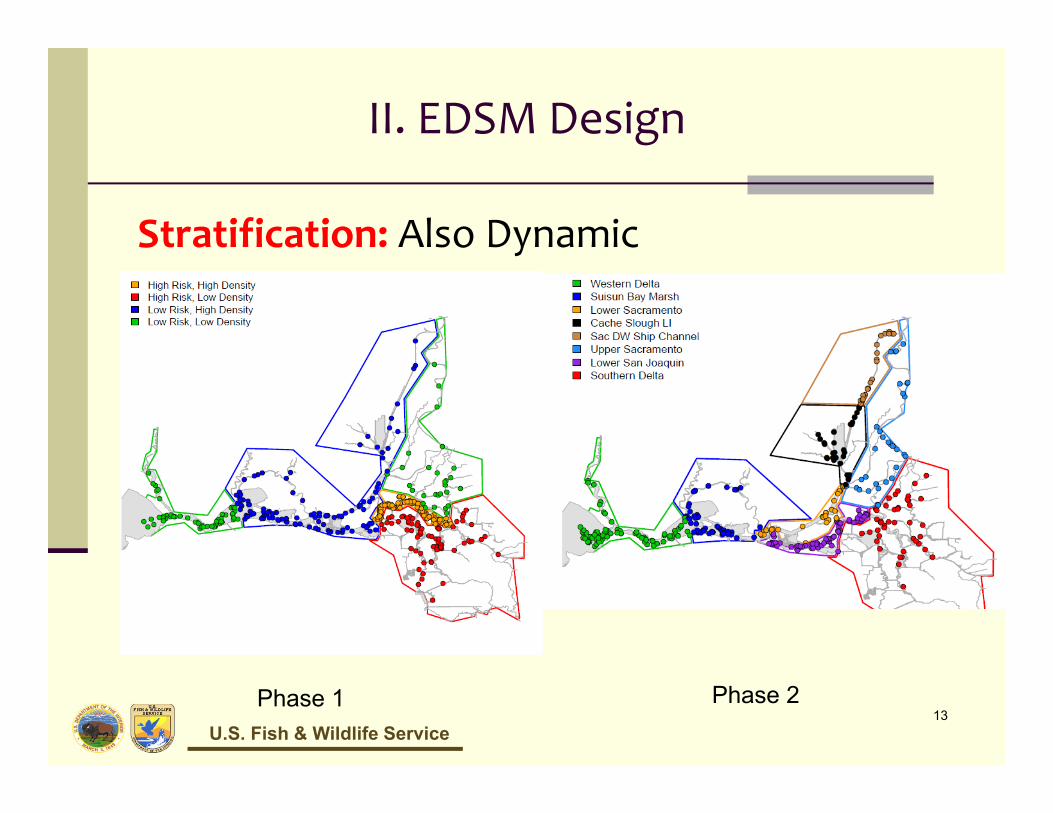
Stratification: Also Dynamic
13Phase 1 Phase 2
U.S. Fish & Wildlife Service
II. EDSM Design
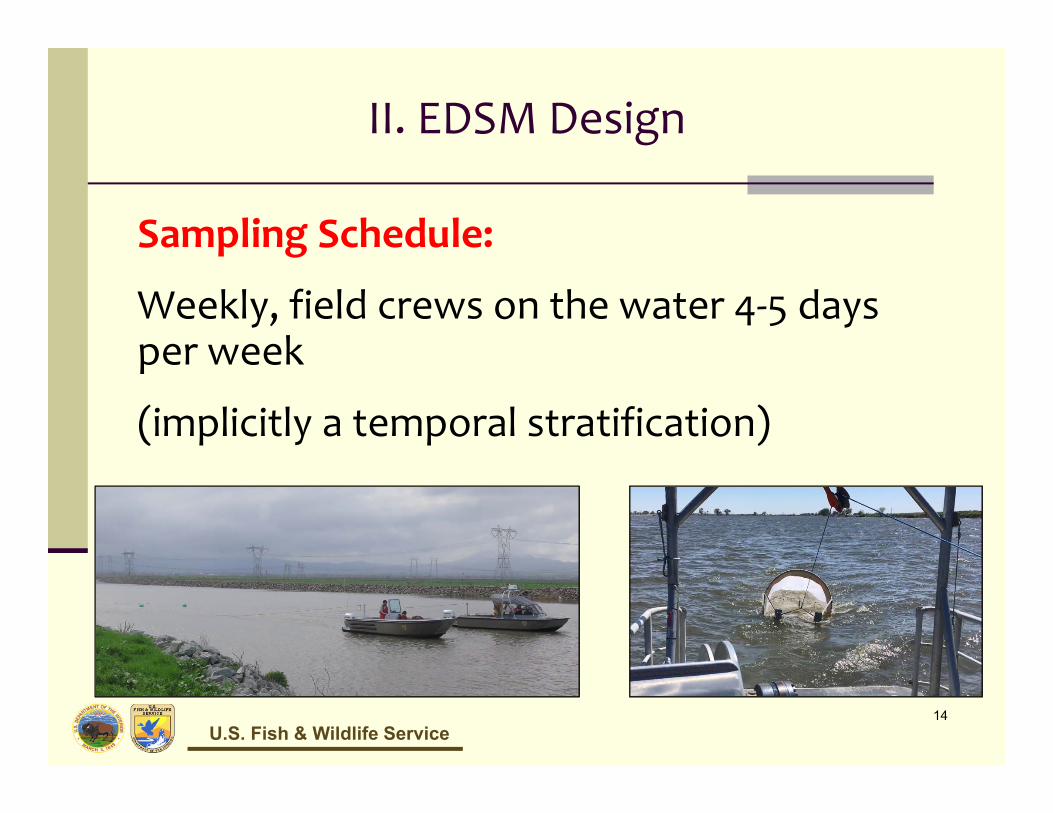
Sampling Schedule:
Weekly, field crews on the water 4‐5 days per week
(implicitly a temporal stratification)
14
U.S. Fish & Wildlife Service
II. EDSM Design
Sample Site Selection:
Within each stratum, equal probability Generalized Random Tesselation Stratified (GRTS; Stevens and Olsen 2004) sampling.
Plusses: spatially dispersed probability sample
Minuses: complex 15

U.S. Fish & Wildlife Service
GRTS vs Systematic or IndependentRandom sample
Systematic Sample => spatially dispersed but only 1st point is random—difficult to estimate variance.
Independent Random Sample => each point is random, but can lead to clumping.
Olsen, et 2012
IRSGRTS
U.S. Fish & Wildlife Service
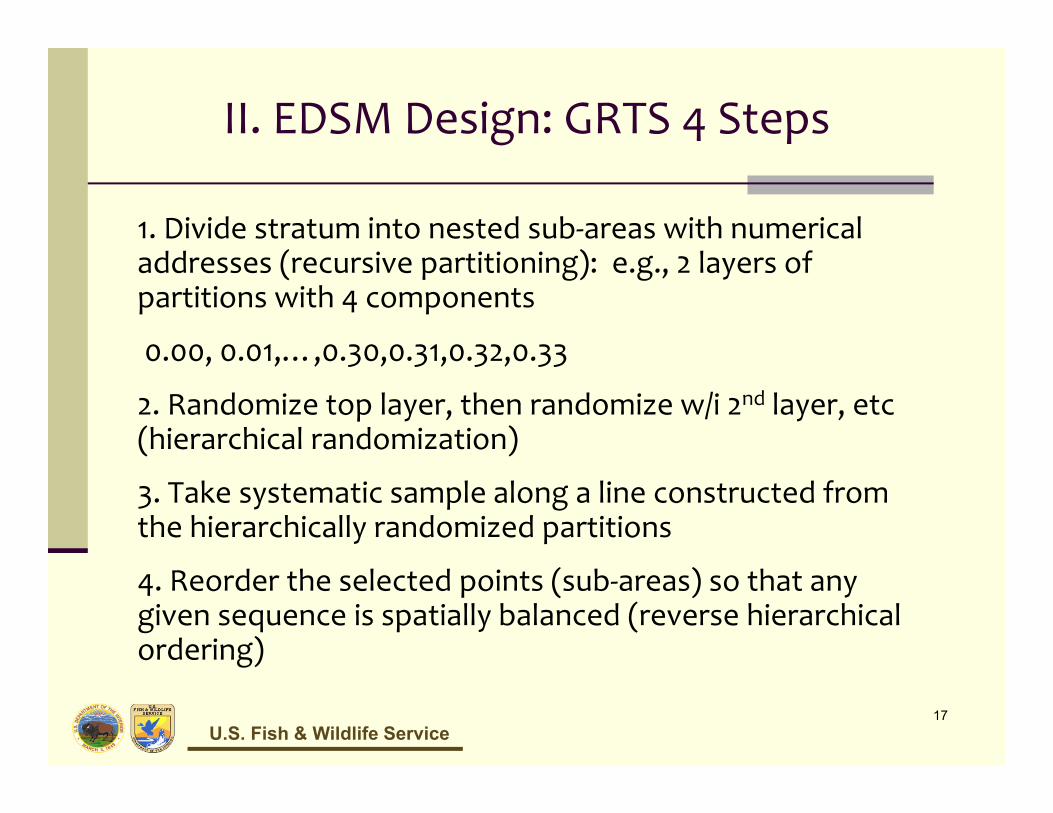
II. EDSM Design: GRTS 4 Steps
1. Divide stratum into nested sub‐areas with numerical addresses (recursive partitioning): e.g., 2 layers of partitions with 4 components
0.00, 0.01,…,0.30,0.31,0.32,0.33
2. Randomize top layer, then randomize w/i 2nd layer, etc(hierarchical randomization)
3. Take systematic sample along a line constructed from the hierarchically randomized partitions
4. Reorder the selected points (sub‐areas) so that any given sequence is spatially balanced (reverse hierarchical ordering)
17
U.S. Fish & Wildlife Service
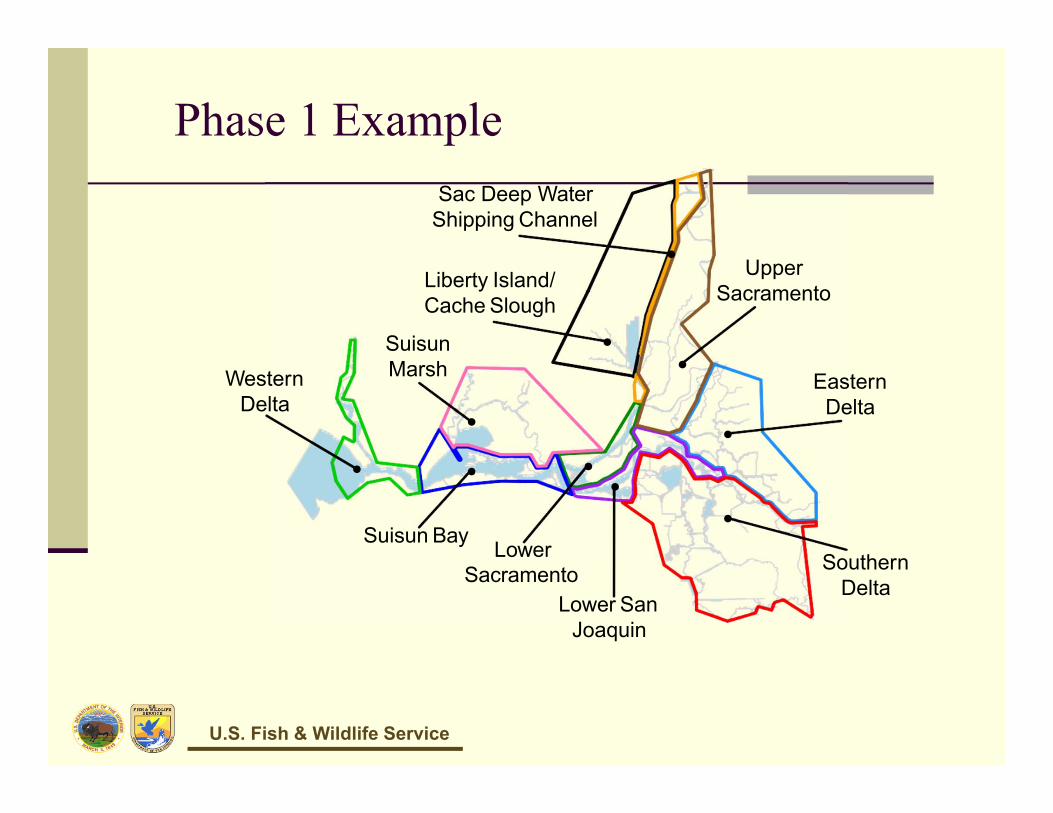
Phase 1 Example
●
Western Delta
●
Suisun Bay
●
Suisun Marsh
●
Lower
●
SacramentoLower San
Joaquin
●
Liberty Island/ Cache Slough
●
Sac Deep Water Shipping Channel
●
Upper Sacramento
●
Eastern Delta
●
Southern Delta
1
2
3
4
5
6
78910
11
1213
14
15
16
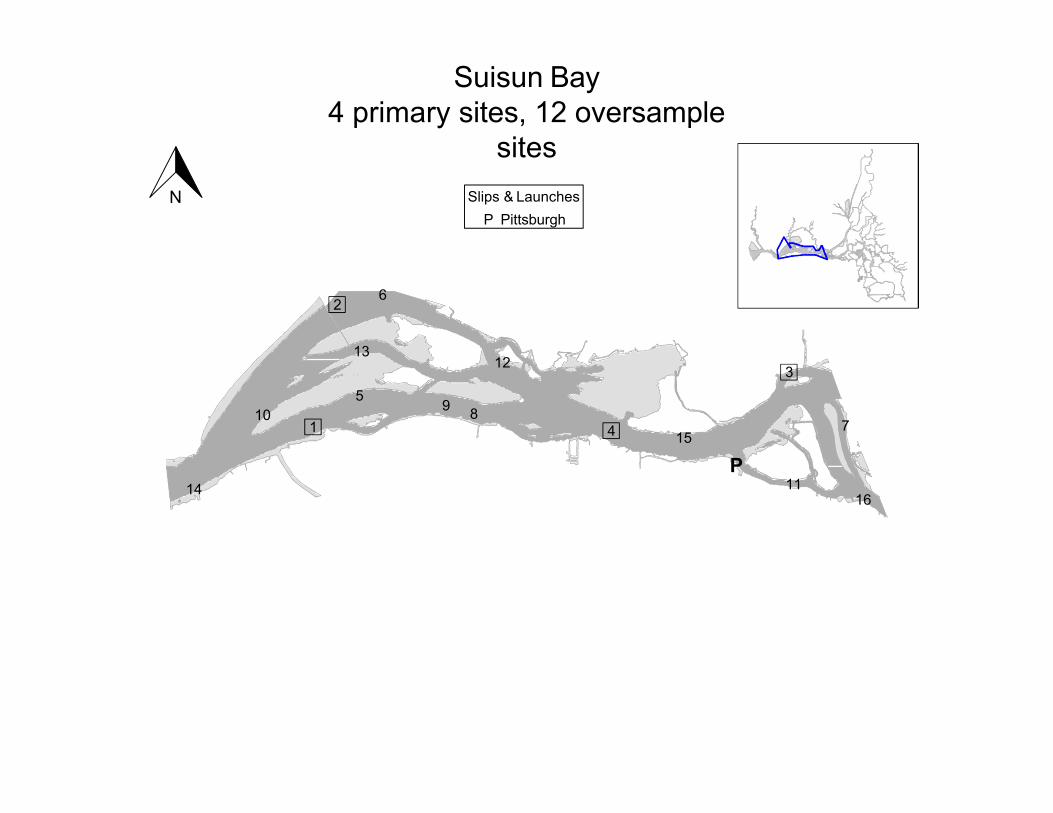
Suisun Bay4 primary sites, 12 oversample
sitesN
P
Slips & LaunchesP Pittsburgh
U.S. Fish & Wildlife Service
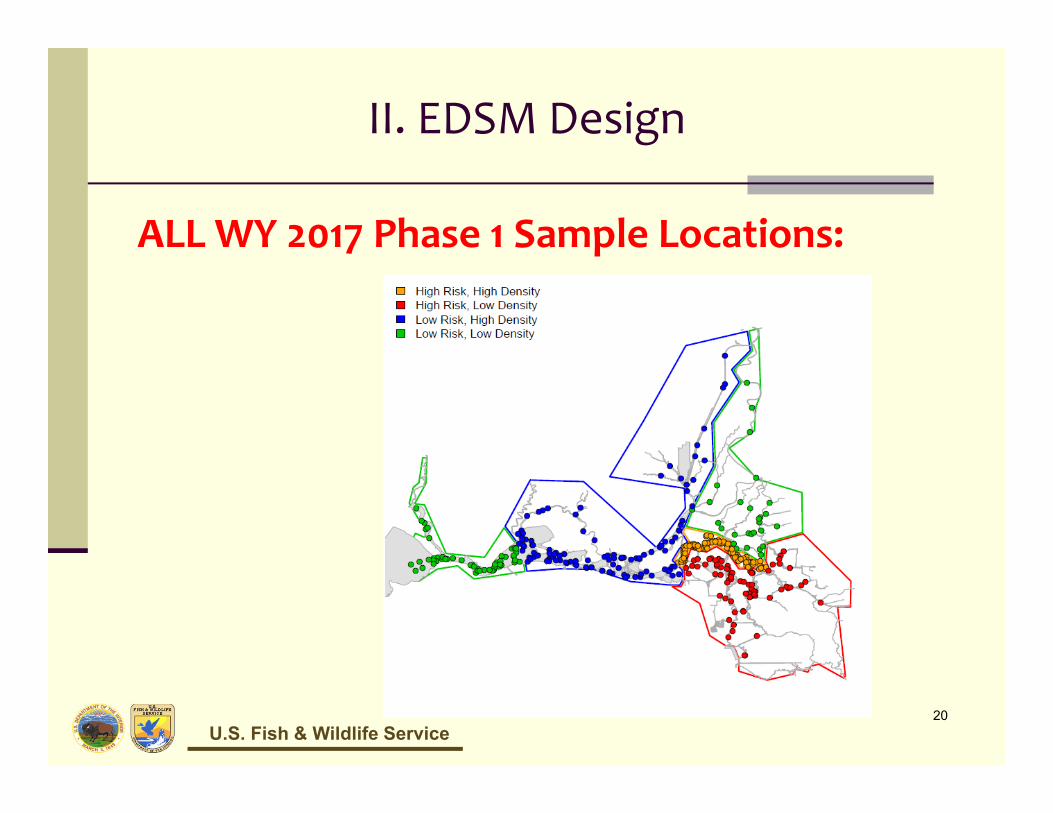
II. EDSM Design
ALL WY 2017 Phase 1 Sample Locations:
20
U.S. Fish & Wildlife Service
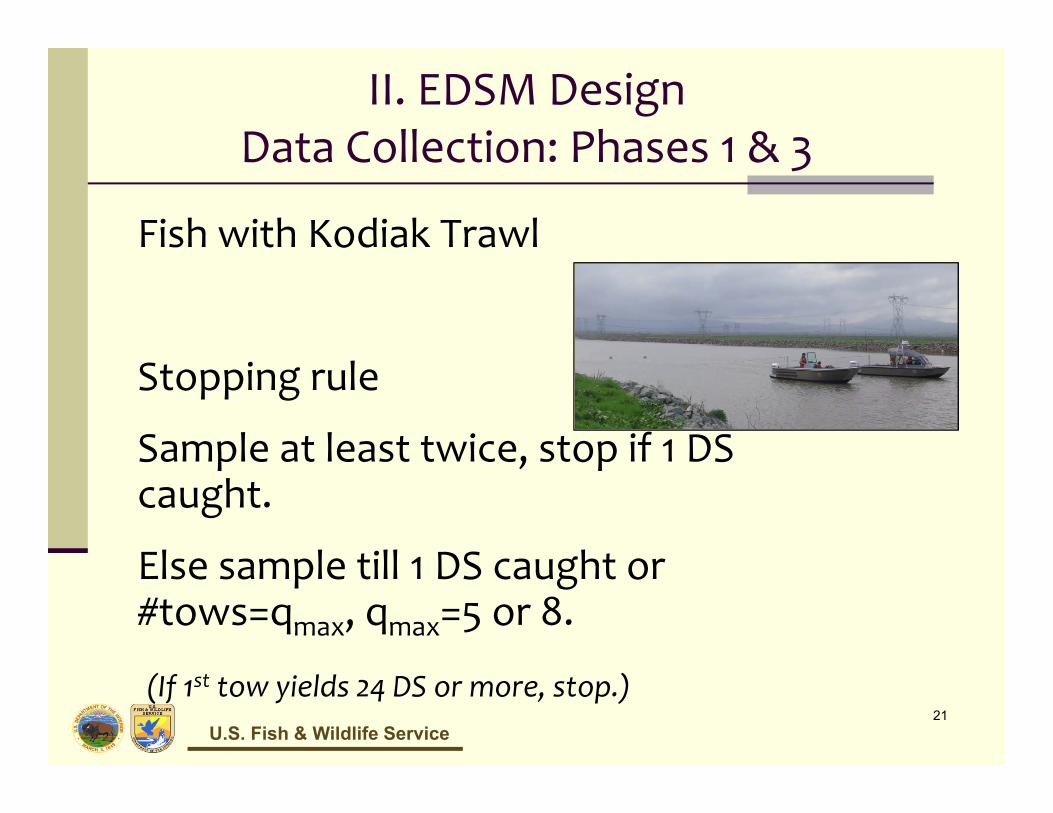
II. EDSM DesignData Collection: Phases 1 & 3
Fish with Kodiak Trawl
Stopping rule
Sample at least twice, stop if 1 DS caught.
Else sample till 1 DS caught or #tows=qmax, qmax=5 or 8.
(If 1st tow yields 24 DS or more, stop.)21
U.S. Fish & Wildlife Service
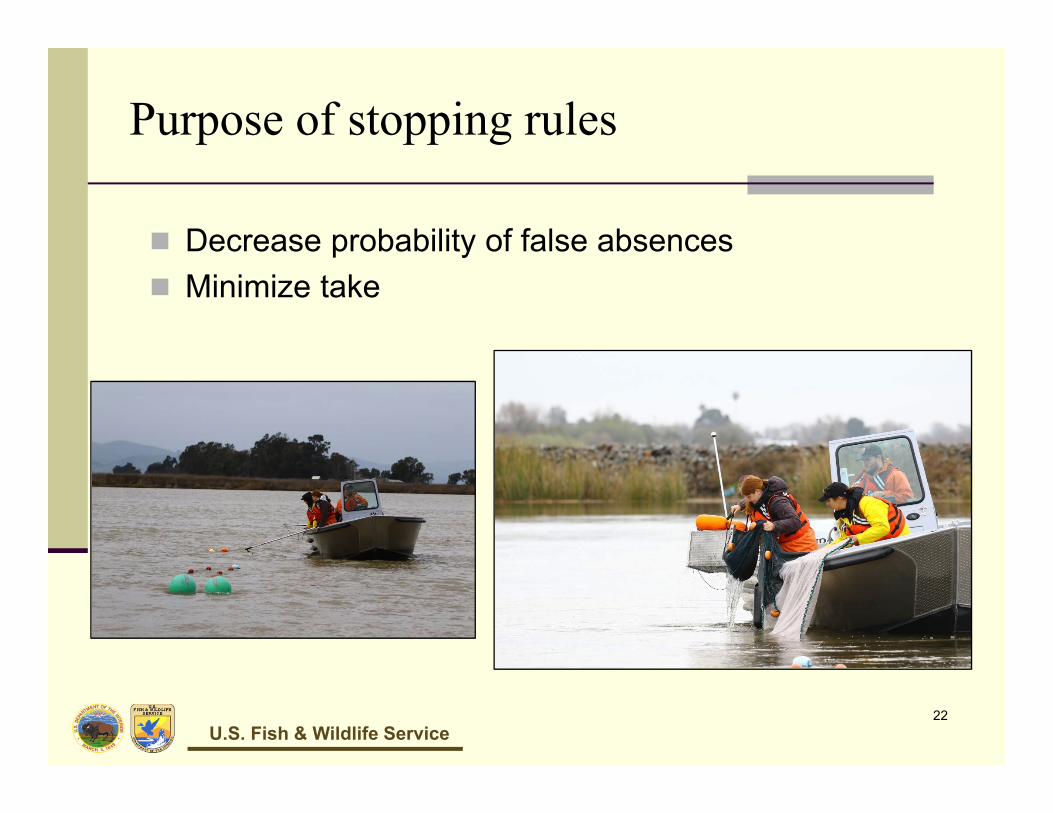
Purpose of stopping rules
22
Decrease probability of false absences Minimize take
U.S. Fish & Wildlife Service
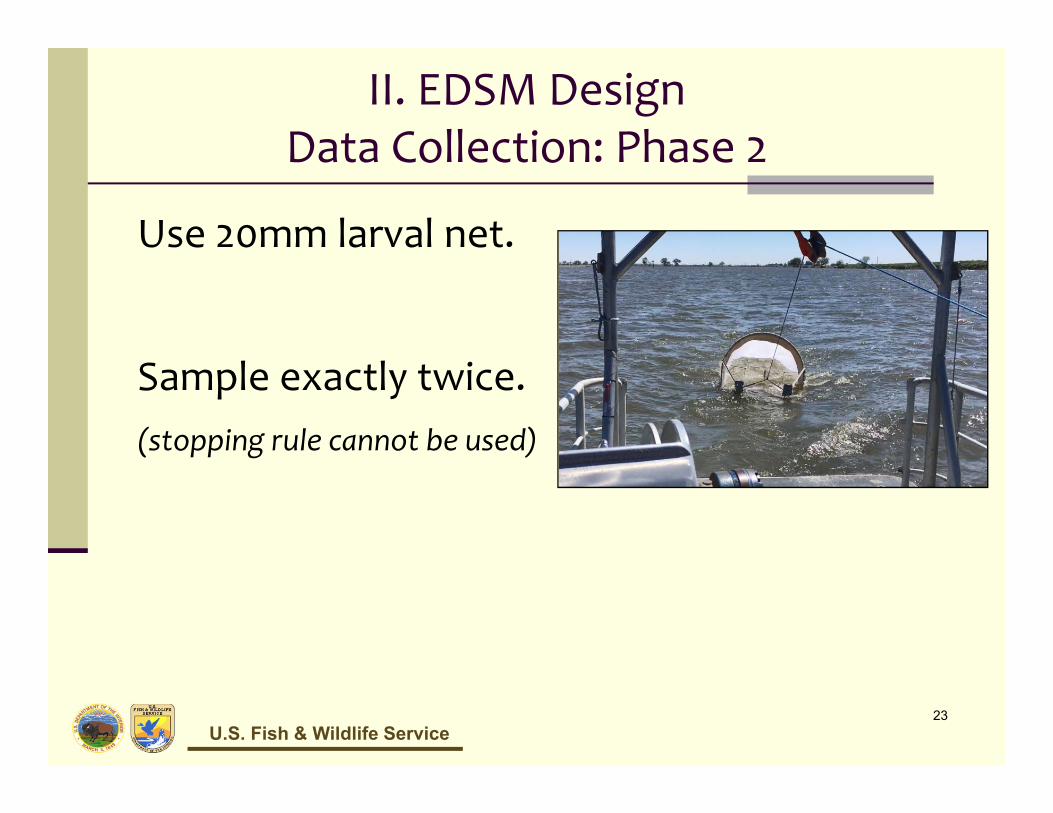
II. EDSM DesignData Collection: Phase 2
Use 20mm larval net.
Sample exactly twice.(stopping rule cannot be used)
23
U.S. Fish & Wildlife Service
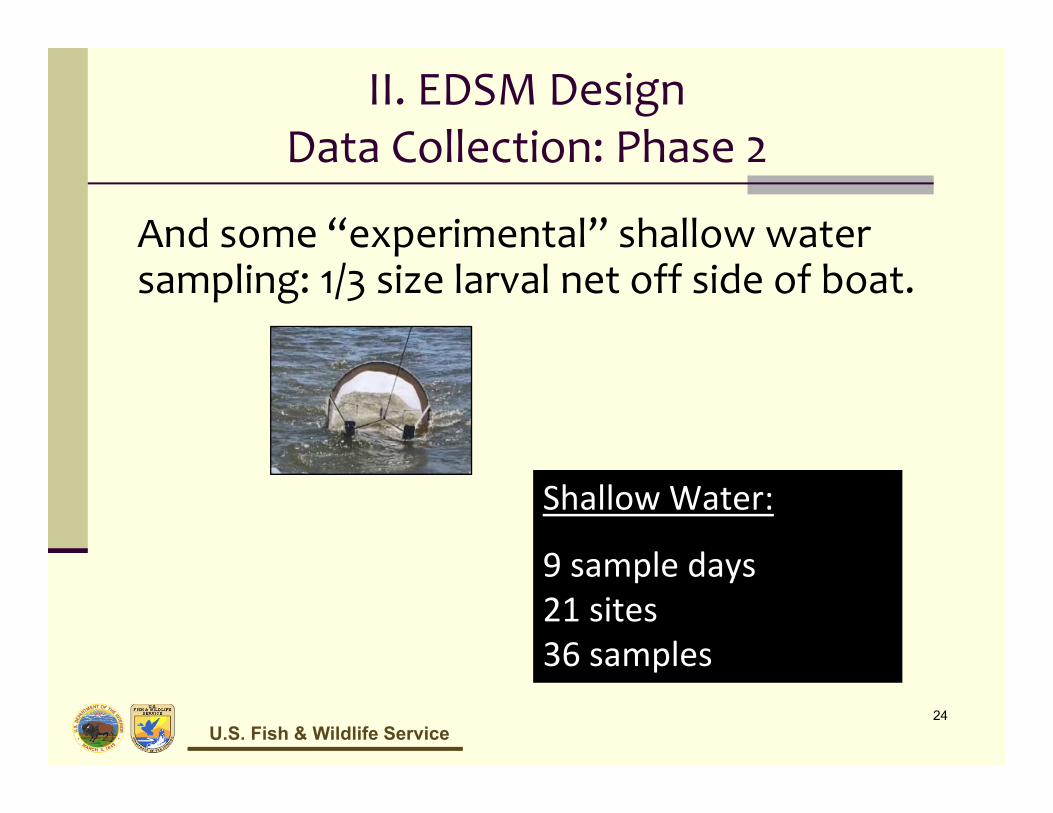
II. EDSM DesignData Collection: Phase 2
And some “experimental” shallow water sampling: 1/3 size larval net off side of boat.
24
Shallow Water:
9 sample days21 sites36 samples
U.S. Fish & Wildlife Service
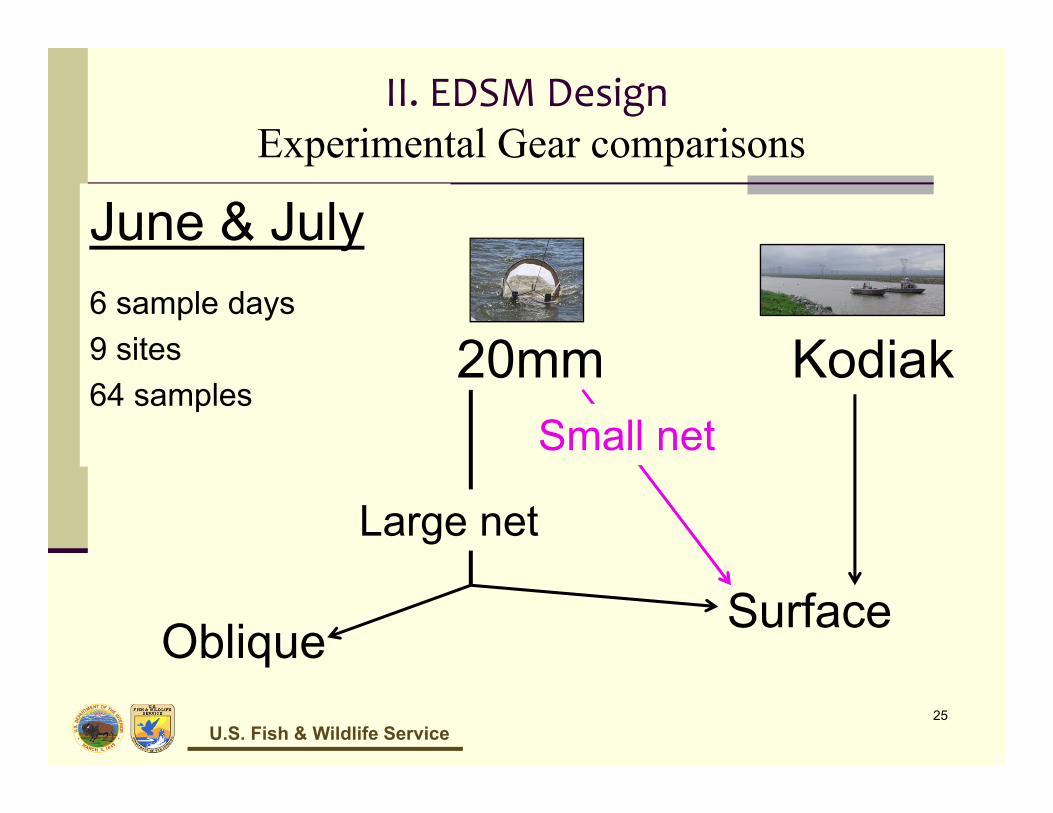
Oblique Surface
II. EDSM DesignExperimental Gear comparisons
25
June & July6 sample days9 sites64 samples
20mm Kodiak
Large net
Small net
U.S. Fish & Wildlife Service
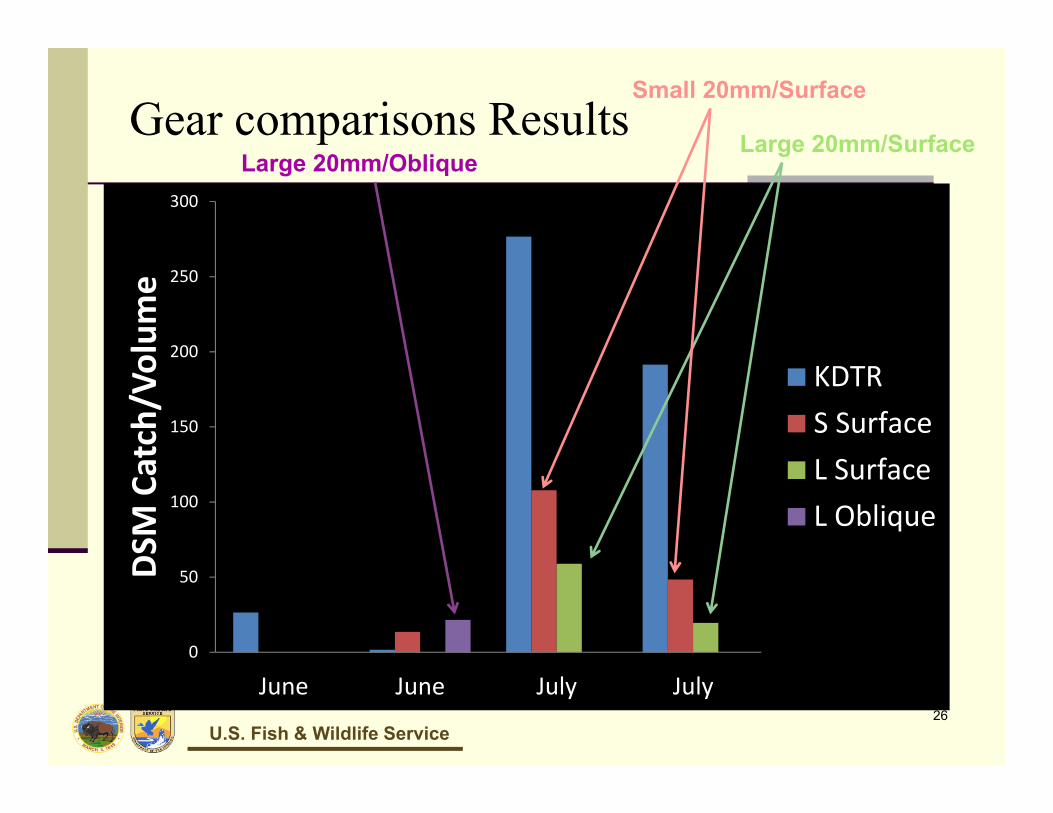
Gear comparisons Results
26
0
50
100
150
200
250
300
June June July July
DSM
Catch/Volum
e
KDTRS SurfaceL SurfaceL Oblique
Small & SurfaceLarge 20mm/Surface
Small 20mm/Surface
Large 20mm/Oblique
U.S. Fish & Wildlife Service
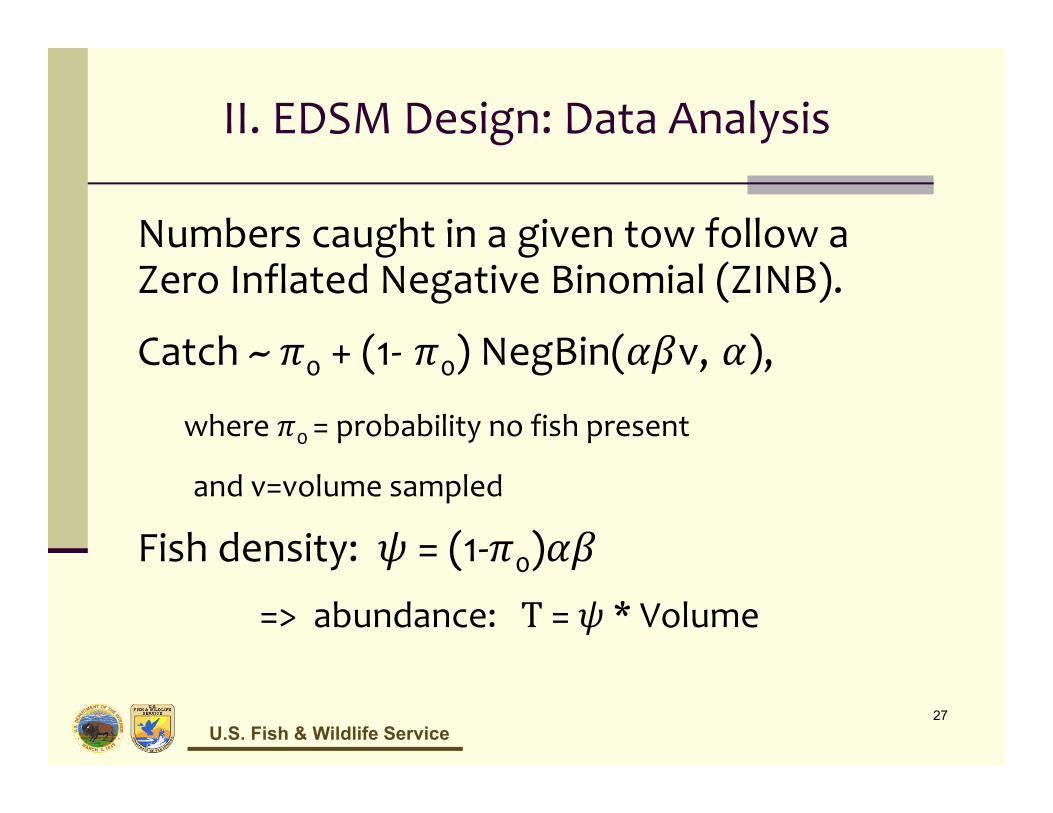
II. EDSM Design: Data Analysis
Numbers caught in a given tow follow a Zero Inflated Negative Binomial (ZINB).
Catch ~ 0 + (1‐ 0) NegBin( v, ),
where 0 = probability no fish present
and v=volume sampled
Fish density: = (1‐ 0)
=> abundance: = * Volume
27
U.S. Fish & Wildlife Service
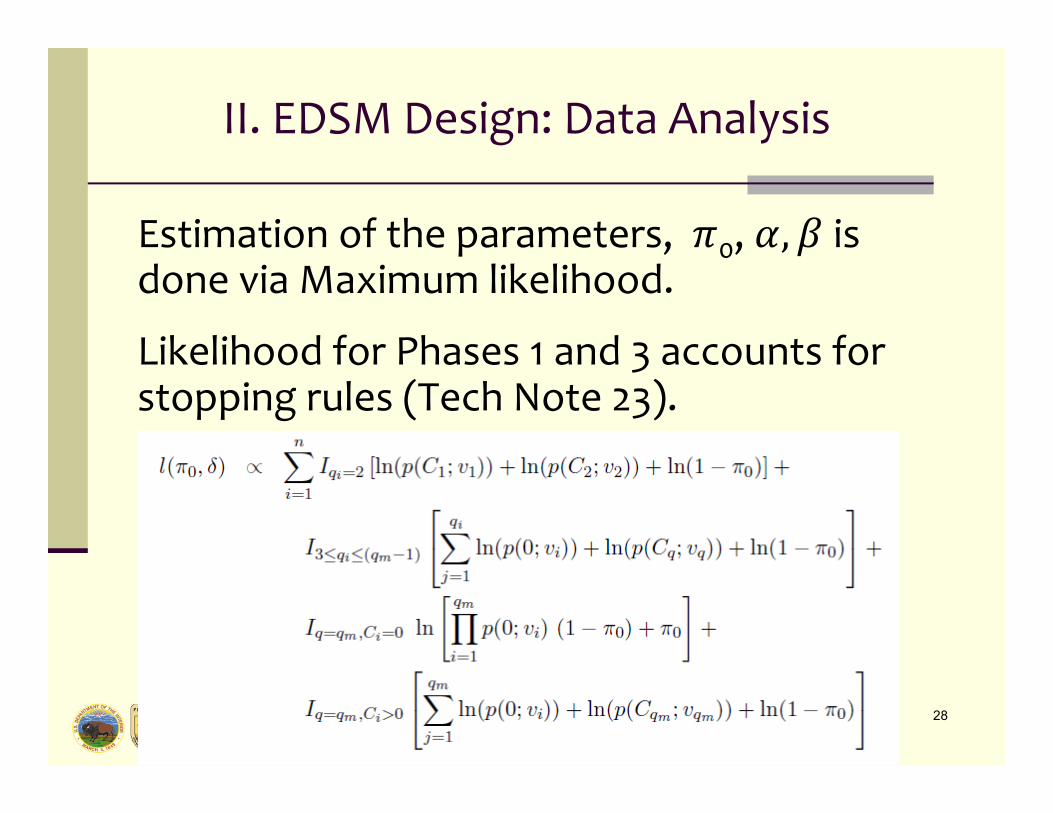
II. EDSM Design: Data Analysis
Estimation of the parameters, 0, is done via Maximum likelihood.
Likelihood for Phases 1 and 3 accounts for stopping rules (Tech Note 23).
28
U.S. Fish & Wildlife Service
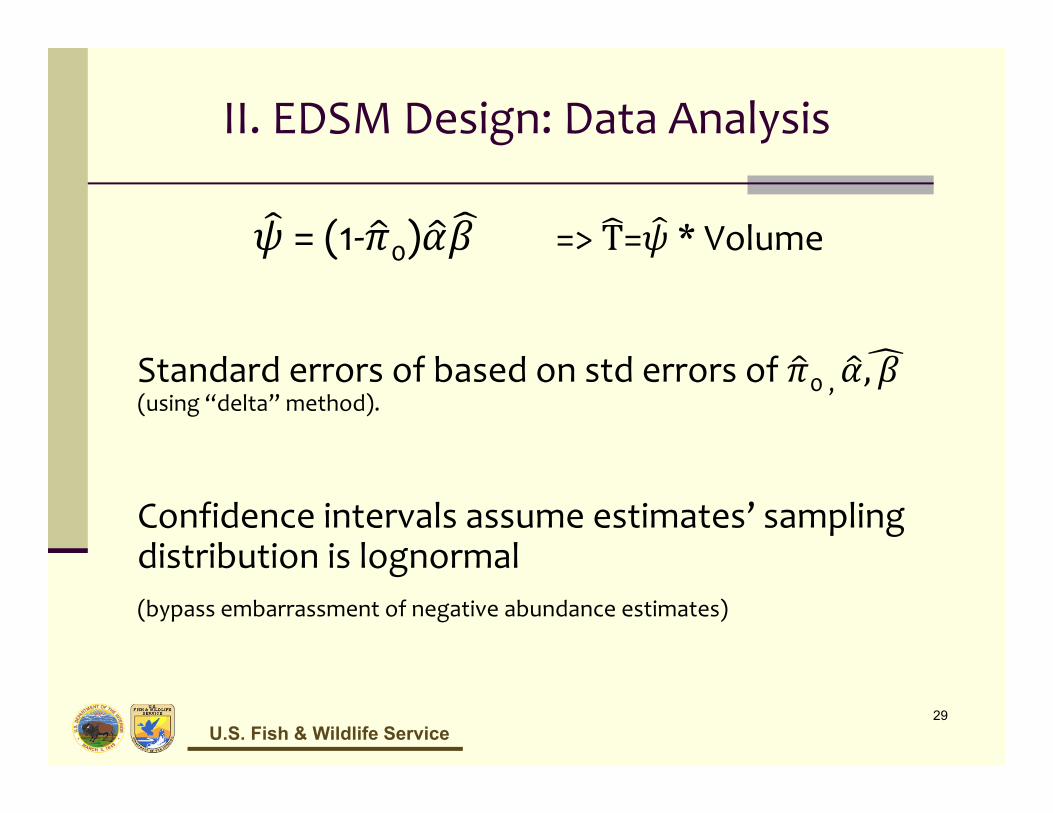
II. EDSM Design: Data Analysis
= (1‐ 0) => = * Volume
Standard errors of based on std errors of 0 , (using “delta” method).
Confidence intervals assume estimates’ sampling distribution is lognormal (bypass embarrassment of negative abundance estimates)
29
U.S. Fish & Wildlife Service
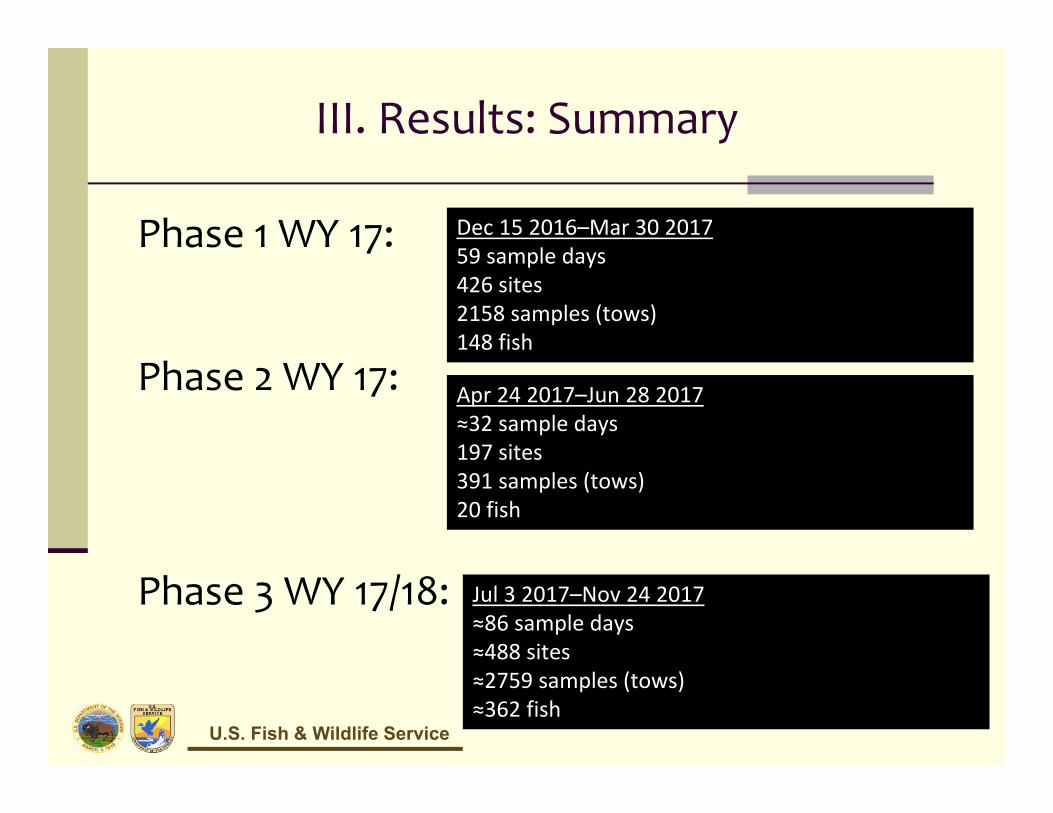
III. Results: Summary
Phase 1 WY 17:
Phase 2 WY 17:
Phase 3 WY 17/18:
30
Dec 15 2016–Mar 30 201759 sample days426 sites2158 samples (tows)148 fish
Apr 24 2017–Jun 28 2017≈32 sample days197 sites391 samples (tows)20 fish
Jul 3 2017–Nov 24 2017≈86 sample days≈488 sites≈2759 samples (tows)≈362 fish
U.S. Fish & Wildlife Service
III. Results
Weekly reports:
31
U.S. Fish & Wildlife Service
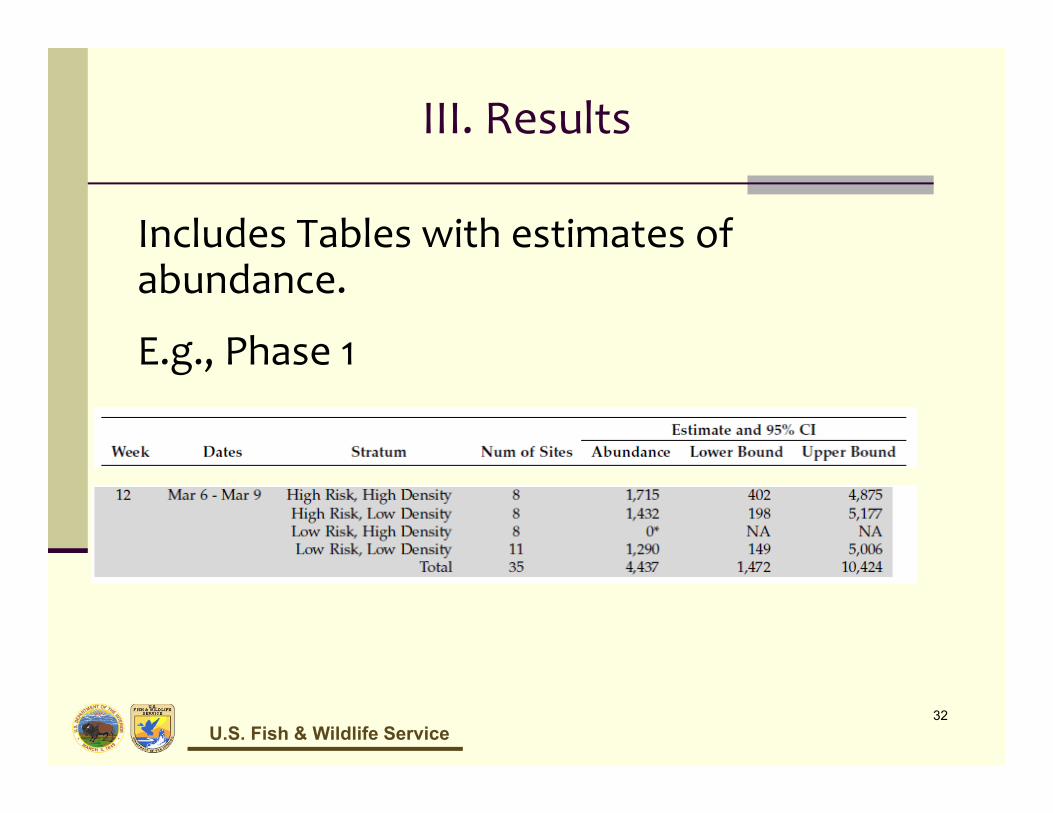
III. Results
Includes Tables with estimates of abundance.
E.g., Phase 1
32
U.S. Fish & Wildlife Service
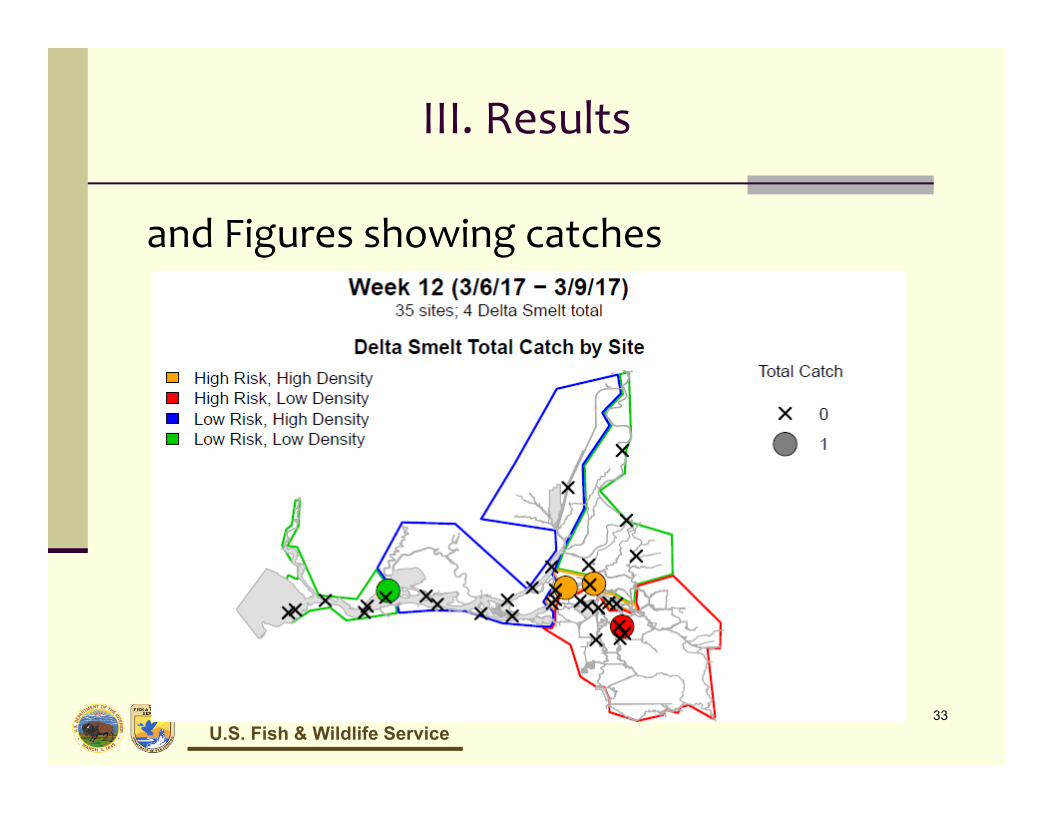
III. Results
and Figures showing catches
33
U.S. Fish & Wildlife Service
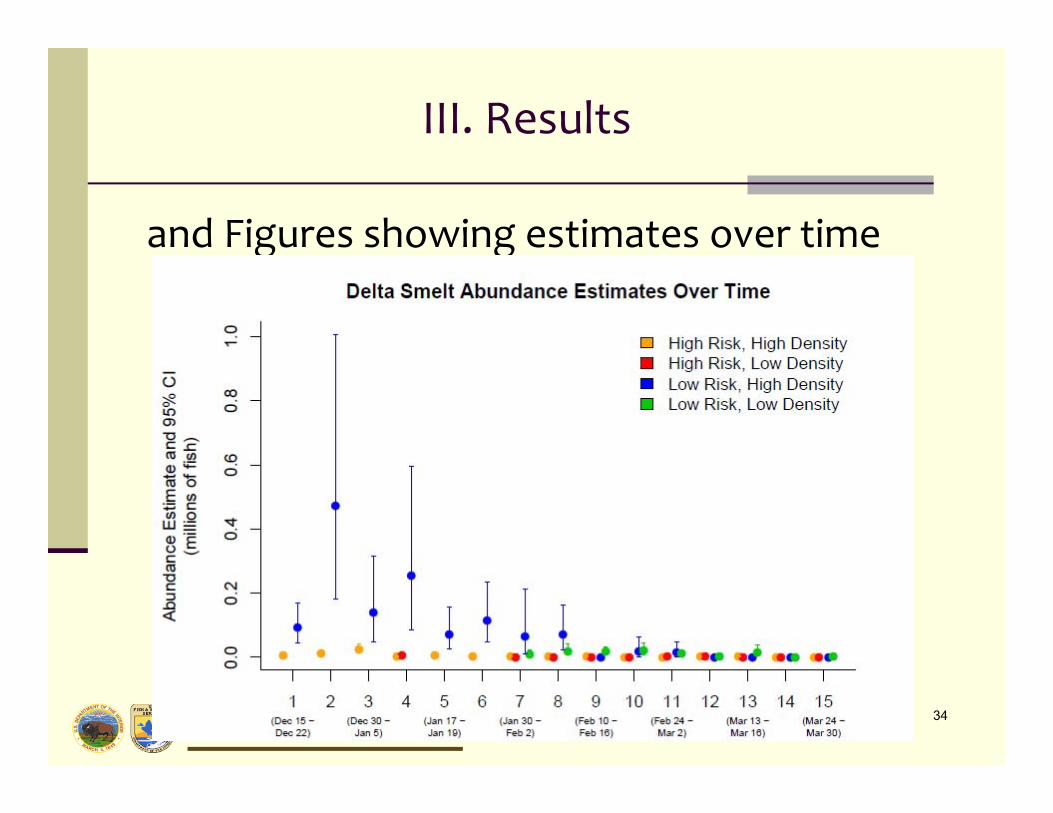
III. Results
and Figures showing estimates over time
34
U.S. Fish & Wildlife Service
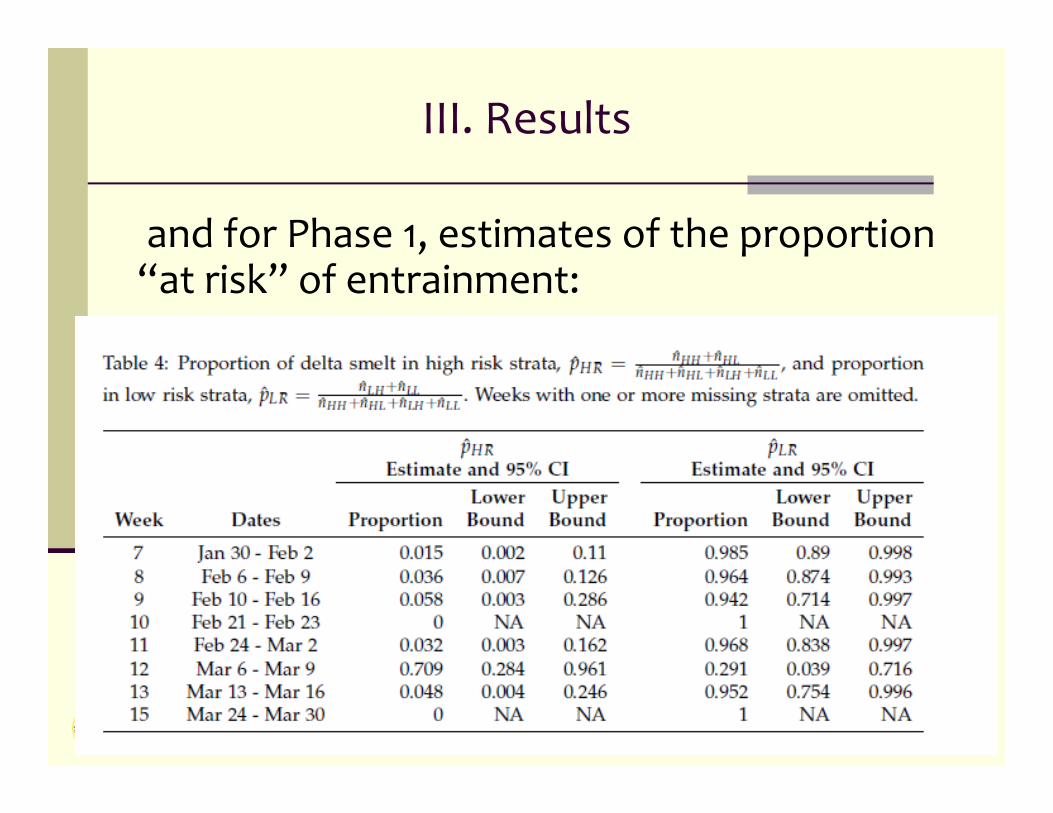
III. Results
and for Phase 1, estimates of the proportion “at risk” of entrainment:
35
U.S. Fish & Wildlife Service
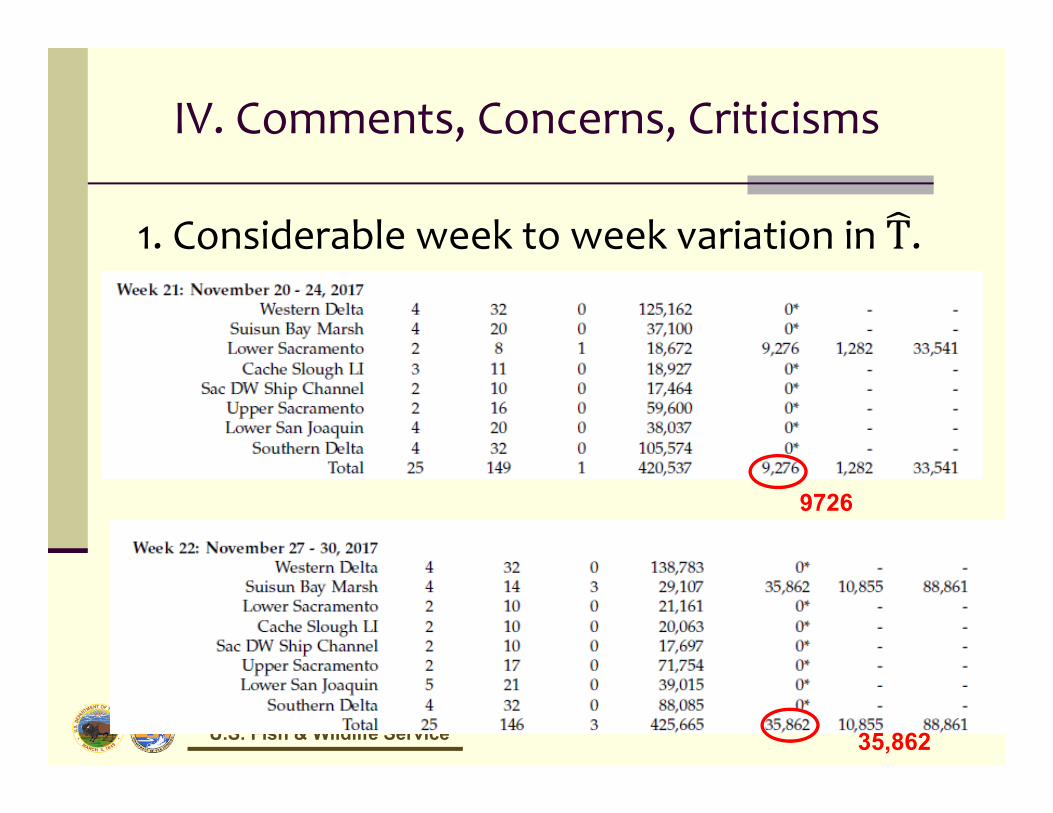
IV. Comments, Concerns, Criticisms
1. Considerable week to week variation in .
36
9726
35,862
U.S. Fish & Wildlife Service
IV. Comments, Concerns, Criticisms
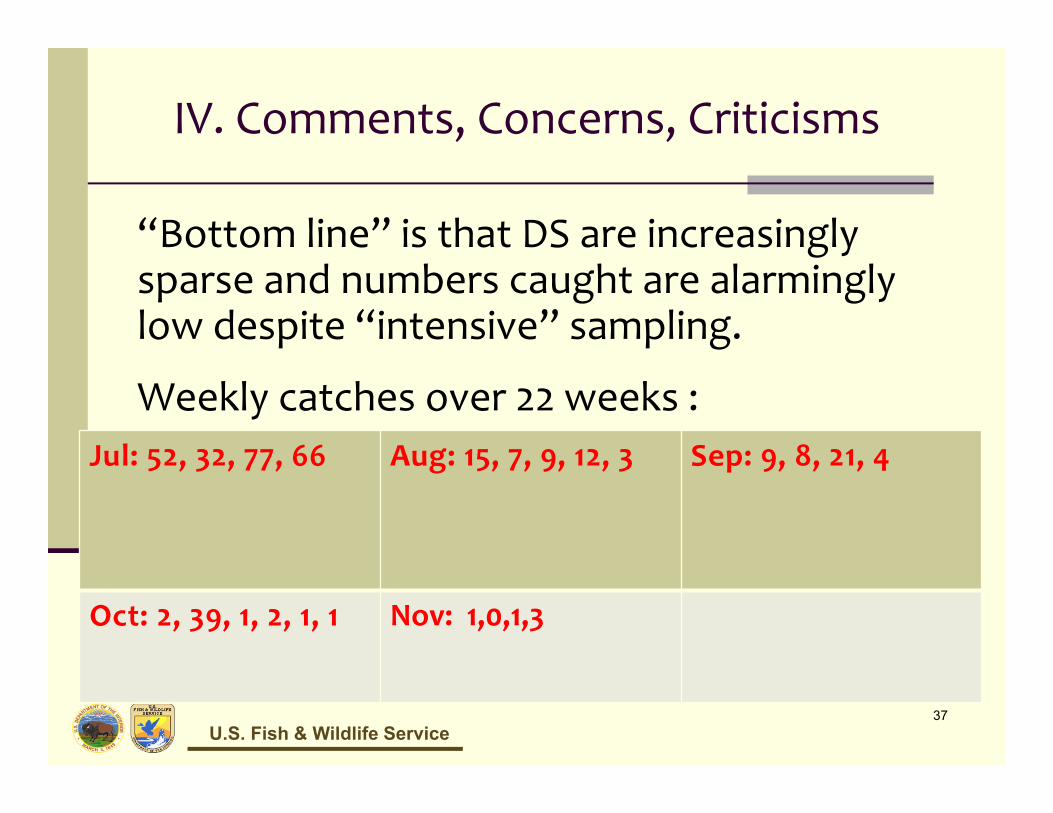
“Bottom line” is that DS are increasingly sparse and numbers caught are alarmingly low despite “intensive” sampling.
Weekly catches over 22 weeks :
37
Jul: 52, 32, 77, 66 Aug: 15, 7, 9, 12, 3 Sep: 9, 8, 21, 4
Oct: 2, 39, 1, 2, 1, 1 Nov: 1,0,1,3
U.S. Fish & Wildlife Service
IV. Comments, Concerns, Criticisms
Fixes?
a. Week‐stratum‐specific values are assumed for parameters => may start assuming common 0 for strata in a week.
b. Inadequate sample size? Sample size determination is needed/overdue. Expensive?
c. Alternative analysis‐more model‐based, smooth estimates over week.
d. Alternate stratification?
38
U.S. Fish & Wildlife Service
IV. Comments, Concerns, Criticisms
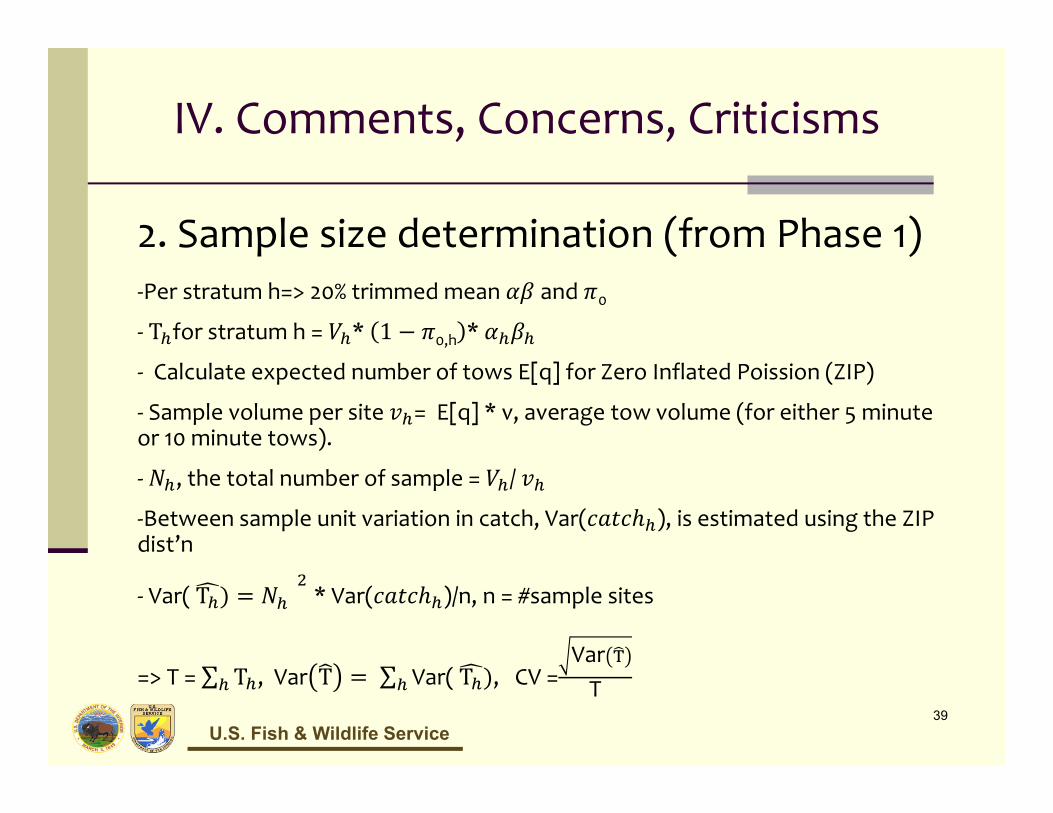
2. Sample size determination (from Phase 1)‐Per stratum h=> 20% trimmed mean and 0
‐ Τ for stratum h = * 1 0,h *
‐ Calculate expected number of tows E[q] for Zero Inflated Poission (ZIP)
‐ Sample volume per site = E[q] * v, average tow volume (for either 5 minute or 10 minute tows).
‐ , the total number of sample = /
‐Between sample unit variation in catch, Var( ), is estimated using the ZIP dist’n
‐ Var( Τ * Var( )/n, n = #sample sites
=> T = ∑ Τ , Var Τ ∑ Var( Τ , CV =VarT
39

U.S. Fish & Wildlife Service
IV. Comments, Concerns, Criticisms
2. Sample size
determination
40
Coefficient of Variation (CV)of Τ vs Total Sample Size
“Mean” Density and Mean
40% CV w/ 24Sites, 5 minute tows
U.S. Fish & Wildlife Service
IV. Comments, Concerns, Criticisms
41
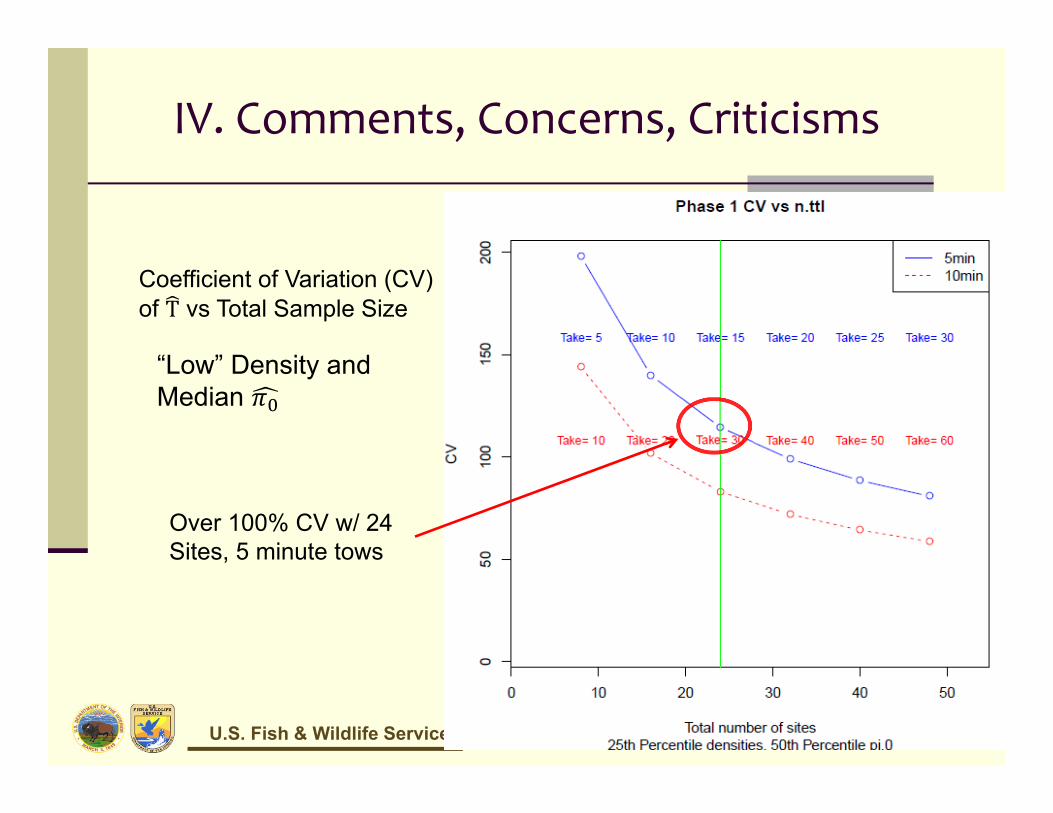
Coefficient of Variation (CV)of Τ vs Total Sample Size
“Low” Density and Median
Over 100% CV w/ 24Sites, 5 minute tows
U.S. Fish & Wildlife Service
IV. Comments, Concerns, Criticisms
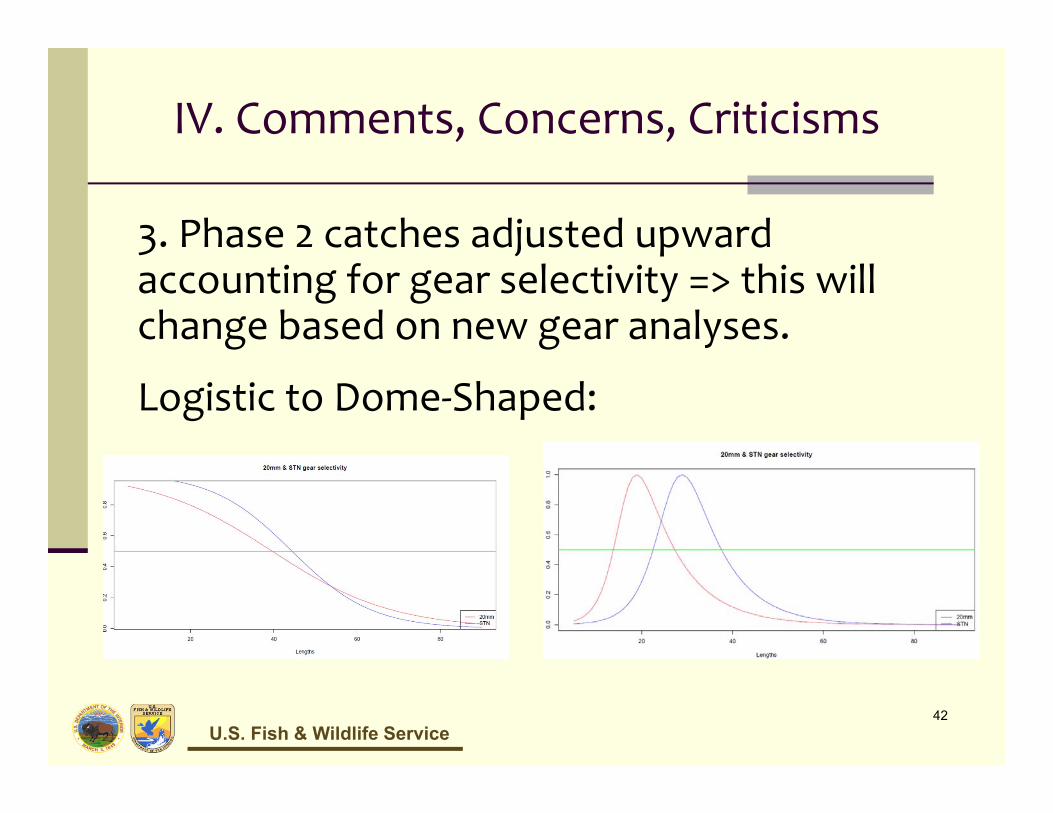
3. Phase 2 catches adjusted upward accounting for gear selectivity => this will change based on new gear analyses.
Logistic to Dome‐Shaped:
42
U.S. Fish & Wildlife Service
IV. Comments, Concerns, Criticisms
4. Phase 1 and 3 assume 100% effective gear=> debatable.
43
U.S. Fish & Wildlife Service
IV. Comments, Concerns, Criticisms
5. Study area too small: systematically excluding near shore areas.
Not sampling waters < 2m depth =>
Excluding 6% of the total Bay‐Delta region considered “suitable” for Delta Smelt.
44

U.S. Fish & Wildlife Service
IV. Comments, Concerns, Criticisms
6. “Take”.
‐ Compare numbers killed to numbers available: 148 + 20 + 362 = 530 caught over 1 year period compared to Τ = 10’s of 1000s?
(Better: adjust for life stage)
‐ Fraction of water sampled: 24 sites * 4 tows * 3000 m3 => 288,000 m3.
Volume to 10m depth = 1,744,080,840m3
=> 0.00017 of volume sampled.
45
U.S. Fish & Wildlife Service
IV. Comments, Concerns, Criticisms
‐ SOPs changed in multiple ways to lessen take:(1) having stopping rules (2) 5 minute tows in high density areas (vs 10 minute tows elsewhere) (3) occasionally reduce tow times to as low as 2.5 minutes when the risk of catching large #DS is high (4) forego a 2nd tow if 1st tow caught > 24 DS
46
U.S. Fish & Wildlife Service
IV. Comments, Concerns, Criticisms
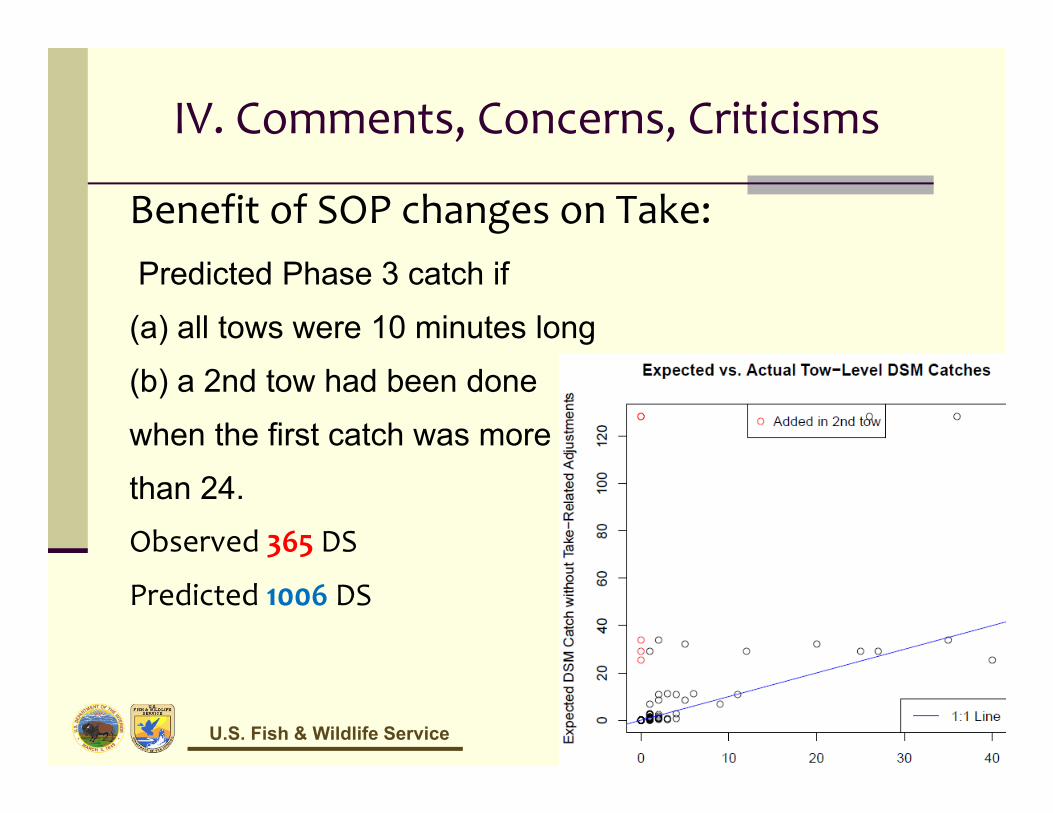
Benefit of SOP changes on Take:Predicted Phase 3 catch if (a) all tows were 10 minutes long (b) a 2nd tow had been done when the first catch was more than 24.Observed 365 DS
Predicted 1006 DS
47
U.S. Fish & Wildlife Service
IV. Comments, Concerns, Criticisms
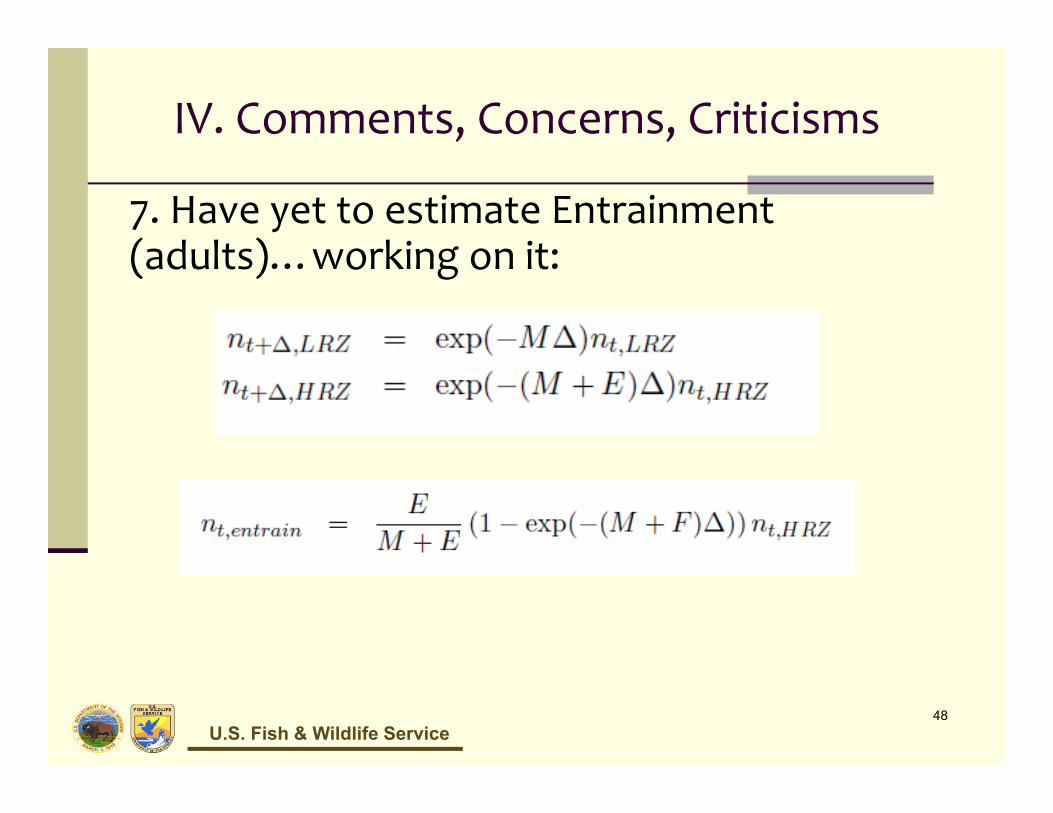
7. Have yet to estimate Entrainment (adults)…working on it:
48
U.S. Fish & Wildlife Service
V. Final Remarks
DS are becoming increasingly sparse, hard to find, few being caught.
1. Alternative sampling procedure? E.g., a few relatively long transects across a stratum (picking up gear after 5 minutes, check for “large” catches, then repeat)
2. Contract a GRTS expert (Stevens or Olson, say) to get 2nd opinion.
49
U.S. Fish & Wildlife Service
Questions? Comments?
50