Embed Size (px)
Citation preview

An overview of energy efficiency and demand side management in South Africa
30 January 2012
Tom Skinner
Overview of presentation
• Eskom and the South African Environment
• The State of the System as Driver for EE
• Energy Sectors and Activities
• Capabilities, Successes and Funding
• EEDSM Funding Mechanisms and Programmes
• Lessons Learned
• Future Focus Areas
2011/11/09 2
INTRODUCTIONEskom and the South African Environment
2011/11/09 4
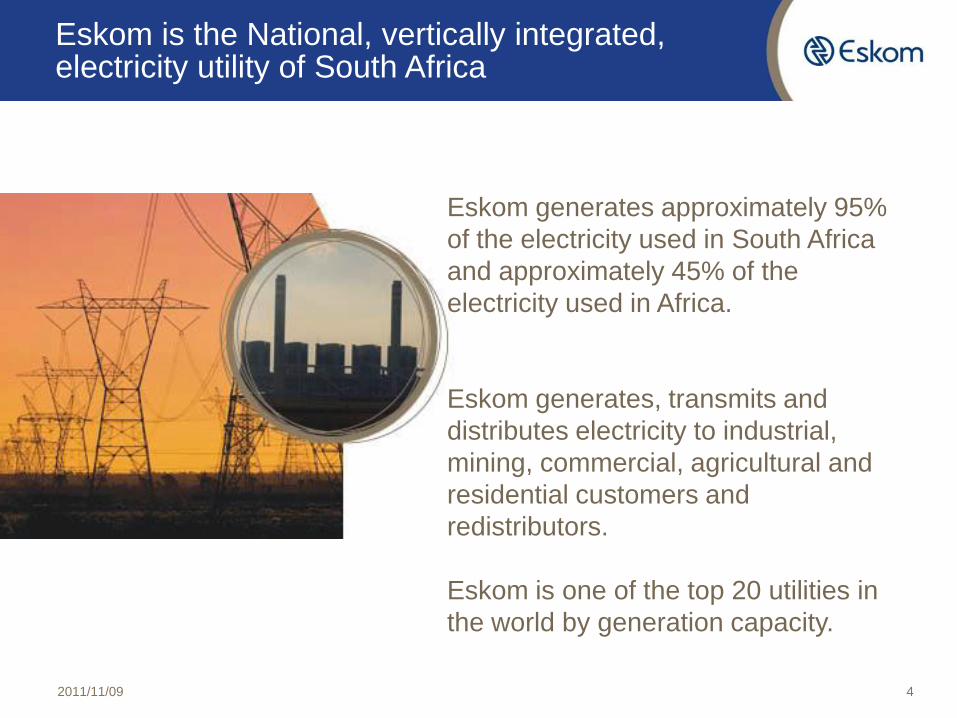
Eskom is the National, vertically integrated, electricity utility of South Africa
Eskom generates approximately 95%
of the electricity used in South Africa
and approximately 45% of the
electricity used in Africa.
Eskom generates, transmits and
distributes electricity to industrial,
mining, commercial, agricultural and
residential customers and
redistributors.
Eskom is one of the top 20 utilities in
the world by generation capacity.
5
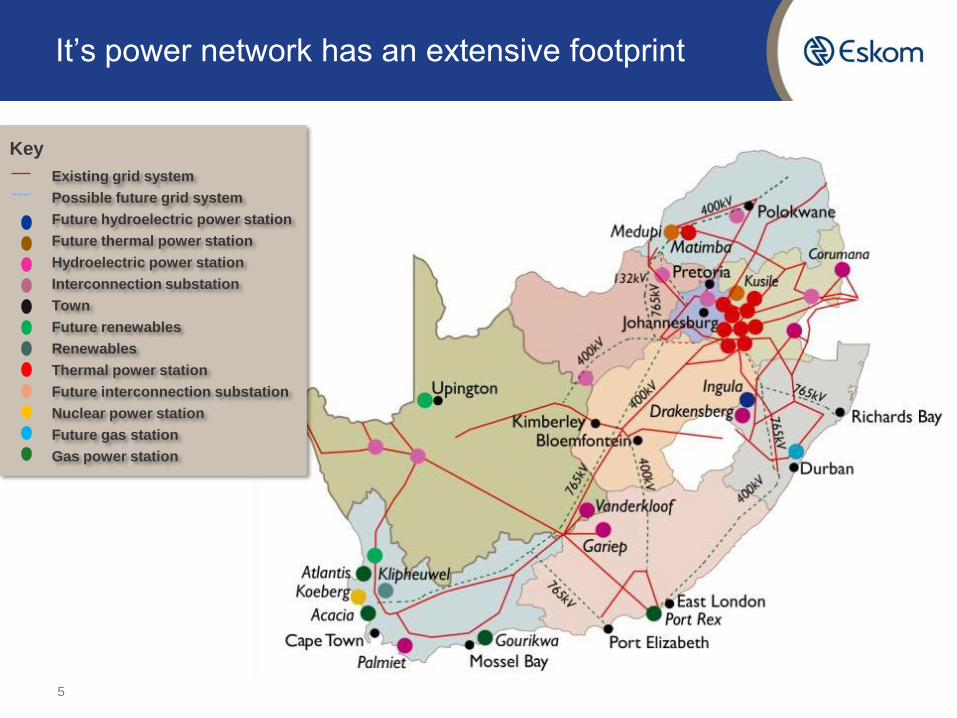
It’s power network has an extensive footprint
Key
Existing grid system
Possible future grid system
Future hydroelectric power station
Future thermal power station
Hydroelectric power station
Interconnection substation
Town
Future renewables
Renewables
Thermal power station
Future interconnection substation
Nuclear power station
Future gas station
Gas power station
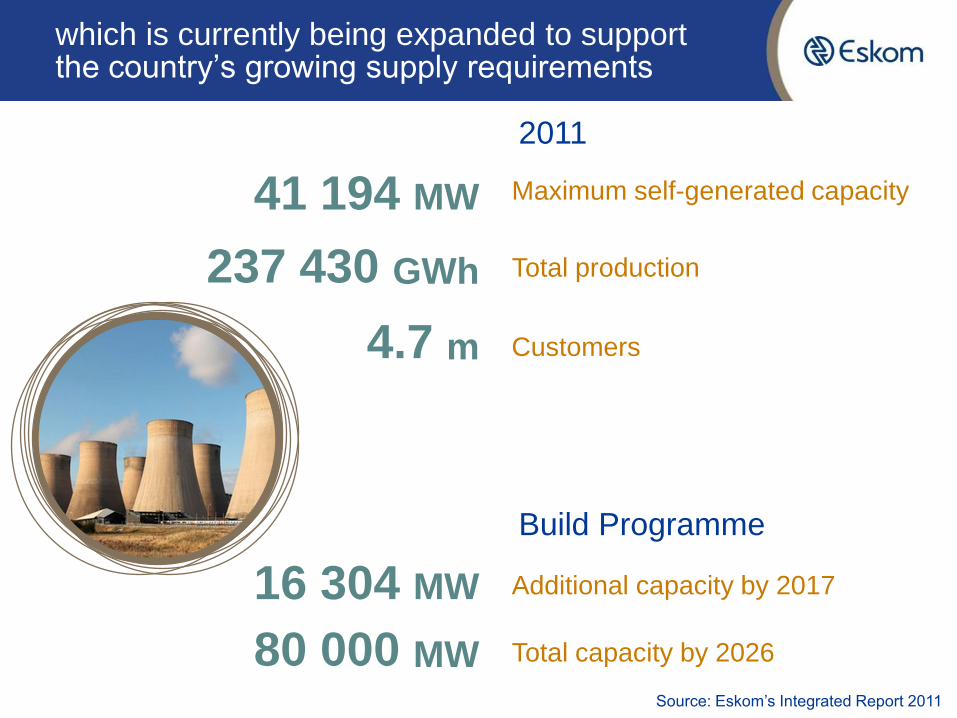
which is currently being expanded to support the country’s growing supply requirements
237 430 GWh
41 194 MW
4.7 m
Maximum self-generated capacity
Total production
Customers
2011
80 000 MW
16 304 MW Additional capacity by 2017
Total capacity by 2026
Build Programme
Source: Eskom’s Integrated Report 2011

In support of national policy direction, Eskom administers a large scale EEDSM programme
2011/11/09 7
NEEA
Department of Energy
National Energy
Regulator of South Africa National Energy
Efficiency Agency
THE STATE OF THE SYSTEMAs a Driver for EE and DSM in the Country
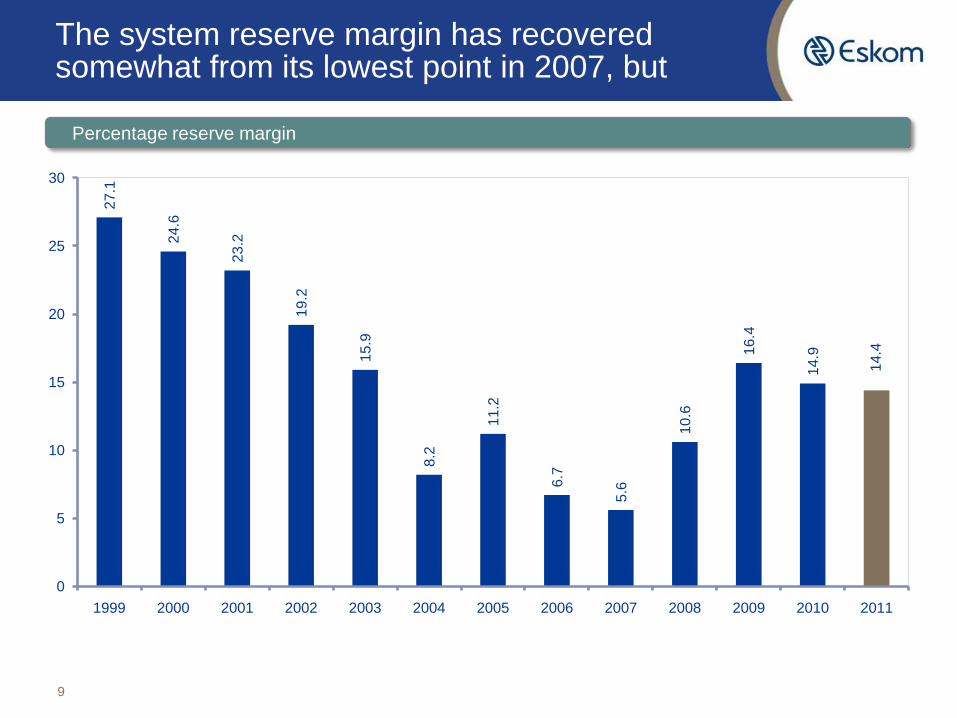
The system reserve margin has recovered somewhat from its lowest point in 2007, but
9
27.1
24.6
23
.2
19.2
15.9
8.2
11.2
6.7
5.6
10
.6
16.4
14.9
14.4
0
5
10
15
20
25
30
1999 2000 2001 2002 2003 2004 2005 2006 2007 2008 2009 2010 2011
Percentage reserve margin
-10.0
-8.0
-6.0
-4.0
-2.0
-
2.0
2011 2012 2013 2014 2015 2016 2017
En
erg
y G
ap
(T
Wh
)
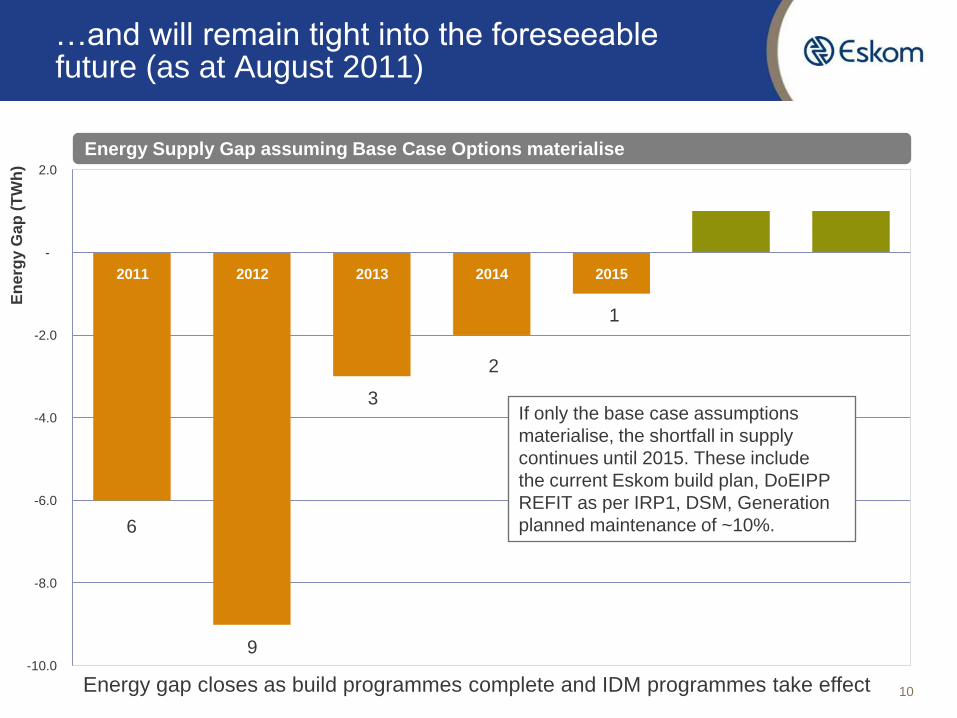
If only the base case assumptions
materialise, the shortfall in supply
continues until 2015. These include
the current Eskom build plan, DoEIPP
REFIT as per IRP1, DSM, Generation
planned maintenance of ~10%.
…and will remain tight into the foreseeable future (as at August 2011)
10
Energy Supply Gap assuming Base Case Options materialise
6
9
3
2
1
Energy gap closes as build programmes complete and IDM programmes take effect
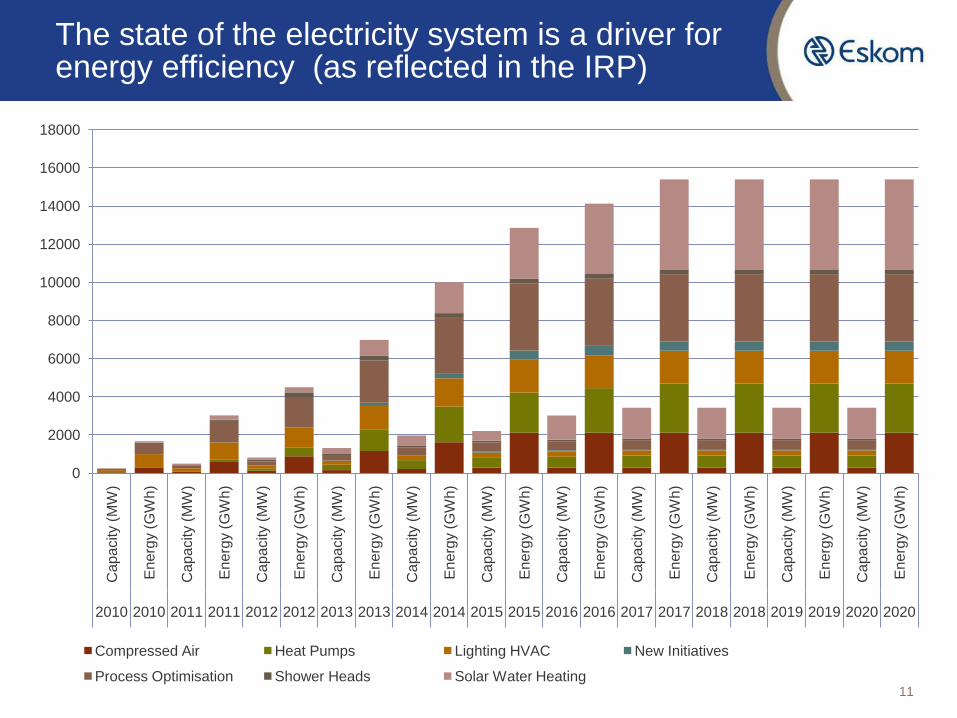
The state of the electricity system is a driver for energy efficiency (as reflected in the IRP)
11
0
2000
4000
6000
8000
10000
12000
14000
16000
18000
Ca
pa
city (
MW
)
En
erg
y (
GW
h)
Ca
pa
city (
MW
)
En
erg
y (
GW
h)
Ca
pa
city (
MW
)
En
erg
y (
GW
h)
Ca
pa
city (
MW
)
En
erg
y (
GW
h)
Ca
pa
city (
MW
)
En
erg
y (
GW
h)
Ca
pa
city (
MW
)
En
erg
y (
GW
h)
Ca
pa
city (
MW
)
En
erg
y (
GW
h)
Ca
pa
city (
MW
)
En
erg
y (
GW
h)
Ca
pa
city (
MW
)
En
erg
y (
GW
h)
Ca
pa
city (
MW
)
Energ
y (
GW
h)
Ca
pa
city (
MW
)
En
erg
y (
GW
h)
2010 2010 2011 2011 2012 2012 2013 2013 2014 2014 2015 2015 2016 2016 2017 2017 2018 2018 2019 2019 2020 2020
Compressed Air Heat Pumps Lighting HVAC New Initiatives
Process Optimisation Shower Heads Solar Water Heating

INDUSTRIESEnergy Sectors and Activities
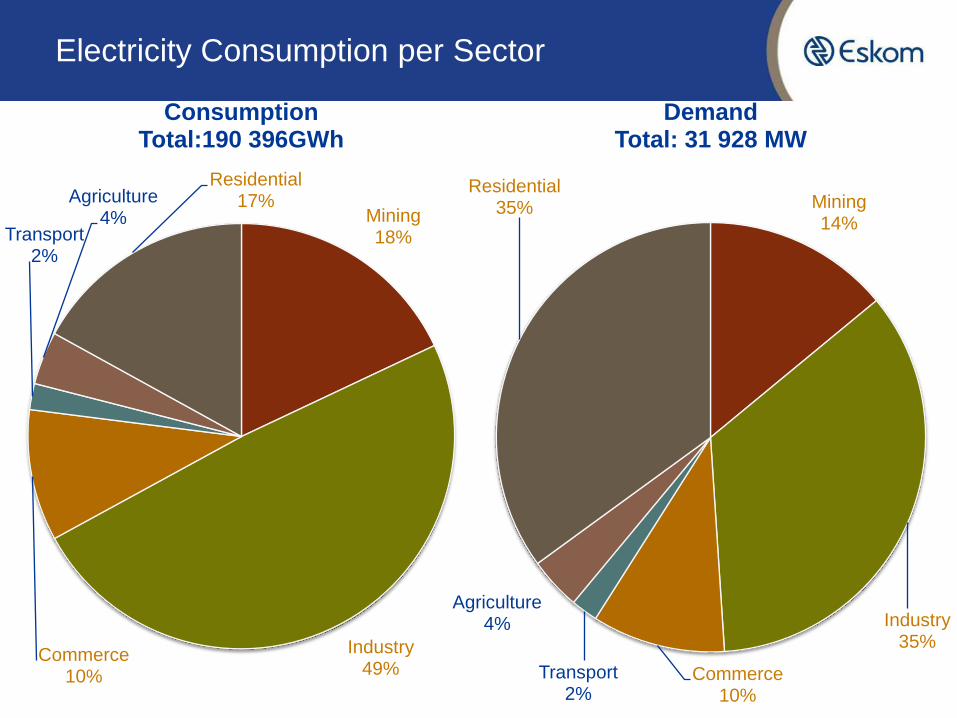
Mining 18%
Industry 49%
Commerce 10%
Transport 2%
Agriculture 4%
Residential 17%
ConsumptionTotal:190 396GWh
Electricity Consumption per Sector
Mining 14%
Industry 35%
Commerce 10%
Transport 2%
Agriculture 4%
Residential 35%
DemandTotal: 31 928 MW
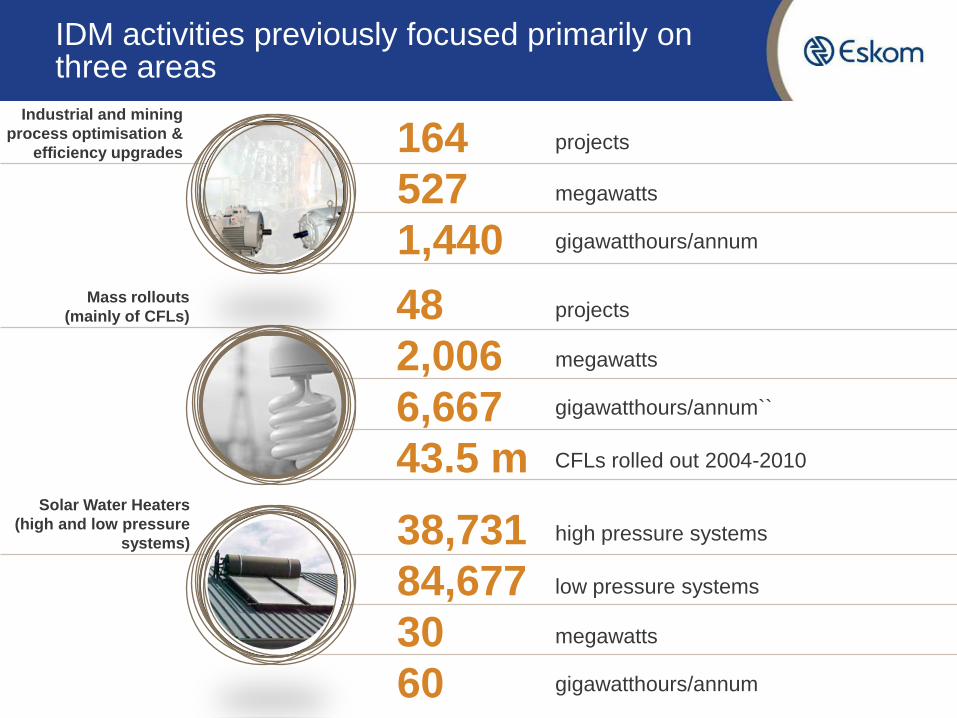
IDM activities previously focused primarily on three areas
164
527
1,440
Industrial and mining
process optimisation &
efficiency upgrades
48
2,006
6,667
43.5 m
38,731
84,677
30
60
Mass rollouts
(mainly of CFLs)
Solar Water Heaters
(high and low pressure
systems)
projects
megawatts
gigawatthours/annum
projects
megawatts
gigawatthours/annum``
low pressure systems
megawatts
gigawatthours/annum
high pressure systems
CFLs rolled out 2004-2010
CAPABILITIESPast EESM Successes
400
64
5
432
301
38
152
152
152
152
152
289
0.8
55
56
58
393
539
657
37
6
370
0.5
38
45
50
14
3
469
701
436
357
0
100
200
300
400
500
600
700
800
2003 2004 2005-3m period 2005/6 2006/7 2007/8 2008/9 2009/10 2010/11
Eskom Target NERSA Target
Contracted MW Verified MW
16
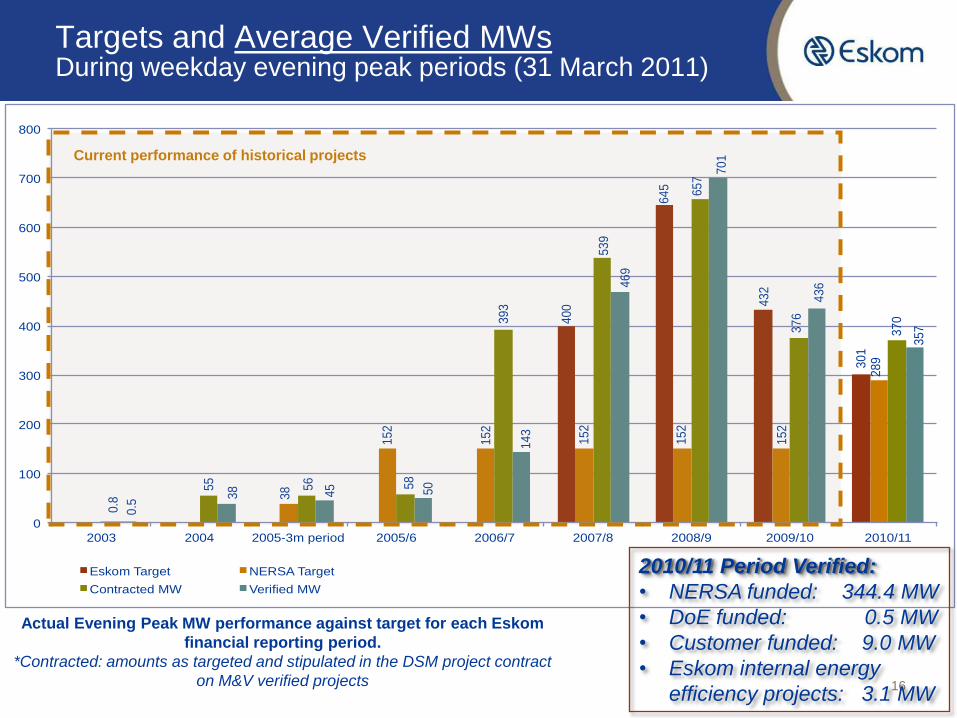
Targets and Average Verified MWs During weekday evening peak periods (31 March 2011)
Actual Evening Peak MW performance against target for each Eskom
financial reporting period.
*Contracted: amounts as targeted and stipulated in the DSM project contract
on M&V verified projects
Current performance of historical projects
2010/11 Period Verified:
• NERSA funded: 344.4 MW
• DoE funded: 0.5 MW
• Customer funded: 9.0 MW
• Eskom internal energy
efficiency projects: 3.1 MW
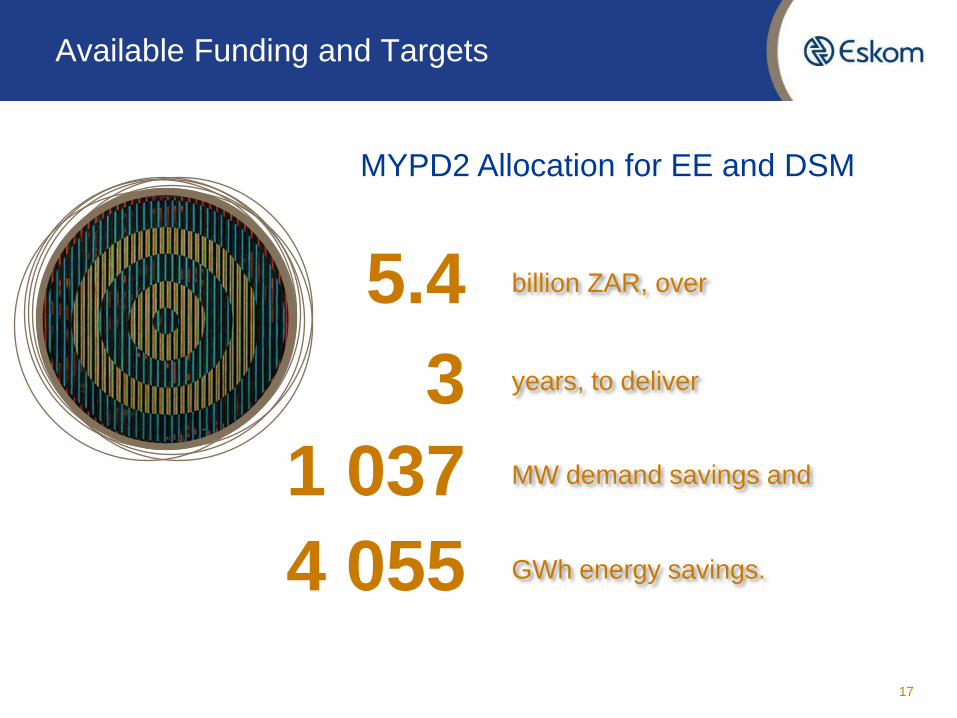
Available Funding and Targets
17
3
5.4
4 055
1 037
billion ZAR, over
years, to deliver
MW demand savings and
GWh energy savings.
MYPD2 Allocation for EE and DSM
Allocated Funding
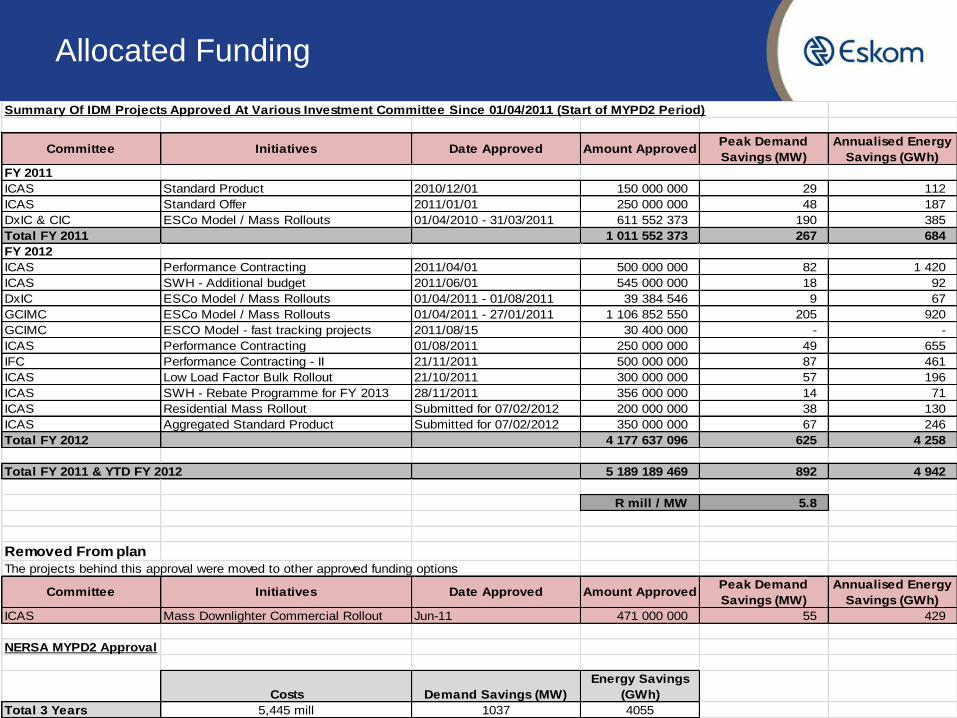
Summary Of IDM Projects Approved At Various Investment Committee Since 01/04/2011 (Start of MYPD2 Period)
Committee Initiatives Date Approved Amount ApprovedPeak Demand
Savings (MW)
Annualised Energy
Savings (GWh)
FY 2011
ICAS Standard Product 2010/12/01 150 000 000 29 112
ICAS Standard Offer 2011/01/01 250 000 000 48 187
DxIC & CIC ESCo Model / Mass Rollouts 01/04/2010 - 31/03/2011 611 552 373 190 385
Total FY 2011 1 011 552 373 267 684
FY 2012
ICAS Performance Contracting 2011/04/01 500 000 000 82 1 420
ICAS SWH - Additional budget 2011/06/01 545 000 000 18 92
DxIC ESCo Model / Mass Rollouts 01/04/2011 - 01/08/2011 39 384 546 9 67
GCIMC ESCo Model / Mass Rollouts 01/04/2011 - 27/01/2011 1 106 852 550 205 920
GCIMC ESCO Model - fast tracking projects 2011/08/15 30 400 000 - -
ICAS Performance Contracting 01/08/2011 250 000 000 49 655
IFC Performance Contracting - II 21/11/2011 500 000 000 87 461
ICAS Low Load Factor Bulk Rollout 21/10/2011 300 000 000 57 196
ICAS SWH - Rebate Programme for FY 2013 28/11/2011 356 000 000 14 71
ICAS Residential Mass Rollout Submitted for 07/02/2012 200 000 000 38 130
ICAS Aggregated Standard Product Submitted for 07/02/2012 350 000 000 67 246
Total FY 2012 4 177 637 096 625 4 258
Total FY 2011 & YTD FY 2012 5 189 189 469 892 4 942
R mill / MW 5.8
Removed From plan
The projects behind this approval were moved to other approved funding options
Committee Initiatives Date Approved Amount ApprovedPeak Demand
Savings (MW)
Annualised Energy
Savings (GWh)
ICAS Mass Downlighter Commercial Rollout Jun-11 471 000 000 55 429
NERSA MYPD2 Approval
Costs Demand Savings (MW)
Energy Savings
(GWh)
Total 3 Years 5,445 mill 1037 4055
EEDSM FUNDINGMechanisms and Programmes
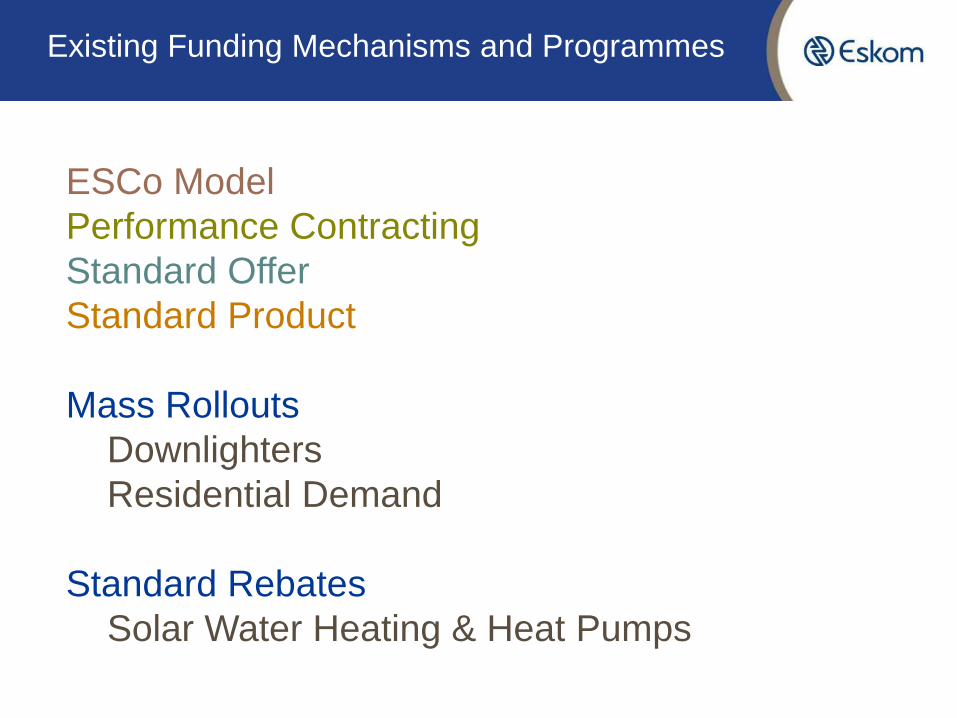
Existing Funding Mechanisms and Programmes
ESCo Model
Performance Contracting
Standard Offer
Standard Product
Mass Rollouts
Downlighters
Residential Demand
Standard Rebates
Solar Water Heating & Heat Pumps
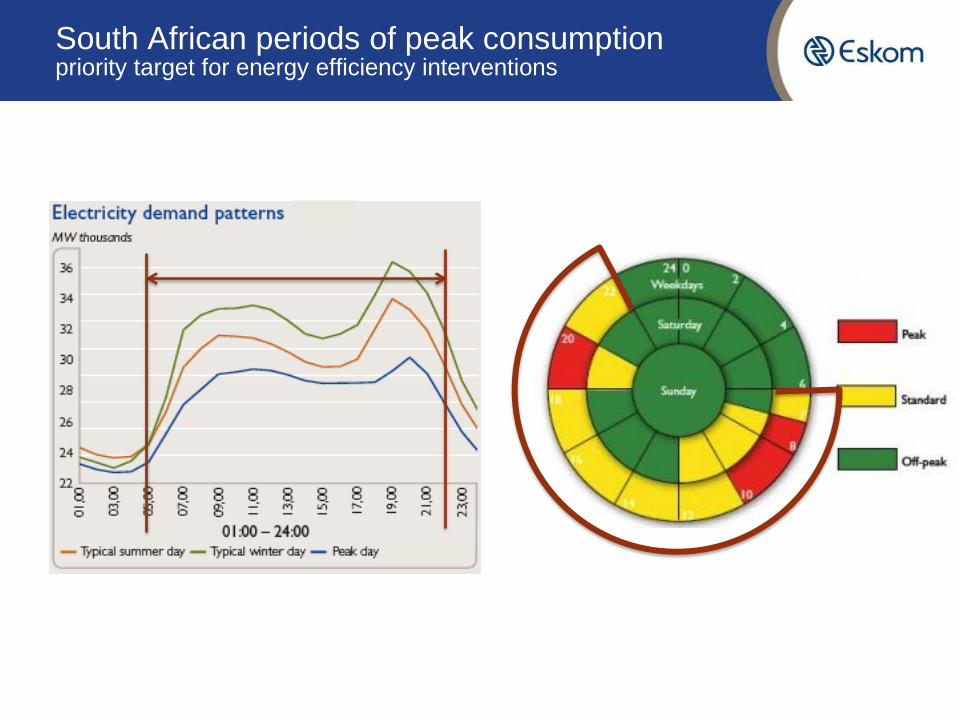
South African periods of peak consumption priority target for energy efficiency interventions
ESCo Model
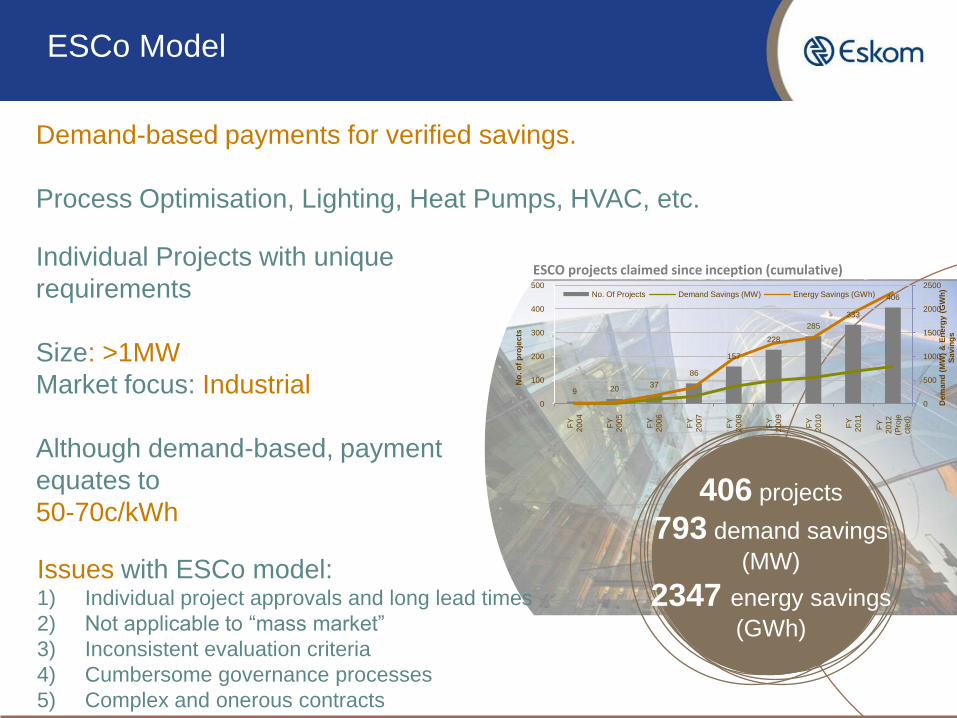
Demand-based payments for verified savings.
Process Optimisation, Lighting, Heat Pumps, HVAC, etc.
Individual Projects with unique
requirements
Size: >1MW
Market focus: Industrial
Although demand-based, payment
equates to
50-70c/kWh
9 2037
86
157
228
285
333
406
0
500
1000
1500
2000
2500
0
100
200
300
400
500
FY
2
00
4
FY
2
00
5
FY
2
00
6
FY
2
00
7
FY
2
00
8
FY
2
00
9
FY
2
01
0
FY
2
01
1
FY
2
01
2
(Pro
jecte
d)
Dem
an
d (
MW
) &
En
erg
y (
GW
h)
Sa
vin
gs
No
. o
f p
roje
cts
No. Of Projects Demand Savings (MW) Energy Savings (GWh)
ESCO projects claimed since inception (cumulative)
406 projects
793 demand savings
(MW)
2347 energy savings
(GWh)
Issues with ESCo model:1) Individual project approvals and long lead times
2) Not applicable to “mass market”
3) Inconsistent evaluation criteria
4) Cumbersome governance processes
5) Complex and onerous contracts
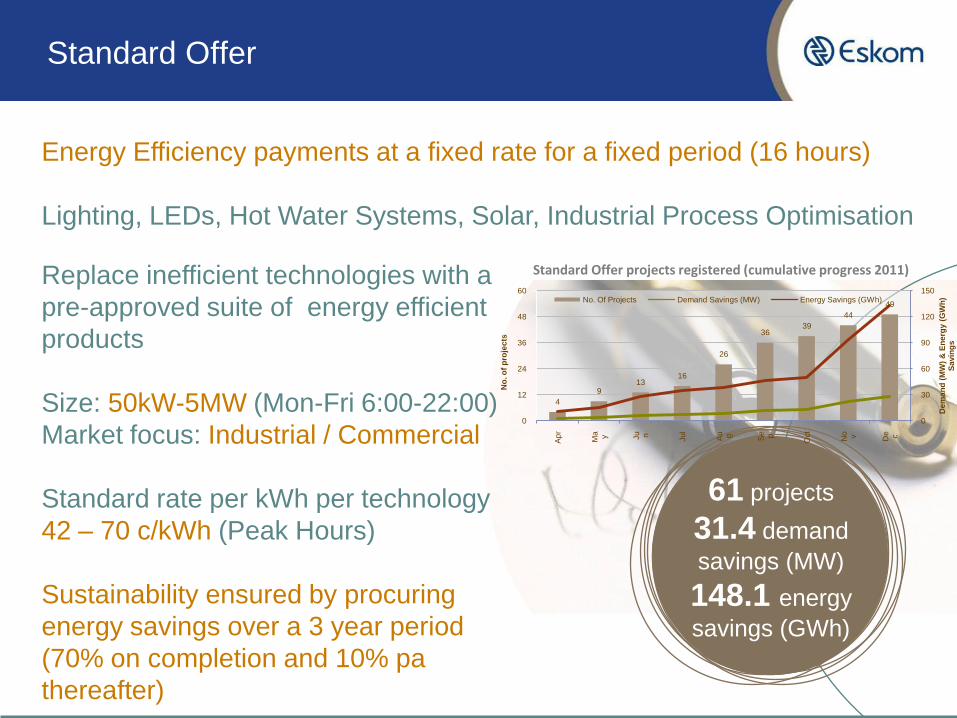
Standard Offer
Replace inefficient technologies with a
pre-approved suite of energy efficient
products
Size: 50kW-5MW (Mon-Fri 6:00-22:00)
Market focus: Industrial / Commercial
Standard rate per kWh per technology
42 – 70 c/kWh (Peak Hours)
Sustainability ensured by procuring
energy savings over a 3 year period
(70% on completion and 10% pa
thereafter)
Energy Efficiency payments at a fixed rate for a fixed period (16 hours)
Lighting, LEDs, Hot Water Systems, Solar, Industrial Process Optimisation
Standard Offer projects registered (cumulative progress 2011)
61 projects
31.4 demand
savings (MW)
148.1 energy
savings (GWh)
4
913
16
26
3639
44
49
0
30
60
90
120
150
0
12
24
36
48
60
Ap
r
Ma y Ju n
Ju
l
Au g Se p
Oct
No v De c
Dem
an
d (
MW
) &
En
erg
y (
GW
h)
Sa
vin
gs
No
. o
f p
roje
cts
No. Of Projects Demand Savings (MW) Energy Savings (GWh)
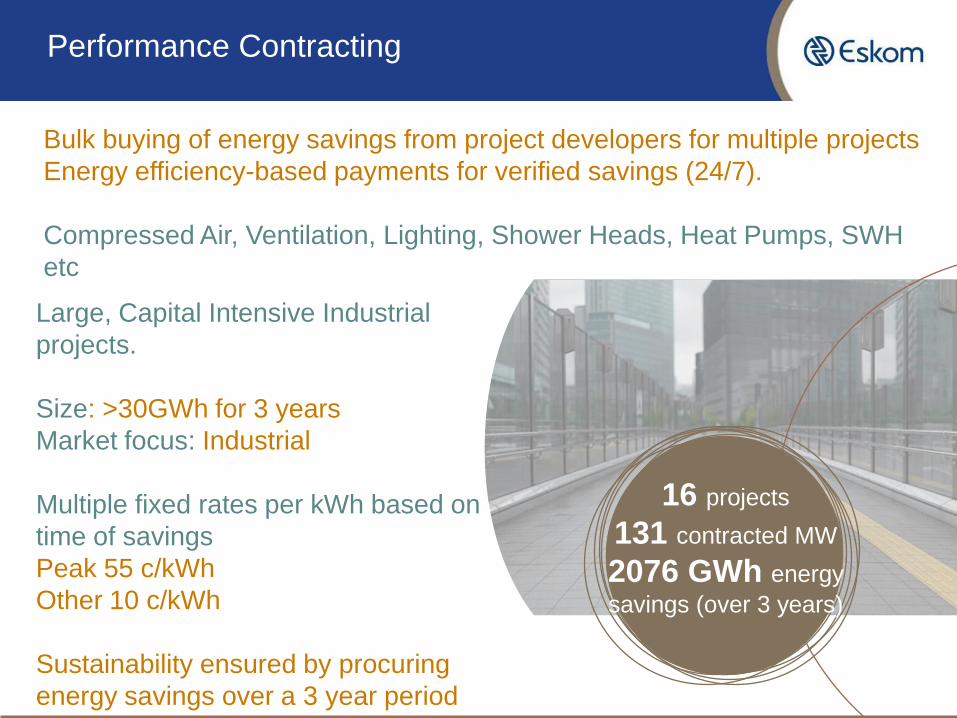
Performance Contracting
Bulk buying of energy savings from project developers for multiple projects
Energy efficiency-based payments for verified savings (24/7).
Compressed Air, Ventilation, Lighting, Shower Heads, Heat Pumps, SWH
etc
Large, Capital Intensive Industrial
projects.
Size: >30GWh for 3 years
Market focus: Industrial
Multiple fixed rates per kWh based on
time of savings
Peak 55 c/kWh
Other 10 c/kWh
Sustainability ensured by procuring
energy savings over a 3 year period
16 projects
131 contracted MW
2076 GWh energy
savings (over 3 years)
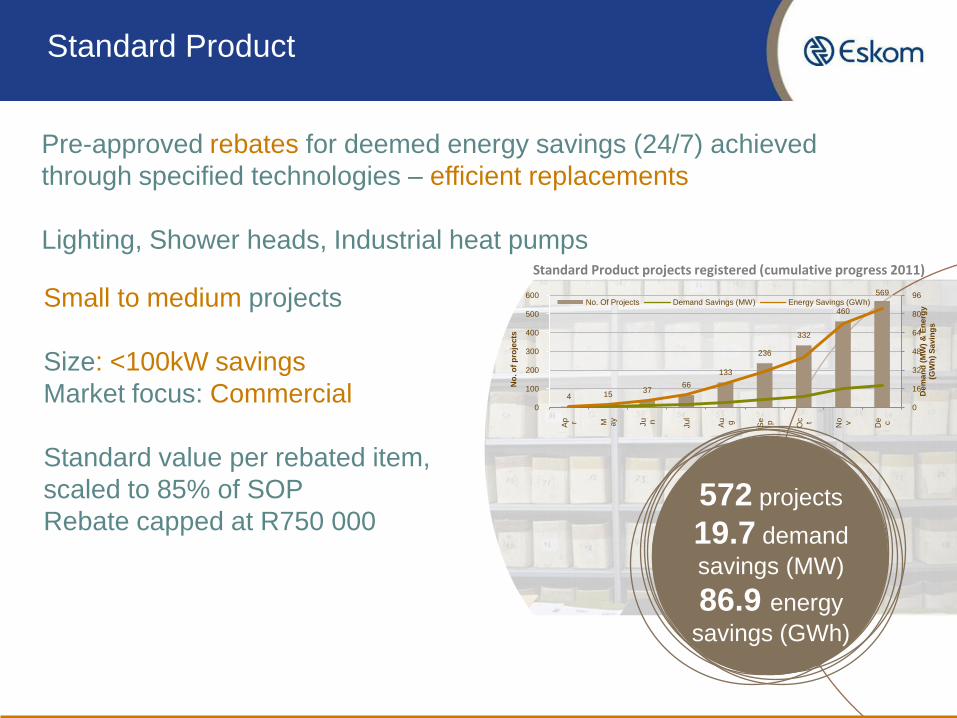
Standard Product
Small to medium projects
Size: <100kW savings
Market focus: Commercial
Standard value per rebated item,
scaled to 85% of SOP
Rebate capped at R750 000
Pre-approved rebates for deemed energy savings (24/7) achieved
through specified technologies – efficient replacements
Lighting, Shower heads, Industrial heat pumpsStandard Product projects registered (cumulative progress 2011)
572 projects
19.7 demand
savings (MW)
86.9 energy
savings (GWh)
4 1537
66
133
236
332
460
569
0
16
32
48
64
80
96
0
100
200
300
400
500
600
Ap r M ay
Ju n
Ju
l
Au g Se p Oc t
No v De c
Dem
an
d (
MW
) &
En
erg
y
(GW
h)
Sa
vin
gs
No
. o
f p
roje
cts
No. Of Projects Demand Savings (MW) Energy Savings (GWh)
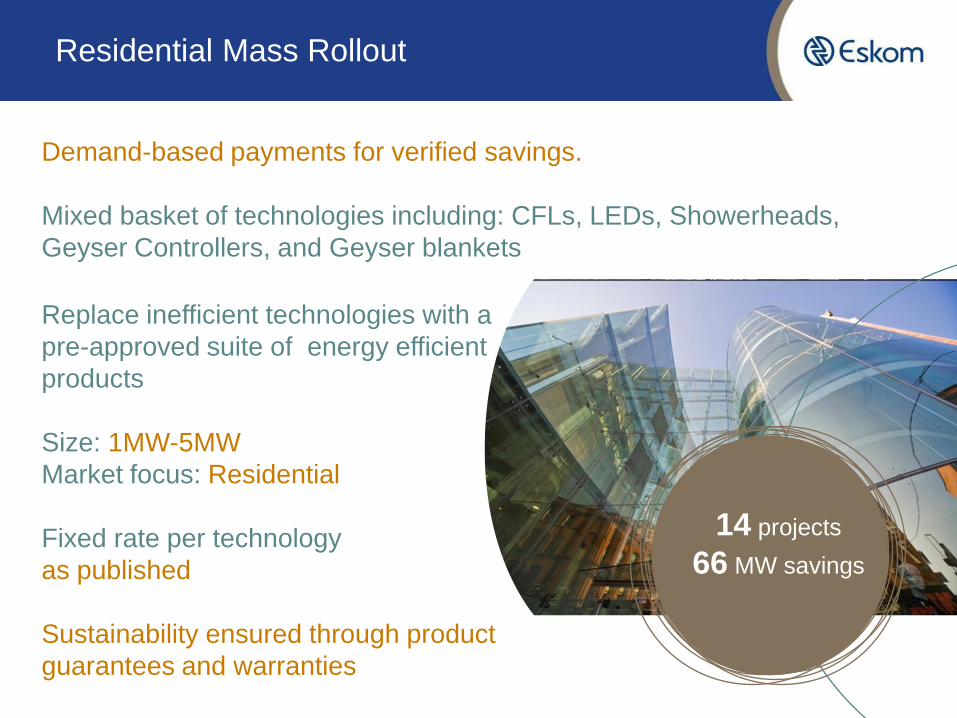
Residential Mass Rollout
Replace inefficient technologies with a
pre-approved suite of energy efficient
products
Size: 1MW-5MW
Market focus: Residential
Fixed rate per technology
as published
Sustainability ensured through product
guarantees and warranties
Demand-based payments for verified savings.
Mixed basket of technologies including: CFLs, LEDs, Showerheads,
Geyser Controllers, and Geyser blankets
14 projects
66 MW savings
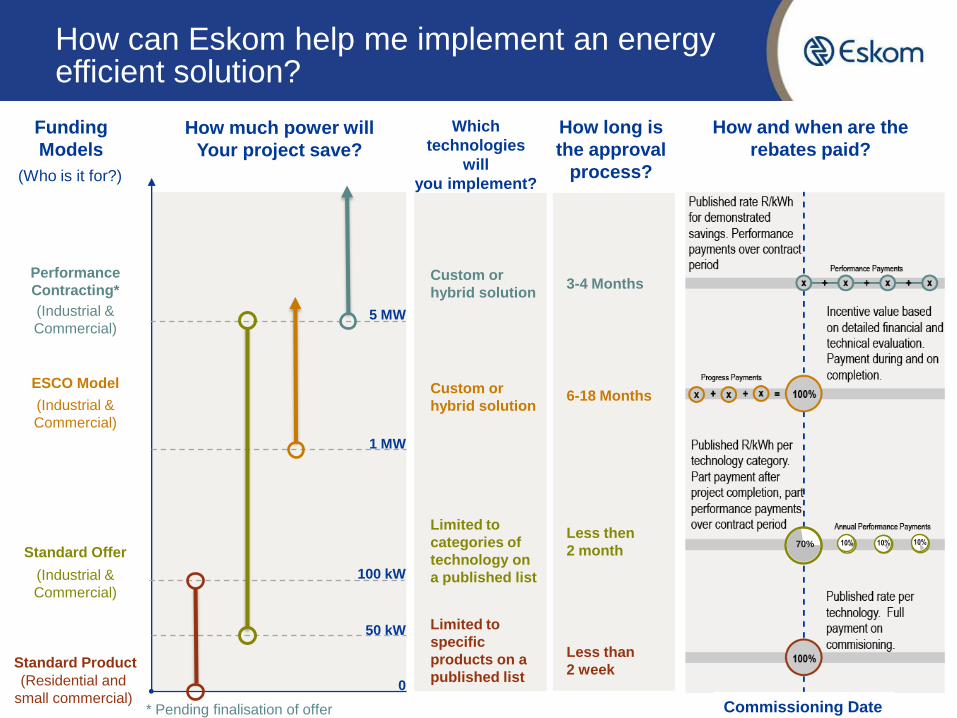
How can Eskom help me implement an energy efficient solution?
3-4 Months
6-18 Months
Less then
2 month
Less than
2 week
* Pending finalisation of offer
Custom or
hybrid solution
Custom or
hybrid solution
Limited to
categories of
technology on
a published list
Limited to
specific
products on a
published list
Performance
Contracting*
ESCO Model
Standard Offer
Standard Product
Funding
Models
How much power will
Your project save?
Which
technologies
will
you implement?
How long is
the approval
process?
How and when are the
rebates paid?
5 MW
1 MW
100 kW
50 kW
0
(Who is it for?)
(Industrial &
Commercial)
(Industrial &
Commercial)
(Residential and
small commercial)
(Industrial &
Commercial)
70% 10% 10% 10%
Commissioning Date
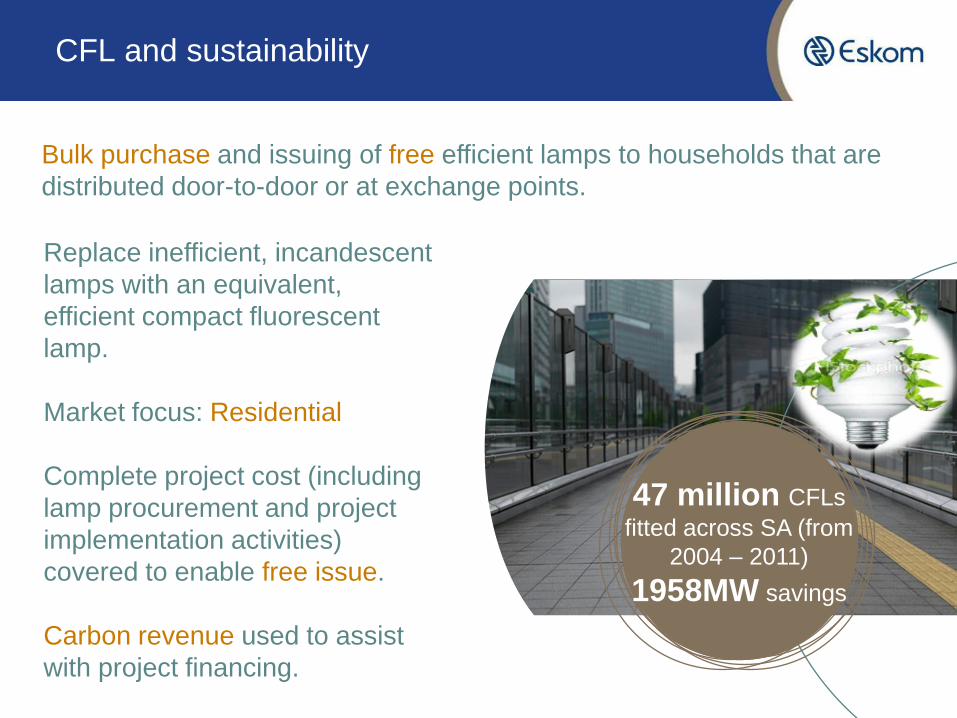
CFL and sustainability
47 million CFLs
fitted across SA (from
2004 – 2011)
1958MW savings
Bulk purchase and issuing of free efficient lamps to households that are
distributed door-to-door or at exchange points.
Replace inefficient, incandescent
lamps with an equivalent,
efficient compact fluorescent
lamp.
Market focus: Residential
Complete project cost (including
lamp procurement and project
implementation activities)
covered to enable free issue.
Carbon revenue used to assist
with project financing.
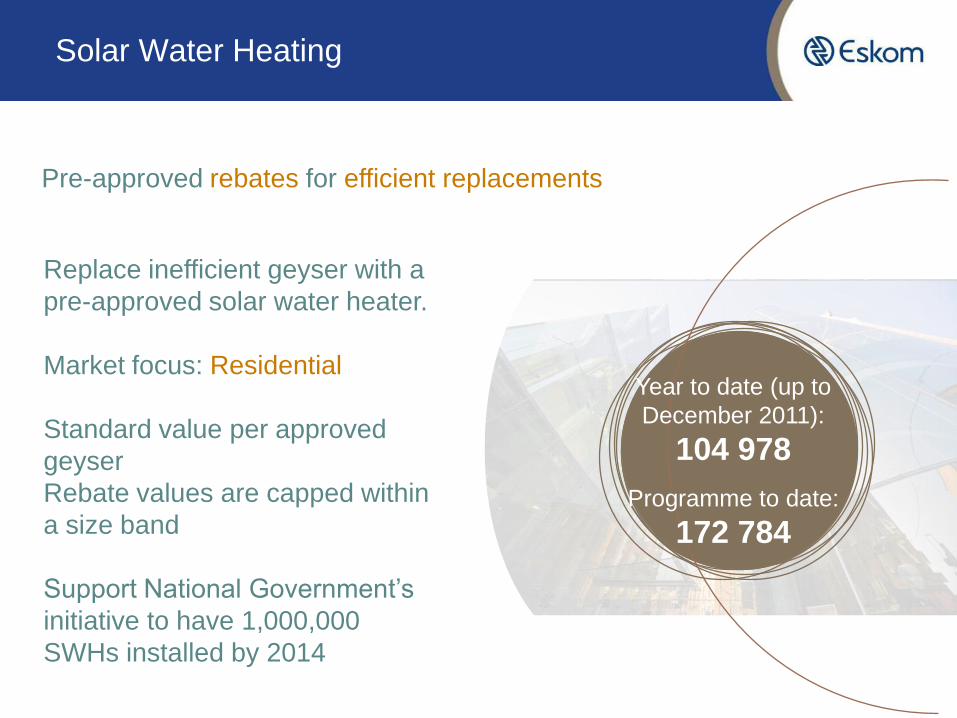
Solar Water Heating
Pre-approved rebates for efficient replacements
Replace inefficient geyser with a
pre-approved solar water heater.
Market focus: Residential
Standard value per approved
geyser
Rebate values are capped within
a size band
Support National Government’s
initiative to have 1,000,000
SWHs installed by 2014
Year to date (up to
December 2011):
104 978
Programme to date:
172 784
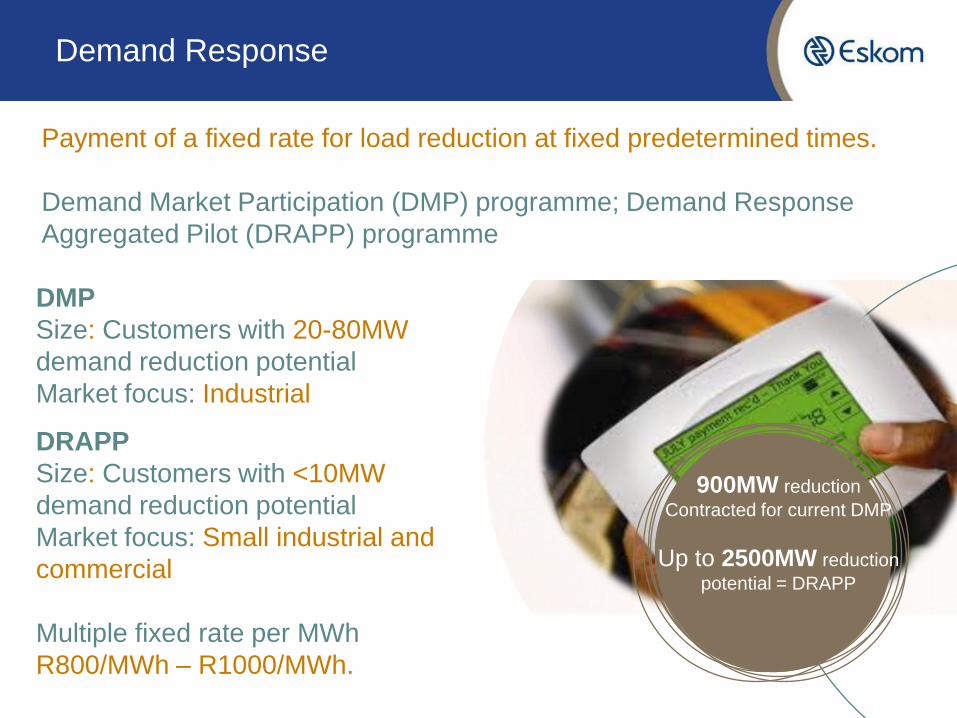
Demand Response
900MW reduction
Contracted for current DMP
Up to 2500MW reduction
potential = DRAPP
Payment of a fixed rate for load reduction at fixed predetermined times.
Demand Market Participation (DMP) programme; Demand Response
Aggregated Pilot (DRAPP) programme
DMP
Size: Customers with 20-80MW
demand reduction potential
Market focus: Industrial
DRAPP
Size: Customers with <10MW
demand reduction potential
Market focus: Small industrial and
commercial
Multiple fixed rate per MWh
R800/MWh – R1000/MWh.

Industrial Commercial / Agricultural Residential
ESCO
Performance Contracting
Standard Offer
Standard Product
Downlighters Mass
Roll-out
Residential Mass Roll-out
SWH / HP Rebate
Other Mass Rollout
Current Solutions
TECHNOLOGY
KEY:
PRIORITY 1PRIORITY 2Priority 3
Compressed Air, Ventilation, Lighting, Shower Heads,
Heat Pumps, SWH, etc.
Process Optimisation, Lighting
Heat Pumps, HVAC etc.
Energy
Solutions
Demand
Solutions
Lighting, Hot Water Systems,
Solar , Process Optimisation
Lighting, Shower Heads,
Industrial Heat Pumps
LED Downlighters, & CFL
downlighters
HP & LP Solar Water
Heaters, Heat Pumps
CFL Sustainability and
Fill-ins
Focus on Industrial Market,
catering for individual projects with
unique requirements
Target industrial, large
capital projects to increase
commitment and reduce risk
of non-delivery
• Extend into industrial
market
• Adjust pricing to
increase uptake
Incorporate into SO
to rationalise
solutions in
Commercial market
Residential “Mixed
Bag” of technologies

LESSONS LEARNED
Some observations and thing we need to improve on
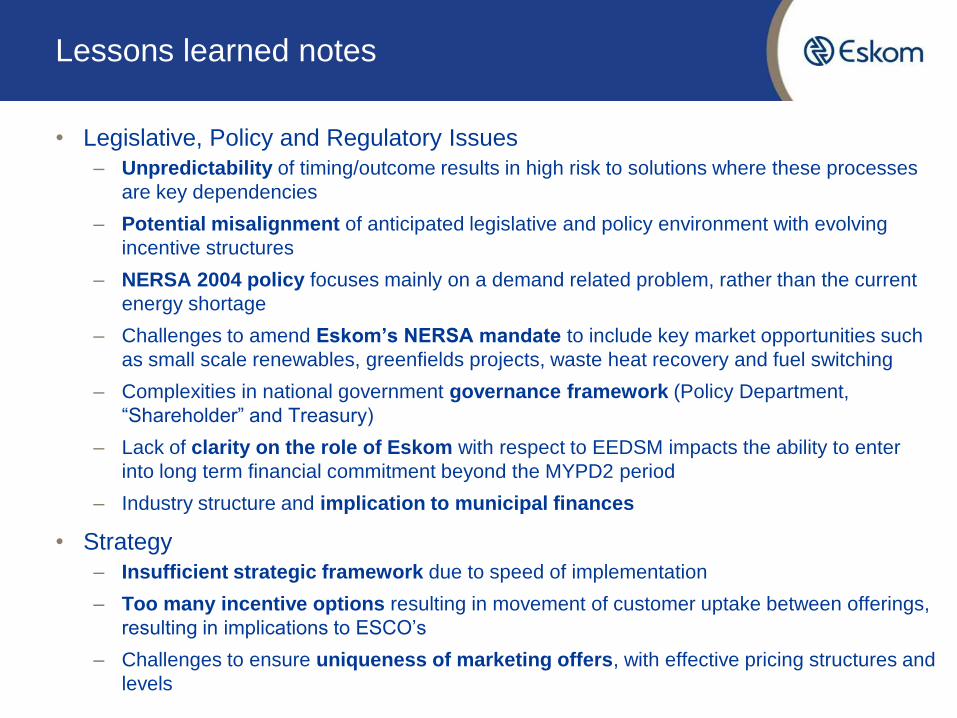
Lessons learned notes
• Legislative, Policy and Regulatory Issues
– Unpredictability of timing/outcome results in high risk to solutions where these processes
are key dependencies
– Potential misalignment of anticipated legislative and policy environment with evolving
incentive structures
– NERSA 2004 policy focuses mainly on a demand related problem, rather than the current
energy shortage
– Challenges to amend Eskom’s NERSA mandate to include key market opportunities such
as small scale renewables, greenfields projects, waste heat recovery and fuel switching
– Complexities in national government governance framework (Policy Department,
“Shareholder” and Treasury)
– Lack of clarity on the role of Eskom with respect to EEDSM impacts the ability to enter
into long term financial commitment beyond the MYPD2 period
– Industry structure and implication to municipal finances
• Strategy
– Insufficient strategic framework due to speed of implementation
– Too many incentive options resulting in movement of customer uptake between offerings,
resulting in implications to ESCO’s
– Challenges to ensure uniqueness of marketing offers, with effective pricing structures and
levels
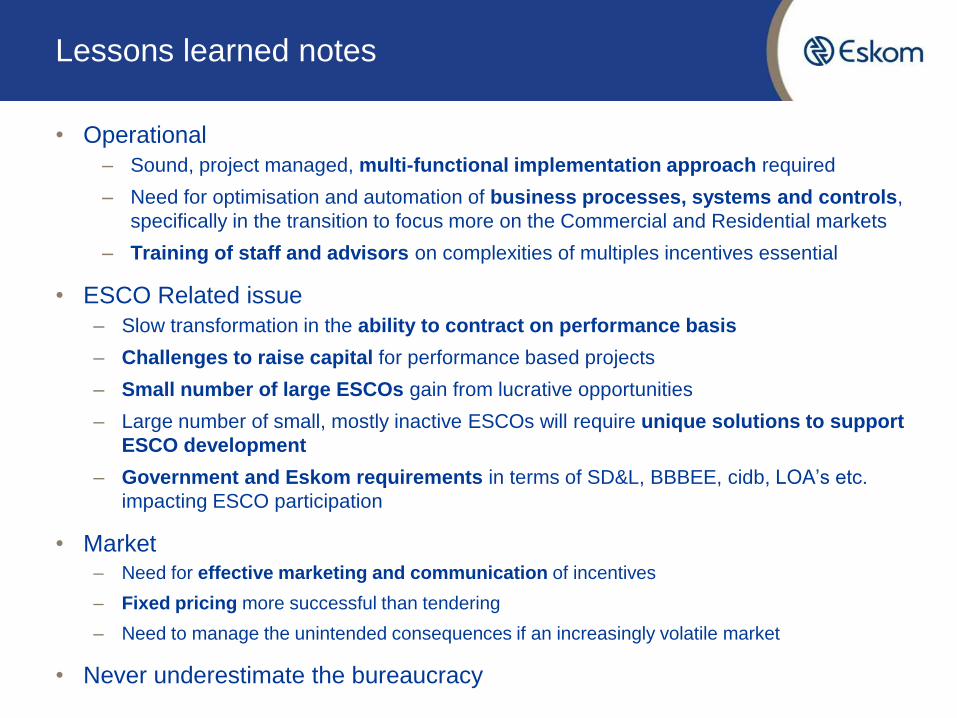
Lessons learned notes
• Operational
– Sound, project managed, multi-functional implementation approach required
– Need for optimisation and automation of business processes, systems and controls,
specifically in the transition to focus more on the Commercial and Residential markets
– Training of staff and advisors on complexities of multiples incentives essential
• ESCO Related issue
– Slow transformation in the ability to contract on performance basis
– Challenges to raise capital for performance based projects
– Small number of large ESCOs gain from lucrative opportunities
– Large number of small, mostly inactive ESCOs will require unique solutions to support
ESCO development
– Government and Eskom requirements in terms of SD&L, BBBEE, cidb, LOA’s etc.
impacting ESCO participation
• Market – Need for effective marketing and communication of incentives
– Fixed pricing more successful than tendering
– Need to manage the unintended consequences if an increasingly volatile market
• Never underestimate the bureaucracy

FUTUREEmerging and Future Focus
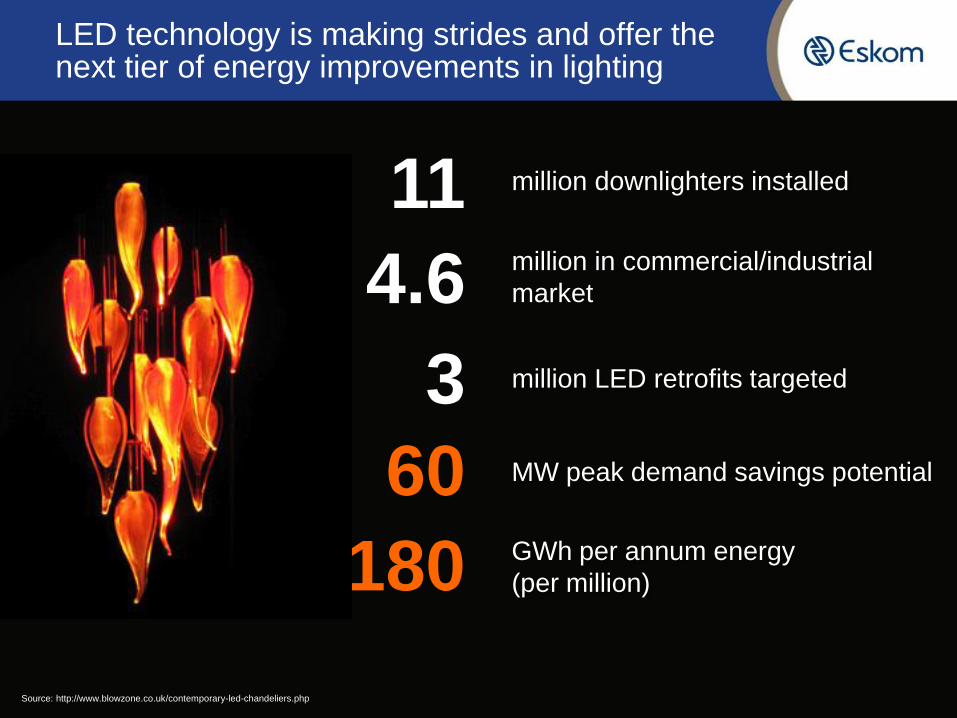
LED technology is making strides and offer the next tier of energy improvements in lighting
36
3
4.6
11
180
60
million downlighters installed
million in commercial/industrial
market
million LED retrofits targeted
MW peak demand savings potential
GWh per annum energy
(per million)
Source: http://www.blowzone.co.uk/contemporary-led-chandeliers.php
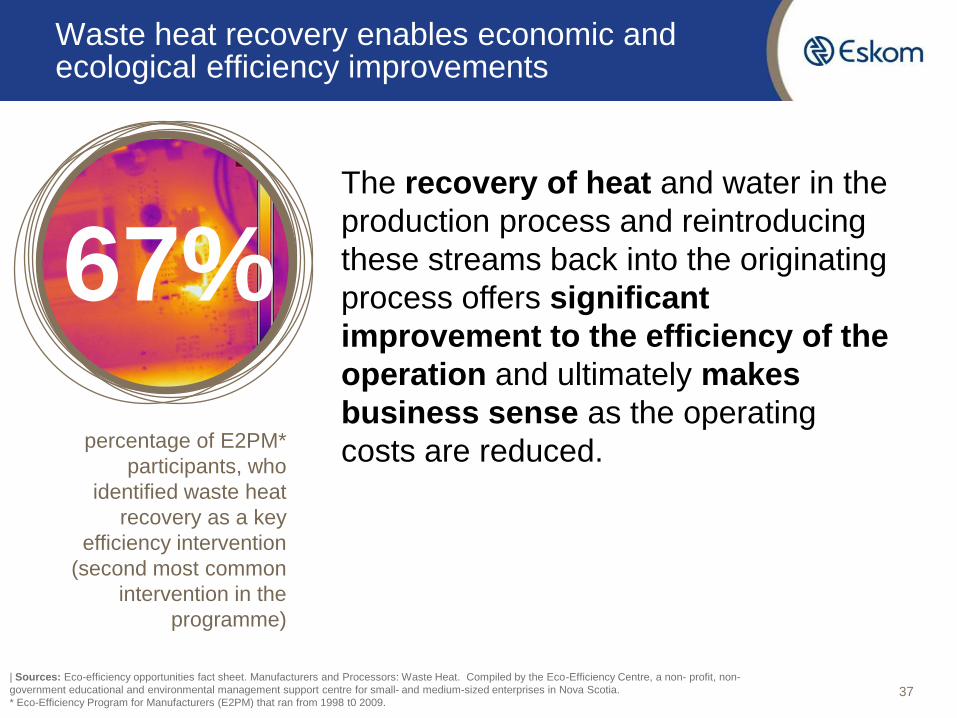
Waste heat recovery enables economic and ecological efficiency improvements
37
67%The recovery of heat and water in the
production process and reintroducing
these streams back into the originating
process offers significant
improvement to the efficiency of the
operation and ultimately makes
business sense as the operating
costs are reduced.
| Sources: Eco-efficiency opportunities fact sheet. Manufacturers and Processors: Waste Heat. Compiled by the Eco-Efficiency Centre, a non- profit, non-
government educational and environmental management support centre for small- and medium-sized enterprises in Nova Scotia.
* Eco-Efficiency Program for Manufacturers (E2PM) that ran from 1998 t0 2009.
percentage of E2PM*
participants, who
identified waste heat
recovery as a key
efficiency intervention
(second most common
intervention in the
programme)
Energy efficiency and renewable energy are key components of zero energy facilities
38
Formal commitments are being
made globally to pursue zero
energy goals.
This requires a combination of
energy efficiency and small-scale
renewable energy interventions.
Accordingly several initiatives,
including India’s Ministry of Power
and Canada’s Clean Air Partnership,
have broadened their definitions of
DSM to incorporate
green/renewable energy.
Eskom IDM, in consultation with
NERSA, is hoping to follow suit.
Supplier development & localisationA development imperative in South Africa
http://bee.thedti.gov.za/
http://www.eskom.co.za/c/61/eskom-purchasing-
policies/
http://www.eskom.co.za/c/63/supplier-criteria/
The South African Government is committed to job creation, economic
development (with specific priority to the development of green industry) and
aims to promote economic transformation in order to enable meaningful
participation of black South Africans in the economy. It is important to note that
these priorities have been incorporated into the procurement policies for the
country. Details area available from:
40
Government’s large scale renewable energy procurement programme
41
The South Africa’s Integrated Resource Plan (IRP) for electricity envisages
that independent power producers (IPPs) and State utility Eskom will build a
combined renewables base of 17,800 MW by 2030.
During August 2011, the South African Government took the first step in this
multidecade clean-energy investment programme by inviting tenders for
3,725 MW of renewable capacity to be developed by independent power
producers.
53 bids, representing some 2,100 MW of potential capacity, were received by
the DoE during this first bidding window. On 7 December 2011 the DOE
announced the first 28 successful renewable bidders for a total of 1,415.5
MW capacity. The preferred bidders named included 18 solar photovoltaic
(PV) projects, eight onshore wind projects and two concentrated solar power
(CSP) projects.
This round of tenders was the first of potentially 5 bidding windows. The
second bidding window is currently due to close on March 5, 2012.

Energy Efficiency Tax Incentive
42
The Department of Energy published draft regulations on the allowance for
energy efficiency savings* for public comment on 16 September 2011.
The Regulation is currently being revised to incorporate comments and recent
changes in the energy policy landscape (most notably the cancellation of the
REFIT which formed the basis for the calculation of the energy efficiency
allowance).
An ambitious target date for the revised Regulations to be published and
implemented has been set for April 2012.
Under section 19 of the National Energy Act, 2008 (Act No. 34 of 2008), read with section 12L of the Income Tax Act, 1962 (Act No. 58 of 1962)*