Embed Size (px)
Citation preview
An overview of CFD applications in flow assurance
From well head to the platform
Simon Lo
Contents – From well head to the platform
• Heat transfer in Christmas tree • Multiphase flow in long pipe • Severe slugging in riser • Sand transport in pipes • Temperature effects in transportation of viscous oil • Hydrate formation • Slug flow around pipe elbow • Riser V&V • 3 phase separator • Wave impact on platform • Launching of lifeboat
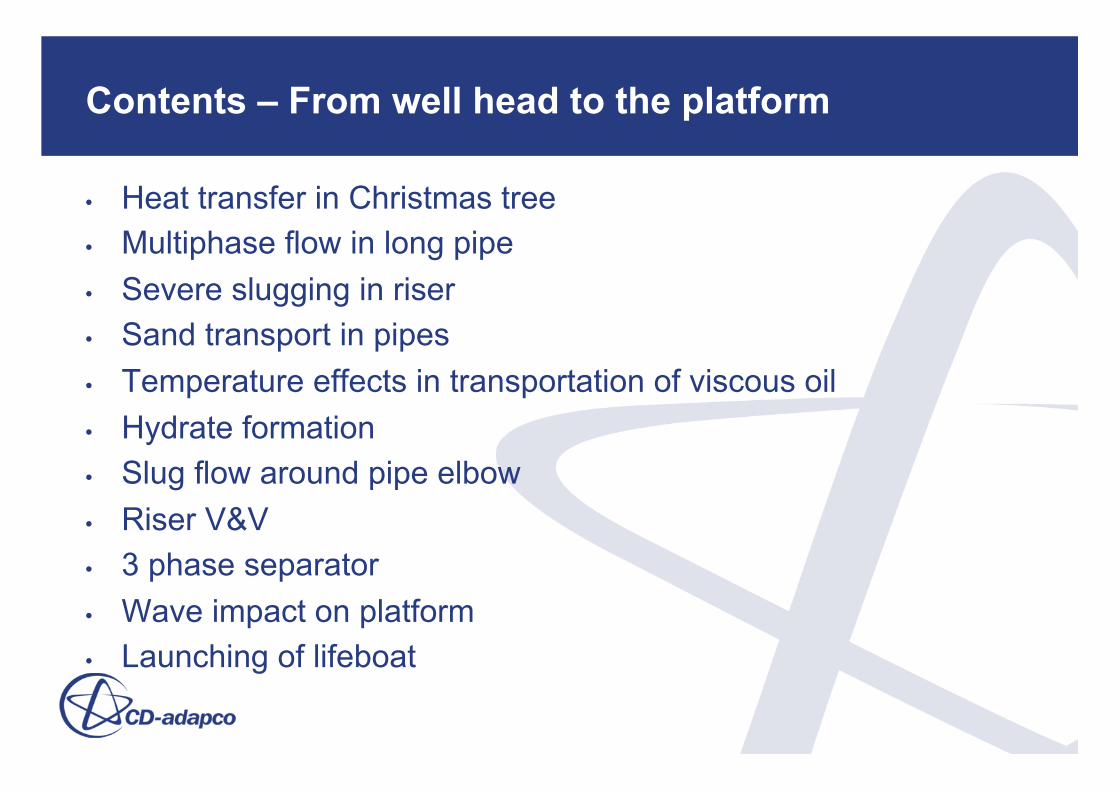
Flow in and around a Christmas tree
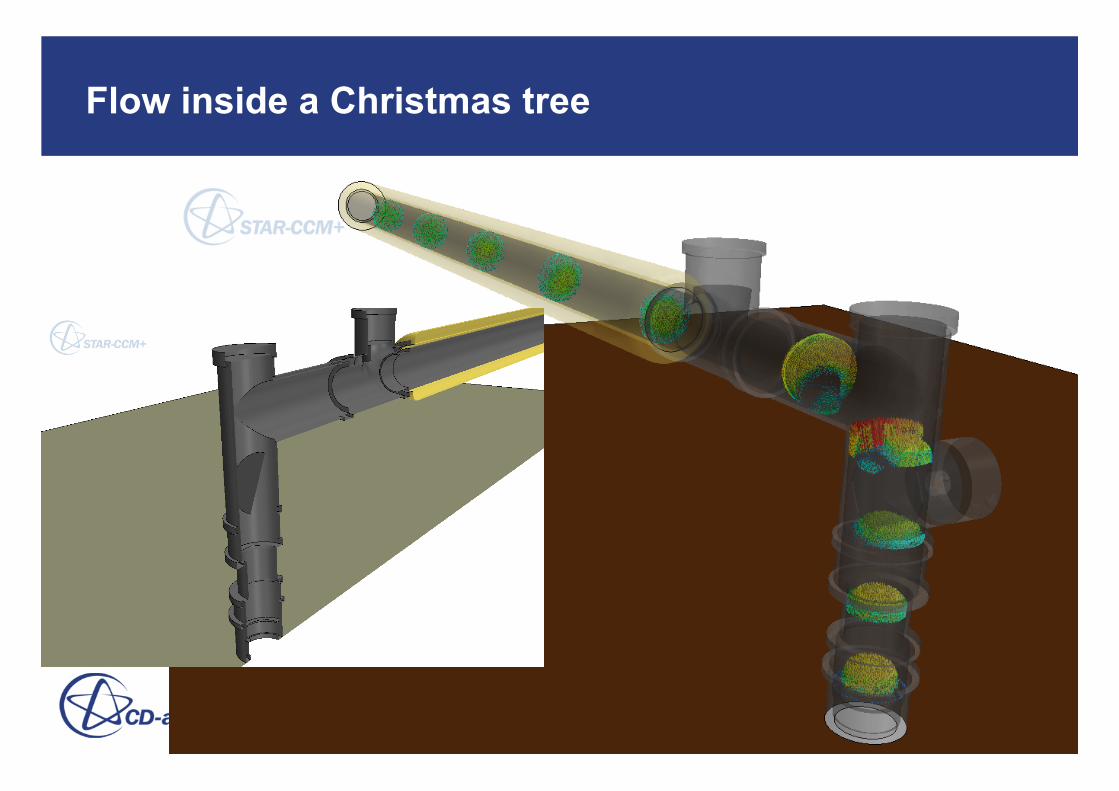
Flow inside a Christmas tree
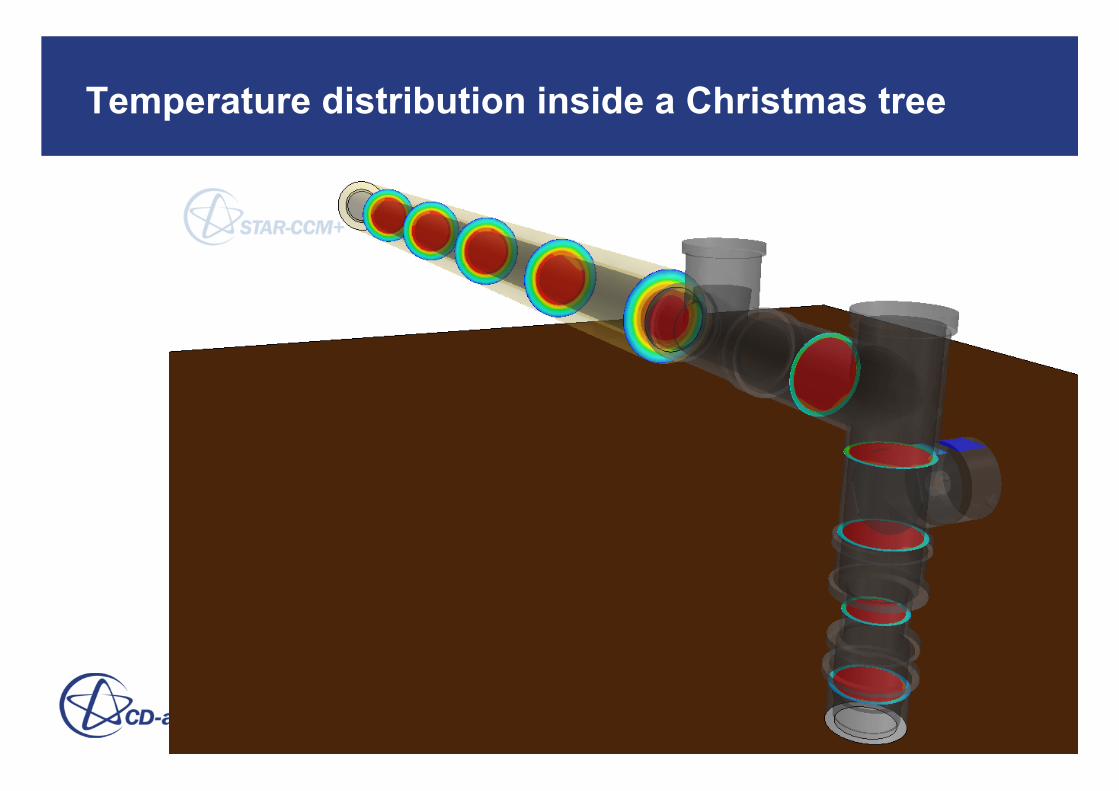
Temperature distribution inside a Christmas tree
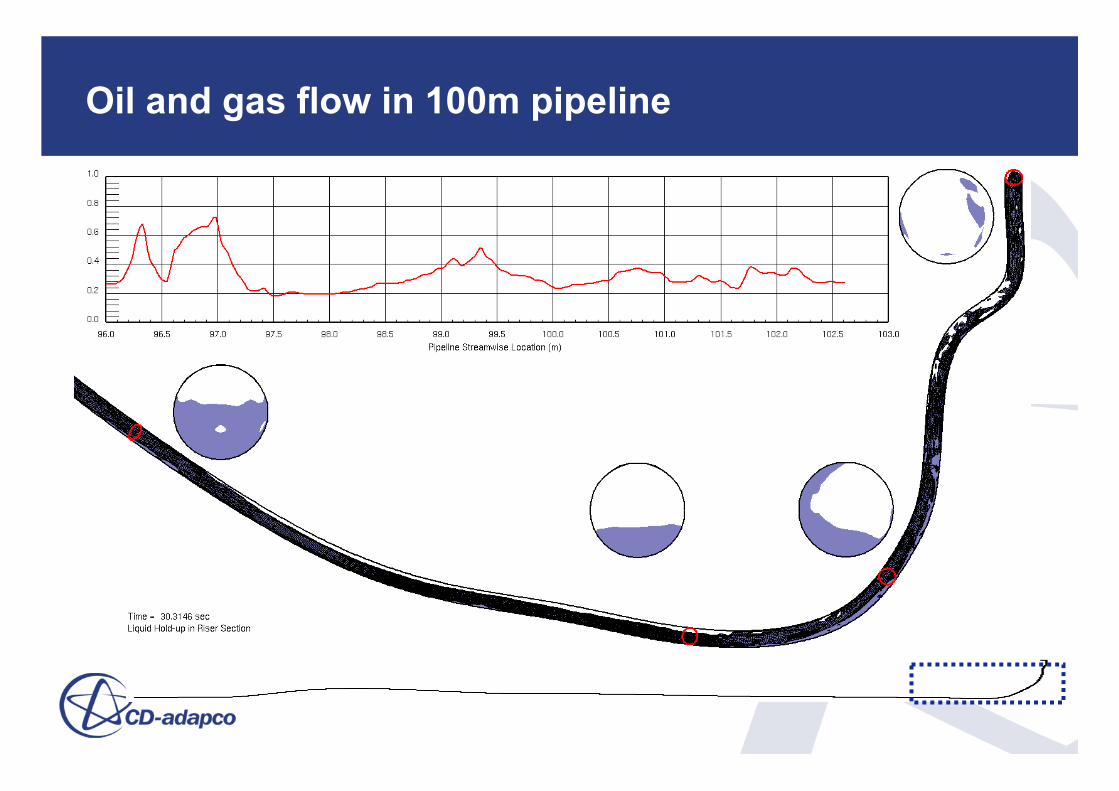
Oil and gas flow in 100m pipeline
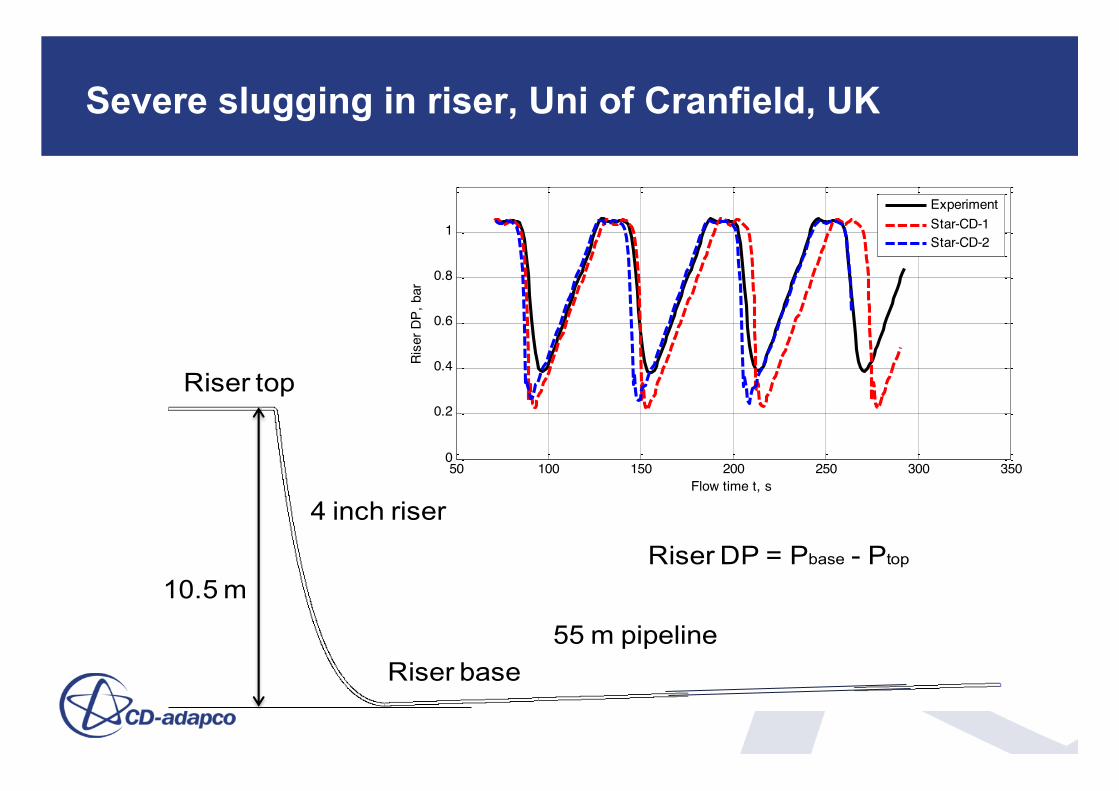
4 inch riser
55 m pipeline
10.5 m
Riser top
Riser base
Riser DP = Pbase - Ptop
Severe slugging in riser, Uni of Cranfield, UK
50 100 150 200 250 300 3500
0.2
0.4
0.6
0.8
1
Flow time t, s
Rise
r DP,
bar
ExperimentStar-CD-1Star-CD-2
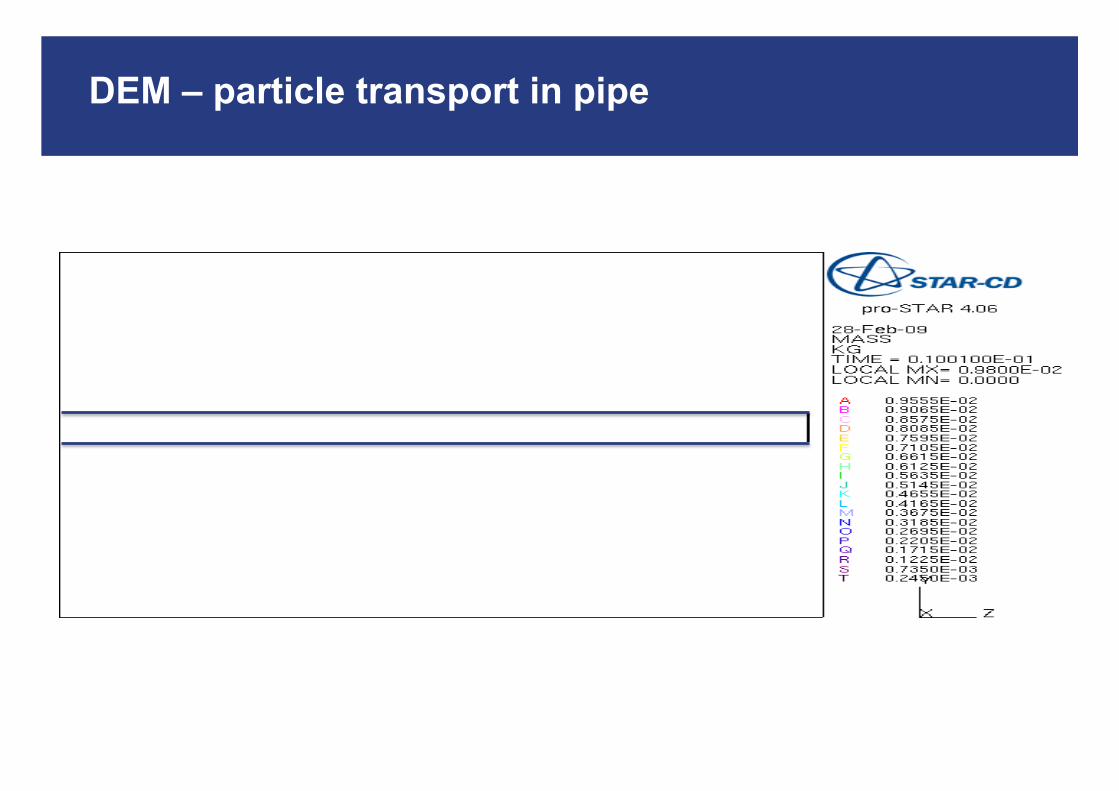
DEM – particle transport in pipe
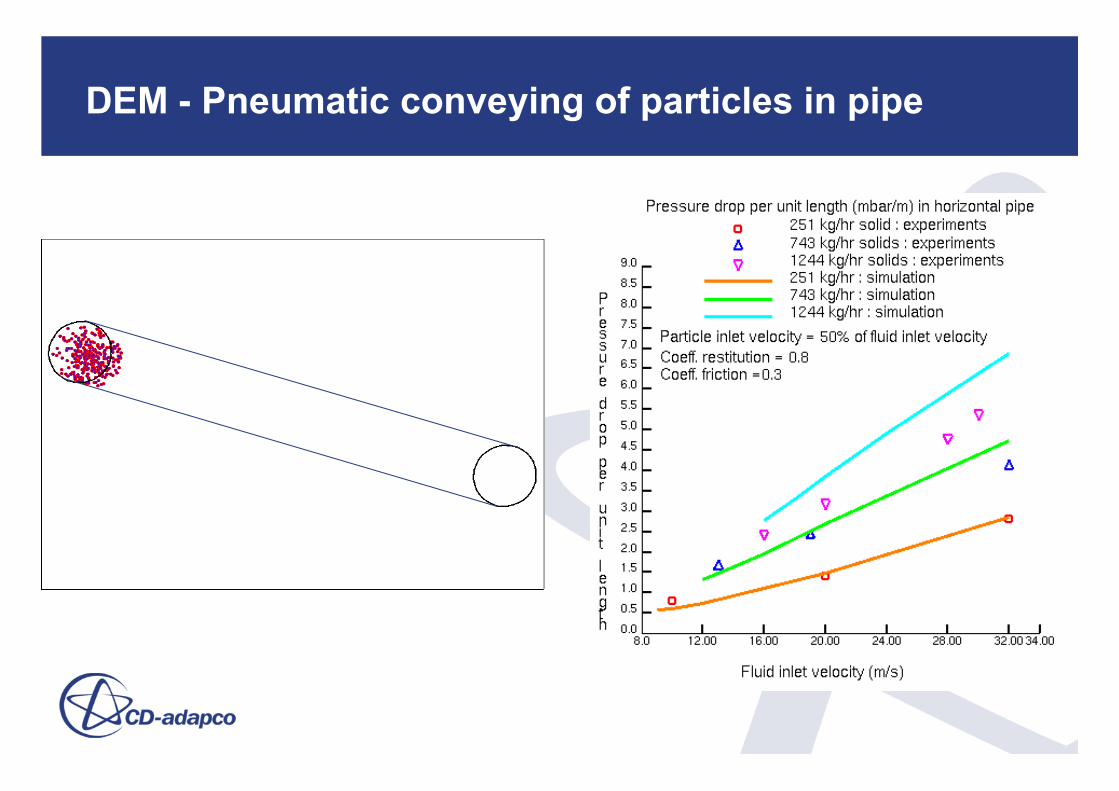
DEM - Pneumatic conveying of particles in pipe
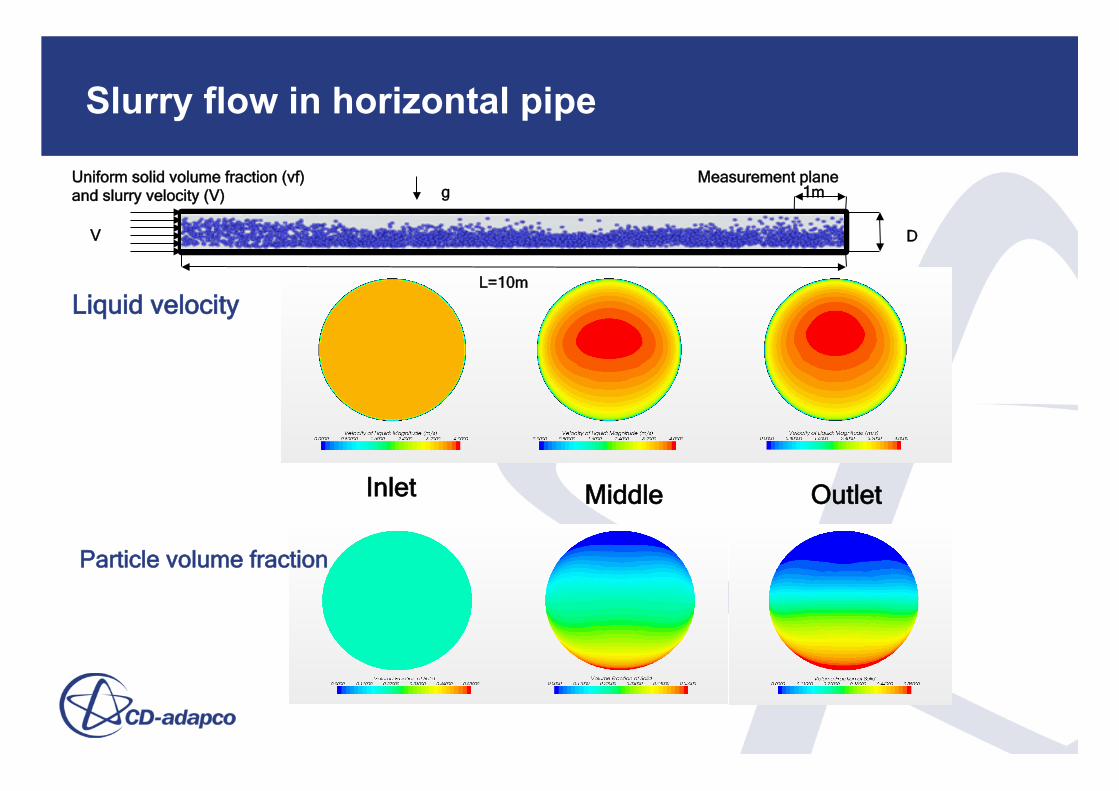
Horizontal slurry pipeline flow
Liquid velocity
Inlet Outlet Middle
Particle volume fraction
Slurry flow in horizontal pipe
Uniform solid volume fraction (vf) and slurry velocity (V) g
L=10m
V
1m
D
Measurement plane
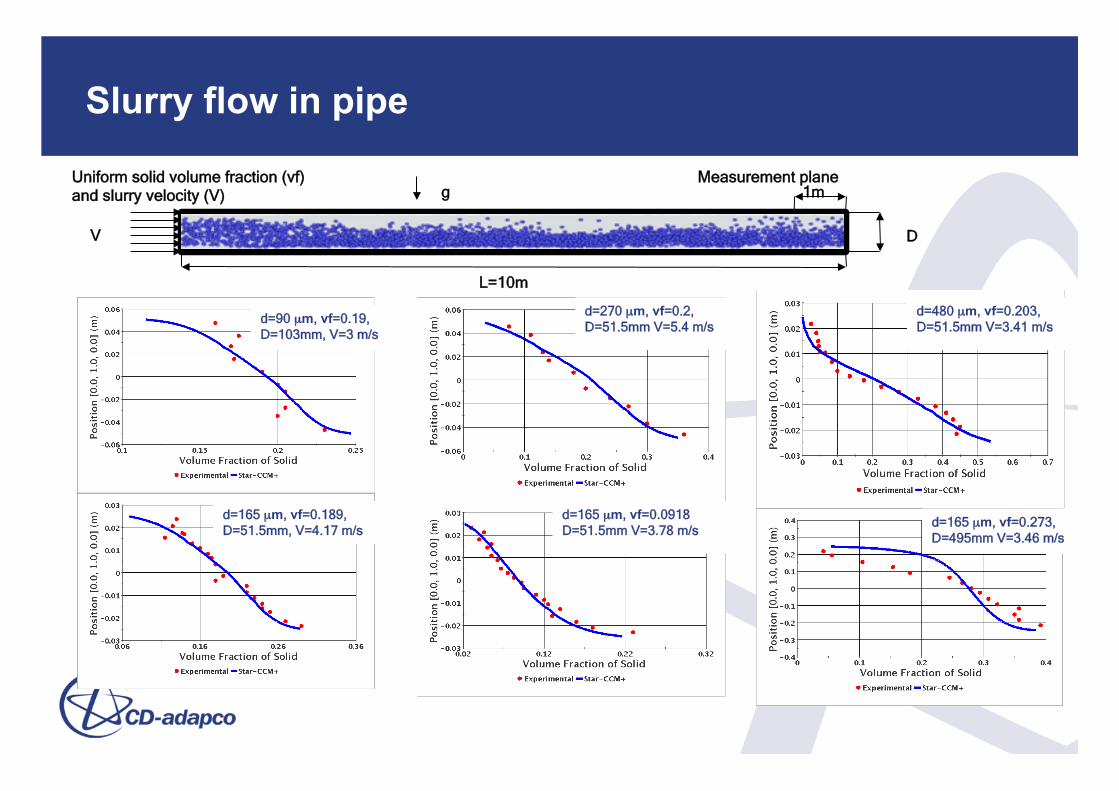
Slurry flow in pipe
d=90 µm, vf=0.19, D=103mm, V=3 m/s
d=165 µm, vf=0.189, D=51.5mm, V=4.17 m/s
Uniform solid volume fraction (vf) and slurry velocity (V) g
L=10m
V
1m
D
Measurement plane
d=270 µm, vf=0.2, D=51.5mm V=5.4 m/s
d=165 µm, vf=0.0918 D=51.5mm V=3.78 m/s
d=480 µm, vf=0.203, D=51.5mm V=3.41 m/s
d=165 µm, vf=0.273, D=495mm V=3.46 m/s
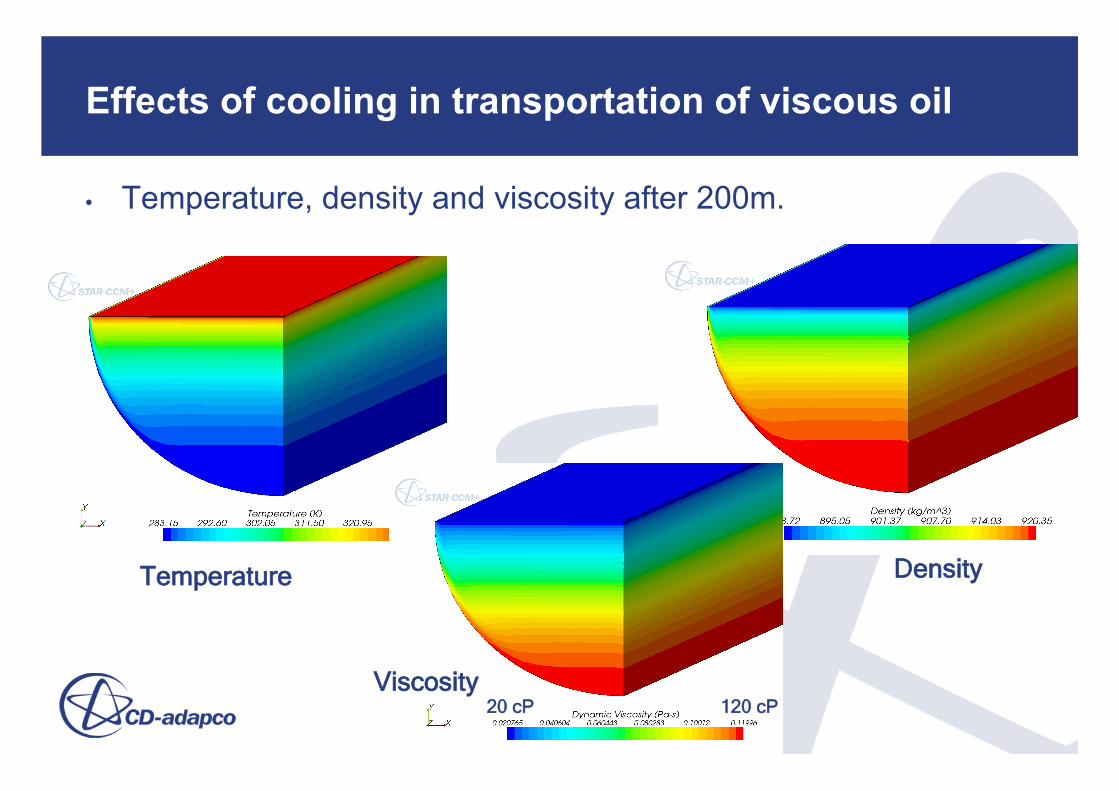
Effects of cooling in transportation of viscous oil
• Temperature, density and viscosity after 200m.
Temperature Density
Viscosity 120 cP 20 cP
Sec. 01
Sec. 02
Sec. 03
Sec. 04
Sec. 05
Sec. 06
Sec. 07
Sec. 08
Sec. 09
Sec. 10
A-1 0.0846
0.0756
0.0756
0.0756
0.0756
0.0756
0.0756
0.0756
0.0756
0.0756 A-2 0.145
5 0.174
0 0.203
0 0.226
9 0.247
3 0.264
9 0.280
2 0.293
6 0.305
2 0.315
4
0.00
0.05
0.10
0.15
0.20
0.25
0.30
0.35
Shea
r Str
ess
[N]
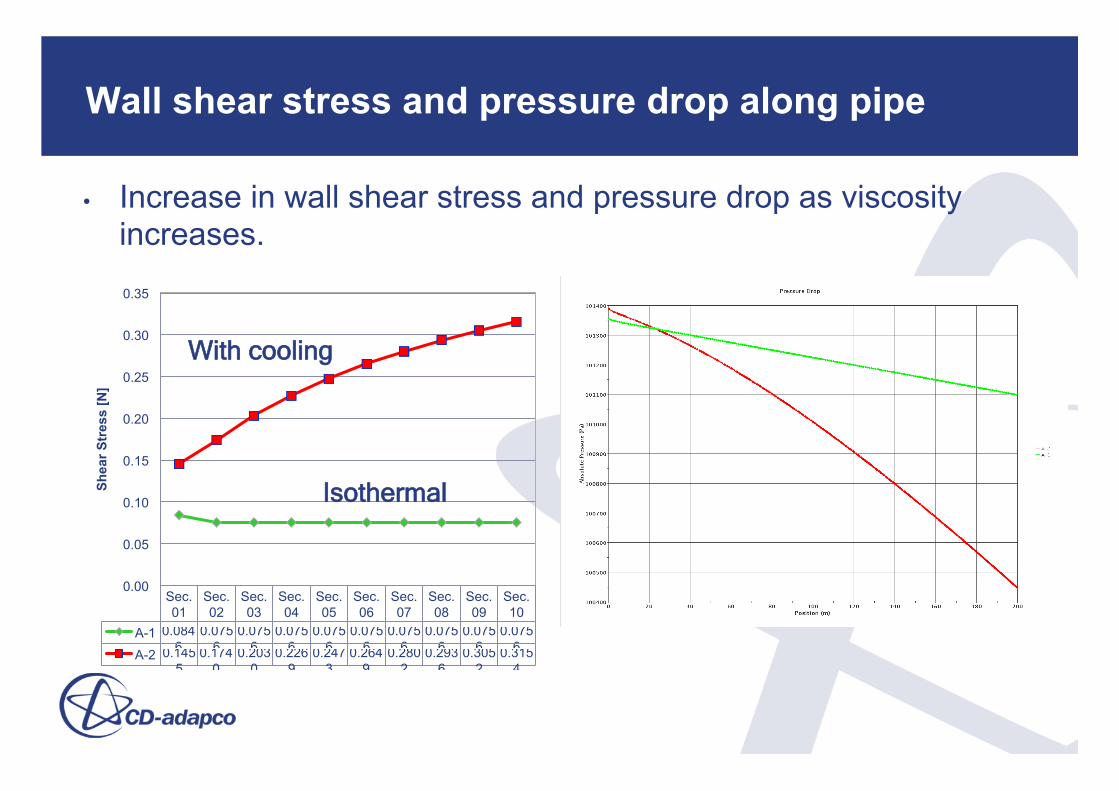
• Increase in wall shear stress and pressure drop as viscosity increases.
Wall shear stress and pressure drop along pipe
Isothermal
With cooling
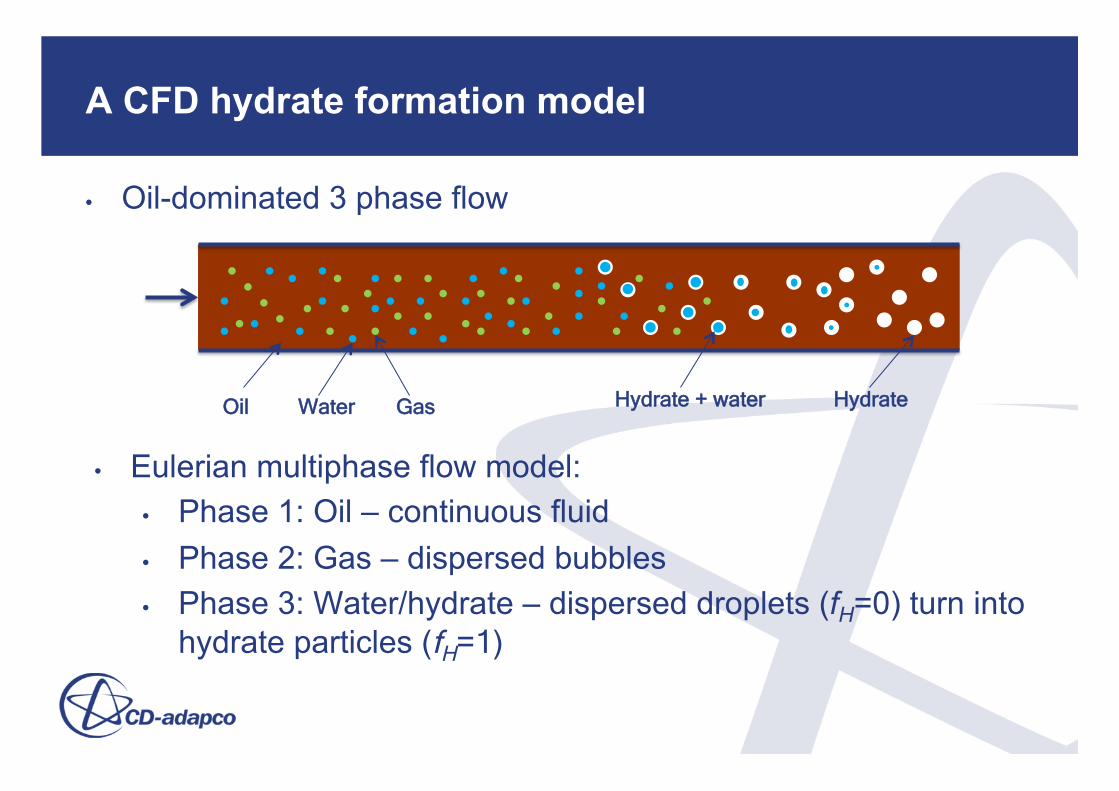
A CFD hydrate formation model
• Oil-dominated 3 phase flow
Oil Water Gas Hydrate + water Hydrate
• Eulerian multiphase flow model: • Phase 1: Oil – continuous fluid • Phase 2: Gas – dispersed bubbles • Phase 3: Water/hydrate – dispersed droplets (fH=0) turn into
hydrate particles (fH=1)
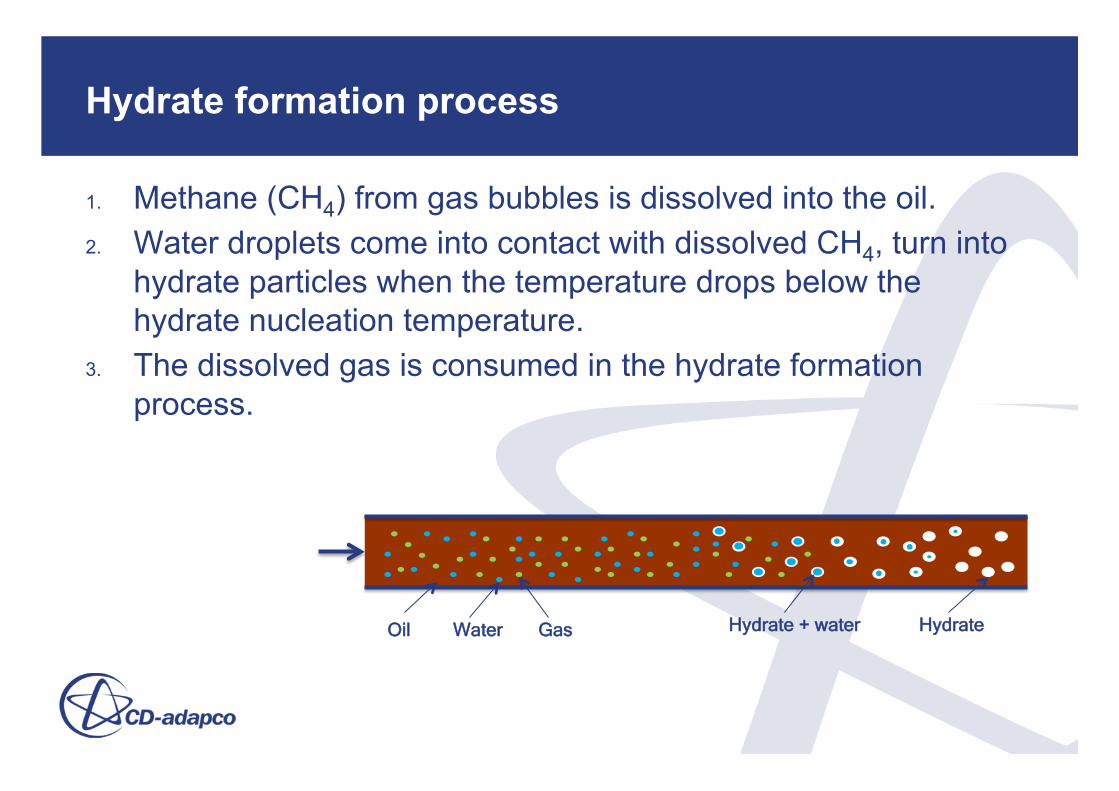
Hydrate formation process
1. Methane (CH4) from gas bubbles is dissolved into the oil. 2. Water droplets come into contact with dissolved CH4, turn into
hydrate particles when the temperature drops below the hydrate nucleation temperature.
3. The dissolved gas is consumed in the hydrate formation process.
Oil Water Gas Hydrate + water Hydrate
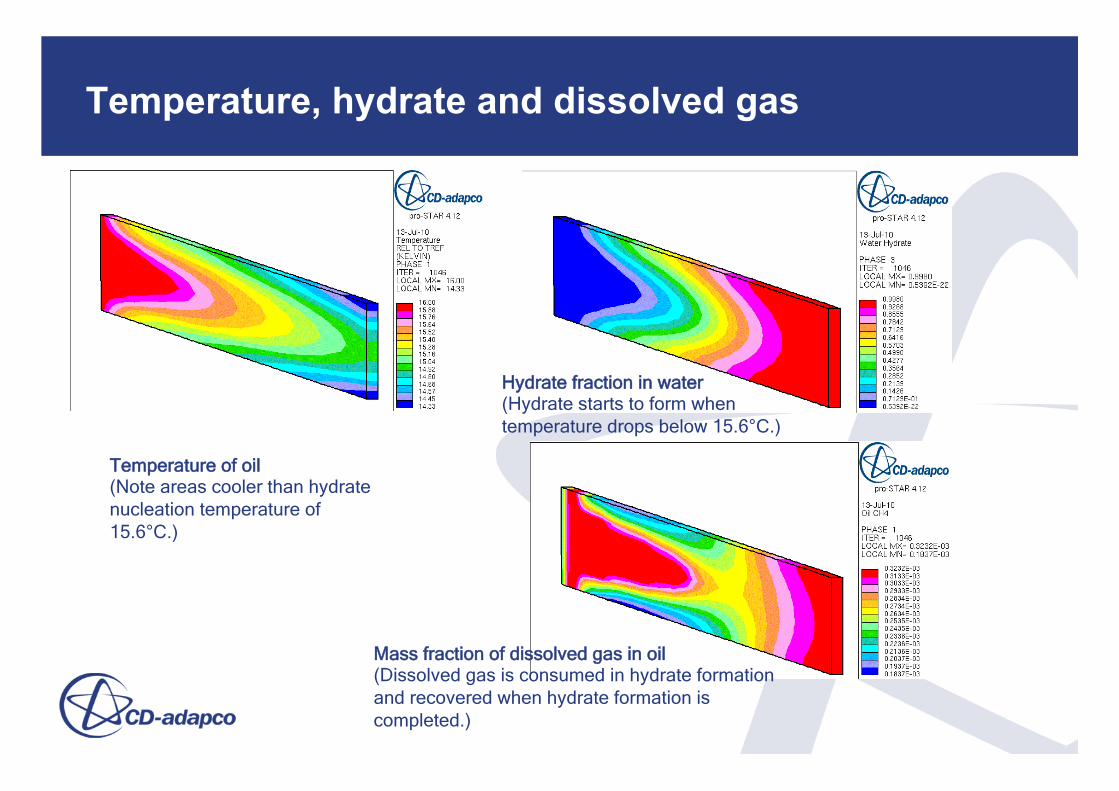
Temperature, hydrate and dissolved gas
Temperature of oil (Note areas cooler than hydrate nucleation temperature of 15.6°C.)
Hydrate fraction in water (Hydrate starts to form when temperature drops below 15.6°C.)
Mass fraction of dissolved gas in oil (Dissolved gas is consumed in hydrate formation and recovered when hydrate formation is completed.)
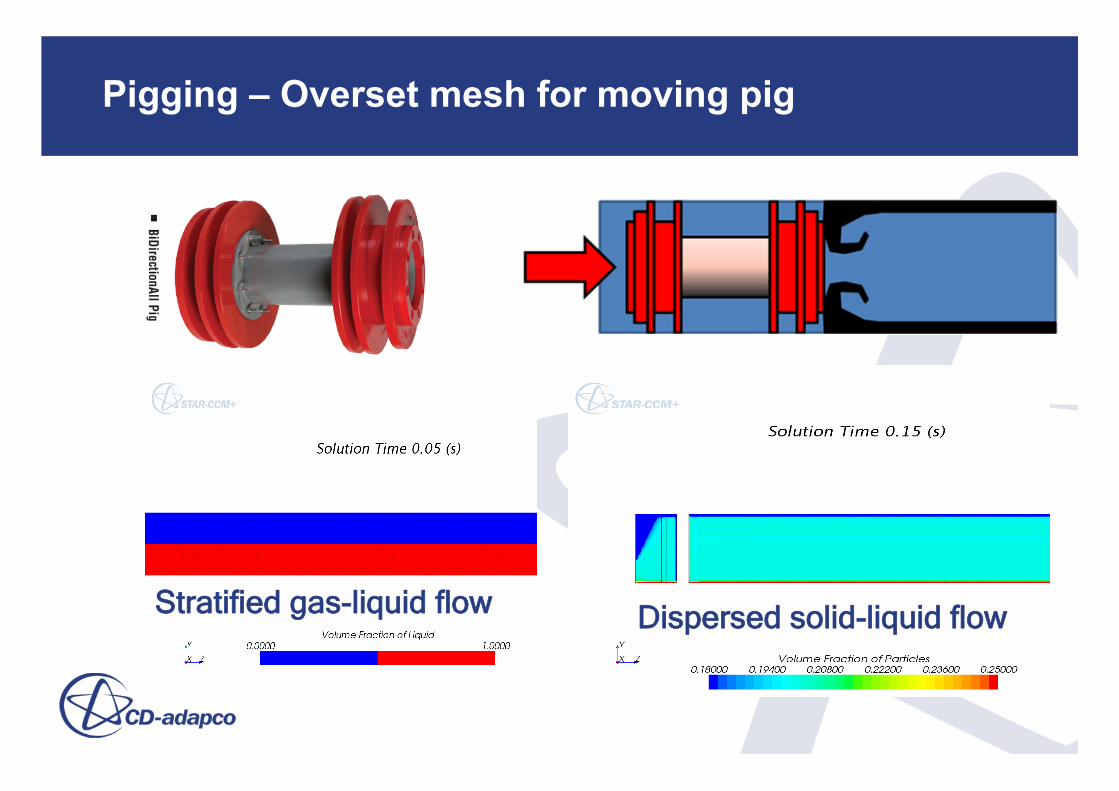
Pigging – Overset mesh for moving pig
Stratified gas-liquid flow Dispersed solid-liquid flow
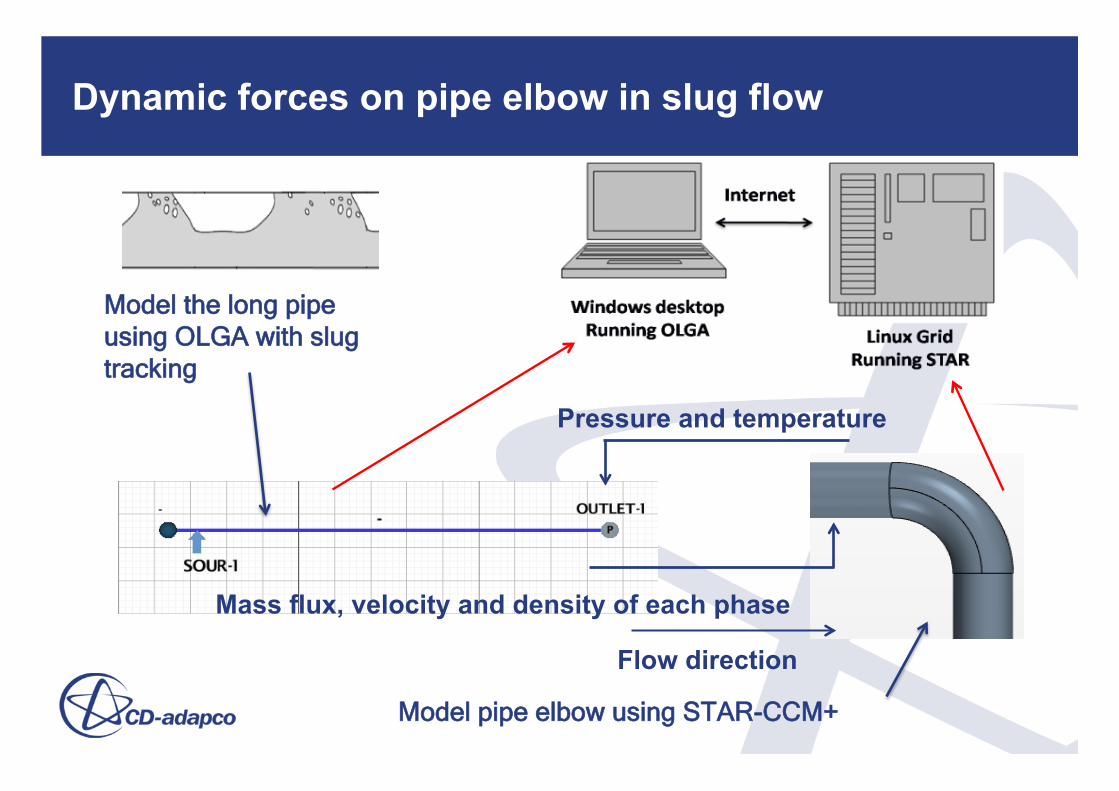
Dynamic forces on pipe elbow in slug flow
Mass flux, velocity and density of each phase
Pressure and temperature
Flow direction
Model the long pipe using OLGA with slug tracking
Model pipe elbow using STAR-CCM+
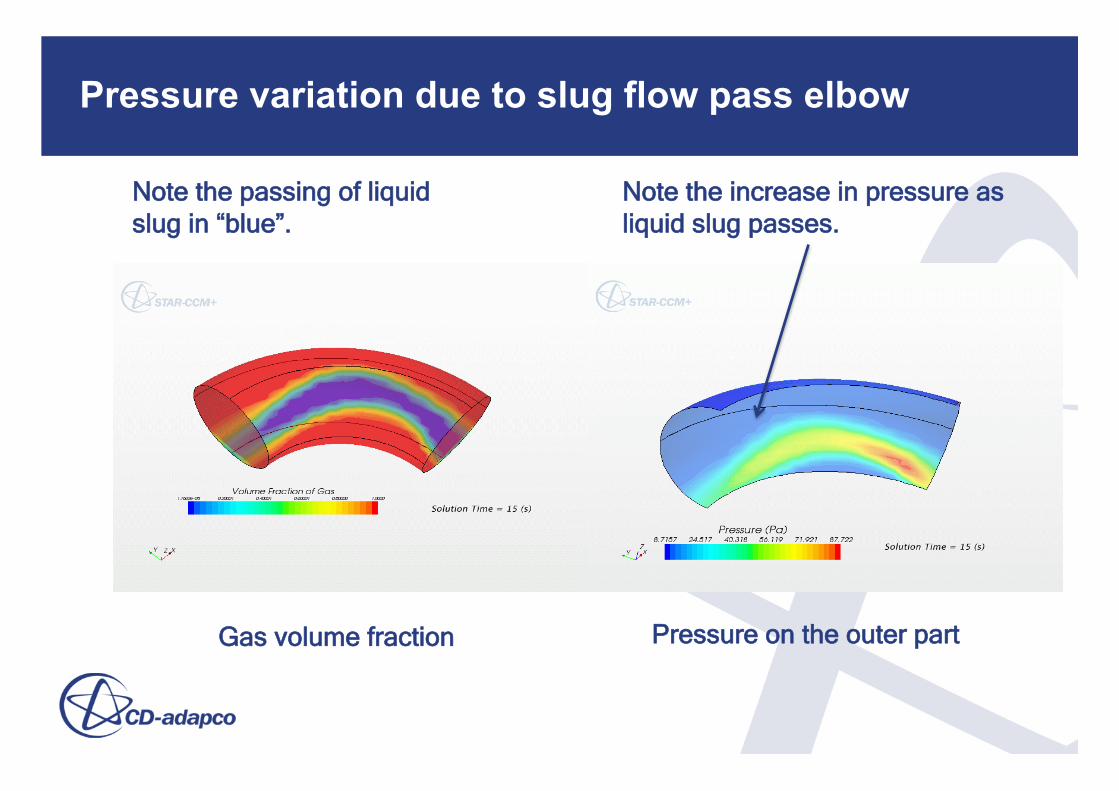
Pressure variation due to slug flow pass elbow
Gas volume fraction Pressure on the outer part
Note the passing of liquid slug in “blue”.
Note the increase in pressure as liquid slug passes.
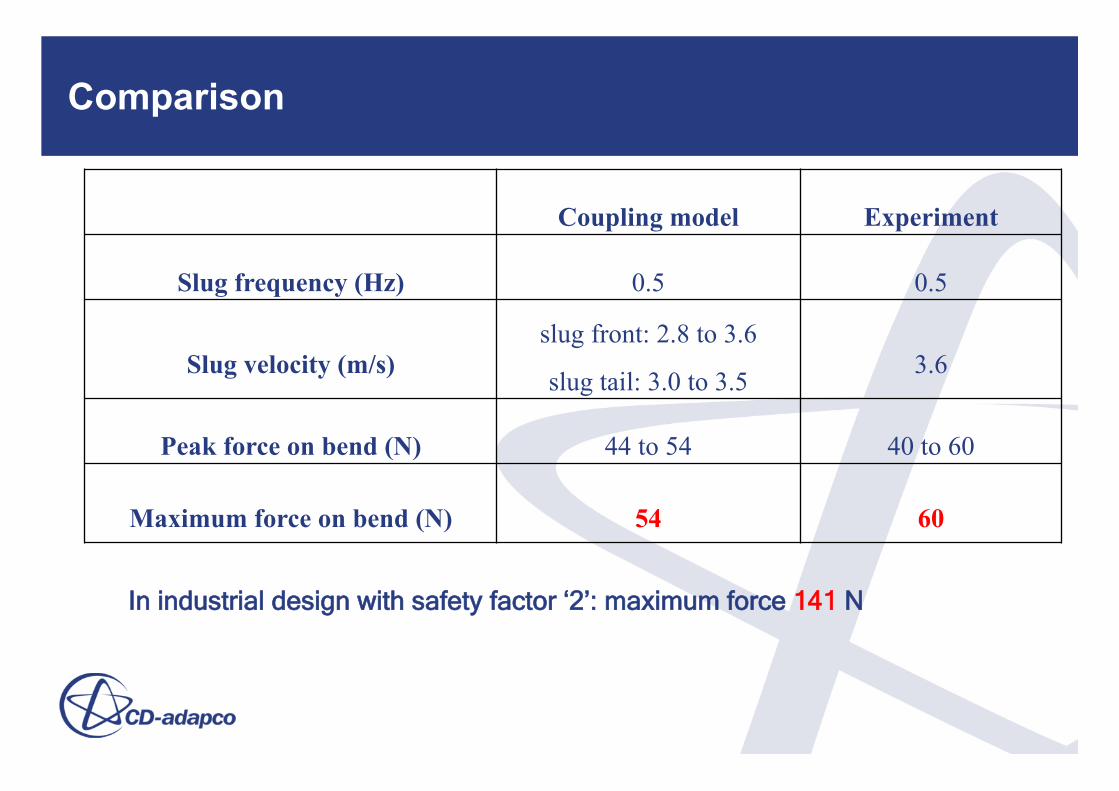
Comparison
Coupling model Experiment
Slug frequency (Hz) 0.5 0.5
Slug velocity (m/s) slug front: 2.8 to 3.6
slug tail: 3.0 to 3.5 3.6
Peak force on bend (N) 44 to 54 40 to 60
Maximum force on bend (N) 54 60
In industrial design with safety factor ‘2’: maximum force 141 N
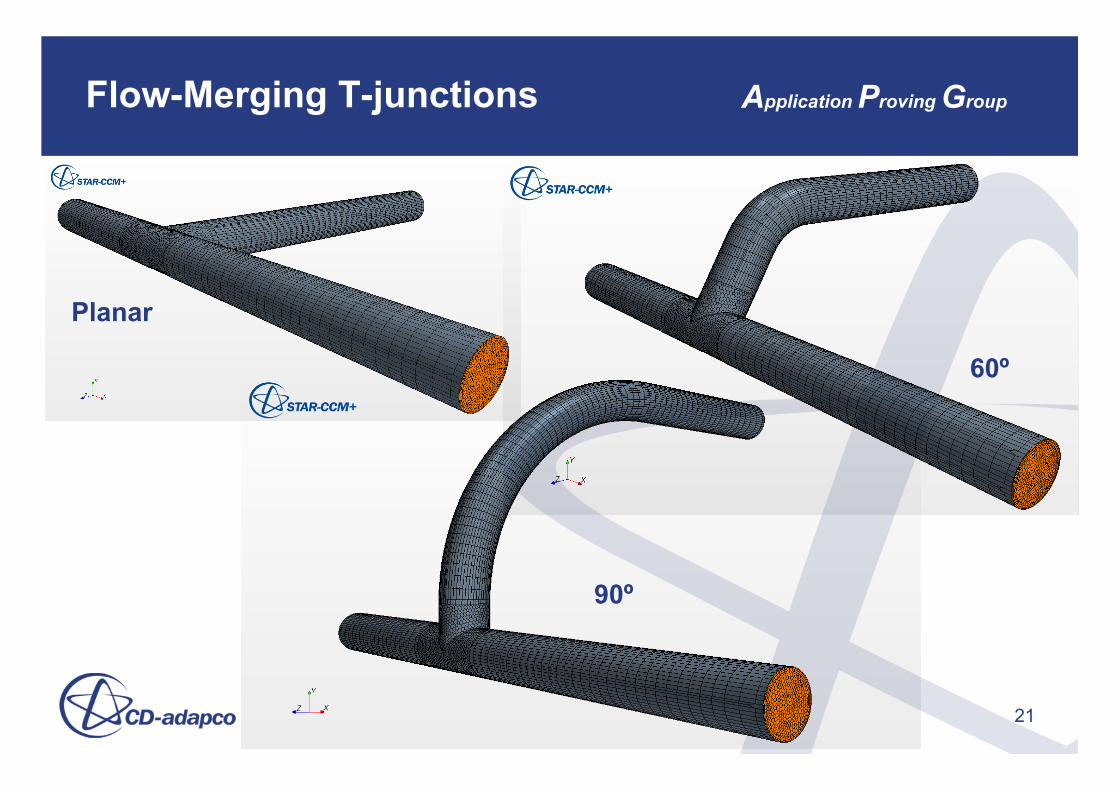
Flow-Merging T-junctions Application Proving Group
Planar
60º
90º
21
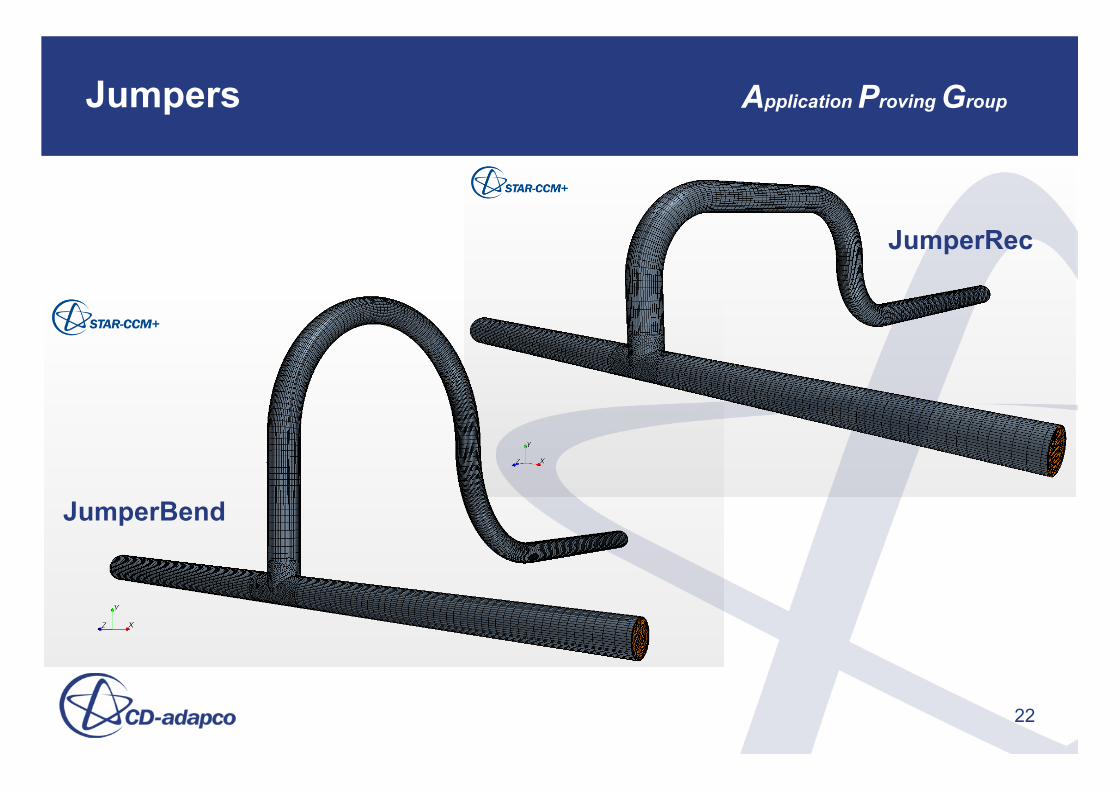
Jumpers Application Proving Group
22
JumperBend
JumperRec
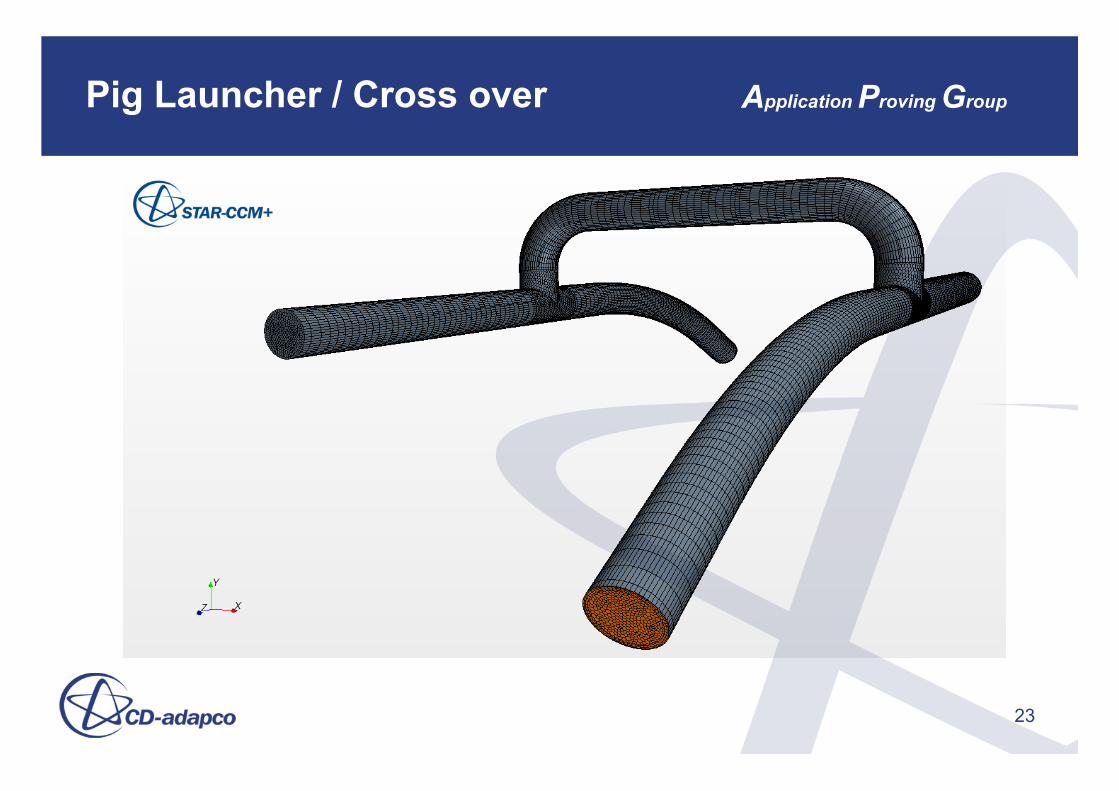
Pig Launcher / Cross over Application Proving Group
23
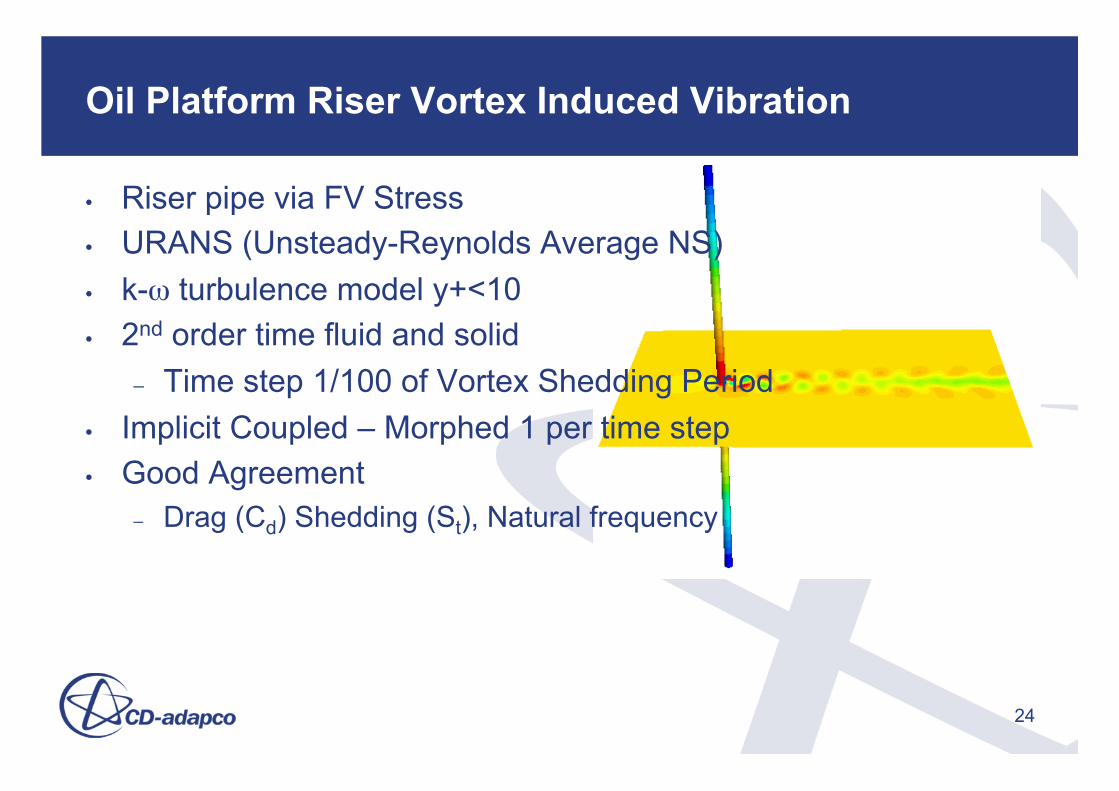
Oil Platform Riser Vortex Induced Vibration
• Riser pipe via FV Stress • URANS (Unsteady-Reynolds Average NS) • k-ω turbulence model y+<10 • 2nd order time fluid and solid
– Time step 1/100 of Vortex Shedding Period • Implicit Coupled – Morphed 1 per time step • Good Agreement
– Drag (Cd) Shedding (St), Natural frequency
24
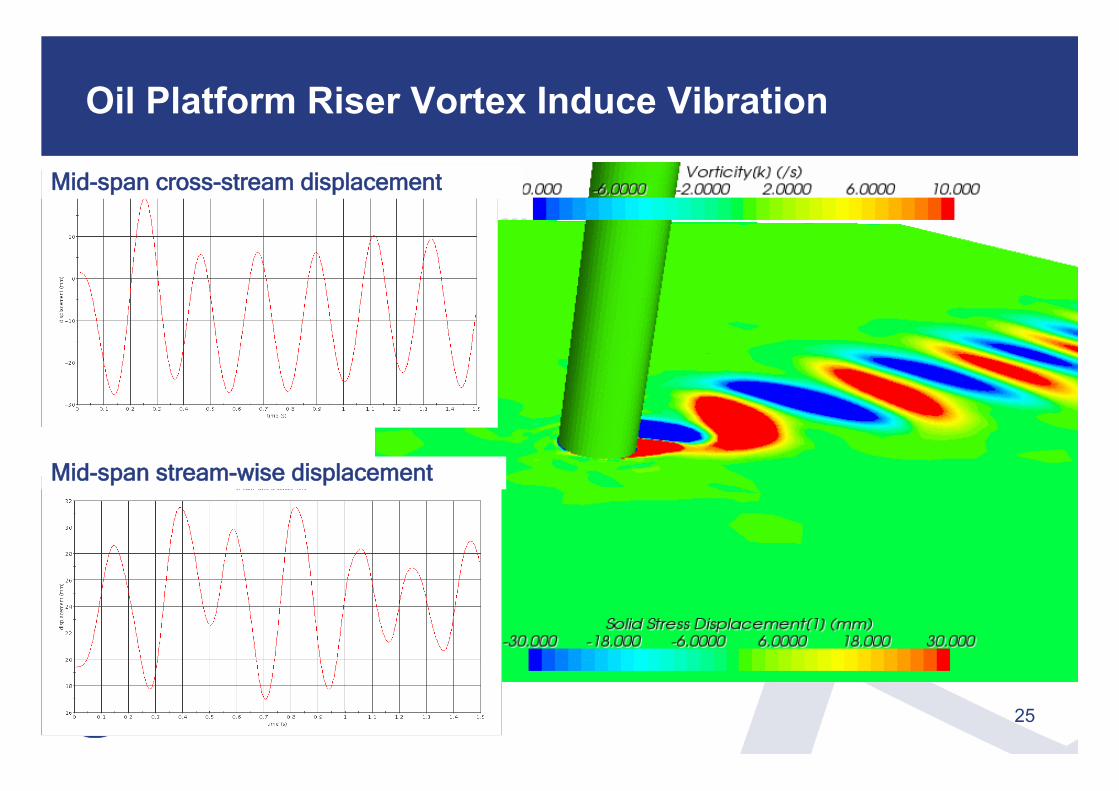
Oil Platform Riser Vortex Induce Vibration
25
Mid-span cross-stream displacement
Mid-span stream-wise displacement
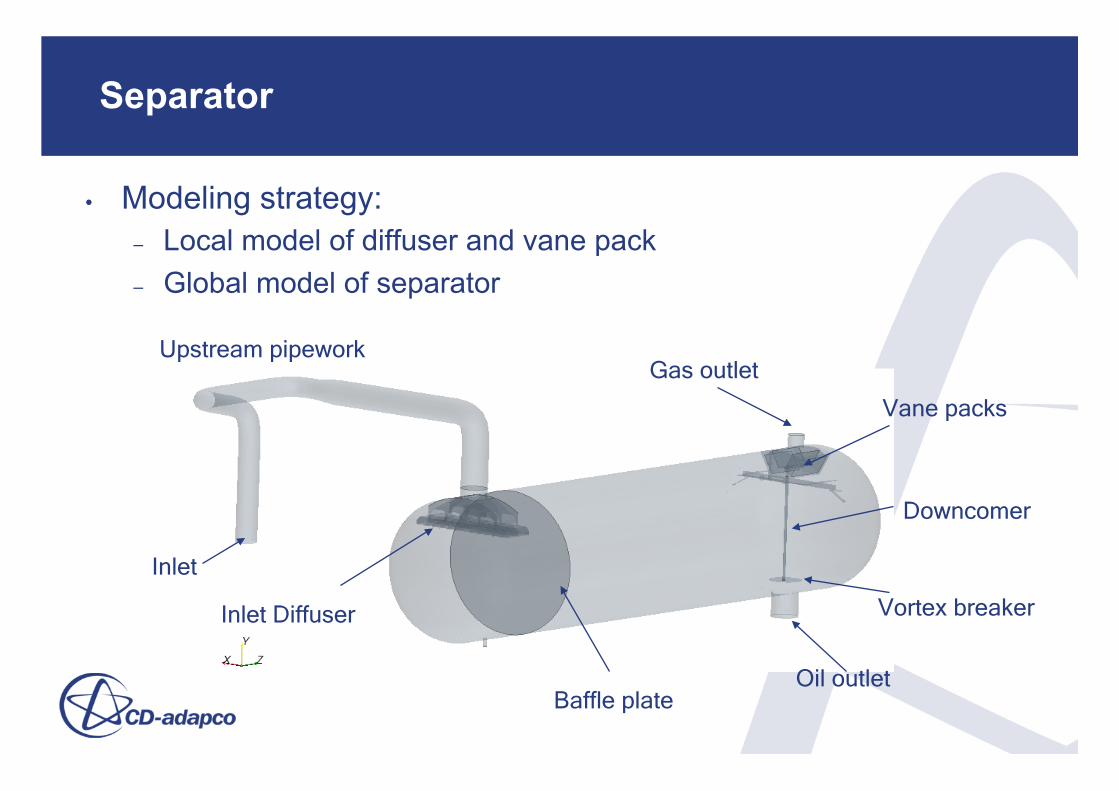
Separator
Upstream pipework
Baffle plate
Inlet Diffuser Vortex breaker
Oil outlet
Vane packs
Gas outlet
Downcomer
Inlet
• Modeling strategy: – Local model of diffuser and vane pack – Global model of separator
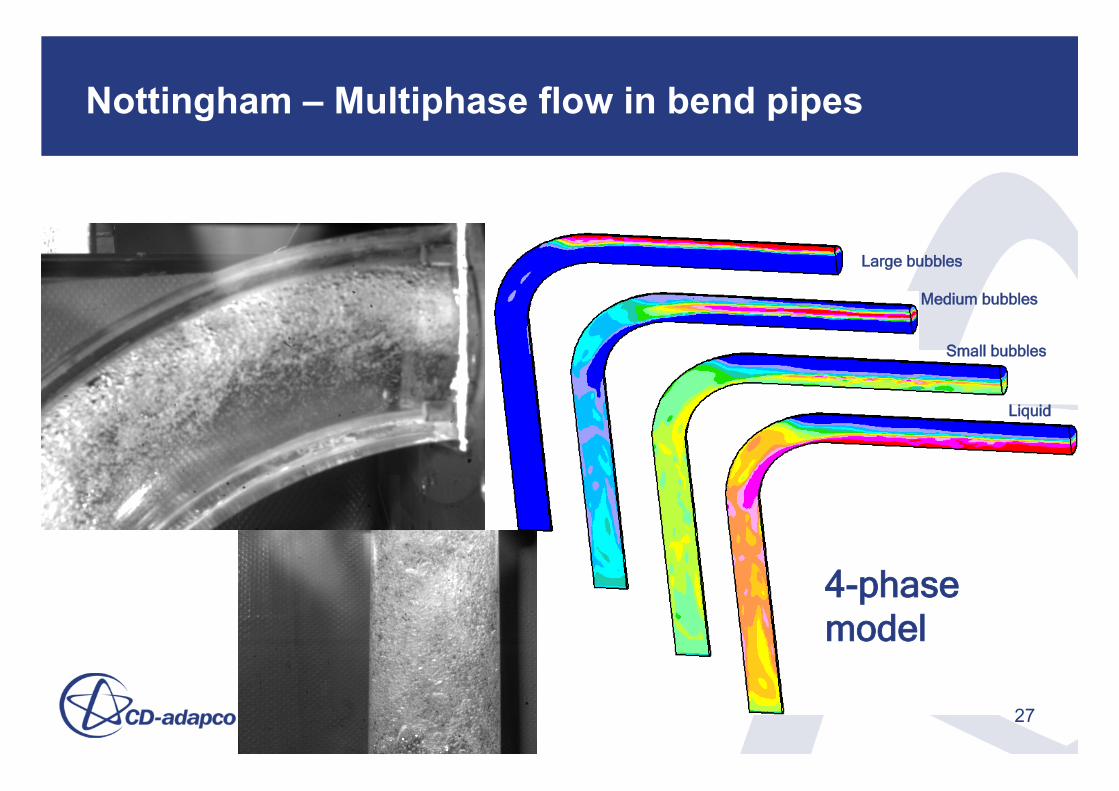
Nottingham – Multiphase flow in bend pipes
Large bubbles
Medium bubbles
Small bubbles
Liquid
4-phase model
27
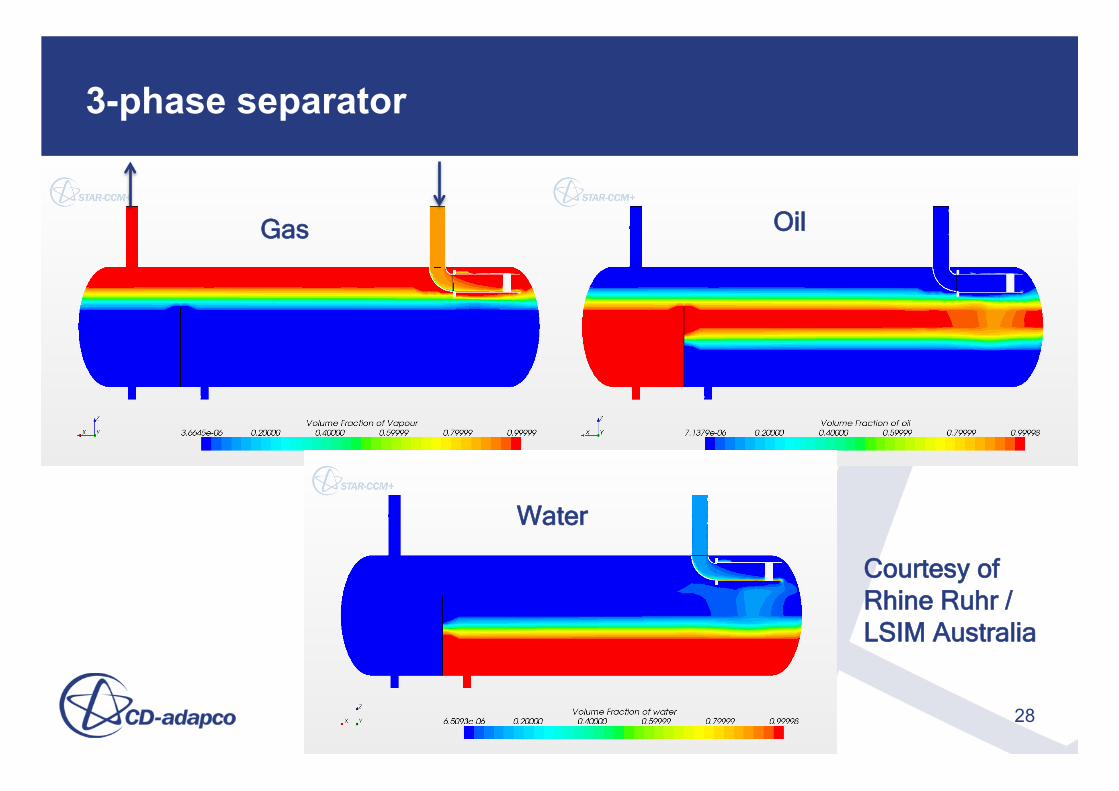
3-phase separator
28
Gas Oil
Water
Courtesy of Rhine Ruhr / LSIM Australia
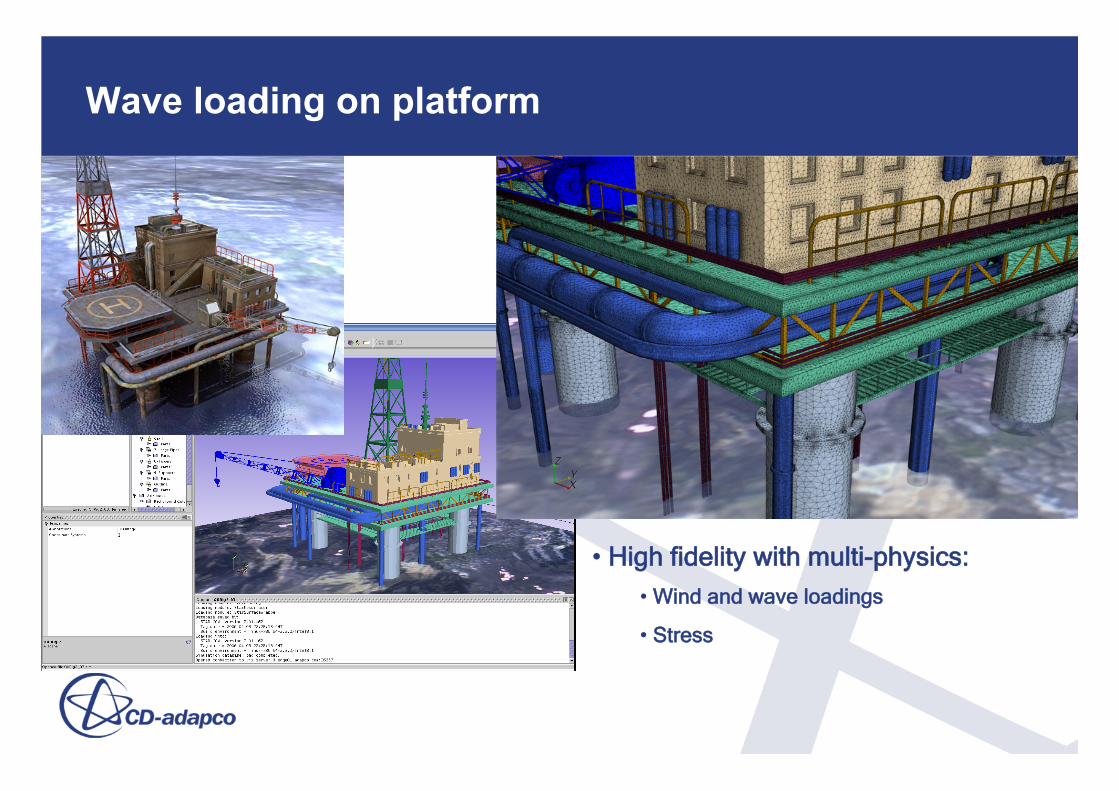
Wave loading on platform
• High fidelity with multi-physics:
• Wind and wave loadings
• Stress
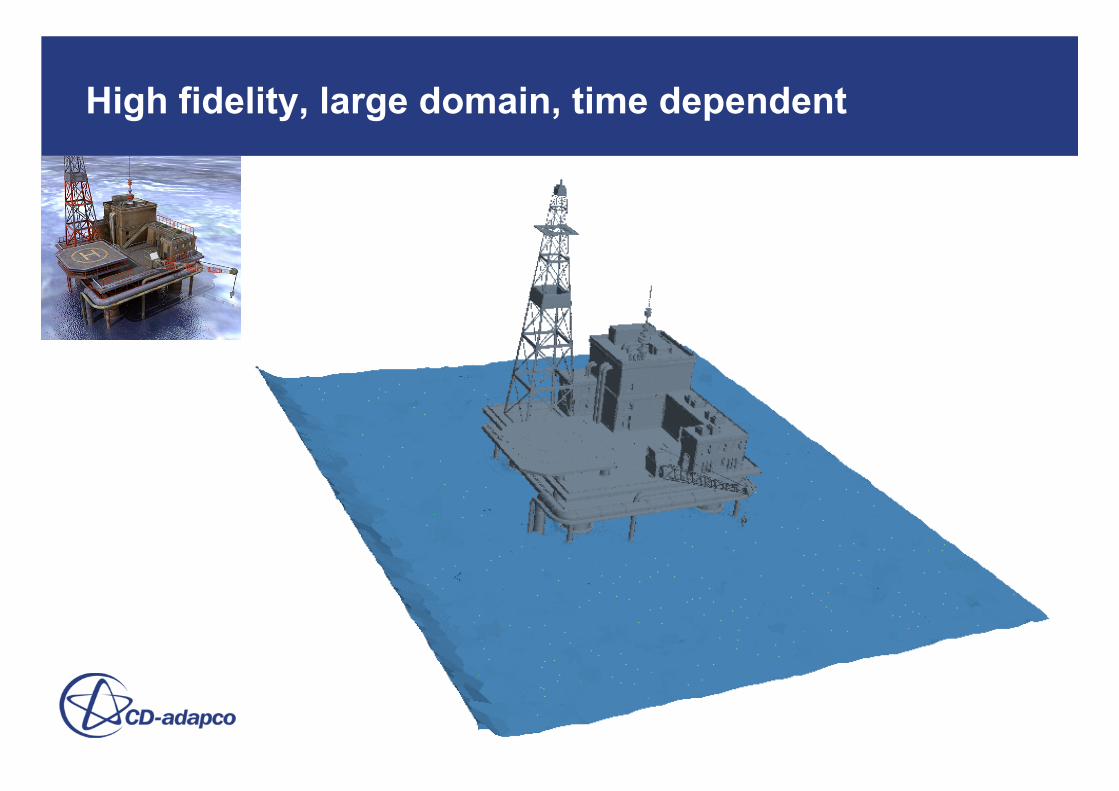
High fidelity, large domain, time dependent
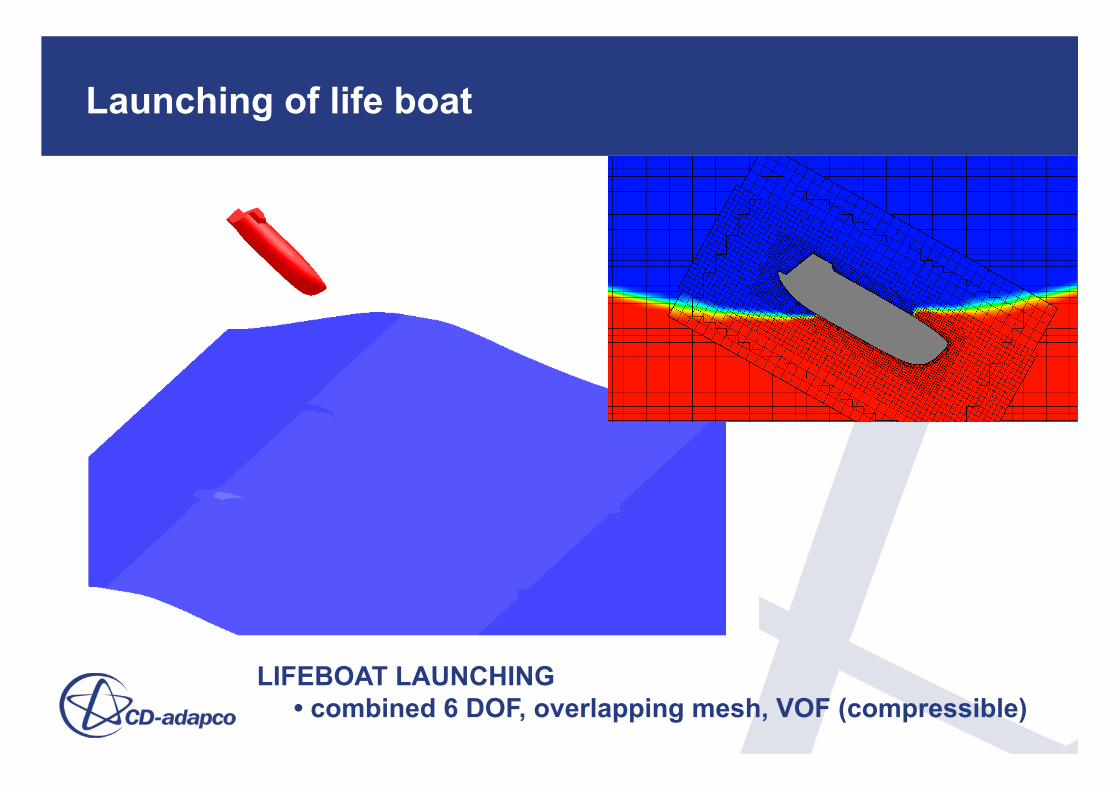
Launching of life boat
LIFEBOAT LAUNCHING • combined 6 DOF, overlapping mesh, VOF (compressible)
Conclusions
• CFD is becoming more widely used in flow assurance to study: – Flow details in 3D: pipelines, equipment, junctions, valves, … – Thermal management, conjugate heat transfer, cold down,
temperature dependent density and viscosity, hydrate, wax, ... – Fluid-structure interactions: VIV in risers, sloshing in tanks.
• CFD technology is being developed to support the modelling of the complex flows:
– Advanced grid generation methods. – Advanced multiphase flow models. – Fast parallel solver to handle large complex models. – Powerful visualisation technique to explain the complex flow.