Embed Size (px)
Citation preview
Northwest Professional Consortium
An Outcome Program Evaluation of the Multnomah County S.T.O.P. Drug Diversion Program prepared for Multnomah County Department of Community Corrections by Michael W. Finigan, Ph.D. NPC Research, Inc. 5200 SW Macadam Ave., Ste. 420 Portland, OR 97201 (503) 243-2436 January 5, 1998
2
Background The STOP (Sanction Treatment Opportunity Progress) Drug Diversion Program was implemented in 1991 to reduce the increasing backlog of drug cases in Multnomah County and to encourage treatment for those charged with first offense drug charges. The Program includes the following:
• Court oversight and active judicial case management • Immediate access to a dedicated treatment resource • Drug testing and a range of intermediate sanctions
In 1995 the program added a series of enhancements to expand the target population and to provide additional access to health, mental health, family intervention, resource coordination, and aftercare services. Program Structure Judicial Process The process begins with a District Attorney review of the original police report. If a case fits the eligibility requirements, the DA offers to the defendant the opportunity for Drug Court Diversion at the first appearance before the court. To be eligible for a Drug Court Diversion, the client must have a charge for PCS I or PCS II (possession of a controlled substance, preferably not with large amounts of the drug in possession), and must not have any DCS (distribution) or MCS (manufacture) charges. If there are additional non-drug criminal charges, individuals are eligible as long as conditions of probation do not interfere with the ability to participate in the program. About 900-1100 cases per year are first time appointments from District Court to petition for the STOP program. Defendants have a choice whether to participate in the diversion. In addition, defendants may withdraw from STOP at up to 14 days, the judge may choose to deny the petition, and an FTA or a bench warrant can result in an eligible client not receiving the program. About 400-700 defendants per year are actually admitted and receive at least some of the program. When defendants petition to enter the STOP track, they agree that if they fail the program, they will be tried based solely on the police report. This “stipulated facts” trial is therefore brief with a swift and sure sanction resulting from program failure. One negative side of this process is that some of the “front end” savings in costs expected by a diversion program are lost since adequate legal representation is required throughout the process and judicial time is also expended. Nonetheless, it clearly adds a powerful incentive to remain compliant in the program since a violation of any rules will involve, at minimum, an appearance before the judge. A single judge oversees the program. The Honorable Judge Harl Haas was the driving force behind the implementation of this program and presided over the STOP program from 1991-1994. When he returned to a general docket, the Honorable Roosevelt Robinson moved to the STOP bench.
3
Treatment Treatment is provided by InAct Inc., a private, not-for-profit agency which provides outpatient multi-phased intervention including group sessions and acupuncture. Residential treatment is also available through CODA and VOA. STOP clients are required to engage in group and individual sessions at InAct every weekday in the initial phase of the program and once to twice a week during the final phases. The Court provides active case management involving monthly status hearings at which time the Court reviews the drug test results and treatment progress. Other specialized services are also available including women’s services, Hispanic services, and a literacy program. The level of intervention and accountability for STOP clients far exceeds what is typical in outpatient treatment. About 46% of admitted cases fully graduate from the program.1 Research Design The evaluation team proposed to conduct an outcome evaluation of the program using existing state and local databases. The evaluation has two major goals:
• The first is the assessment of whether there are positive outcomes for program participants, with a particular focus on outcomes that are related to criminal recidivism (e.g., lower subsequent arrests and convictions, and more compliant probation or parole supervision).
• The second goal is to assess the ratio of the program’s cost to taxpayers to the
avoided costs resulting from positive outcomes (if any) of the program. The research design was modeled after the design of the recently released study of treatment outcomes statewide in Oregon, “Societal Outcomes and Cost Savings of Drug and Alcohol Treatment in the State of Oregon” by Dr. Michael Finigan.
1 This graduate rate is based on the data for the years 1994 and 1995, the years of the main samples and the years that seem the most complete in the STOP database. In those two years there were 384 graduates out of 844 closed cases, a graduation rate of 46%.
4
Sampling Strategy Evaluation program group It is possible, for sampling strategy purposes, to divide the STOP program participants into two groups:
• those who successfully graduated from the program, and • those who failed the program after receiving a portion of the program (often
due to either a drug test failure or an FTA to a status hearing). Although the program graduates are of great interest to the evaluation, since they represent the program at its fullest implementation, a true assessment of the entire program effect (particularly in the assessment of costs vs.. avoided costs) will of necessity include all cases which were diverted to the program. It will also be valuable to assess the importance of graduation per se as opposed to simply receiving some of the program. In addition, the non-completion group can be further sub-divided into those who did not complete but received a substantial portion of the program, and those who did not complete and who received little or no treatment. For some of the analyses, these groups can be used as comparisons to those who graduated. (The Multnomah County Department of Community Corrections successfully used this strategy in a preliminary impact study conducted on 54 program graduates and 50 unsuccessful terminations in calendar year 1993.) The results of a power analysis suggest that to gain adequate power to analyze the program graduates separately, a minimum sample size of 150 graduates of the program would be necessary. One strategy would be to sample from all successful and unsuccessful terminations from 1991 to present. However, because the period from 1991 to early 1992 was the early implementation period of the program and early implementation is often atypical for an innovative program such as this, we have chosen a sample from the 1994-1995 period to attain a representation of the mature implementation of the program. Sample:
• Those who were diverted and successfully graduated 150 • Those who were diverted but did not graduate 1502
Sample members were randomly selected from those who either had a graduate status code for the selected years (graduate sample) or had a termination code (non-completer sample). Both groups, graduates and program participants who did not graduate, did not differ significantly in gender, age, or race/ethnicity. The percentage of males in either group was about 72%, the average age was 33, and the proportion of non-whites was 23%.3
2 This group includes those who received a great deal of treatment as well as those who received little treatment; in some analyses, we deal with those two groups separately.
5
However, the graduate sample and the sample of non-completers did differ in prior arrests. Program graduates averaged 1.6 prior arrests while non-completers averaged 3.4 prior arrests. Therefore, in the analyses in which all groups are compared, prior arrests is used as a control variable. The average number of prior arrests for all program participants (graduates and non-completers) was 2.5. Evaluation comparison group The selection of a comparison group is a critical element in a non-randomized research design. In this case, the best comparison group for the STOP program graduates is a contemporaneous sample of arrestees, who were eligible for the program but did not receive the program. These individuals needed to meet the following criteria:
• have a charge for PCS I or PCS II (preferably not with large amounts of the drug in possession),
• be considered eligible for STOP • have not entered the STOP program
Figures given by the Metropolitan Public Defender’s Office indicate that about 2400 individuals a year are arrested with drug offenses as the primary charge and about 4400 a year have drug offenses as the secondary charge. An estimated 1100 per year of these arrestees are first time appointments from District Court to petition for the STOP program. Of this group, between 400-500 per year are actually admitted to the program. Thus, a fairly sizeable pool are eligible for the program but are not admitted. The reasons for non-entry include withdrawal, clients decline (choose trial instead), court denial, and prior bench warrants. Unfortunately, all of these reasons have some potential to intrude a bias that may make these clients unfit to be part of a comparison group. To offset this bias, a representative matched sample approach was utilized. We examined this pool of arrestees using county and state databases to acquire a sub-pool of eligible clients that were randomly selected to be representative of program participants based on the following criteria:
• gender, • age, • race/ethnicity,4 and • prior criminal history.
3 In all groups, hispanic clients in general were excluded because of a preponderance of INS holds which makes follow-up data collection very difficult or impossible. Therefore, the percentage of non-Europeans in the samples is somewhat lower than usual. 4 In all groups, hispanic clients in general were excluded because of a preponderance of INS holds which makes follow-up data collection very difficult or impossible.
6
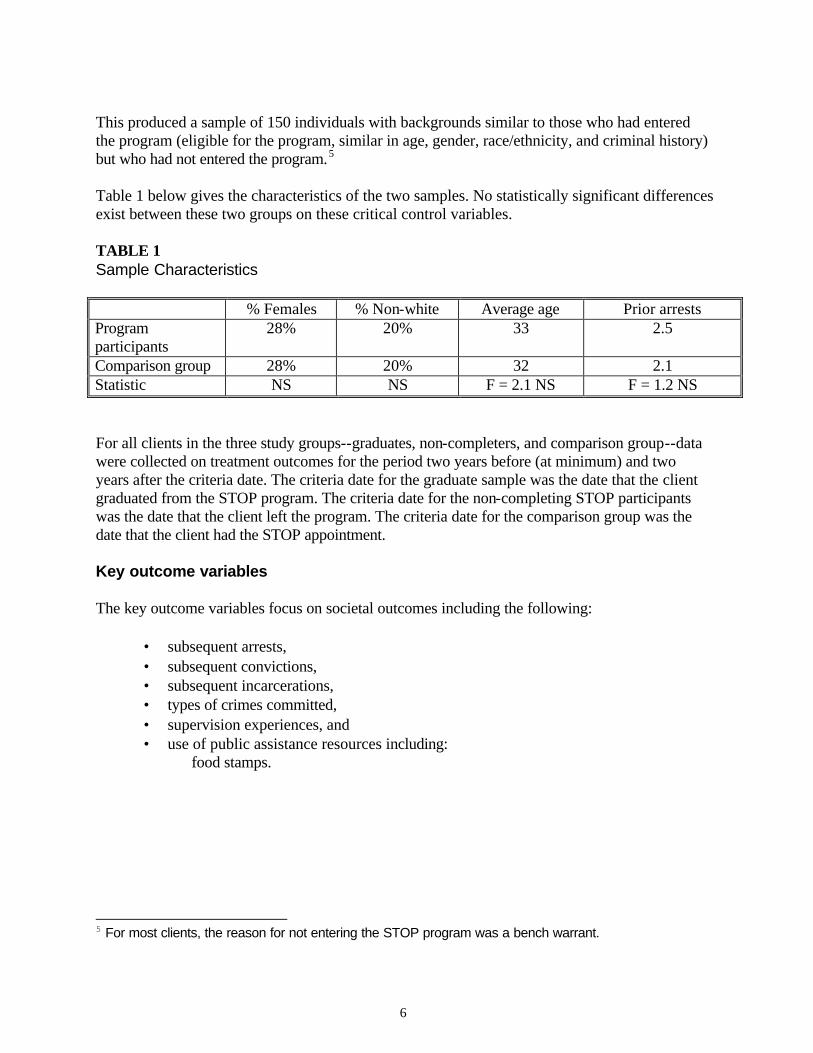
This produced a sample of 150 individuals with backgrounds similar to those who had entered the program (eligible for the program, similar in age, gender, race/ethnicity, and criminal history) but who had not entered the program.5 Table 1 below gives the characteristics of the two samples. No statistically significant differences exist between these two groups on these critical control variables. TABLE 1 Sample Characteristics % Females % Non-white Average age Prior arrests Program participants
28% 20% 33 2.5
Comparison group 28% 20% 32 2.1 Statistic NS NS F = 2.1 NS F = 1.2 NS For all clients in the three study groups--graduates, non-completers, and comparison group--data were collected on treatment outcomes for the period two years before (at minimum) and two years after the criteria date. The criteria date for the graduate sample was the date that the client graduated from the STOP program. The criteria date for the non-completing STOP participants was the date that the client left the program. The criteria date for the comparison group was the date that the client had the STOP appointment. Key outcome variables The key outcome variables focus on societal outcomes including the following:
• subsequent arrests, • subsequent convictions, • subsequent incarcerations, • types of crimes committed, • supervision experiences, and • use of public assistance resources including:
food stamps.
5 For most clients, the reason for not entering the STOP program was a bench warrant.
7
Data sources The following existing state databases were used to collect outcome data for clients in each sample group from the periods two years prior and two years subsequent to their criteria dates. Permission to access these databases was gained and confidentiality of clients was protected at all times.
• LEDS (Law Enforcement Data System) This is perhaps the best source for recidivism measures such as arrests. All arrests statewide are reported through this system. It also provides data on prior criminal history. However, it should be noted that this analysis is based on data from the Law Enforcement Data System (LEDS), the statewide arrest database to which all jails report. One limitation of this database is that some arrests for less serious crimes are in practice not always reported by the jails. This means that the some less serious arrests may not be captured in this report.
• DCC supervision files (ISIS) Data were gathered for each client from the ISIS system which contains files on any supervision experiences within Multnomah County. These include data on post-release employment, housing, and other measures of readjustment as well as data on violations of probation or parole.
• CPMS (Client Process Monitoring System) All state licensed alcohol and/or drug abuse treatment programs are required to report intake and exit data on all clients to the Office of Alcohol and Drug Abuse Programs.
• Adult and Family Services This database contains information about the amount and type of monetary assistance (particularly food stamps) provided to clients in specific time periods. Statistical Analysis The primary analysis strategy was an examination of each outcome measure for all three sample groups together using an Analysis of Covariance model with prior arrests as the chief covariate. Then, if statistical significance was gained for the model, individual comparisons (e.g., graduates versus eligible) were tested for significance. This is the preferred method since a series of bi-variate tests can occasionally produce spurious statistical significance.
8
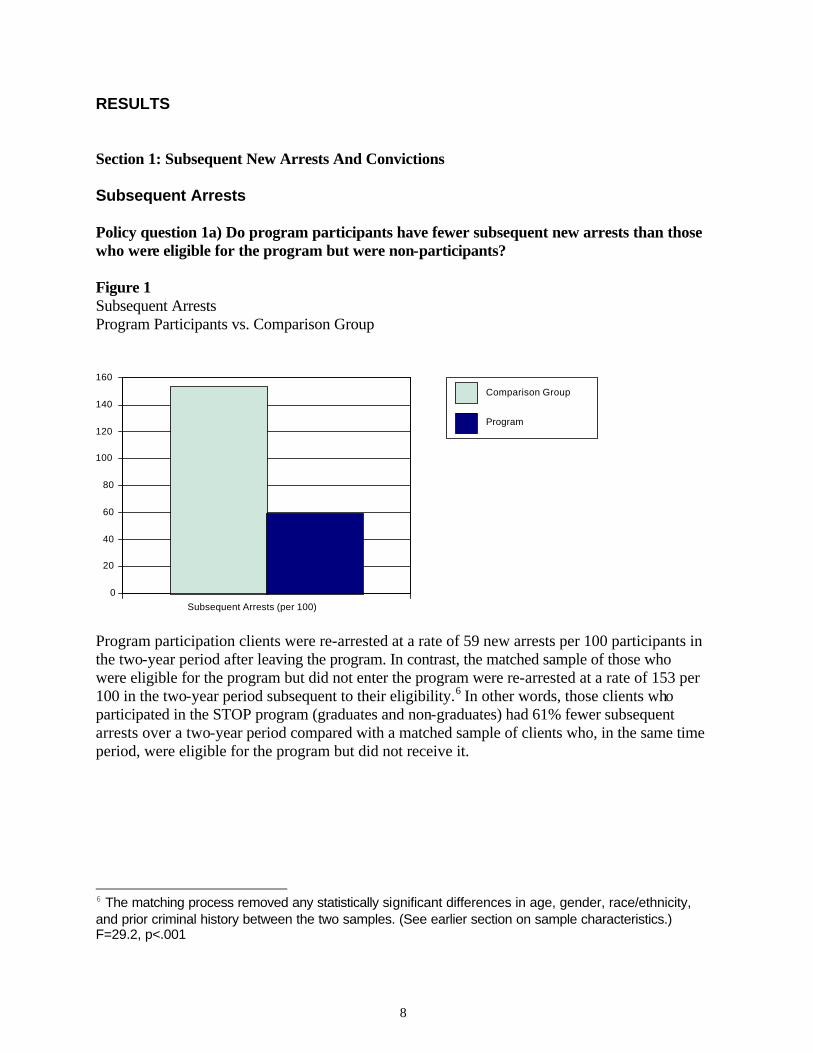
RESULTS Section 1: Subsequent New Arrests And Convictions Subsequent Arrests Policy question 1a) Do program participants have fewer subsequent new arrests than those who were eligible for the program but were non-participants? Figure 1 Subsequent Arrests Program Participants vs. Comparison Group
Subsequent Arrests (per 100)0
20
40
60
80
100
120
140
160
Comparison Group
Program
Program participation clients were re-arrested at a rate of 59 new arrests per 100 participants in the two-year period after leaving the program. In contrast, the matched sample of those who were eligible for the program but did not enter the program were re-arrested at a rate of 153 per 100 in the two-year period subsequent to their eligibility.6 In other words, those clients who participated in the STOP program (graduates and non-graduates) had 61% fewer subsequent arrests over a two-year period compared with a matched sample of clients who, in the same time period, were eligible for the program but did not receive it.
6 The matching process removed any statistically significant differences in age, gender, race/ethnicity, and prior criminal history between the two samples. (See earlier section on sample characteristics.) F=29.2, p<.001
9
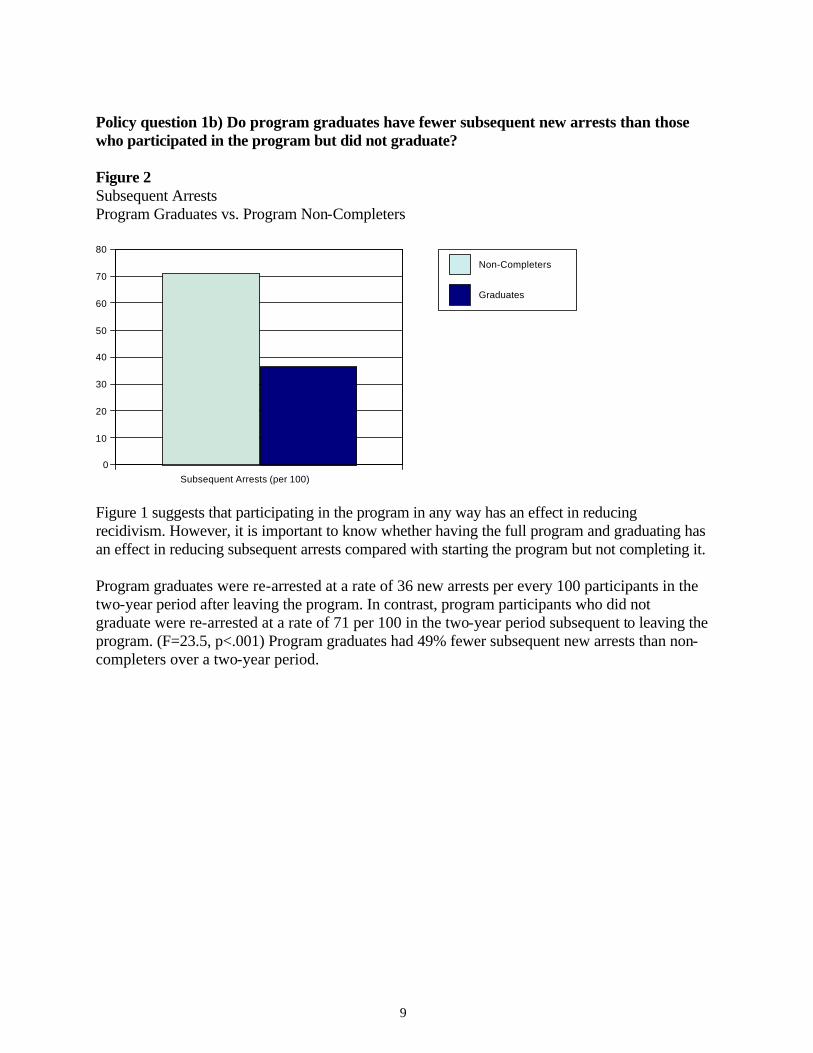
Policy question 1b) Do program graduates have fewer subsequent new arrests than those who participated in the program but did not graduate? Figure 2 Subsequent Arrests Program Graduates vs. Program Non-Completers
Subsequent Arrests (per 100)0
10
20
30
40
50
60
70
80
Non-Completers
Graduates
Figure 1 suggests that participating in the program in any way has an effect in reducing recidivism. However, it is important to know whether having the full program and graduating has an effect in reducing subsequent arrests compared with starting the program but not completing it. Program graduates were re-arrested at a rate of 36 new arrests per every 100 participants in the two-year period after leaving the program. In contrast, program participants who did not graduate were re-arrested at a rate of 71 per 100 in the two-year period subsequent to leaving the program. (F=23.5, p<.001) Program graduates had 49% fewer subsequent new arrests than non-completers over a two-year period.
10
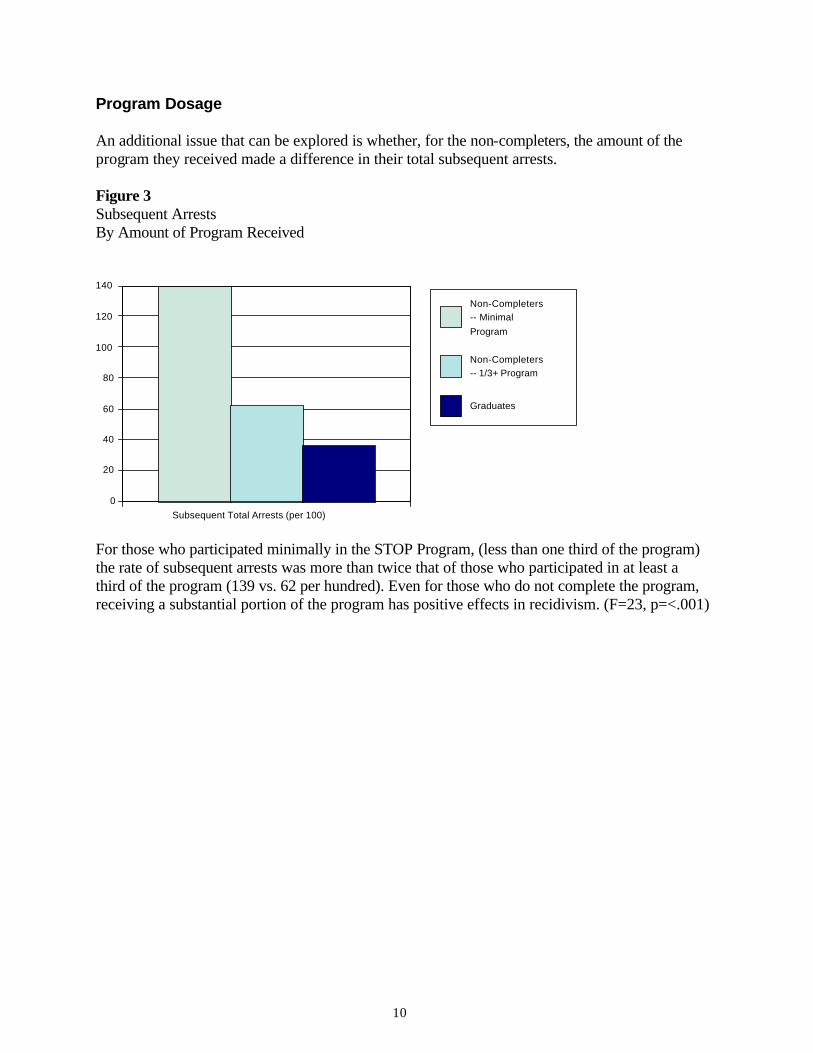
Program Dosage An additional issue that can be explored is whether, for the non-completers, the amount of the program they received made a difference in their total subsequent arrests. Figure 3 Subsequent Arrests By Amount of Program Received
Subsequent Total Arrests (per 100)0
20
40
60
80
100
120
140
Non-Completers -- Minimal Program
Non-Completers -- 1/3+ Program
Graduates
For those who participated minimally in the STOP Program, (less than one third of the program) the rate of subsequent arrests was more than twice that of those who participated in at least a third of the program (139 vs. 62 per hundred). Even for those who do not complete the program, receiving a substantial portion of the program has positive effects in recidivism. (F=23, p=<.001)
11
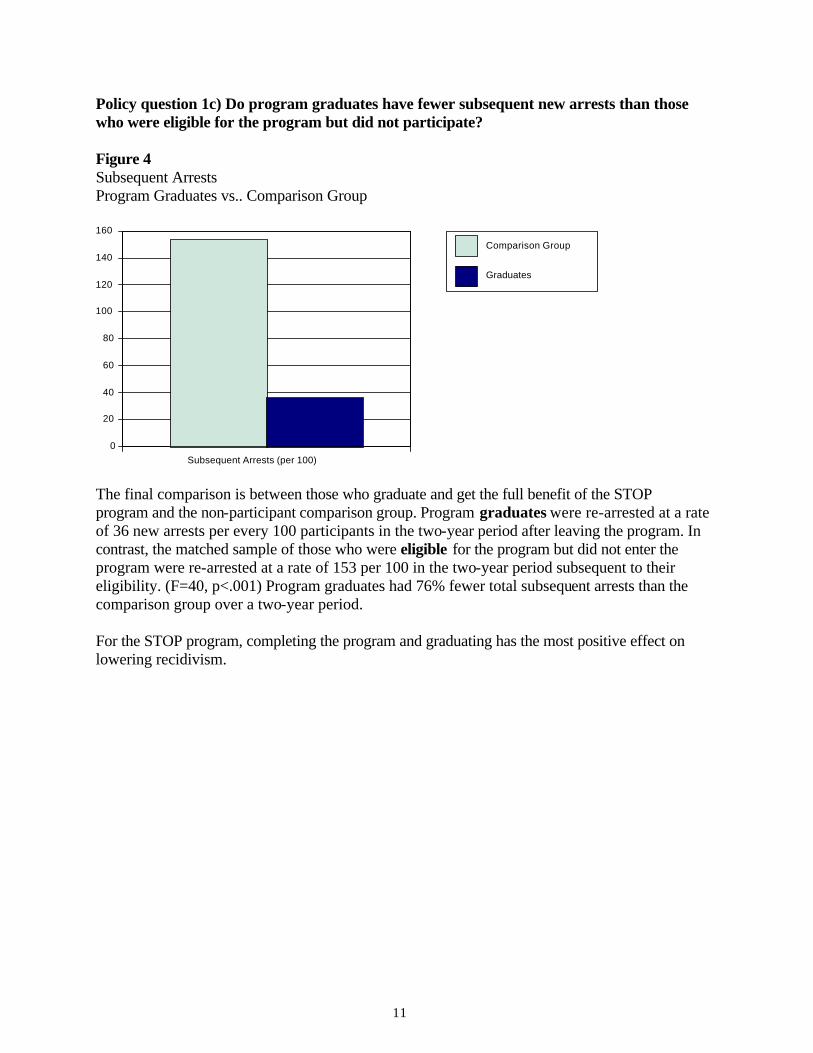
Policy question 1c) Do program graduates have fewer subsequent new arrests than those who were eligible for the program but did not participate? Figure 4 Subsequent Arrests Program Graduates vs.. Comparison Group
Subsequent Arrests (per 100)0
20
40
60
80
100
120
140
160
Comparison Group
Graduates
The final comparison is between those who graduate and get the full benefit of the STOP program and the non-participant comparison group. Program graduates were re-arrested at a rate of 36 new arrests per every 100 participants in the two-year period after leaving the program. In contrast, the matched sample of those who were eligible for the program but did not enter the program were re-arrested at a rate of 153 per 100 in the two-year period subsequent to their eligibility. (F=40, p<.001) Program graduates had 76% fewer total subsequent arrests than the comparison group over a two-year period. For the STOP program, completing the program and graduating has the most positive effect on lowering recidivism.
12
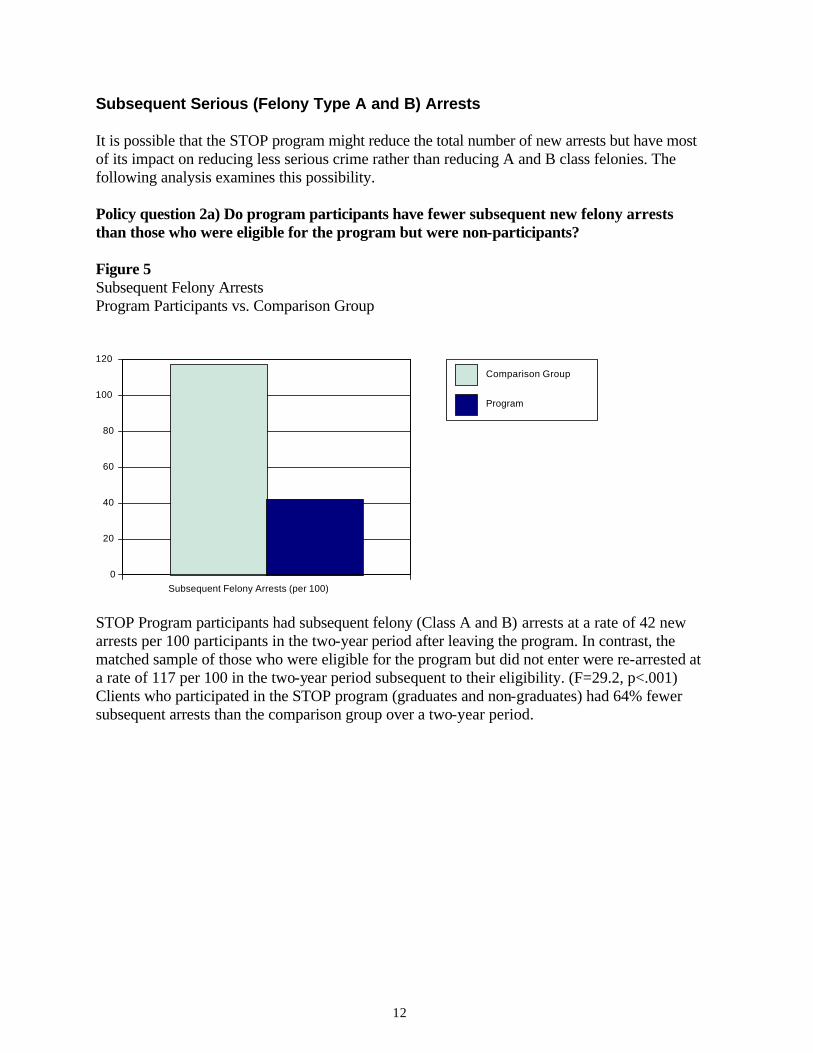
Subsequent Serious (Felony Type A and B) Arrests It is possible that the STOP program might reduce the total number of new arrests but have most of its impact on reducing less serious crime rather than reducing A and B class felonies. The following analysis examines this possibility. Policy question 2a) Do program participants have fewer subsequent new felony arrests than those who were eligible for the program but were non-participants? Figure 5 Subsequent Felony Arrests Program Participants vs. Comparison Group
Subsequent Felony Arrests (per 100)0
20
40
60
80
100
120
Comparison Group
Program
STOP Program participants had subsequent felony (Class A and B) arrests at a rate of 42 new arrests per 100 participants in the two-year period after leaving the program. In contrast, the matched sample of those who were eligible for the program but did not enter were re-arrested at a rate of 117 per 100 in the two-year period subsequent to their eligibility. (F=29.2, p<.001) Clients who participated in the STOP program (graduates and non-graduates) had 64% fewer subsequent arrests than the comparison group over a two-year period.
13
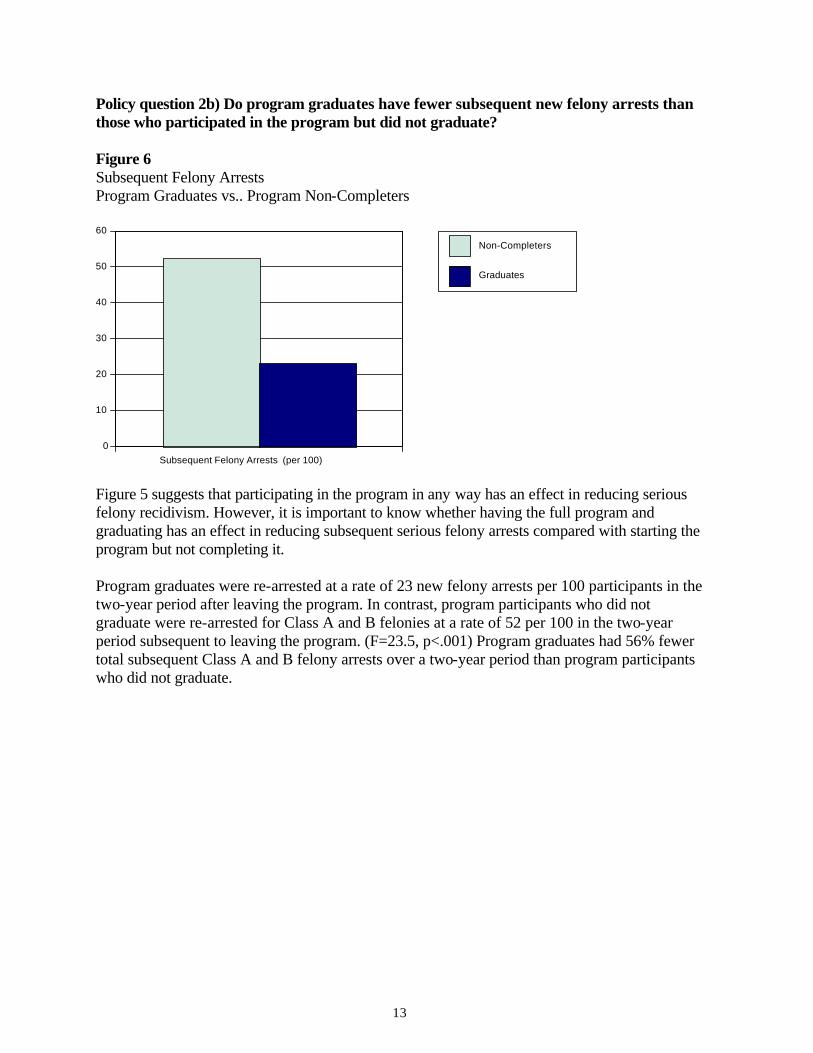
Policy question 2b) Do program graduates have fewer subsequent new felony arrests than those who participated in the program but did not graduate? Figure 6 Subsequent Felony Arrests Program Graduates vs.. Program Non-Completers
Subsequent Felony Arrests (per 100)0
10
20
30
40
50
60
Non-Completers
Graduates
Figure 5 suggests that participating in the program in any way has an effect in reducing serious felony recidivism. However, it is important to know whether having the full program and graduating has an effect in reducing subsequent serious felony arrests compared with starting the program but not completing it. Program graduates were re-arrested at a rate of 23 new felony arrests per 100 participants in the two-year period after leaving the program. In contrast, program participants who did not graduate were re-arrested for Class A and B felonies at a rate of 52 per 100 in the two-year period subsequent to leaving the program. (F=23.5, p<.001) Program graduates had 56% fewer total subsequent Class A and B felony arrests over a two-year period than program participants who did not graduate.
14
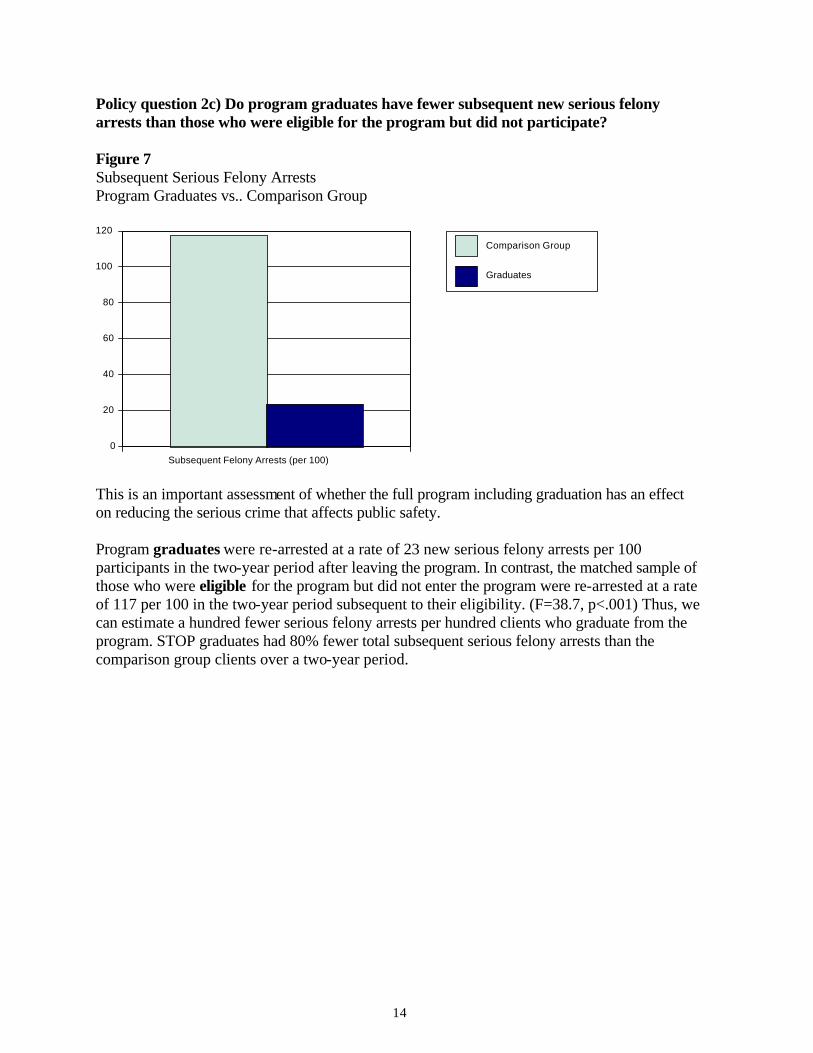
Policy question 2c) Do program graduates have fewer subsequent new serious felony arrests than those who were eligible for the program but did not participate? Figure 7 Subsequent Serious Felony Arrests Program Graduates vs.. Comparison Group
Subsequent Felony Arrests (per 100)0
20
40
60
80
100
120
Comparison Group
Graduates
This is an important assessment of whether the full program including graduation has an effect on reducing the serious crime that affects public safety. Program graduates were re-arrested at a rate of 23 new serious felony arrests per 100 participants in the two-year period after leaving the program. In contrast, the matched sample of those who were eligible for the program but did not enter the program were re-arrested at a rate of 117 per 100 in the two-year period subsequent to their eligibility. (F=38.7, p<.001) Thus, we can estimate a hundred fewer serious felony arrests per hundred clients who graduate from the program. STOP graduates had 80% fewer total subsequent serious felony arrests than the comparison group clients over a two-year period.
15
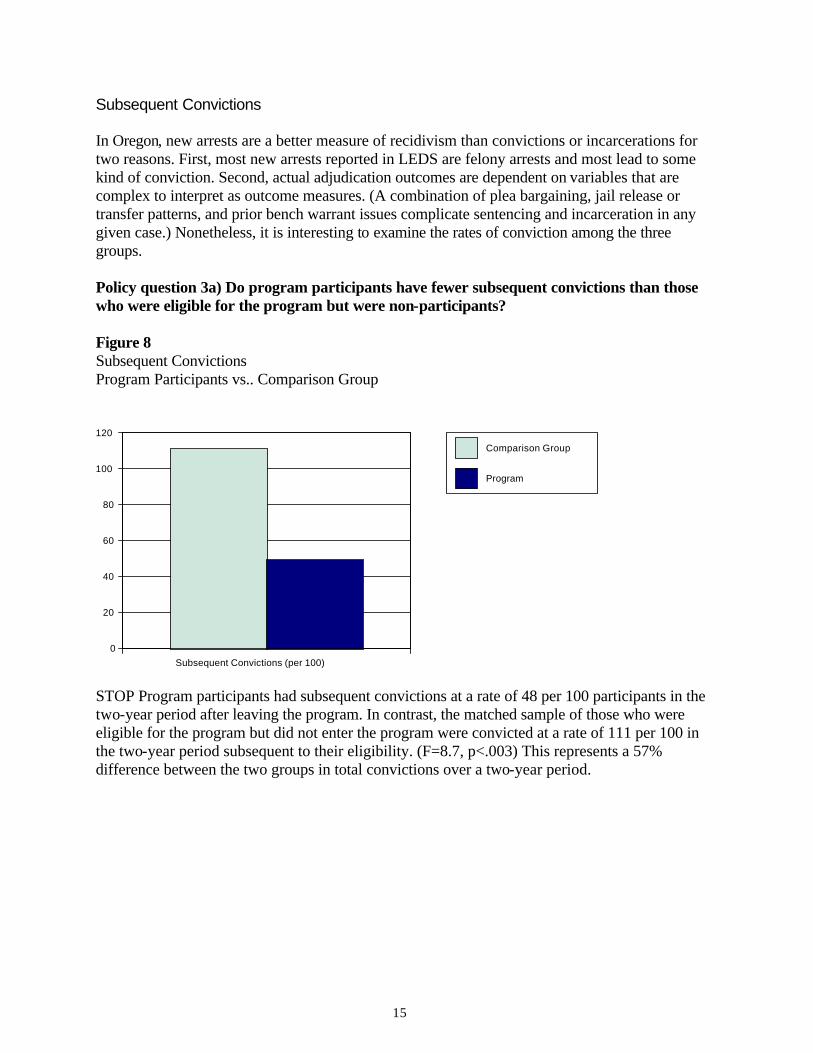
Subsequent Convictions In Oregon, new arrests are a better measure of recidivism than convictions or incarcerations for two reasons. First, most new arrests reported in LEDS are felony arrests and most lead to some kind of conviction. Second, actual adjudication outcomes are dependent on variables that are complex to interpret as outcome measures. (A combination of plea bargaining, jail release or transfer patterns, and prior bench warrant issues complicate sentencing and incarceration in any given case.) Nonetheless, it is interesting to examine the rates of conviction among the three groups. Policy question 3a) Do program participants have fewer subsequent convictions than those who were eligible for the program but were non-participants? Figure 8 Subsequent Convictions Program Participants vs.. Comparison Group
Subsequent Convictions (per 100)0
20
40
60
80
100
120
Comparison Group
Program
STOP Program participants had subsequent convictions at a rate of 48 per 100 participants in the two-year period after leaving the program. In contrast, the matched sample of those who were eligible for the program but did not enter the program were convicted at a rate of 111 per 100 in the two-year period subsequent to their eligibility. (F=8.7, p<.003) This represents a 57% difference between the two groups in total convictions over a two-year period.

16
Policy question 3b) Do program graduates have fewer subsequent convictions than those who participated in the program but did not graduate? Figure 9 Subsequent Convictions Program Graduates vs.. Program Non-Completers
Subsequent Convictions (per 100)0
10
20
30
40
50
60
Non-Completers
Graduates
Program graduates were re-arrested at a rate of 29 new convictions per 100 participants in the two-year period after leaving the program. In contrast, program participants who did not graduate were convicted at a rate of 59 per 100 in the two-year period subsequent to leaving the program. (F=9.8, p<.002) This represents a 51% difference between the two groups in total subsequent convictions over a two-year period.
17
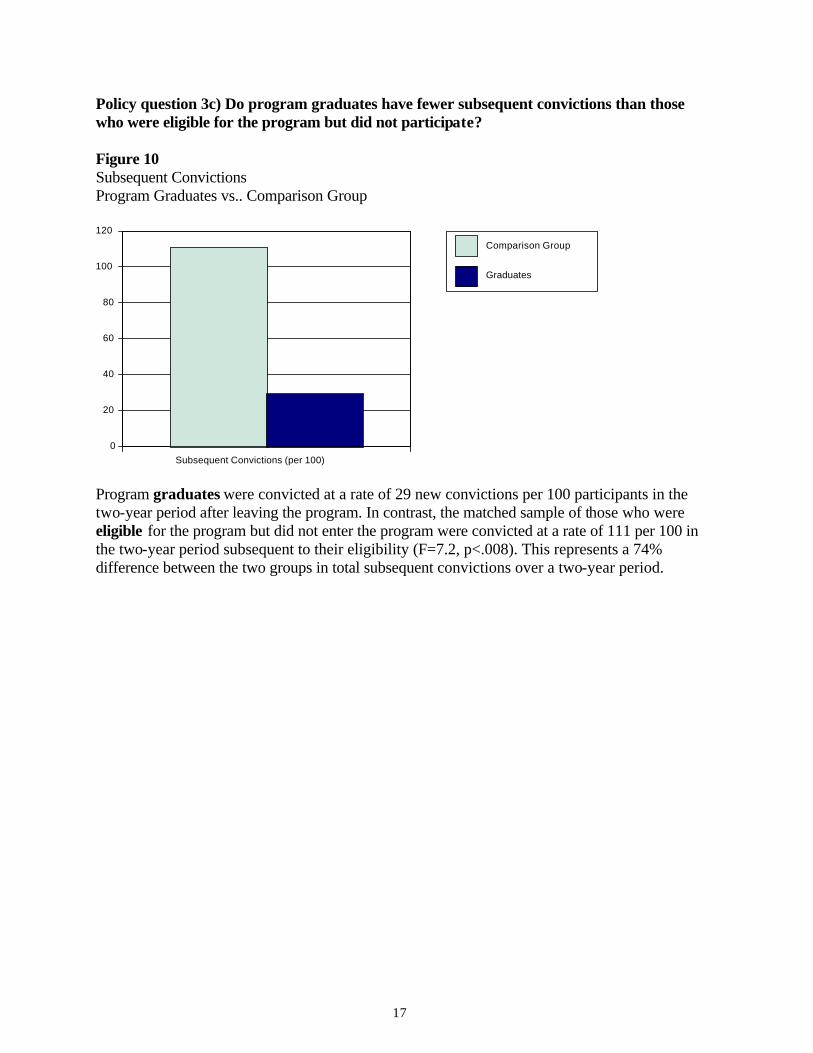
Policy question 3c) Do program graduates have fewer subsequent convictions than those who were eligible for the program but did not participate? Figure 10 Subsequent Convictions Program Graduates vs.. Comparison Group
Subsequent Convictions (per 100)0
20
40
60
80
100
120
Comparison Group
Graduates
Program graduates were convicted at a rate of 29 new convictions per 100 participants in the two-year period after leaving the program. In contrast, the matched sample of those who were eligible for the program but did not enter the program were convicted at a rate of 111 per 100 in the two-year period subsequent to their eligibility (F=7.2, p<.008). This represents a 74% difference between the two groups in total subsequent convictions over a two-year period.
18
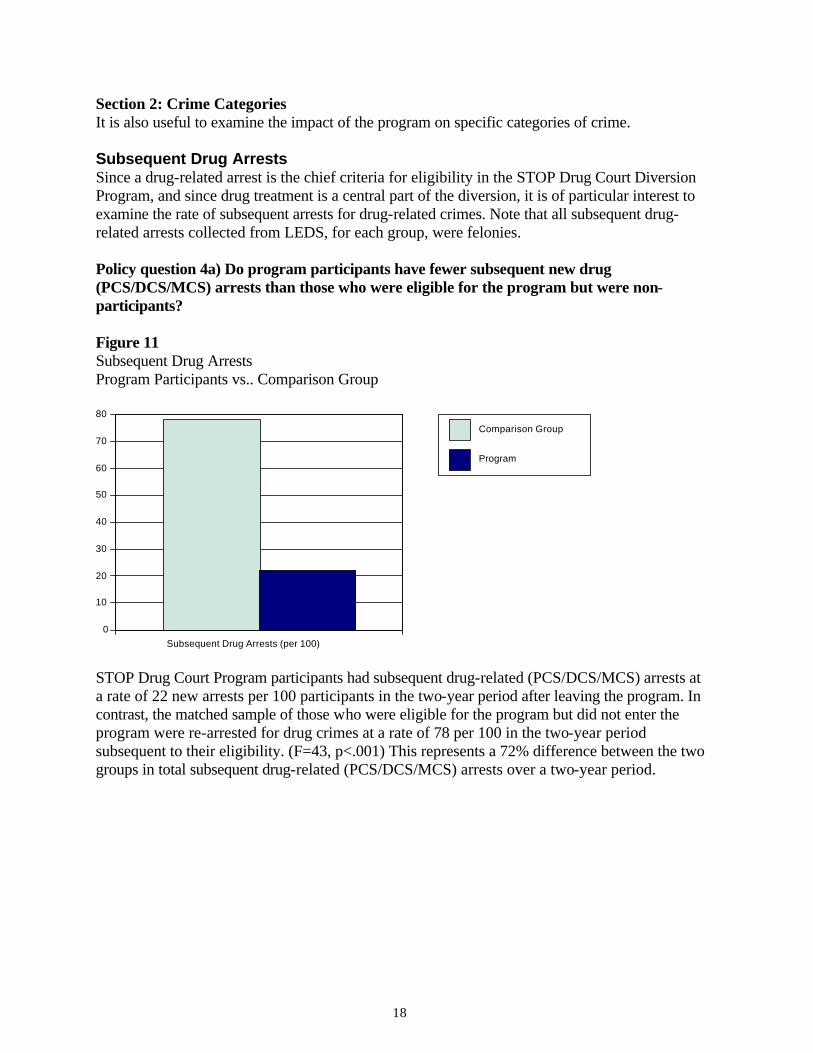
Section 2: Crime Categories It is also useful to examine the impact of the program on specific categories of crime. Subsequent Drug Arrests Since a drug-related arrest is the chief criteria for eligibility in the STOP Drug Court Diversion Program, and since drug treatment is a central part of the diversion, it is of particular interest to examine the rate of subsequent arrests for drug-related crimes. Note that all subsequent drug-related arrests collected from LEDS, for each group, were felonies. Policy question 4a) Do program participants have fewer subsequent new drug (PCS/DCS/MCS) arrests than those who were eligible for the program but were non-participants? Figure 11 Subsequent Drug Arrests Program Participants vs.. Comparison Group
Subsequent Drug Arrests (per 100)0
10
20
30
40
50
60
70
80
Comparison Group
Program
STOP Drug Court Program participants had subsequent drug-related (PCS/DCS/MCS) arrests at a rate of 22 new arrests per 100 participants in the two-year period after leaving the program. In contrast, the matched sample of those who were eligible for the program but did not enter the program were re-arrested for drug crimes at a rate of 78 per 100 in the two-year period subsequent to their eligibility. (F=43, p<.001) This represents a 72% difference between the two groups in total subsequent drug-related (PCS/DCS/MCS) arrests over a two-year period.
19
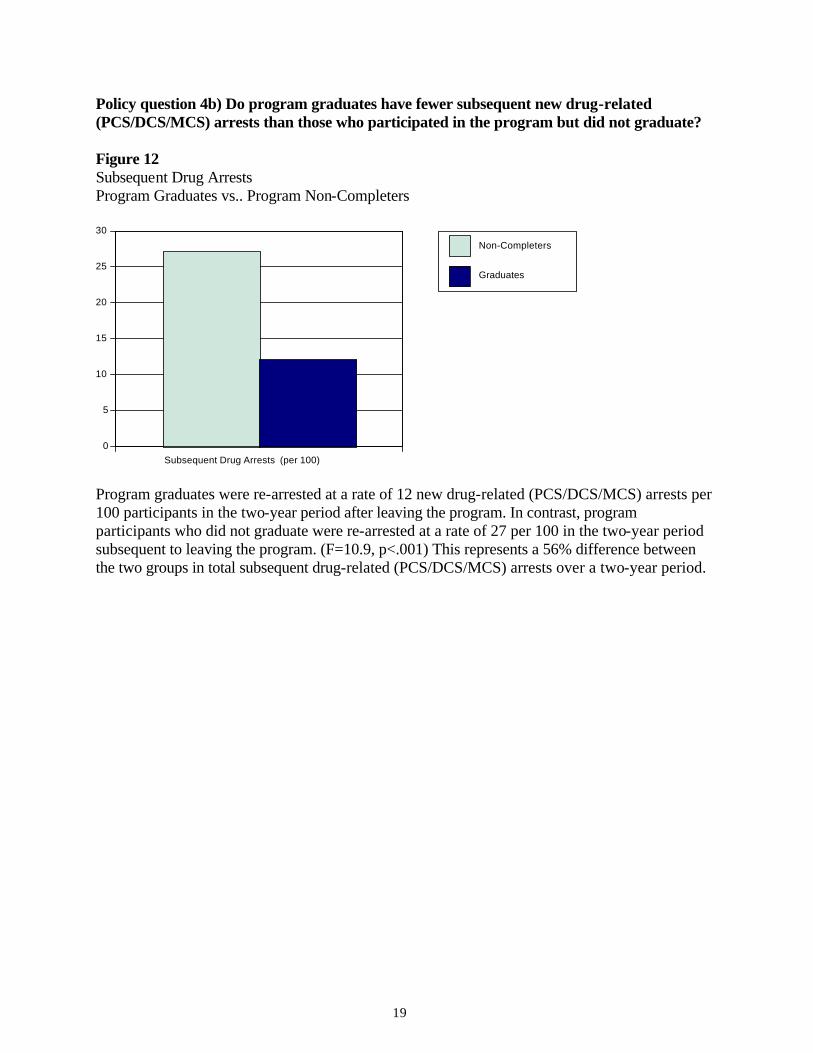
Policy question 4b) Do program graduates have fewer subsequent new drug-related (PCS/DCS/MCS) arrests than those who participated in the program but did not graduate? Figure 12 Subsequent Drug Arrests Program Graduates vs.. Program Non-Completers
Subsequent Drug Arrests (per 100)0
5
10
15
20
25
30
Non-Completers
Graduates
Program graduates were re-arrested at a rate of 12 new drug-related (PCS/DCS/MCS) arrests per 100 participants in the two-year period after leaving the program. In contrast, program participants who did not graduate were re-arrested at a rate of 27 per 100 in the two-year period subsequent to leaving the program. (F=10.9, p<.001) This represents a 56% difference between the two groups in total subsequent drug-related (PCS/DCS/MCS) arrests over a two-year period.
20
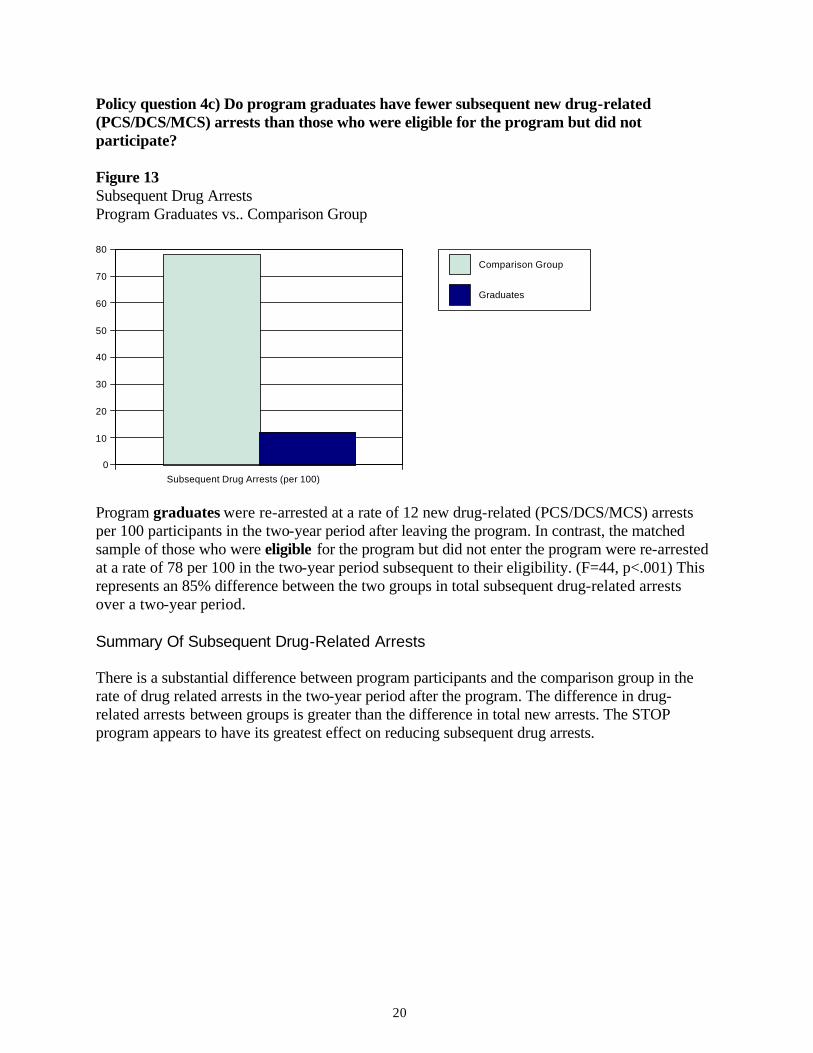
Policy question 4c) Do program graduates have fewer subsequent new drug-related (PCS/DCS/MCS) arrests than those who were eligible for the program but did not participate? Figure 13 Subsequent Drug Arrests Program Graduates vs.. Comparison Group
Subsequent Drug Arrests (per 100)0
10
20
30
40
50
60
70
80
Comparison Group
Graduates
Program graduates were re-arrested at a rate of 12 new drug-related (PCS/DCS/MCS) arrests per 100 participants in the two-year period after leaving the program. In contrast, the matched sample of those who were eligible for the program but did not enter the program were re-arrested at a rate of 78 per 100 in the two-year period subsequent to their eligibility. (F=44, p<.001) This represents an 85% difference between the two groups in total subsequent drug-related arrests over a two-year period. Summary Of Subsequent Drug-Related Arrests There is a substantial difference between program participants and the comparison group in the rate of drug related arrests in the two-year period after the program. The difference in drug-related arrests between groups is greater than the difference in total new arrests. The STOP program appears to have its greatest effect on reducing subsequent drug arrests.
21
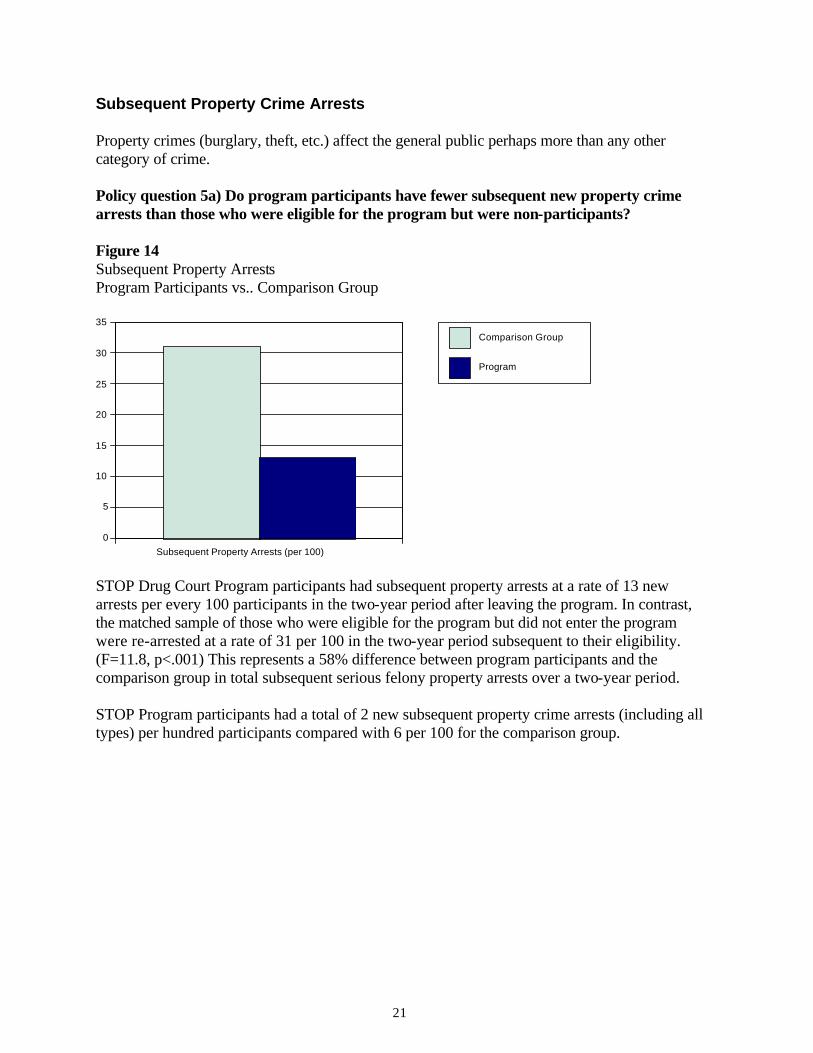
Subsequent Property Crime Arrests Property crimes (burglary, theft, etc.) affect the general public perhaps more than any other category of crime. Policy question 5a) Do program participants have fewer subsequent new property crime arrests than those who were eligible for the program but were non-participants? Figure 14 Subsequent Property Arrests Program Participants vs.. Comparison Group
Subsequent Property Arrests (per 100)0
5
10
15
20
25
30
35
Comparison Group
Program
STOP Drug Court Program participants had subsequent property arrests at a rate of 13 new arrests per every 100 participants in the two-year period after leaving the program. In contrast, the matched sample of those who were eligible for the program but did not enter the program were re-arrested at a rate of 31 per 100 in the two-year period subsequent to their eligibility. (F=11.8, p<.001) This represents a 58% difference between program participants and the comparison group in total subsequent serious felony property arrests over a two-year period. STOP Program participants had a total of 2 new subsequent property crime arrests (including all types) per hundred participants compared with 6 per 100 for the comparison group.

22
Policy question 5b) Do program graduates have fewer subsequent new property crime arrests than those who participated in the program but did not graduate? Figure 15 Subsequent Property Arrests Program Graduates vs.. Program Non-Completers
Subsequent Property Arrests (per 100)0
2
4
6
8
10
12
14
16
Non-Completers
Graduates
Program graduates were re-arrested at a rate of 7 new serious felony property crime arrests per 100 participants in the two-year period after leaving the program. In contrast, program participants who did not graduate were re-arrested at a rate of 10 per 100 in the two-year period subsequent to leaving the program. (F=2.3, NS) This represents a 30% difference between the graduates and non-graduates in total subsequent serious felony property arrests over a two-year period. STOP Program graduates had a total of 2 new subsequent serious felony property crime arrests per hundred participants compared to 3 for participants who did not graduate.
23
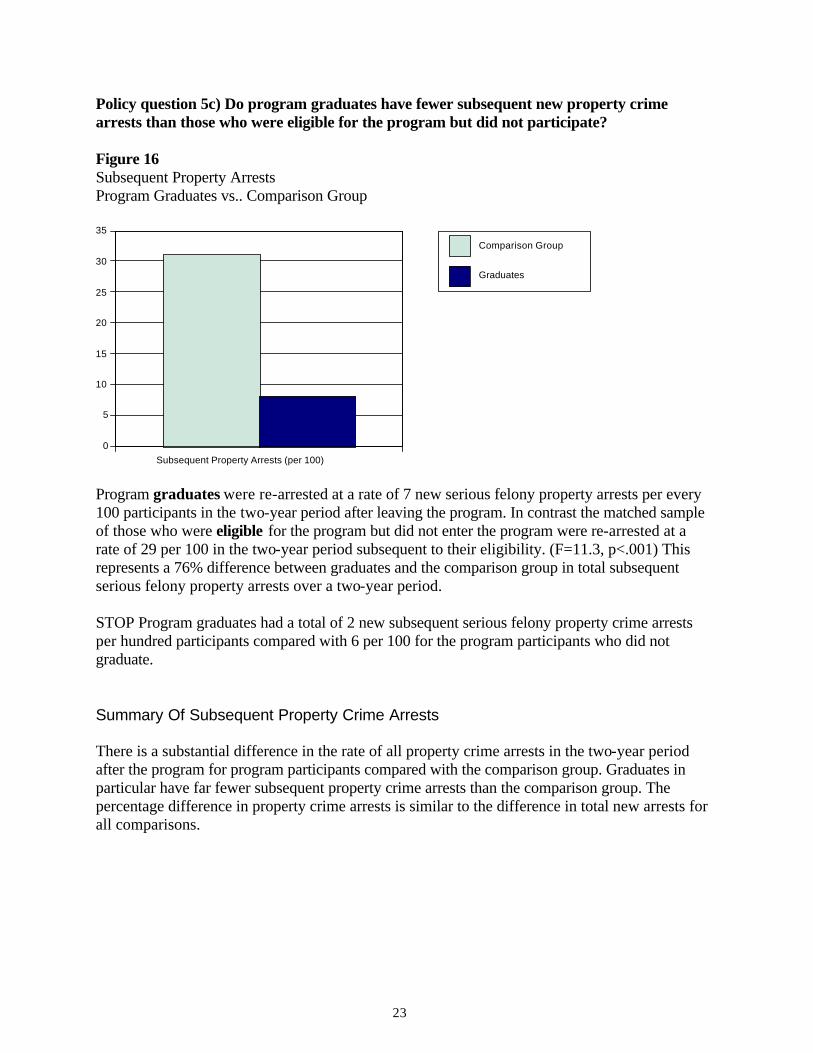
Policy question 5c) Do program graduates have fewer subsequent new property crime arrests than those who were eligible for the program but did not participate? Figure 16 Subsequent Property Arrests Program Graduates vs.. Comparison Group
Subsequent Property Arrests (per 100)0
5
10
15
20
25
30
35
Comparison Group
Graduates
Program graduates were re-arrested at a rate of 7 new serious felony property arrests per every 100 participants in the two-year period after leaving the program. In contrast the matched sample of those who were eligible for the program but did not enter the program were re-arrested at a rate of 29 per 100 in the two-year period subsequent to their eligibility. (F=11.3, p<.001) This represents a 76% difference between graduates and the comparison group in total subsequent serious felony property arrests over a two-year period. STOP Program graduates had a total of 2 new subsequent serious felony property crime arrests per hundred participants compared with 6 per 100 for the program participants who did not graduate. Summary Of Subsequent Property Crime Arrests There is a substantial difference in the rate of all property crime arrests in the two-year period after the program for program participants compared with the comparison group. Graduates in particular have far fewer subsequent property crime arrests than the comparison group. The percentage difference in property crime arrests is similar to the difference in total new arrests for all comparisons.
24
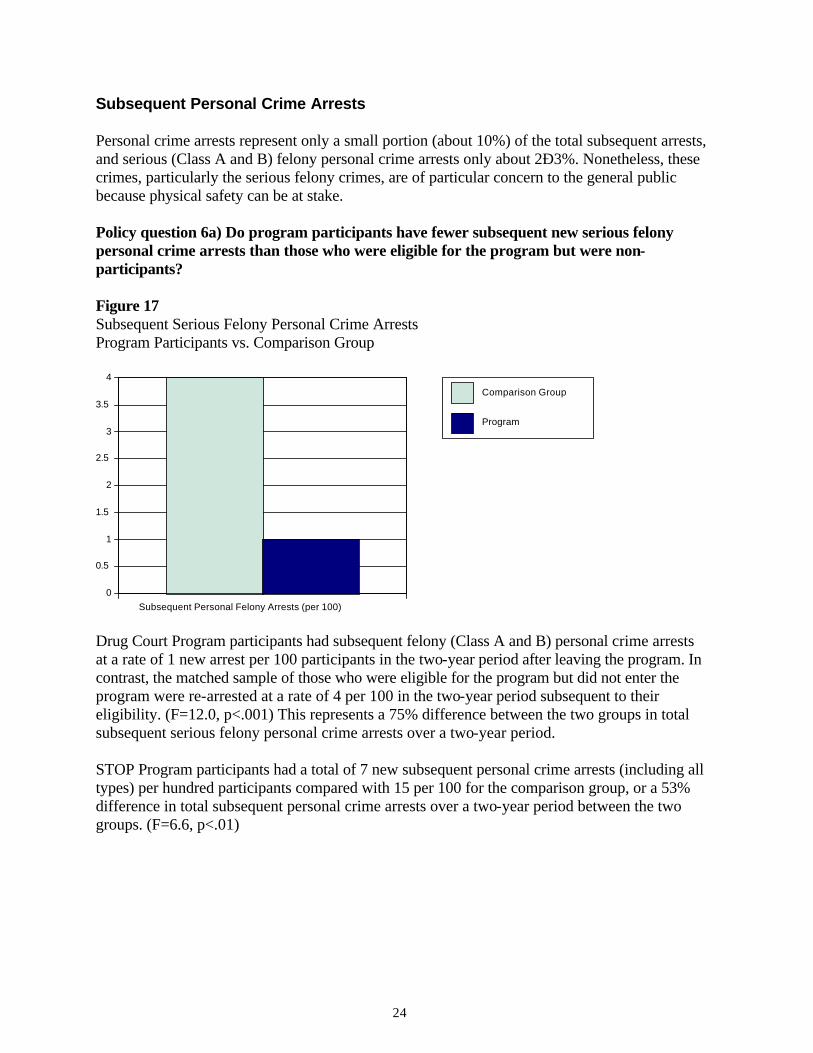
Subsequent Personal Crime Arrests Personal crime arrests represent only a small portion (about 10%) of the total subsequent arrests, and serious (Class A and B) felony personal crime arrests only about 2Ð3%. Nonetheless, these crimes, particularly the serious felony crimes, are of particular concern to the general public because physical safety can be at stake. Policy question 6a) Do program participants have fewer subsequent new serious felony personal crime arrests than those who were eligible for the program but were non-participants? Figure 17 Subsequent Serious Felony Personal Crime Arrests Program Participants vs. Comparison Group
Subsequent Personal Felony Arrests (per 100)0
0.5
1
1.5
2
2.5
3
3.5
4
Comparison Group
Program
Drug Court Program participants had subsequent felony (Class A and B) personal crime arrests at a rate of 1 new arrest per 100 participants in the two-year period after leaving the program. In contrast, the matched sample of those who were eligible for the program but did not enter the program were re-arrested at a rate of 4 per 100 in the two-year period subsequent to their eligibility. (F=12.0, p<.001) This represents a 75% difference between the two groups in total subsequent serious felony personal crime arrests over a two-year period. STOP Program participants had a total of 7 new subsequent personal crime arrests (including all types) per hundred participants compared with 15 per 100 for the comparison group, or a 53% difference in total subsequent personal crime arrests over a two-year period between the two groups. (F=6.6, p<.01)
25
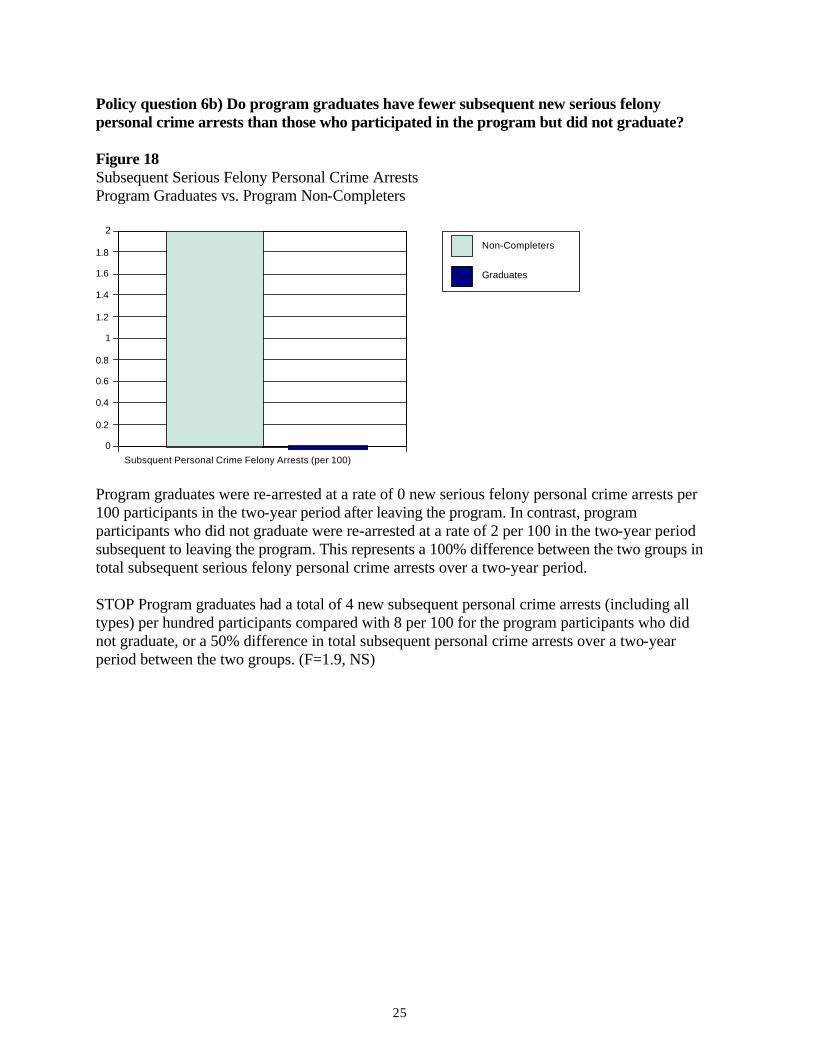
Policy question 6b) Do program graduates have fewer subsequent new serious felony personal crime arrests than those who participated in the program but did not graduate? Figure 18 Subsequent Serious Felony Personal Crime Arrests Program Graduates vs. Program Non-Completers
Subsquent Personal Crime Felony Arrests (per 100)0
0.2
0.4
0.6
0.8
1
1.2
1.4
1.6
1.8
2
Non-Completers
Graduates
Program graduates were re-arrested at a rate of 0 new serious felony personal crime arrests per 100 participants in the two-year period after leaving the program. In contrast, program participants who did not graduate were re-arrested at a rate of 2 per 100 in the two-year period subsequent to leaving the program. This represents a 100% difference between the two groups in total subsequent serious felony personal crime arrests over a two-year period. STOP Program graduates had a total of 4 new subsequent personal crime arrests (including all types) per hundred participants compared with 8 per 100 for the program participants who did not graduate, or a 50% difference in total subsequent personal crime arrests over a two-year period between the two groups. (F=1.9, NS)
26
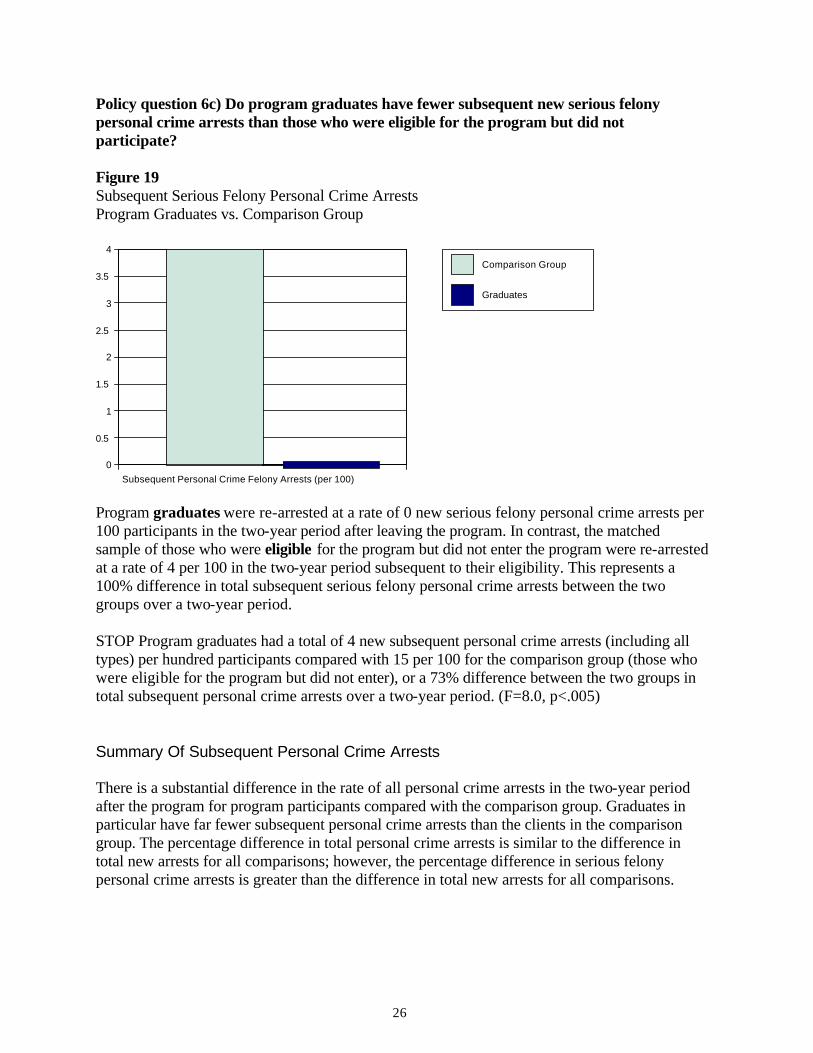
Policy question 6c) Do program graduates have fewer subsequent new serious felony personal crime arrests than those who were eligible for the program but did not participate? Figure 19 Subsequent Serious Felony Personal Crime Arrests Program Graduates vs. Comparison Group
Subsequent Personal Crime Felony Arrests (per 100)0
0.5
1
1.5
2
2.5
3
3.5
4
Comparison Group
Graduates
Program graduates were re-arrested at a rate of 0 new serious felony personal crime arrests per 100 participants in the two-year period after leaving the program. In contrast, the matched sample of those who were eligible for the program but did not enter the program were re-arrested at a rate of 4 per 100 in the two-year period subsequent to their eligibility. This represents a 100% difference in total subsequent serious felony personal crime arrests between the two groups over a two-year period. STOP Program graduates had a total of 4 new subsequent personal crime arrests (including all types) per hundred participants compared with 15 per 100 for the comparison group (those who were eligible for the program but did not enter), or a 73% difference between the two groups in total subsequent personal crime arrests over a two-year period. (F=8.0, p<.005) Summary Of Subsequent Personal Crime Arrests There is a substantial difference in the rate of all personal crime arrests in the two-year period after the program for program participants compared with the comparison group. Graduates in particular have far fewer subsequent personal crime arrests than the clients in the comparison group. The percentage difference in total personal crime arrests is similar to the difference in total new arrests for all comparisons; however, the percentage difference in serious felony personal crime arrests is greater than the difference in total new arrests for all comparisons.
27
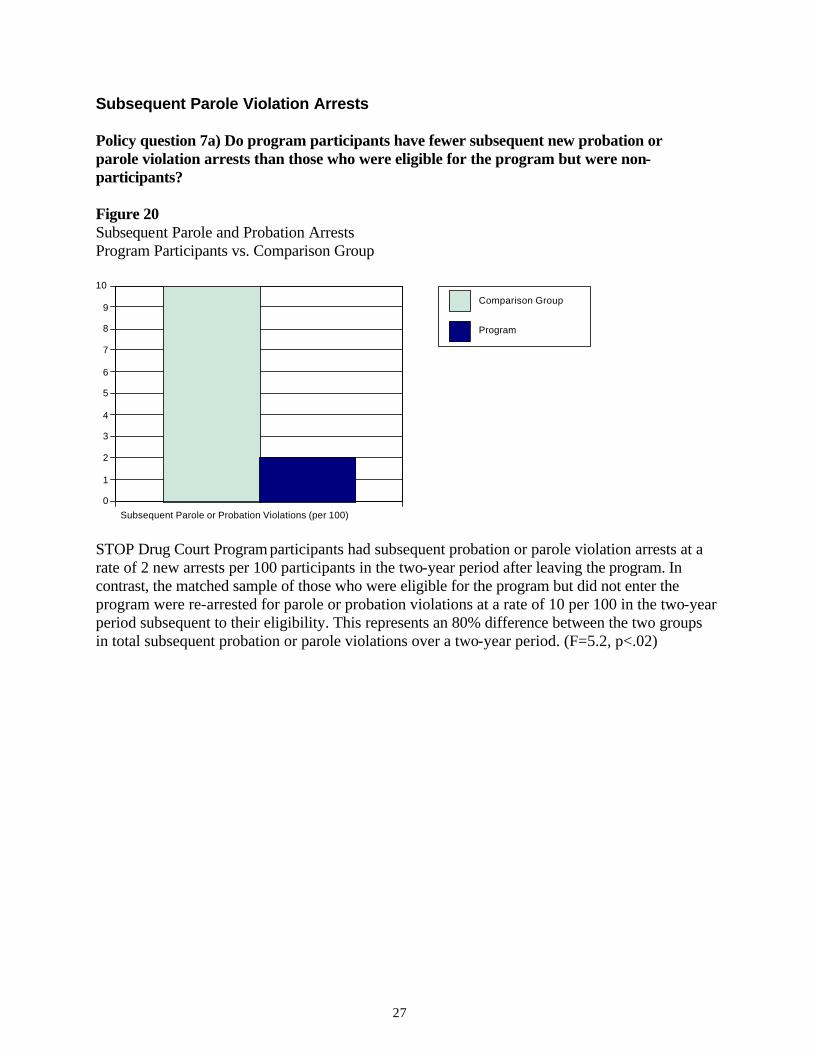
Subsequent Parole Violation Arrests Policy question 7a) Do program participants have fewer subsequent new probation or parole violation arrests than those who were eligible for the program but were non-participants? Figure 20 Subsequent Parole and Probation Arrests Program Participants vs. Comparison Group
Subsequent Parole or Probation Violations (per 100)0
1
2
3
4
5
6
7
8
9
10
Comparison Group
Program
STOP Drug Court Program participants had subsequent probation or parole violation arrests at a rate of 2 new arrests per 100 participants in the two-year period after leaving the program. In contrast, the matched sample of those who were eligible for the program but did not enter the program were re-arrested for parole or probation violations at a rate of 10 per 100 in the two-year period subsequent to their eligibility. This represents an 80% difference between the two groups in total subsequent probation or parole violations over a two-year period. (F=5.2, p<.02)
28
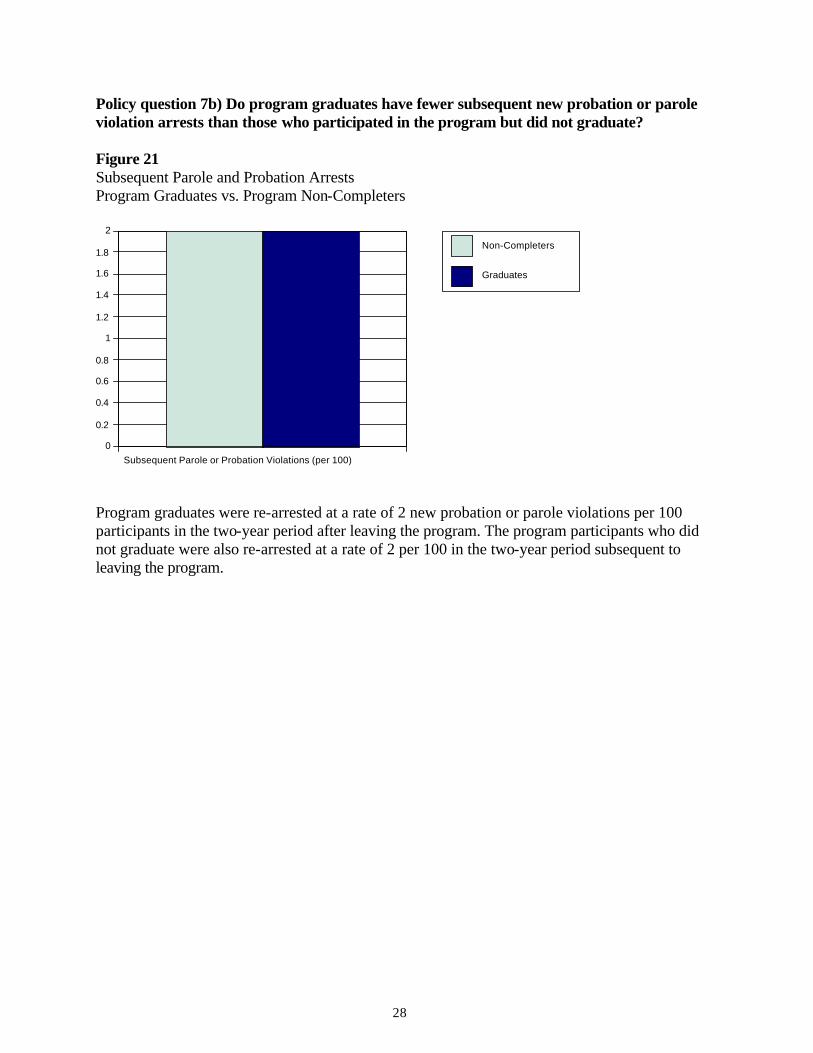
Policy question 7b) Do program graduates have fewer subsequent new probation or parole violation arrests than those who participated in the program but did not graduate? Figure 21 Subsequent Parole and Probation Arrests Program Graduates vs. Program Non-Completers
Subsequent Parole or Probation Violations (per 100)0
0.2
0.4
0.6
0.8
1
1.2
1.4
1.6
1.8
2
Non-Completers
Graduates
Program graduates were re-arrested at a rate of 2 new probation or parole violations per 100 participants in the two-year period after leaving the program. The program participants who did not graduate were also re-arrested at a rate of 2 per 100 in the two-year period subsequent to leaving the program.
29
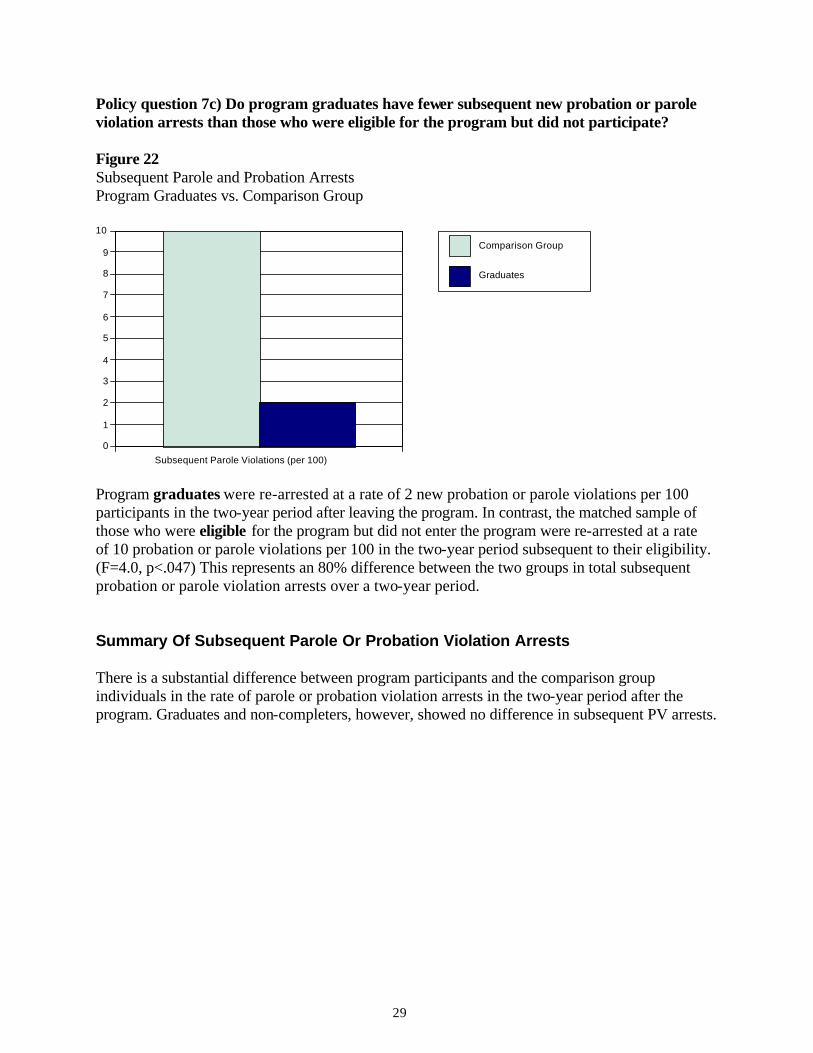
Policy question 7c) Do program graduates have fewer subsequent new probation or parole violation arrests than those who were eligible for the program but did not participate? Figure 22 Subsequent Parole and Probation Arrests Program Graduates vs. Comparison Group
Subsequent Parole Violations (per 100)0
1
2
3
4
5
6
7
8
9
10
Comparison Group
Graduates
Program graduates were re-arrested at a rate of 2 new probation or parole violations per 100 participants in the two-year period after leaving the program. In contrast, the matched sample of those who were eligible for the program but did not enter the program were re-arrested at a rate of 10 probation or parole violations per 100 in the two-year period subsequent to their eligibility. (F=4.0, p<.047) This represents an 80% difference between the two groups in total subsequent probation or parole violation arrests over a two-year period. Summary Of Subsequent Parole Or Probation Violation Arrests There is a substantial difference between program participants and the comparison group individuals in the rate of parole or probation violation arrests in the two-year period after the program. Graduates and non-completers, however, showed no difference in subsequent PV arrests.

30
Supervision The major focus of supervision is to provide a positive re-adjustment of the criminal into the community. Measures of positive adjustment include finding employment, improving training and education, receiving substance abuse treatment and counseling, finding housing, and utilizing other services important in the development of a non-criminal lifestyle. To assist in the analysis of these positive adjustment outcome measures, a scale of positive adjustment for parolees was designed, adapted from one used by Latessa and Vito7 on probationers. This scale measures the adjustment of the probationer in becoming a productive community member. Data collection staff used this instrument as a measure for each client after examining his or her supervision officer file. The client’s behavior as evidenced in the file was scored on factors related to positive community adjustment and successful supervision. Each individual under supervision was given one point for any evidence in the file of any of the following: Positive Adjustment Scale 1) Employed, enrolled in school, or participating in a training program. 2) Employed, enrolled in school, or participating in a training program for more than 50 percent of the time period. 3) Attained vertical mobility in employment, educational, or vocational program. 4) Efforts toward financial stability. Indicated by the individual living within his means or meeting debt payments. 5) For at least half of the time period individual was self-supporting and supported any immediate family. 6) Individual showed stability in residency. Either lived in the same residence for more than six months or moved at suggestion or with the agreement of supervising officer. 7) Individual avoided any critical incidents that showed instability, immaturity, or inability to solve problems acceptably. 8) Participation in self-improvement programs. These could be vocational, educational, group counseling, alcohol or drug maintenance programs. 9) Individual making satisfactory progress through time period. This could be moving downward in levels of supervision or obtaining final release within period. 10) No illegal activities on any available records during the time period.
7 The Effects of Intensive Supervision on Shock Probationers. Journal of Criminal Justice, Vol. 16, pp. 319-330 (1988).
31
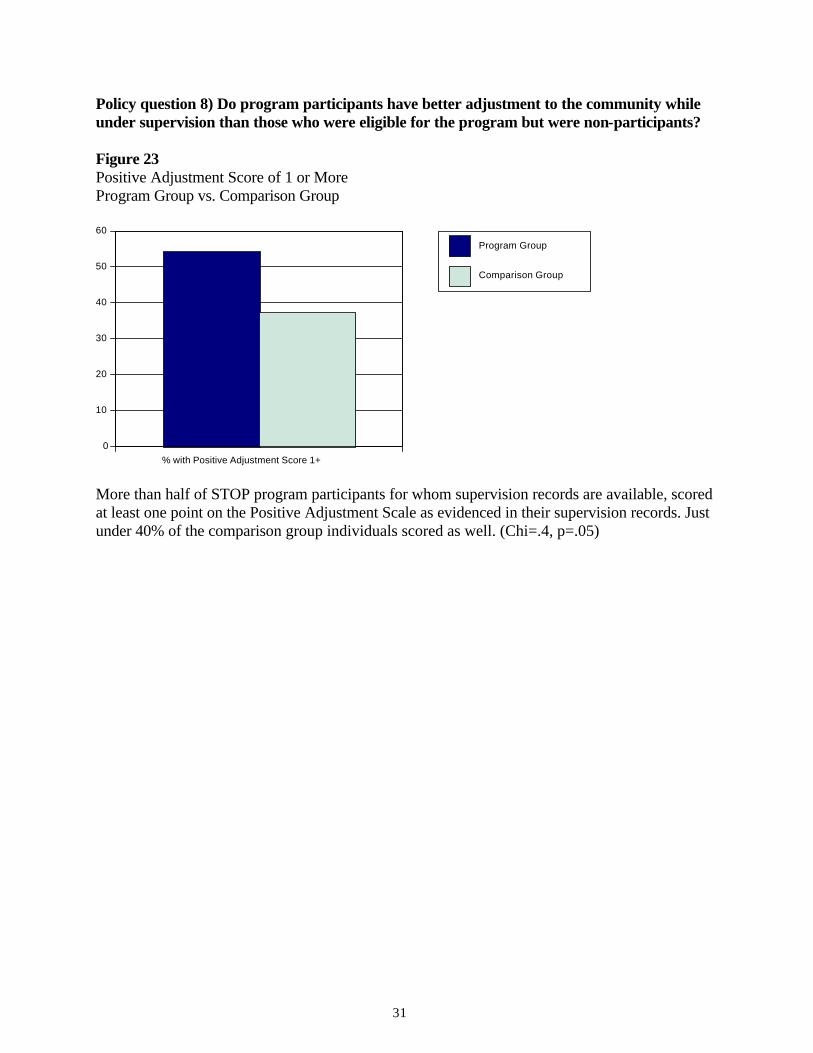
Policy question 8) Do program participants have better adjustment to the community while under supervision than those who were eligible for the program but were non-participants? Figure 23 Positive Adjustment Score of 1 or More Program Group vs. Comparison Group
% with Positive Adjustment Score 1+0
10
20
30
40
50
60
Program Group
Comparison Group
More than half of STOP program participants for whom supervision records are available, scored at least one point on the Positive Adjustment Scale as evidenced in their supervision records. Just under 40% of the comparison group individuals scored as well. (Chi=.4, p=.05)
32
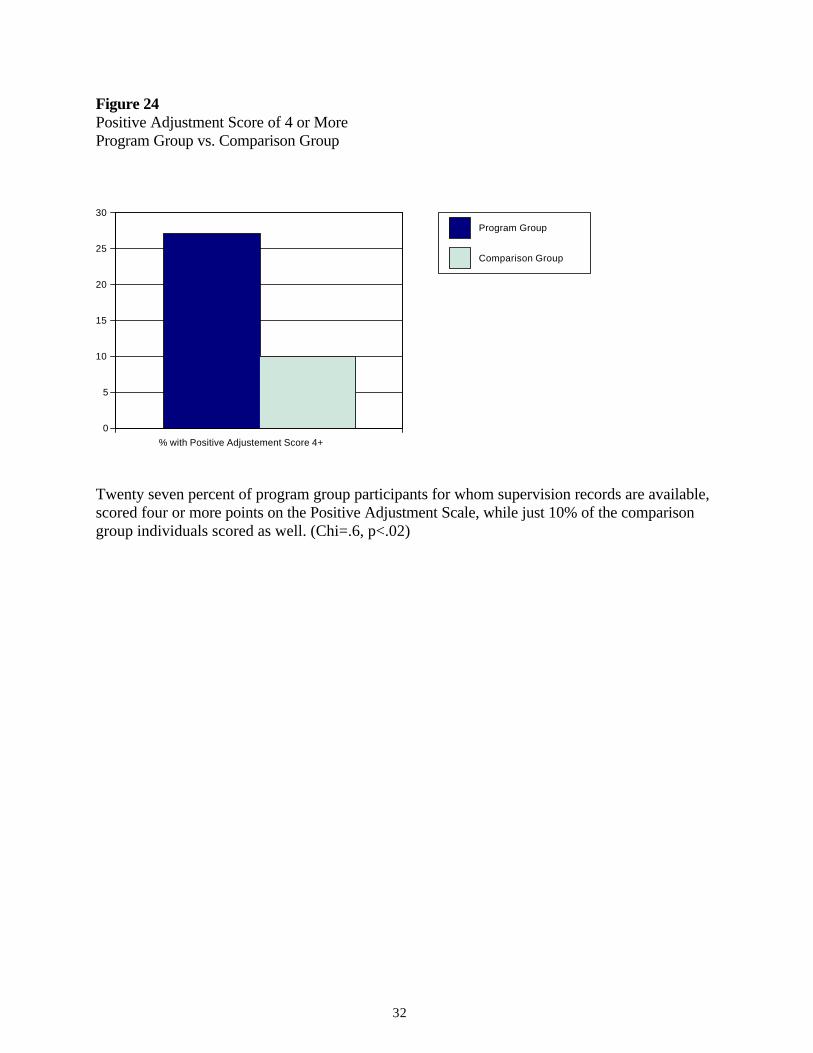
Figure 24 Positive Adjustment Score of 4 or More Program Group vs. Comparison Group
% with Positive Adjustement Score 4+0
5
10
15
20
25
30
Program Group
Comparison Group
Twenty seven percent of program group participants for whom supervision records are available, scored four or more points on the Positive Adjustment Scale, while just 10% of the comparison group individuals scored as well. (Chi=.6, p<.02)

33
COST ASSESSMENT The outcome data were used not only to assess the effectiveness of the STOP program but also to assess the relative costs/benefits of the program to the taxpayer. Current research has calculated the benefits of treatment primarily by focusing on “avoided costs.” These are costs that would have accrued had the program participants not received treatment. This approach is used in this study. The specific strategy used here is a “Cost to Taxpayers” approach that focuses on the costs related to untreated substance abuse that come directly from the pockets of taxpaying citizens. The focus is not so much on the benefits (or avoided costs) to successful substance abuse treatment completers in their own lives as it is on the benefits (or avoided costs) to non-substance abusing citizens. In this approach, any cost that is the result of untreated substance abuse and that directly impacts a citizen (either through tax-related expenditures or the results of being a victim of a crime perpetrated by a substance abuser) is used in calculating the avoided costs of substance abuse treatment. This approach is similar to the one that was used in the recent assessment of statewide avoided costs that result from treatment completion.8 The avoided costs were assessed on two levels:
* Avoided costs to the taxpayers in Multnomah County
* Avoided costs to the taxpayers in the State of Oregon In assessing the avoided costs resulting from the positive outcomes of treatment described earlier, we have defined the following as costs: Criminal Justice System Costs: the cost of police protection services, prosecution, adjudication, public defense, and corrections (incarceration and parole/probation). Victim Losses: victim expenditures on medical care, repairs of damaged property, and lost time from work that results from predatory crimes. Theft Losses: the estimated value of property or money stolen during a crime, excluding any property damage or other victim losses. Health Care Service Utilization: the economic cost to the taxpayer in public assistance of inpatient, outpatient, and emergency medical care, and inpatient and outpatient mental health care that could have been avoided. Public Assistance: the economic values of such public assistance as food stamps, emergency assistance, public disability payments, and other public assistance.
8 Societal Outcomes and Cost Savings of Drug and Alcohol Treatment in the State of Oregon (1996) by Dr. Michael Finigan.
34
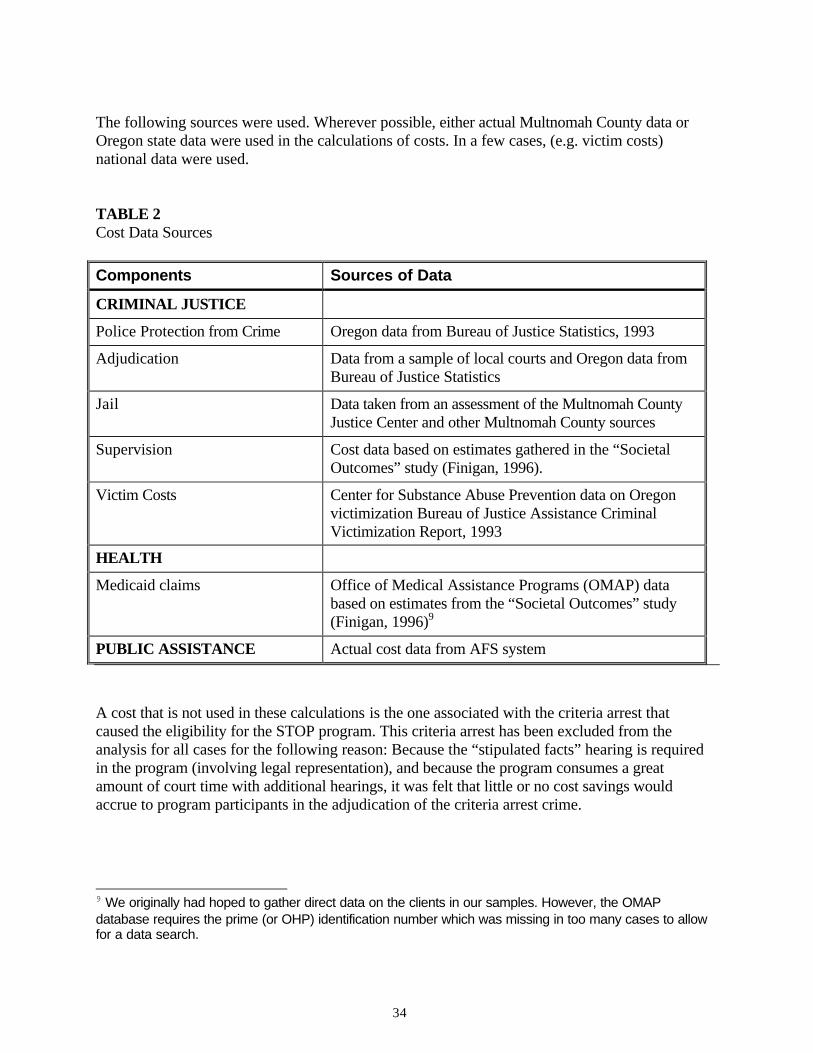
The following sources were used. Wherever possible, either actual Multnomah County data or Oregon state data were used in the calculations of costs. In a few cases, (e.g. victim costs) national data were used. TABLE 2 Cost Data Sources
Components Sources of Data
CRIMINAL JUSTICE
Police Protection from Crime Oregon data from Bureau of Justice Statistics, 1993
Adjudication Data from a sample of local courts and Oregon data from Bureau of Justice Statistics
Jail Data taken from an assessment of the Multnomah County Justice Center and other Multnomah County sources
Supervision Cost data based on estimates gathered in the “Societal Outcomes” study (Finigan, 1996).
Victim Costs Center for Substance Abuse Prevention data on Oregon victimization Bureau of Justice Assistance Criminal Victimization Report, 1993
HEALTH
Medicaid claims Office of Medical Assistance Programs (OMAP) data based on estimates from the “Societal Outcomes” study (Finigan, 1996)9
PUBLIC ASSISTANCE Actual cost data from AFS system
A cost that is not used in these calculations is the one associated with the criteria arrest that caused the eligibility for the STOP program. This criteria arrest has been excluded from the analysis for all cases for the following reason: Because the “stipulated facts” hearing is required in the program (involving legal representation), and because the program consumes a great amount of court time with additional hearings, it was felt that little or no cost savings would accrue to program participants in the adjudication of the criteria arrest crime.
9 We originally had hoped to gather direct data on the clients in our samples. However, the OMAP database requires the prime (or OHP) identification number which was missing in too many cases to allow for a data search.
35
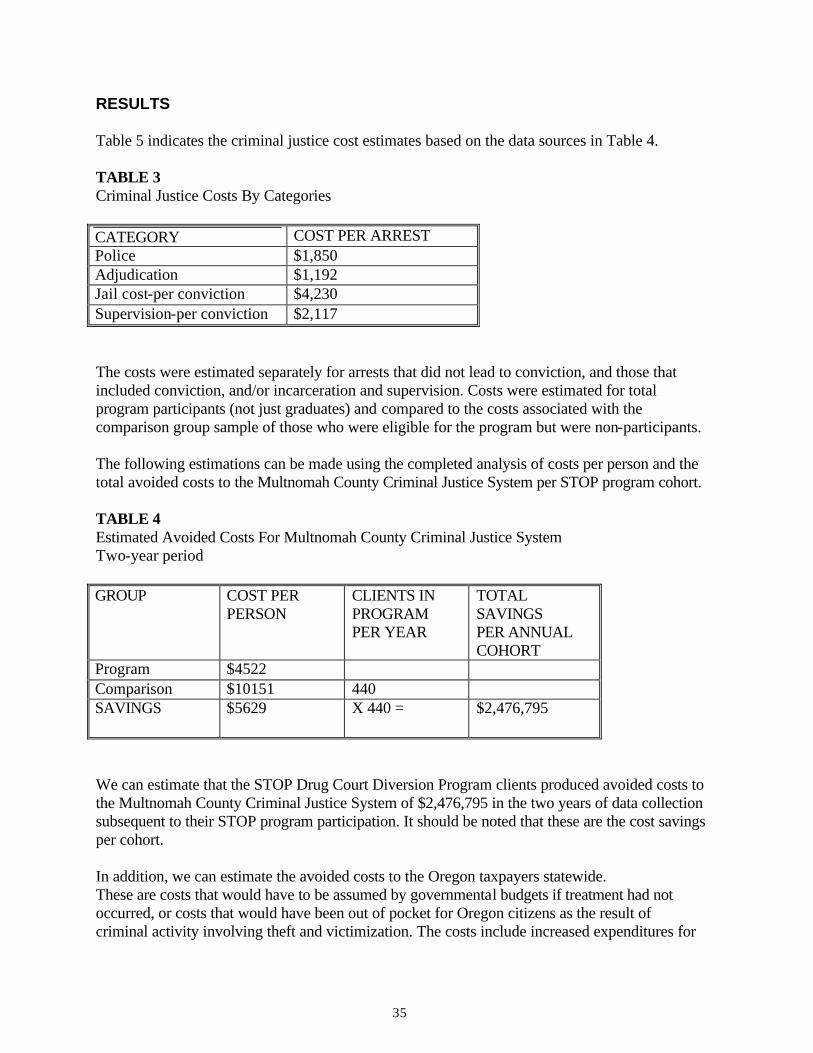
RESULTS Table 5 indicates the criminal justice cost estimates based on the data sources in Table 4. TABLE 3 Criminal Justice Costs By Categories
CATEGORY COST PER ARREST Police $1,850 Adjudication $1,192 Jail cost-per conviction $4,230 Supervision-per conviction $2,117 The costs were estimated separately for arrests that did not lead to conviction, and those that included conviction, and/or incarceration and supervision. Costs were estimated for total program participants (not just graduates) and compared to the costs associated with the comparison group sample of those who were eligible for the program but were non-participants. The following estimations can be made using the completed analysis of costs per person and the total avoided costs to the Multnomah County Criminal Justice System per STOP program cohort. TABLE 4 Estimated Avoided Costs For Multnomah County Criminal Justice System Two-year period GROUP COST PER
PERSON CLIENTS IN PROGRAM PER YEAR
TOTAL SAVINGS PER ANNUAL COHORT
Program $4522 Comparison $10151 440 SAVINGS
$5629 X 440 = $2,476,795
We can estimate that the STOP Drug Court Diversion Program clients produced avoided costs to the Multnomah County Criminal Justice System of $2,476,795 in the two years of data collection subsequent to their STOP program participation. It should be noted that these are the cost savings per cohort. In addition, we can estimate the avoided costs to the Oregon taxpayers statewide. These are costs that would have to be assumed by governmental budgets if treatment had not occurred, or costs that would have been out of pocket for Oregon citizens as the result of criminal activity involving theft and victimization. The costs include increased expenditures for
36
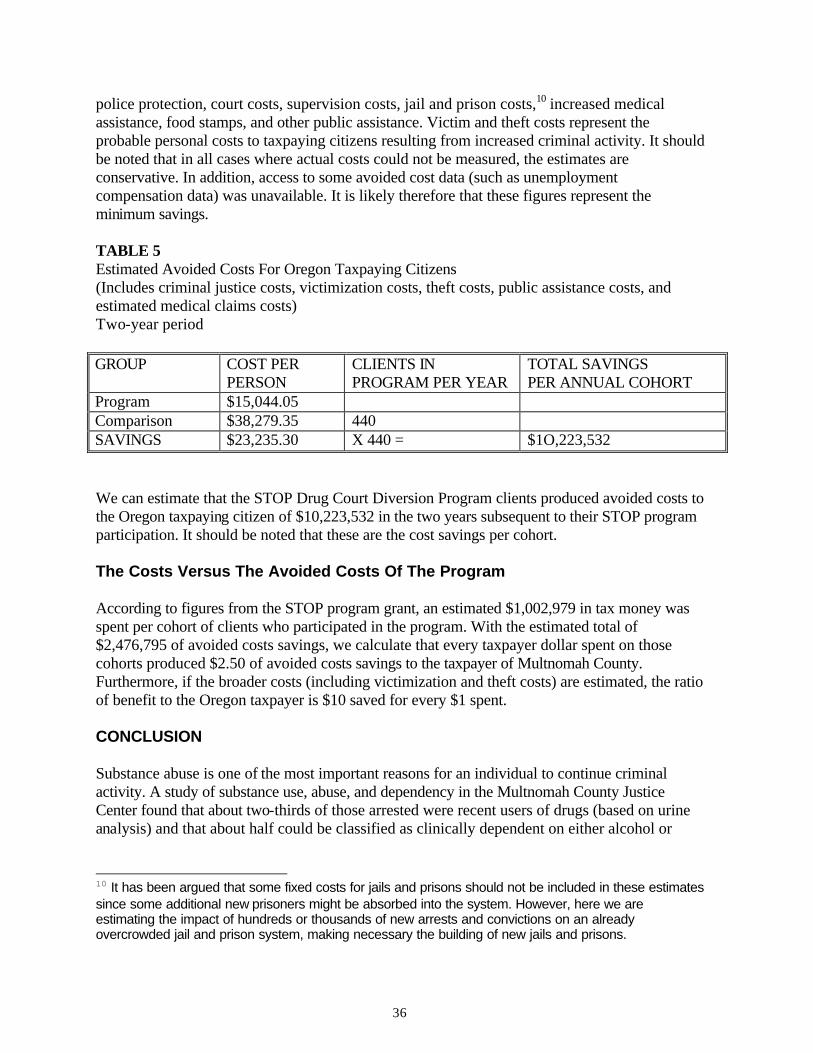
police protection, court costs, supervision costs, jail and prison costs,10 increased medical assistance, food stamps, and other public assistance. Victim and theft costs represent the probable personal costs to taxpaying citizens resulting from increased criminal activity. It should be noted that in all cases where actual costs could not be measured, the estimates are conservative. In addition, access to some avoided cost data (such as unemployment compensation data) was unavailable. It is likely therefore that these figures represent the minimum savings. TABLE 5 Estimated Avoided Costs For Oregon Taxpaying Citizens (Includes criminal justice costs, victimization costs, theft costs, public assistance costs, and estimated medical claims costs) Two-year period GROUP COST PER
PERSON CLIENTS IN PROGRAM PER YEAR
TOTAL SAVINGS PER ANNUAL COHORT
Program $15,044.05 Comparison $38,279.35 440 SAVINGS $23,235.30 X 440 = $1O,223,532 We can estimate that the STOP Drug Court Diversion Program clients produced avoided costs to the Oregon taxpaying citizen of $10,223,532 in the two years subsequent to their STOP program participation. It should be noted that these are the cost savings per cohort. The Costs Versus The Avoided Costs Of The Program According to figures from the STOP program grant, an estimated $1,002,979 in tax money was spent per cohort of clients who participated in the program. With the estimated total of $2,476,795 of avoided costs savings, we calculate that every taxpayer dollar spent on those cohorts produced $2.50 of avoided costs savings to the taxpayer of Multnomah County. Furthermore, if the broader costs (including victimization and theft costs) are estimated, the ratio of benefit to the Oregon taxpayer is $10 saved for every $1 spent. CONCLUSION Substance abuse is one of the most important reasons for an individual to continue criminal activity. A study of substance use, abuse, and dependency in the Multnomah County Justice Center found that about two-thirds of those arrested were recent users of drugs (based on urine analysis) and that about half could be classified as clinically dependent on either alcohol or
10 It has been argued that some fixed costs for jails and prisons should not be included in these estimates since some additional new prisoners might be absorbed into the system. However, here we are estimating the impact of hundreds or thousands of new arrests and convictions on an already overcrowded jail and prison system, making necessary the building of new jails and prisons.
37
drugs.11 Drug use plays a major role in the life of this population. Reducing substance abuse should have a positive effect on reducing criminal recidivism. The STOP Drug Court Diversion Program in Multnomah County has some distinctly advantageous features both in its court management and its substance abuse treatment aspects. In court management it has the following advantages:
• A single judge oversees the process, creating a continuity in the judicial process. • Òstipulated facts’ trial allows for swift and sure punishment for program failure. • Frequent drug testing and frequent appearances before the judge create an atmosphere of
careful court monitoring of the diversion process. The treatment aspect of the program also has several advantageous features including the following:
• A single provider ensuring consistency on the treatment side, • A multi-phase, multi-aspect 12 month treatment program, • Frequent drug testing, and • A strong influence from the court to enforce attendance and progress.
Under these conditions it is probably not surprising to see that clients who participate in the program, and particularly clients who graduate from the program, have less recidivism than a sample of clients who were eligible but did not participate. This study has some limitations. Because it was retrospective, random assignment to treatment and control conditions was not possible (and probably not possible even if it had been a contemporary sample). Therefore, it is always possible that some un-measured (and possibly unmeasurable) differences may exist among the three groups that affected the study outcomes. Nonetheless, we matched our comparison group on all critical variables removing some possible sources of bias. The results are strong and consistent. They clearly are consistent with the hypothesis of a positive effect from this program. This study found that program participants and particularly program graduates had significantly and substantially fewer subsequent arrests and convictions, particularly serious felony arrests. They also had lower rates of drug-related arrests suggesting that the program may have had an effect in lowering their involvement with drugs. The lower recidivism has an impact on public safety but it also has an important impact on public costs. Fewer arrests and convictions lessen the pressure on the criminal justice system, particularly the jail, and can lead either to more reasonable loads on the current system and/or less future expenditures. Lower recidivism can mean lessened crime, which results in cost savings to taxpayers in terms of victimization and theft, not to mention a public that is safer from crime. This program appears to be providing these positive effects.
11 Finigan, M., Oregon Santa Project: Arrestees Substance Abuse Treatment Needs, 1996.