Embed Size (px)
Citation preview
Ocean Sci., 8, 713–732, 2012www.ocean-sci.net/8/713/2012/doi:10.5194/os-8-713-2012© Author(s) 2012. CC Attribution 3.0 License.
Ocean Science
An operational model for the West Iberian coast: products andservices
M. Mateus1, G. Riflet1, P. Chambel2, L. Fernandes1, R. Fernandes1, M. Juliano3, F. Campuzano1, H. de Pablo1, andR. Neves1
1MARETEC, Instituto Superior Tecnico, Universidade Tecnica de Lisboa, Av. Rovisco Pais, 1049-001, Lisboa, Portugal2HIDROMOD, Rua Rui Teles Palhinha, n◦4, 1◦, Leiao, 2740-278 Porto Salvo, Portugal3LAMTec, Laboratory of Marine Environment and Technology, University of the Azores, Praia da Vitoria, Azores, Portugal
Correspondence to:M. Mateus ([email protected])
Received: 28 February 2012 – Published in Ocean Sci. Discuss.: 12 April 2012Revised: 6 August 2012 – Accepted: 6 August 2012 – Published: 31 August 2012
Abstract. This paper presents the structure and applicationof a regional scale operational modelling tool for the WestIberian coast, and discusses its potential for products and ser-vices for both scientific and coastal management activities.The forecasting suite includes nested hydrodynamic mod-els forced with up-to-date meteorological forecast data andlarge-scale model results. The present status of the systemand its recent upgrades are reviewed, offering a general de-scription of the main components of the system: the forcingdata, the circulation model, the model outputs and the vali-dation methodology of model results. Seasonal differences intemperature, salinity and current velocity fields are illustratedand show satisfactory reproduction of the top and deep layerthermodynamics. The system provides boundary forcing fora number of local-scale model applications via downscalingof the solution and enables potential products and servicesfrom which civil society will benefit.
1 Introduction
The development of nowcasting and forecasting systems dur-ing the last decades is responsible for significant scientificand technical achievements related to operational oceanog-raphy (Le Traon et al., 2009). Numerical models have be-come irreplaceable tools to link operational oceanography tomarine affairs because they continuously provide state esti-mates and forecasts of coastal ocean state. The importanceof numerical modelling in operational activities is alreadyestablished at scales ranging from the coastal (De Mey and
Proctor, 2009 and references included in this Special Issue)to the global ocean (Bell et al., 2009).
Over the last decades several operational modelling sys-tems have been developed with different levels of com-plexity, objectives and end-users (Zhuang et al., 2011). Re-cent EU-funded projects such as the European COastal-shelfsea OPerational observing and forecasting system project(ECOOP), with participation of 72 institutions, highlight therelevance of operational systems for the ocean. Several op-erational platforms combining data gathering and modellingsystems have been produced or upgraded in the progress ofsuch projects (e.g. Zhuang et al., 2011; Stanev et al., 2011;Kordzadze and Demetrashvili, 2011; Korotaev et al., 2011).
The aim of operational forecast is to provide informationthat cannot be attained by other ways and to satisfy needs atdifferent levels from the community, ranging from the privatesector (e.g. oil industry) to public interests (e.g. water qualityassociated with public health). In this context, this paper ad-dresses the potential contributions that an operational modelfor West Iberia may provide to the public and other end users.
This work has been mostly developed within the aim ofproject MyOcean, where the operational model MOHID-PCOMS (MOdelacao HIDrodinamica Portuguese Coast Op-erational Modeling System) is part of an intermediate-level service, meaning that it depends on upstream large-scale data/products (for model forcing, boundary conditions,validation, etc). In addition, it provides downstream ser-vices/products to local users. Particular attention is givento the potential role of the model in the context of ma-rine resources, marine safety and in coastal and marine
Published by Copernicus Publications on behalf of the European Geosciences Union.
714 M. Mateus et al.: An operational model for the West Iberian coast
environments. MyOcean product Mediterranean Sea UltraHigh Resolution Sea Surface Temperature Analysis was usedto validate the MOHID-PCOMS. Argo floater data fromIFREMER (French Research Institute for Exploration of theSea) is also used for validation purposes.
The paper is arranged as follows: Section 2 describesthe operational forecasting model scheme implementation.Some regional scale results are presented in Sect. 3, followedby the discussion of the relevance and major challenges ofthe system in Sect. 4. Section 5 gives a conclusion and anoutlook on the work in progress and on future work.
2 The implementation
2.1 The MOHID model
The model used in this operational platform is the MOHIDmodel (www.mohid.com). MOHID is a Portuguese acronymfor MOdelacao HIDrodinamica. It is an open-source geo-physical regional circulation model based at MARETEC, aresearch group at Instituto Superior Tecnico (IST) in Portu-gal. MOHID is a free-surface, baroclinic model, which usesthe hydrostatic and Boussinesq approximations and a rotat-ing Cartesian reference frame with angular rotation rate
−→�
following the seminal primitive ocean equations proposed byBryan (1997). It solves the equations of advection–diffusionof temperatureT , salinity S, and horizontal momentumρuandρv, respectively expressed in Eqs. (1) to (3). It also solvesthe equation of continuity to determine the vertical velocityw and the water elevationη (Eq. (4)). The densityρ is solvedwith the UNESCO state equation as a function ofS, T andpressurep (Fofonoff and Millard, 1983).ρ0 is a referencedensity of seawater near the surface.
∂
∂t
∫V
T dV +
∮A
(−→n ·
−→v )T dS =
∮A
(−→n ·
−−−→KT ∇)T dS + SST .(1)
∂
∂t
∫V
SdV +
∮A
(−→n ·
−→v )SdS =
∮A
(−→n ·
−−→KS∇)SdS + SSS . (2)
∂
∂t
∫V
−→v dV +
∮A
(−→n ·
−→v )
−→v dS
︸ ︷︷ ︸Advection
+
∫V
2−→� ×
−→v dV
︸ ︷︷ ︸Coriolis acceleration
=
∮A
((−→n ·
−−→υT ∇)
−→v︸ ︷︷ ︸
Turbulent stress
− g(η − z)−→n︸ ︷︷ ︸
Barotropic force
−c(t)
η∫z
ρ − ρ0
ρ0dz
−→n
︸ ︷︷ ︸Baroclinic force
(3)
−patm
ρ0
−→n︸ ︷︷ ︸
Atm pressure
+ 8−→n︸︷︷︸
Gravitational potential
+ c(t)−→τ︸ ︷︷ ︸
Surface and bottom stress
)dS.
V is an orientable control volume fixed relative to the ref-erence frame origin;A is its surface and−→n is its outwardsnormal vector.SST andSSS are the source and sink terms of
their respective properties. They take into account the sensi-ble and latent heat as well as solar radiation with light pen-etration in the temperature equation.patm is the atmosphericpressure,8 is the gravitational potential which is the sumof the Earth gravitational potential with the astronomical tidepotential.g is the vertical component of the gravitational pullnear the Earth’s surface, where it is considered constant.−→τ
represents the wind and bottom stresses which are calculatedproportionally to the square of the relative velocity betweeninterfaces.∂
∂tis the explicit time derivative,z is the vertical
coordinate and−→∇ is the gradient operator.c(t) is a ramp co-
efficient function, devised to slowly activate the baroclinicforce and the surface stress during the spin-up period, de-fined by t
Tcif t < Tc, otherwise it is equal to one. The ramp-
ing periodTc is set to six inertial periods (rotation period of
the Earth).−−→υT ∇ ≡
(υH
∂∂x
,υH∂∂y
,υV∂∂z
)is a vector combi-
nation of the turbulent viscosity vector−→υT = (υH ,υH ,υV )
with the gradient operator. Analogous vector combinationsare made with the temperature and salinity turbulent diffu-sion vectors, respectively
−→KT and
−→KS . Turbulent diffusion
is determined separately between its horizontal componentand vertical component, often being used as constant turbu-lent diffusions along the horizontal for regional ocean appli-cations, whereas a higher order turbulent closure model isusually chosen to determine the vertical turbulent diffusions.The equations for the vertical turbulent kinetic energy and theeddy dissipation rate due to viscosity (Burchard, 2002) aresolved using the GOTM (General Ocean Turbulence Model)solver (Ruiz-Villarreal et al., 2005), embedded in the MO-HID code, from which the model parameterized according toCanuto et al. (2001) is chosen.
The MOHID model uses a finite volume approach to dis-cretize the equations in a curvilinear structured grid. In thisapproach, the discrete form of the governing equations is ap-plied macroscopically to a cell control volume. This makesthe actual way of solving the equations independent of cellgeometry and allows the use of a generic vertical coordi-nate (Martins et al., 2001; Martins et al., 1998). The equa-tions are discretized horizontally on an Arakawa-C stag-gered grid (Arakawa, 1966). All types of vertical coordi-nates have a wetting/drying cell scheme. The model solvesa semi-implicit ADI (Alternating Direction Implicit) algo-rithm to compute the sea level evolution with two time levelsper iteration, following the method proposed by Leendertse(1967). The two components of the horizontal velocity areglobally centred in time, t+dt/2, leading to a second ordertime accuracy (Martins et al., 1998, 2001). Advection anddiffusion of tracer properties such as temperature and salin-ity are computed explicitly in the horizontal and implicitly inthe vertical. A conservative scheme is used for the advection–diffusion of all properties, consisting in a weighted averagebetween first-order and third-order upwind with TVD (TotalVariation Diminishing) flux limiters for advection, whereascentral differences are used for diffusion. For the baroclinic
Ocean Sci., 8, 713–732, 2012 www.ocean-sci.net/8/713/2012/
M. Mateus et al.: An operational model for the West Iberian coast 715
force, the MOHID model uses a z-level approach for any typeof vertical coordinate. This methodology integrates the hor-izontal density gradient always in the Cartesian space. Thebottom stress is calculated semi-implicitly for numerical sta-bility reasons.
2.2 Model setup
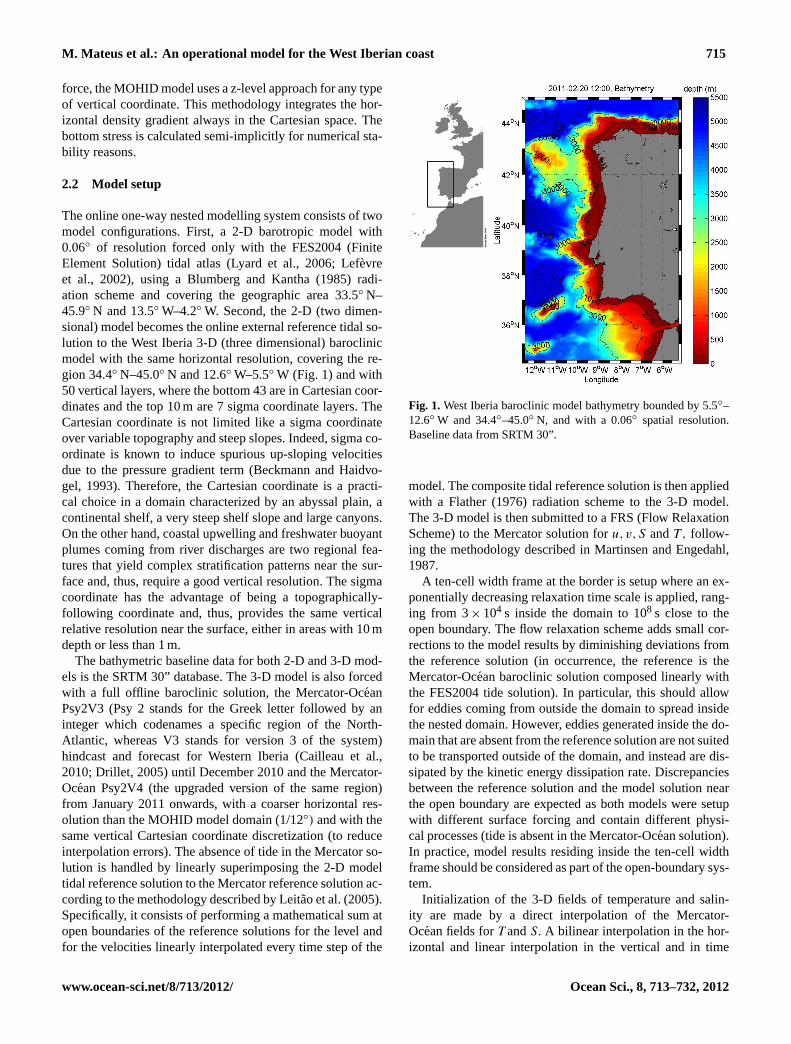
The online one-way nested modelling system consists of twomodel configurations. First, a 2-D barotropic model with0.06◦ of resolution forced only with the FES2004 (FiniteElement Solution) tidal atlas (Lyard et al., 2006; Lefevreet al., 2002), using a Blumberg and Kantha (1985) radi-ation scheme and covering the geographic area 33.5◦ N–45.9◦ N and 13.5◦ W–4.2◦ W. Second, the 2-D (two dimen-sional) model becomes the online external reference tidal so-lution to the West Iberia 3-D (three dimensional) baroclinicmodel with the same horizontal resolution, covering the re-gion 34.4◦ N–45.0◦ N and 12.6◦ W–5.5◦ W (Fig. 1) and with50 vertical layers, where the bottom 43 are in Cartesian coor-dinates and the top 10 m are 7 sigma coordinate layers. TheCartesian coordinate is not limited like a sigma coordinateover variable topography and steep slopes. Indeed, sigma co-ordinate is known to induce spurious up-sloping velocitiesdue to the pressure gradient term (Beckmann and Haidvo-gel, 1993). Therefore, the Cartesian coordinate is a practi-cal choice in a domain characterized by an abyssal plain, acontinental shelf, a very steep shelf slope and large canyons.On the other hand, coastal upwelling and freshwater buoyantplumes coming from river discharges are two regional fea-tures that yield complex stratification patterns near the sur-face and, thus, require a good vertical resolution. The sigmacoordinate has the advantage of being a topographically-following coordinate and, thus, provides the same verticalrelative resolution near the surface, either in areas with 10 mdepth or less than 1 m.
The bathymetric baseline data for both 2-D and 3-D mod-els is the SRTM 30” database. The 3-D model is also forcedwith a full offline baroclinic solution, the Mercator-OceanPsy2V3 (Psy 2 stands for the Greek letter followed by aninteger which codenames a specific region of the North-Atlantic, whereas V3 stands for version 3 of the system)hindcast and forecast for Western Iberia (Cailleau et al.,2010; Drillet, 2005) until December 2010 and the Mercator-Ocean Psy2V4 (the upgraded version of the same region)from January 2011 onwards, with a coarser horizontal res-olution than the MOHID model domain (1/12◦) and with thesame vertical Cartesian coordinate discretization (to reduceinterpolation errors). The absence of tide in the Mercator so-lution is handled by linearly superimposing the 2-D modeltidal reference solution to the Mercator reference solution ac-cording to the methodology described by Leitao et al. (2005).Specifically, it consists of performing a mathematical sum atopen boundaries of the reference solutions for the level andfor the velocities linearly interpolated every time step of the
Fig. 1. West Iberia baroclinic model bathymetry bounded by 5.5◦–12.6◦ W and 34.4◦–45.0◦ N, and with a 0.06◦ spatial resolution.Baseline data from SRTM 30”.
model. The composite tidal reference solution is then appliedwith a Flather (1976) radiation scheme to the 3-D model.The 3-D model is then submitted to a FRS (Flow RelaxationScheme) to the Mercator solution foru,v,S andT , follow-ing the methodology described in Martinsen and Engedahl,1987.
A ten-cell width frame at the border is setup where an ex-ponentially decreasing relaxation time scale is applied, rang-ing from 3× 10⁴ s inside the domain to 108 s close to theopen boundary. The flow relaxation scheme adds small cor-rections to the model results by diminishing deviations fromthe reference solution (in occurrence, the reference is theMercator-Ocean baroclinic solution composed linearly withthe FES2004 tide solution). In particular, this should allowfor eddies coming from outside the domain to spread insidethe nested domain. However, eddies generated inside the do-main that are absent from the reference solution are not suitedto be transported outside of the domain, and instead are dis-sipated by the kinetic energy dissipation rate. Discrepanciesbetween the reference solution and the model solution nearthe open boundary are expected as both models were setupwith different surface forcing and contain different physi-cal processes (tide is absent in the Mercator-Ocean solution).In practice, model results residing inside the ten-cell widthframe should be considered as part of the open-boundary sys-tem.
Initialization of the 3-D fields of temperature and salin-ity are made by a direct interpolation of the Mercator-Ocean fields forT andS. A bilinear interpolation in the hor-izontal and linear interpolation in the vertical and in time
www.ocean-sci.net/8/713/2012/ Ocean Sci., 8, 713–732, 2012
716 M. Mateus et al.: An operational model for the West Iberian coast
are assumed. For the extrapolation procedure, the nearest-neighbour approach was used. Both models have 50 iden-tical layers. Additionally, a null velocity field and sea levelfield with null gradient are assumed. For the spin-up proce-dure, a methodology based on a ramped increase in forcing(baroclinic force, wind stress) was implemented (Leitao etal., 2005).
Furthermore, the system is one-way coupled offline withthe atmospheric forecast model MM5 (Mesoscale Meteoro-logical Model 5) running at IST (Sousa, 2002;http://meteo.ist.utl.pt) for the West Iberian coast, providing forecast of 10m height wind speed, air temperature, mean sea level pres-sure, surface humidity, cloud cover, downward long wave ra-diation and solar radiation with a spatial resolution of 9 kmand with hourly frequency. The atmospheric model is forcedwith the forecasts provided by the GFS (Global Forecast Sys-tem). The surface heat flux is parameterized using bulk quan-tities of both the atmosphere and water. The net shortwaveand the downward longwave radiation terms are provideddirectly by the atmospheric model, while the upward long-wave radiation and the turbulent fluxes are calculated by thehydrodynamic model using its own SST (sea surface tem-perature) and the relevant atmospheric parameters. Changesin water volume due to evaporation and precipitation are ig-nored. River runoff is a very important feature, particularly inthe study of surface coastal circulation where buoyant fresh-water plumes pay an important contribution. At this point,it is absent in the regional model, but will be added soon inthe next version to come. A biharmonic filter (Delhez andDeleersnijder, 2007) replaces horizontal turbulent viscosityin the model configuration.
2.3 MOHID-PCOMS operational system
Since its first introduction as a pre-operational model (Rifletet al., 2008), the West Iberian coast model has evolved and isnow running daily in full operational mode with a 3-day fore-cast and keeps a best-guess result historical timeline. This op-erational system, consisting of the numerical model setup de-scribed above, along with Visual Basic and MATLAB scriptsand an OPeNDAP/THREDDS (Open-source Project for aNetwork Data Access Protocol/Thematic Realtime Environ-mental Distributed Data Services) server running in a hy-brid Windows/Linux operating system network environment,is called MOHID-PCOMS. Best-guess results are dissemi-nated to the internet, where data is made freely available athttp://opendap.mohid.com:8080/thredds/catalog.htmlin thescope of EASYCO European project (COllaborative Euro-pean Atlantic water quality forecasting SYstem). The newMOHID-PCOMS operational system is built such that it caneasily be replicated to other domains with different regionalscales. Currently, a number of local models are coupled to theMOHID-PCOMS in offline mode, with a similar methodogyused as for the MOHID-PCOMS. They also provide 3-dayforecast with historical best-guess hindcast. The results of the
these models at the local scale have a potential of utility forcivil institutions and the general public, but also are of inter-est to the scientific community, in particular regarding cou-pled physical–biogeochemical research. Both their domainsand their utility will be addressed ahead.
3 The results: a brief description of model behaviour
Two examples of the forecast have been selected to demon-strate the operation of the MOHID-PCOMS regional fore-casting system, which adds the tide when compared tothe Mercator-Ocean solution. These examples correspond towinter and summer seasons when circulation features andtemperature patterns are different from each other. Accurateriver discharges are soon to come and should also improvethe surface and subsurface results over the continental shelfwhen compared with the Mercator-Ocean solution.
3.1 Forecast for winter season
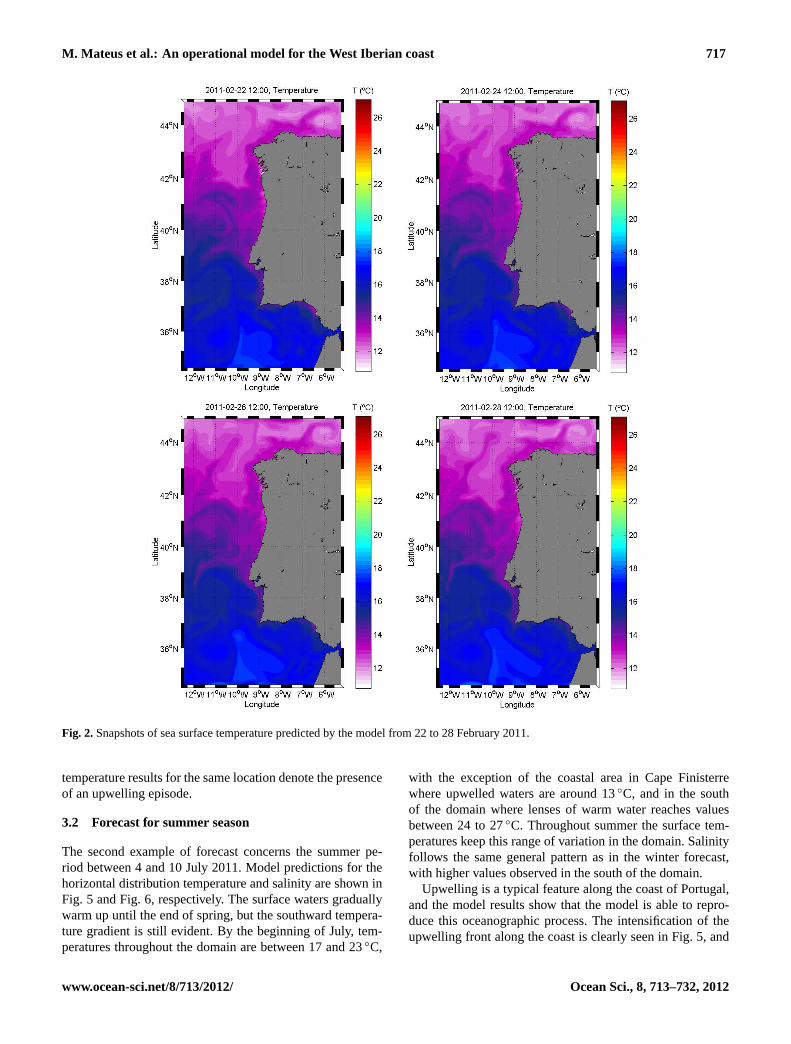
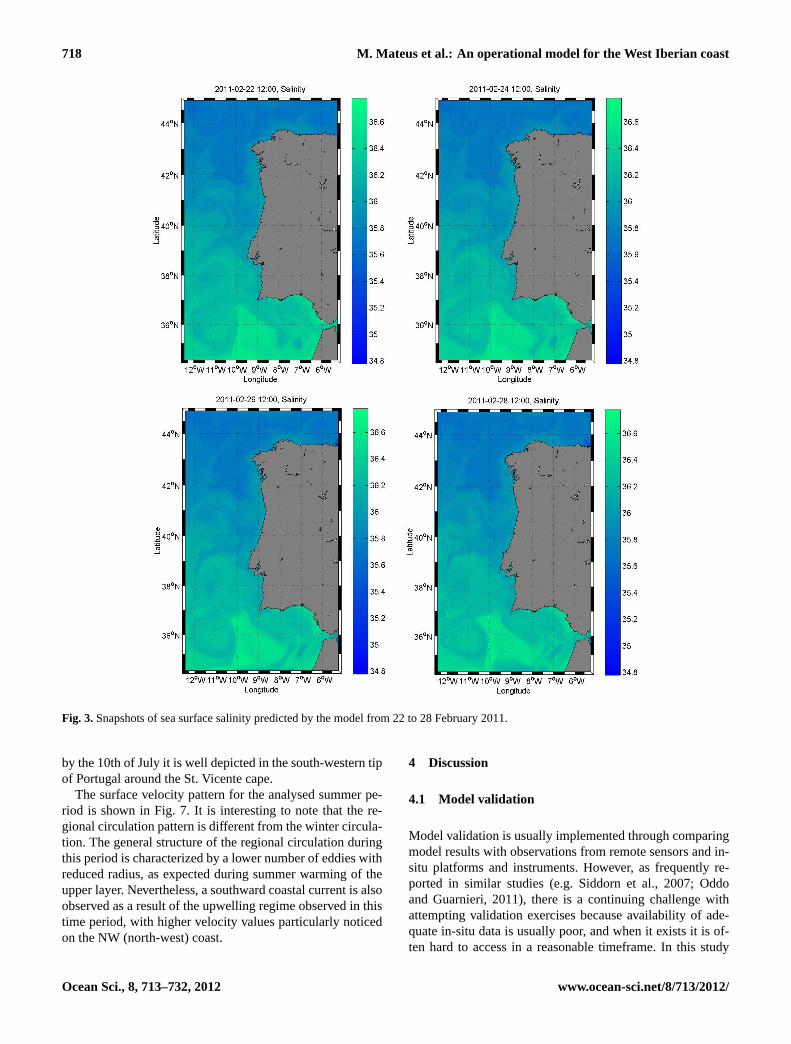
Sea surface temperature and salinity fields predicted by themodel for the winter conditions are presented in Fig.2 andFig. 3. Horizontal distribution of the temperature is typi-cal for the winter period, with a range between 11–18◦Cand a strong north to south gradient, with warmer watersobserved in the southern area. Colder water near-shore isparticularly visible along the SW (south-west) coast, denot-ing the existence of a winter episode of wind induced up-welling front. Winter upwelling events are unusual in the areasince northerly winds prevail mostly during summer, whichis when the Azores anti-cyclone centre (a prominent processthat influences the wind patterns over Iberia and the wholeEuropean Atlantic arc) moves northward; however, they dohappen and there are some studies addressing them (Varelaet al., 2010). Likewise, salinity also shows a marked northto south gradient, with higher salinity values associated withwarmer water masses present in the south of the domain.
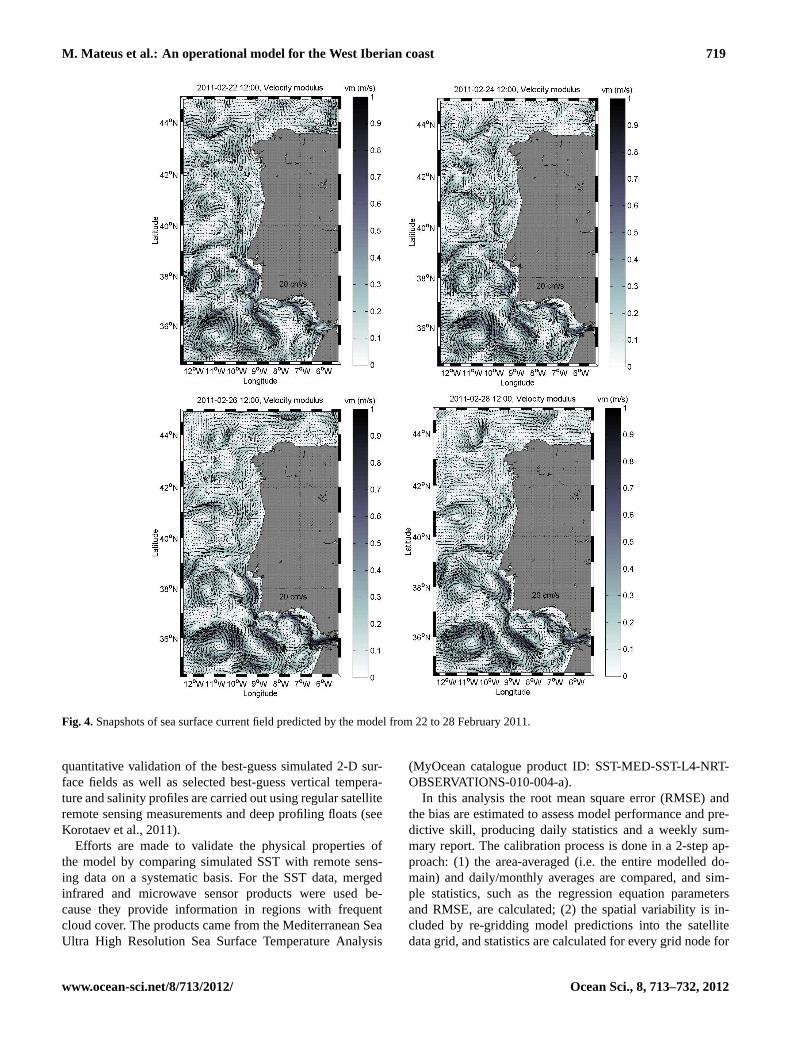
There is a great deal of variability in the domain with me-andering water masses of different temperature and salinityand some clear eddy formations and jet currents parallel tothe coast. The surface current field for the modelled domainis shown in Fig.4. During the forecasting interval, the re-gional circulation is characterized by intense formation anddeformation of eddies. This process is evident in the chainof eddies that occur along the domain. Cyclonic and anticy-clonic eddies are typical elements of the regional circulation,with diameters around 100 to 200 km and covering a signif-icant part of the southern part of the domain. These eddyformations, usually associated with the wind regime, are notstable formations and decompose or undergo some modifica-tions in time. There is a clear southward coastal jet that canbe explained by the north wind circulation observed in thisperiod (not show here). Also, the cold waters observed in the
Ocean Sci., 8, 713–732, 2012 www.ocean-sci.net/8/713/2012/
M. Mateus et al.: An operational model for the West Iberian coast 717
Fig. 2.Snapshots of sea surface temperature predicted by the model from 22 to 28 February 2011.
temperature results for the same location denote the presenceof an upwelling episode.
3.2 Forecast for summer season
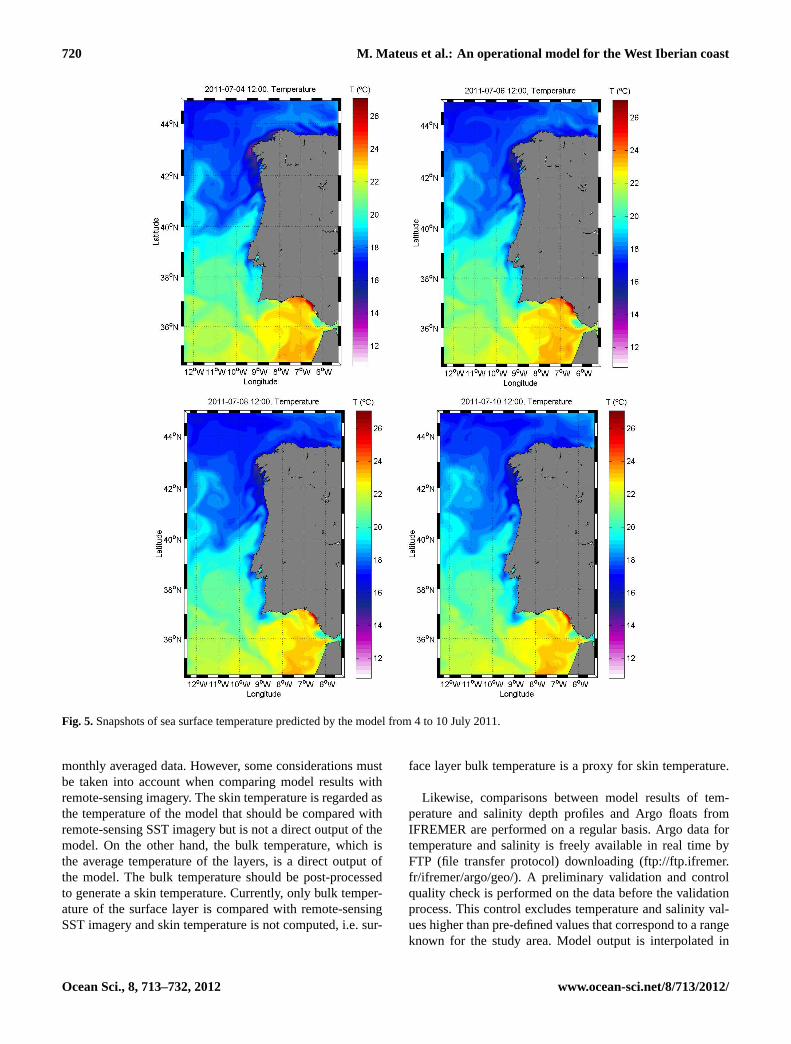
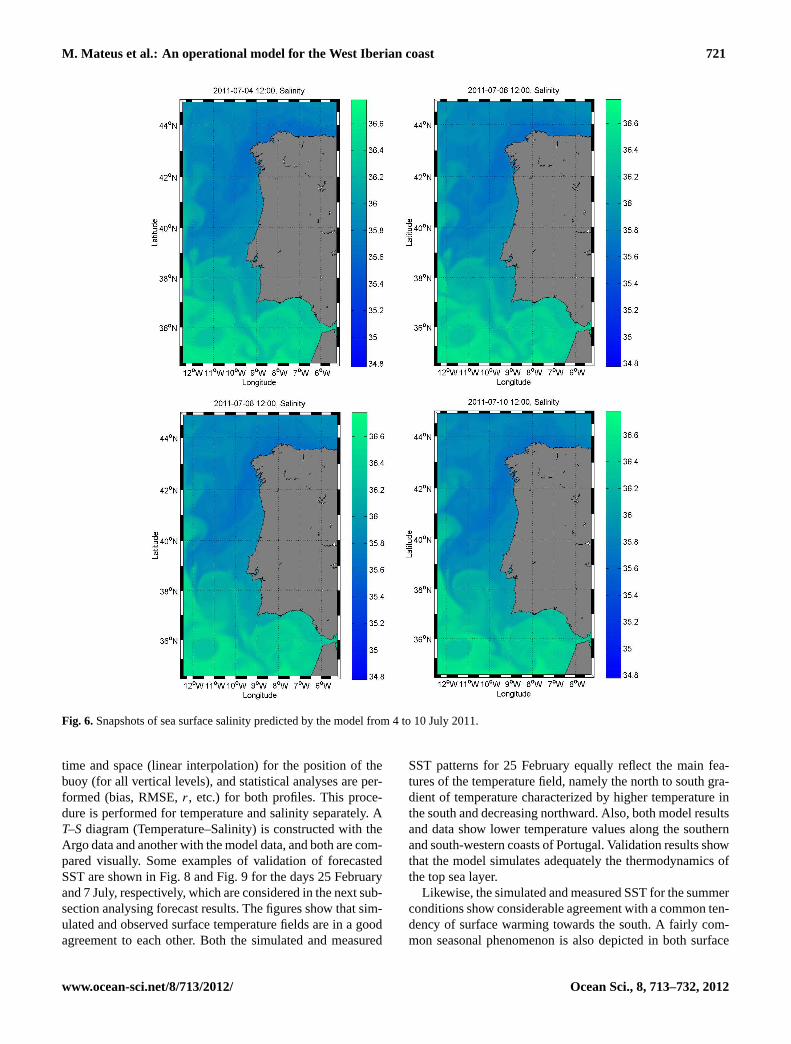
The second example of forecast concerns the summer pe-riod between 4 and 10 July 2011. Model predictions for thehorizontal distribution temperature and salinity are shown inFig. 5 and Fig.6, respectively. The surface waters graduallywarm up until the end of spring, but the southward tempera-ture gradient is still evident. By the beginning of July, tem-peratures throughout the domain are between 17 and 23◦C,
with the exception of the coastal area in Cape Finisterrewhere upwelled waters are around 13◦C, and in the southof the domain where lenses of warm water reaches valuesbetween 24 to 27◦C. Throughout summer the surface tem-peratures keep this range of variation in the domain. Salinityfollows the same general pattern as in the winter forecast,with higher values observed in the south of the domain.
Upwelling is a typical feature along the coast of Portugal,and the model results show that the model is able to repro-duce this oceanographic process. The intensification of theupwelling front along the coast is clearly seen in Fig.5, and
www.ocean-sci.net/8/713/2012/ Ocean Sci., 8, 713–732, 2012
718 M. Mateus et al.: An operational model for the West Iberian coast
Fig. 3.Snapshots of sea surface salinity predicted by the model from 22 to 28 February 2011.
by the 10th of July it is well depicted in the south-western tipof Portugal around the St. Vicente cape.
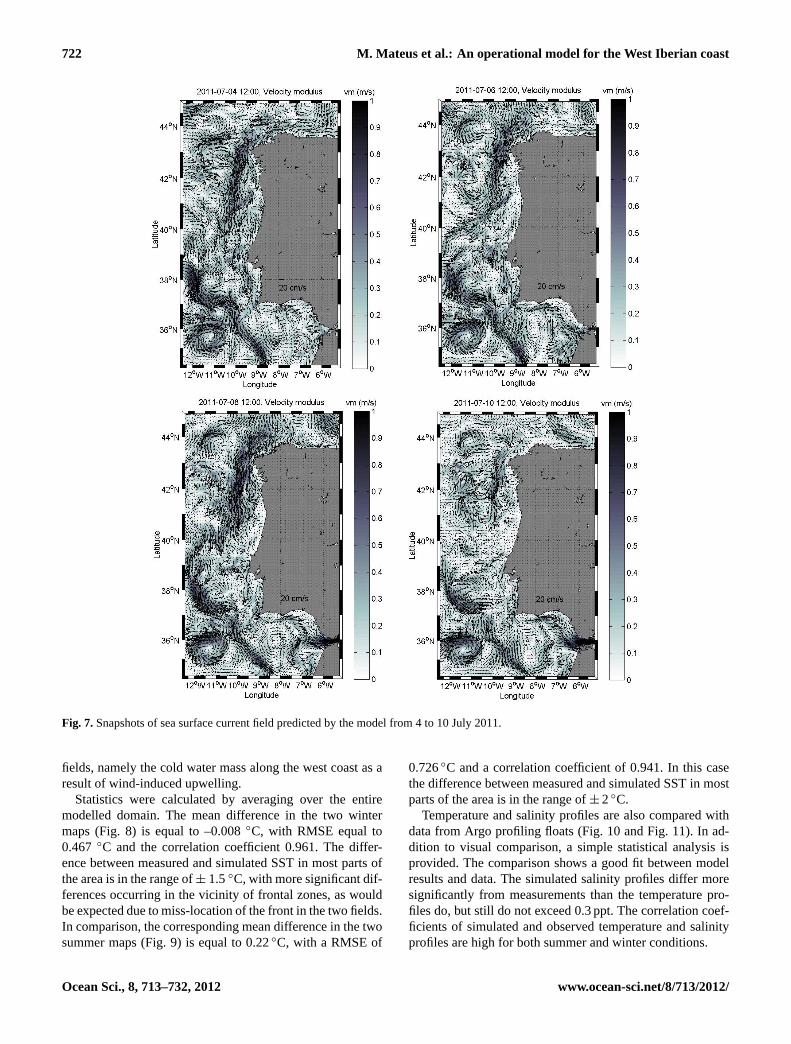
The surface velocity pattern for the analysed summer pe-riod is shown in Fig.7. It is interesting to note that the re-gional circulation pattern is different from the winter circula-tion. The general structure of the regional circulation duringthis period is characterized by a lower number of eddies withreduced radius, as expected during summer warming of theupper layer. Nevertheless, a southward coastal current is alsoobserved as a result of the upwelling regime observed in thistime period, with higher velocity values particularly noticedon the NW (north-west) coast.
4 Discussion
4.1 Model validation
Model validation is usually implemented through comparingmodel results with observations from remote sensors and in-situ platforms and instruments. However, as frequently re-ported in similar studies (e.g. Siddorn et al., 2007; Oddoand Guarnieri, 2011), there is a continuing challenge withattempting validation exercises because availability of ade-quate in-situ data is usually poor, and when it exists it is of-ten hard to access in a reasonable timeframe. In this study
Ocean Sci., 8, 713–732, 2012 www.ocean-sci.net/8/713/2012/
M. Mateus et al.: An operational model for the West Iberian coast 719
Fig. 4.Snapshots of sea surface current field predicted by the model from 22 to 28 February 2011.
quantitative validation of the best-guess simulated 2-D sur-face fields as well as selected best-guess vertical tempera-ture and salinity profiles are carried out using regular satelliteremote sensing measurements and deep profiling floats (seeKorotaev et al., 2011).
Efforts are made to validate the physical properties ofthe model by comparing simulated SST with remote sens-ing data on a systematic basis. For the SST data, mergedinfrared and microwave sensor products were used be-cause they provide information in regions with frequentcloud cover. The products came from the Mediterranean SeaUltra High Resolution Sea Surface Temperature Analysis
(MyOcean catalogue product ID: SST-MED-SST-L4-NRT-OBSERVATIONS-010-004-a).
In this analysis the root mean square error (RMSE) andthe bias are estimated to assess model performance and pre-dictive skill, producing daily statistics and a weekly sum-mary report. The calibration process is done in a 2-step ap-proach: (1) the area-averaged (i.e. the entire modelled do-main) and daily/monthly averages are compared, and sim-ple statistics, such as the regression equation parametersand RMSE, are calculated; (2) the spatial variability is in-cluded by re-gridding model predictions into the satellitedata grid, and statistics are calculated for every grid node for
www.ocean-sci.net/8/713/2012/ Ocean Sci., 8, 713–732, 2012
720 M. Mateus et al.: An operational model for the West Iberian coast
Fig. 5.Snapshots of sea surface temperature predicted by the model from 4 to 10 July 2011.
monthly averaged data. However, some considerations mustbe taken into account when comparing model results withremote-sensing imagery. The skin temperature is regarded asthe temperature of the model that should be compared withremote-sensing SST imagery but is not a direct output of themodel. On the other hand, the bulk temperature, which isthe average temperature of the layers, is a direct output ofthe model. The bulk temperature should be post-processedto generate a skin temperature. Currently, only bulk temper-ature of the surface layer is compared with remote-sensingSST imagery and skin temperature is not computed, i.e. sur-
face layer bulk temperature is a proxy for skin temperature.
Likewise, comparisons between model results of tem-perature and salinity depth profiles and Argo floats fromIFREMER are performed on a regular basis. Argo data fortemperature and salinity is freely available in real time byFTP (file transfer protocol) downloading (ftp://ftp.ifremer.fr/ifremer/argo/geo/). A preliminary validation and controlquality check is performed on the data before the validationprocess. This control excludes temperature and salinity val-ues higher than pre-defined values that correspond to a rangeknown for the study area. Model output is interpolated in
Ocean Sci., 8, 713–732, 2012 www.ocean-sci.net/8/713/2012/
M. Mateus et al.: An operational model for the West Iberian coast 721
Fig. 6.Snapshots of sea surface salinity predicted by the model from 4 to 10 July 2011.
time and space (linear interpolation) for the position of thebuoy (for all vertical levels), and statistical analyses are per-formed (bias, RMSE,r, etc.) for both profiles. This proce-dure is performed for temperature and salinity separately. AT–Sdiagram (Temperature–Salinity) is constructed with theArgo data and another with the model data, and both are com-pared visually. Some examples of validation of forecastedSST are shown in Fig.8 and Fig.9 for the days 25 Februaryand 7 July, respectively, which are considered in the next sub-section analysing forecast results. The figures show that sim-ulated and observed surface temperature fields are in a goodagreement to each other. Both the simulated and measured
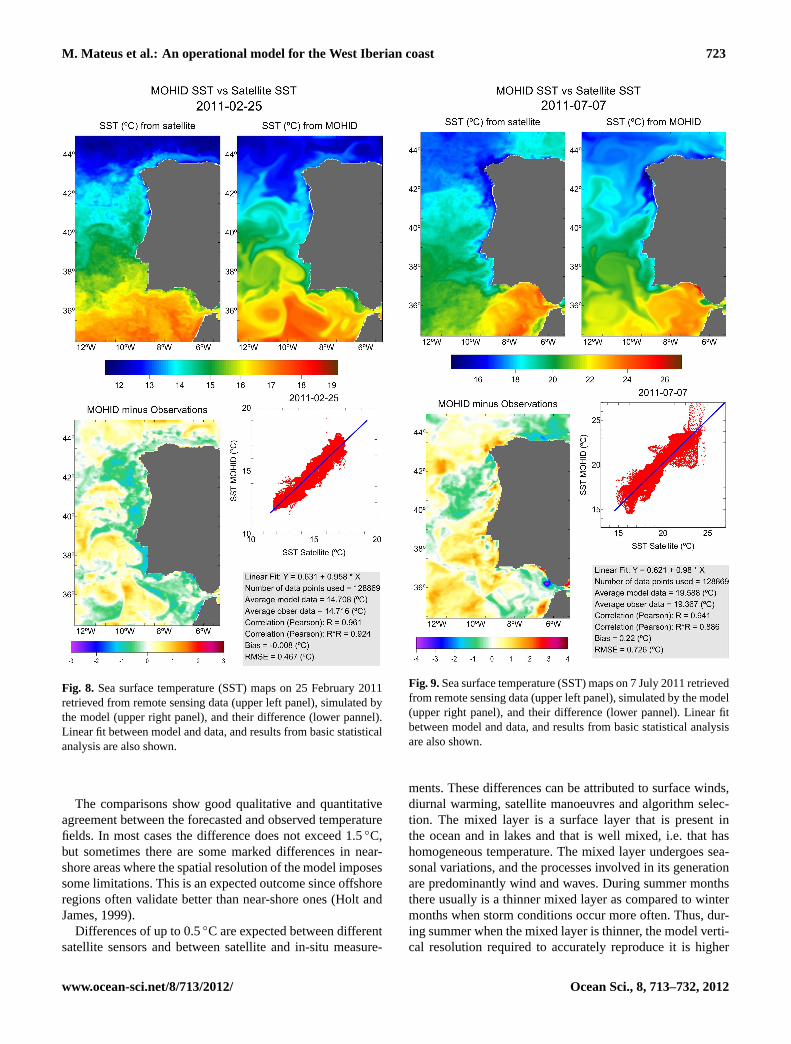
SST patterns for 25 February equally reflect the main fea-tures of the temperature field, namely the north to south gra-dient of temperature characterized by higher temperature inthe south and decreasing northward. Also, both model resultsand data show lower temperature values along the southernand south-western coasts of Portugal. Validation results showthat the model simulates adequately the thermodynamics ofthe top sea layer.
Likewise, the simulated and measured SST for the summerconditions show considerable agreement with a common ten-dency of surface warming towards the south. A fairly com-mon seasonal phenomenon is also depicted in both surface
www.ocean-sci.net/8/713/2012/ Ocean Sci., 8, 713–732, 2012
722 M. Mateus et al.: An operational model for the West Iberian coast
Fig. 7.Snapshots of sea surface current field predicted by the model from 4 to 10 July 2011.
fields, namely the cold water mass along the west coast as aresult of wind-induced upwelling.
Statistics were calculated by averaging over the entiremodelled domain. The mean difference in the two wintermaps (Fig.8) is equal to –0.008◦C, with RMSE equal to0.467 ◦C and the correlation coefficient 0.961. The differ-ence between measured and simulated SST in most parts ofthe area is in the range of± 1.5◦C, with more significant dif-ferences occurring in the vicinity of frontal zones, as wouldbe expected due to miss-location of the front in the two fields.In comparison, the corresponding mean difference in the twosummer maps (Fig.9) is equal to 0.22◦C, with a RMSE of
0.726◦C and a correlation coefficient of 0.941. In this casethe difference between measured and simulated SST in mostparts of the area is in the range of± 2◦C.
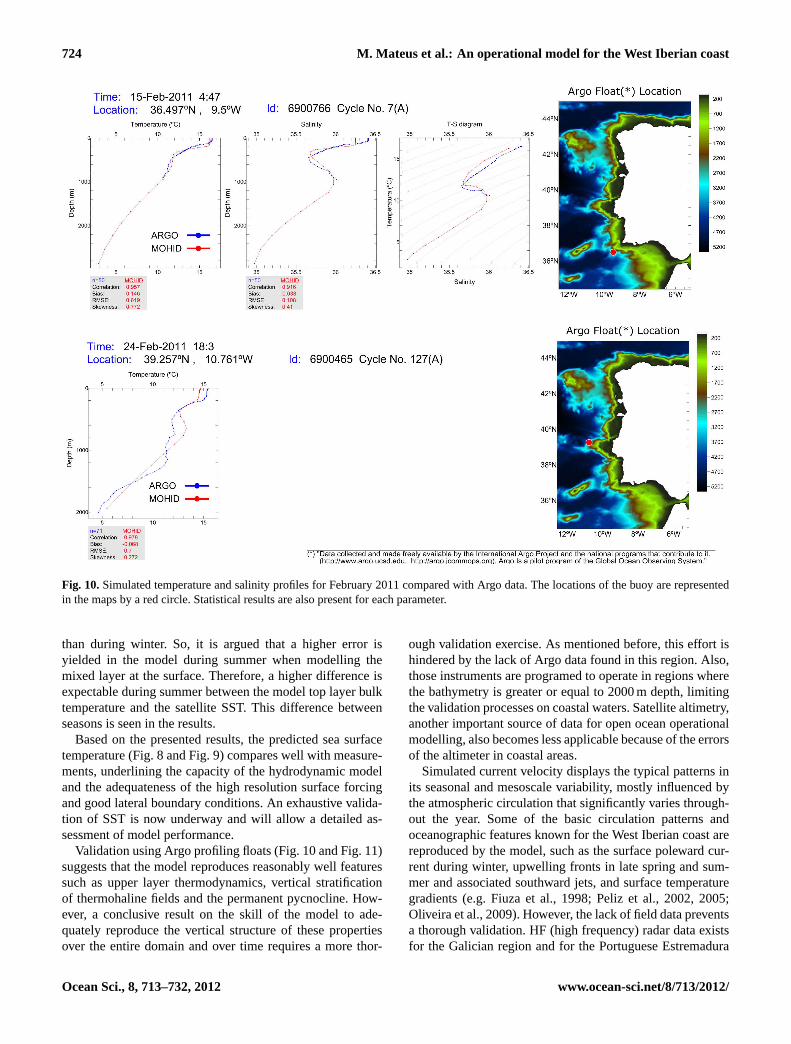
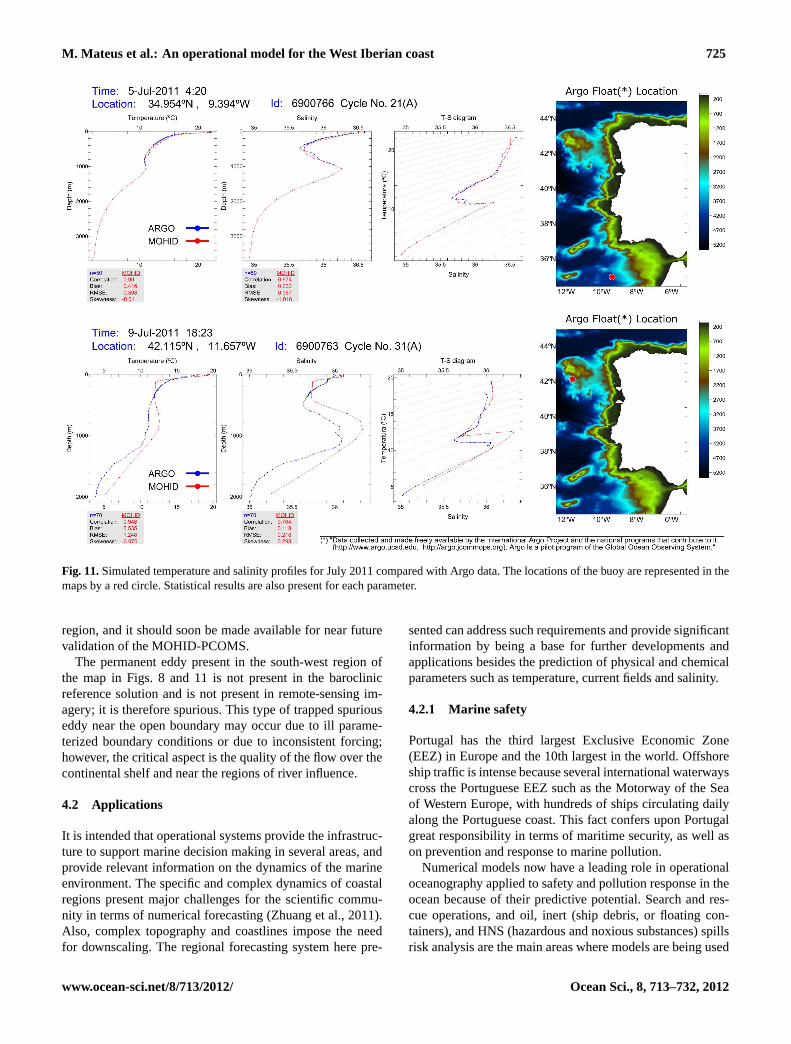
Temperature and salinity profiles are also compared withdata from Argo profiling floats (Fig.10 and Fig.11). In ad-dition to visual comparison, a simple statistical analysis isprovided. The comparison shows a good fit between modelresults and data. The simulated salinity profiles differ moresignificantly from measurements than the temperature pro-files do, but still do not exceed 0.3 ppt. The correlation coef-ficients of simulated and observed temperature and salinityprofiles are high for both summer and winter conditions.
Ocean Sci., 8, 713–732, 2012 www.ocean-sci.net/8/713/2012/
M. Mateus et al.: An operational model for the West Iberian coast 723
Fig. 8. Sea surface temperature (SST) maps on 25 February 2011retrieved from remote sensing data (upper left panel), simulated bythe model (upper right panel), and their difference (lower pannel).Linear fit between model and data, and results from basic statisticalanalysis are also shown.
The comparisons show good qualitative and quantitativeagreement between the forecasted and observed temperaturefields. In most cases the difference does not exceed 1.5◦C,but sometimes there are some marked differences in near-shore areas where the spatial resolution of the model imposessome limitations. This is an expected outcome since offshoreregions often validate better than near-shore ones (Holt andJames, 1999).
Differences of up to 0.5◦C are expected between differentsatellite sensors and between satellite and in-situ measure-
Fig. 9.Sea surface temperature (SST) maps on 7 July 2011 retrievedfrom remote sensing data (upper left panel), simulated by the model(upper right panel), and their difference (lower pannel). Linear fitbetween model and data, and results from basic statistical analysisare also shown.
ments. These differences can be attributed to surface winds,diurnal warming, satellite manoeuvres and algorithm selec-tion. The mixed layer is a surface layer that is present inthe ocean and in lakes and that is well mixed, i.e. that hashomogeneous temperature. The mixed layer undergoes sea-sonal variations, and the processes involved in its generationare predominantly wind and waves. During summer monthsthere usually is a thinner mixed layer as compared to wintermonths when storm conditions occur more often. Thus, dur-ing summer when the mixed layer is thinner, the model verti-cal resolution required to accurately reproduce it is higher
www.ocean-sci.net/8/713/2012/ Ocean Sci., 8, 713–732, 2012
724 M. Mateus et al.: An operational model for the West Iberian coast
Fig. 10.Simulated temperature and salinity profiles for February 2011 compared with Argo data. The locations of the buoy are representedin the maps by a red circle. Statistical results are also present for each parameter.
than during winter. So, it is argued that a higher error isyielded in the model during summer when modelling themixed layer at the surface. Therefore, a higher difference isexpectable during summer between the model top layer bulktemperature and the satellite SST. This difference betweenseasons is seen in the results.
Based on the presented results, the predicted sea surfacetemperature (Fig.8 and Fig.9) compares well with measure-ments, underlining the capacity of the hydrodynamic modeland the adequateness of the high resolution surface forcingand good lateral boundary conditions. An exhaustive valida-tion of SST is now underway and will allow a detailed as-sessment of model performance.
Validation using Argo profiling floats (Fig.10and Fig.11)suggests that the model reproduces reasonably well featuressuch as upper layer thermodynamics, vertical stratificationof thermohaline fields and the permanent pycnocline. How-ever, a conclusive result on the skill of the model to ade-quately reproduce the vertical structure of these propertiesover the entire domain and over time requires a more thor-
ough validation exercise. As mentioned before, this effort ishindered by the lack of Argo data found in this region. Also,those instruments are programed to operate in regions wherethe bathymetry is greater or equal to 2000 m depth, limitingthe validation processes on coastal waters. Satellite altimetry,another important source of data for open ocean operationalmodelling, also becomes less applicable because of the errorsof the altimeter in coastal areas.
Simulated current velocity displays the typical patterns inits seasonal and mesoscale variability, mostly influenced bythe atmospheric circulation that significantly varies through-out the year. Some of the basic circulation patterns andoceanographic features known for the West Iberian coast arereproduced by the model, such as the surface poleward cur-rent during winter, upwelling fronts in late spring and sum-mer and associated southward jets, and surface temperaturegradients (e.g. Fiuza et al., 1998; Peliz et al., 2002, 2005;Oliveira et al., 2009). However, the lack of field data preventsa thorough validation. HF (high frequency) radar data existsfor the Galician region and for the Portuguese Estremadura
Ocean Sci., 8, 713–732, 2012 www.ocean-sci.net/8/713/2012/
M. Mateus et al.: An operational model for the West Iberian coast 725
Fig. 11.Simulated temperature and salinity profiles for July 2011 compared with Argo data. The locations of the buoy are represented in themaps by a red circle. Statistical results are also present for each parameter.
region, and it should soon be made available for near futurevalidation of the MOHID-PCOMS.
The permanent eddy present in the south-west region ofthe map in Figs. 8 and 11 is not present in the baroclinicreference solution and is not present in remote-sensing im-agery; it is therefore spurious. This type of trapped spuriouseddy near the open boundary may occur due to ill parame-terized boundary conditions or due to inconsistent forcing;however, the critical aspect is the quality of the flow over thecontinental shelf and near the regions of river influence.
4.2 Applications
It is intended that operational systems provide the infrastruc-ture to support marine decision making in several areas, andprovide relevant information on the dynamics of the marineenvironment. The specific and complex dynamics of coastalregions present major challenges for the scientific commu-nity in terms of numerical forecasting (Zhuang et al., 2011).Also, complex topography and coastlines impose the needfor downscaling. The regional forecasting system here pre-
sented can address such requirements and provide significantinformation by being a base for further developments andapplications besides the prediction of physical and chemicalparameters such as temperature, current fields and salinity.
4.2.1 Marine safety
Portugal has the third largest Exclusive Economic Zone(EEZ) in Europe and the 10th largest in the world. Offshoreship traffic is intense because several international waterwayscross the Portuguese EEZ such as the Motorway of the Seaof Western Europe, with hundreds of ships circulating dailyalong the Portuguese coast. This fact confers upon Portugalgreat responsibility in terms of maritime security, as well ason prevention and response to marine pollution.
Numerical models now have a leading role in operationaloceanography applied to safety and pollution response in theocean because of their predictive potential. Search and res-cue operations, and oil, inert (ship debris, or floating con-tainers), and HNS (hazardous and noxious substances) spillsrisk analysis are the main areas where models are being used
www.ocean-sci.net/8/713/2012/ Ocean Sci., 8, 713–732, 2012
726 M. Mateus et al.: An operational model for the West Iberian coast
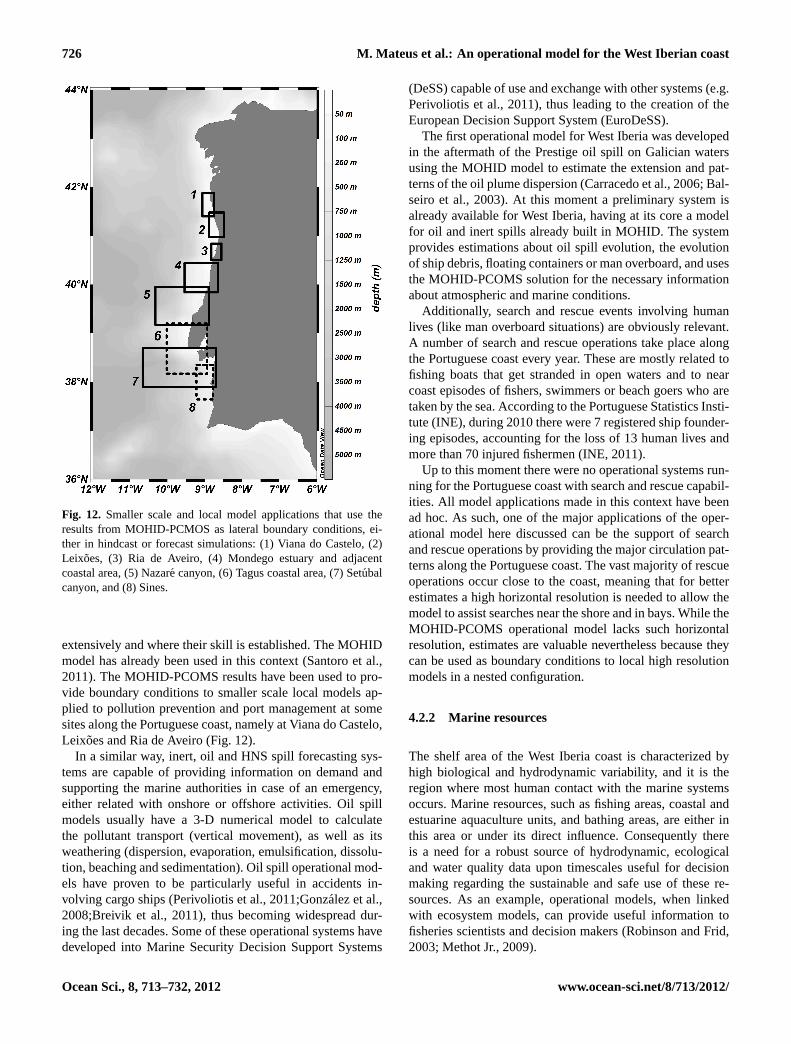
Fig. 12. Smaller scale and local model applications that use theresults from MOHID-PCMOS as lateral boundary conditions, ei-ther in hindcast or forecast simulations: (1) Viana do Castelo, (2)Leixoes, (3) Ria de Aveiro, (4) Mondego estuary and adjacentcoastal area, (5) Nazare canyon, (6) Tagus coastal area, (7) Setubalcanyon, and (8) Sines.
extensively and where their skill is established. The MOHIDmodel has already been used in this context (Santoro et al.,2011). The MOHID-PCOMS results have been used to pro-vide boundary conditions to smaller scale local models ap-plied to pollution prevention and port management at somesites along the Portuguese coast, namely at Viana do Castelo,Leixoes and Ria de Aveiro (Fig.12).
In a similar way, inert, oil and HNS spill forecasting sys-tems are capable of providing information on demand andsupporting the marine authorities in case of an emergency,either related with onshore or offshore activities. Oil spillmodels usually have a 3-D numerical model to calculatethe pollutant transport (vertical movement), as well as itsweathering (dispersion, evaporation, emulsification, dissolu-tion, beaching and sedimentation). Oil spill operational mod-els have proven to be particularly useful in accidents in-volving cargo ships (Perivoliotis et al., 2011;Gonzalez et al.,2008;Breivik et al., 2011), thus becoming widespread dur-ing the last decades. Some of these operational systems havedeveloped into Marine Security Decision Support Systems
(DeSS) capable of use and exchange with other systems (e.g.Perivoliotis et al., 2011), thus leading to the creation of theEuropean Decision Support System (EuroDeSS).
The first operational model for West Iberia was developedin the aftermath of the Prestige oil spill on Galician watersusing the MOHID model to estimate the extension and pat-terns of the oil plume dispersion (Carracedo et al., 2006; Bal-seiro et al., 2003). At this moment a preliminary system isalready available for West Iberia, having at its core a modelfor oil and inert spills already built in MOHID. The systemprovides estimations about oil spill evolution, the evolutionof ship debris, floating containers or man overboard, and usesthe MOHID-PCOMS solution for the necessary informationabout atmospheric and marine conditions.
Additionally, search and rescue events involving humanlives (like man overboard situations) are obviously relevant.A number of search and rescue operations take place alongthe Portuguese coast every year. These are mostly related tofishing boats that get stranded in open waters and to nearcoast episodes of fishers, swimmers or beach goers who aretaken by the sea. According to the Portuguese Statistics Insti-tute (INE), during 2010 there were 7 registered ship founder-ing episodes, accounting for the loss of 13 human lives andmore than 70 injured fishermen (INE, 2011).
Up to this moment there were no operational systems run-ning for the Portuguese coast with search and rescue capabil-ities. All model applications made in this context have beenad hoc. As such, one of the major applications of the oper-ational model here discussed can be the support of searchand rescue operations by providing the major circulation pat-terns along the Portuguese coast. The vast majority of rescueoperations occur close to the coast, meaning that for betterestimates a high horizontal resolution is needed to allow themodel to assist searches near the shore and in bays. While theMOHID-PCOMS operational model lacks such horizontalresolution, estimates are valuable nevertheless because theycan be used as boundary conditions to local high resolutionmodels in a nested configuration.
4.2.2 Marine resources
The shelf area of the West Iberia coast is characterized byhigh biological and hydrodynamic variability, and it is theregion where most human contact with the marine systemsoccurs. Marine resources, such as fishing areas, coastal andestuarine aquaculture units, and bathing areas, are either inthis area or under its direct influence. Consequently thereis a need for a robust source of hydrodynamic, ecologicaland water quality data upon timescales useful for decisionmaking regarding the sustainable and safe use of these re-sources. As an example, operational models, when linkedwith ecosystem models, can provide useful information tofisheries scientists and decision makers (Robinson and Frid,2003; Methot Jr., 2009).
Ocean Sci., 8, 713–732, 2012 www.ocean-sci.net/8/713/2012/
M. Mateus et al.: An operational model for the West Iberian coast 727
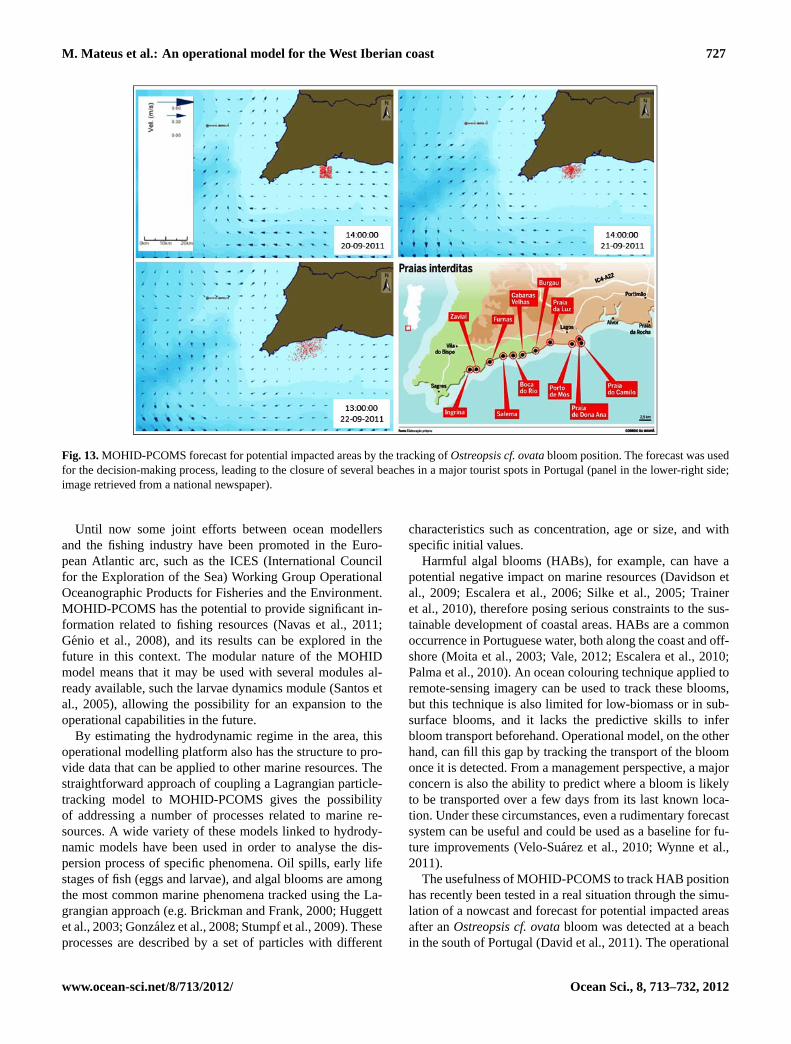
Fig. 13.MOHID-PCOMS forecast for potential impacted areas by the tracking ofOstreopsis cf. ovatabloom position. The forecast was usedfor the decision-making process, leading to the closure of several beaches in a major tourist spots in Portugal (panel in the lower-right side;image retrieved from a national newspaper).
Until now some joint efforts between ocean modellersand the fishing industry have been promoted in the Euro-pean Atlantic arc, such as the ICES (International Councilfor the Exploration of the Sea) Working Group OperationalOceanographic Products for Fisheries and the Environment.MOHID-PCOMS has the potential to provide significant in-formation related to fishing resources (Navas et al., 2011;Genio et al., 2008), and its results can be explored in thefuture in this context. The modular nature of the MOHIDmodel means that it may be used with several modules al-ready available, such the larvae dynamics module (Santos etal., 2005), allowing the possibility for an expansion to theoperational capabilities in the future.
By estimating the hydrodynamic regime in the area, thisoperational modelling platform also has the structure to pro-vide data that can be applied to other marine resources. Thestraightforward approach of coupling a Lagrangian particle-tracking model to MOHID-PCOMS gives the possibilityof addressing a number of processes related to marine re-sources. A wide variety of these models linked to hydrody-namic models have been used in order to analyse the dis-persion process of specific phenomena. Oil spills, early lifestages of fish (eggs and larvae), and algal blooms are amongthe most common marine phenomena tracked using the La-grangian approach (e.g. Brickman and Frank, 2000; Huggettet al., 2003; Gonzalez et al., 2008; Stumpf et al., 2009). Theseprocesses are described by a set of particles with different
characteristics such as concentration, age or size, and withspecific initial values.
Harmful algal blooms (HABs), for example, can have apotential negative impact on marine resources (Davidson etal., 2009; Escalera et al., 2006; Silke et al., 2005; Traineret al., 2010), therefore posing serious constraints to the sus-tainable development of coastal areas. HABs are a commonoccurrence in Portuguese water, both along the coast and off-shore (Moita et al., 2003; Vale, 2012; Escalera et al., 2010;Palma et al., 2010). An ocean colouring technique applied toremote-sensing imagery can be used to track these blooms,but this technique is also limited for low-biomass or in sub-surface blooms, and it lacks the predictive skills to inferbloom transport beforehand. Operational model, on the otherhand, can fill this gap by tracking the transport of the bloomonce it is detected. From a management perspective, a majorconcern is also the ability to predict where a bloom is likelyto be transported over a few days from its last known loca-tion. Under these circumstances, even a rudimentary forecastsystem can be useful and could be used as a baseline for fu-ture improvements (Velo-Suarez et al., 2010; Wynne et al.,2011).
The usefulness of MOHID-PCOMS to track HAB positionhas recently been tested in a real situation through the simu-lation of a nowcast and forecast for potential impacted areasafter anOstreopsis cf. ovatabloom was detected at a beachin the south of Portugal (David et al., 2011). The operational
www.ocean-sci.net/8/713/2012/ Ocean Sci., 8, 713–732, 2012
728 M. Mateus et al.: An operational model for the West Iberian coast
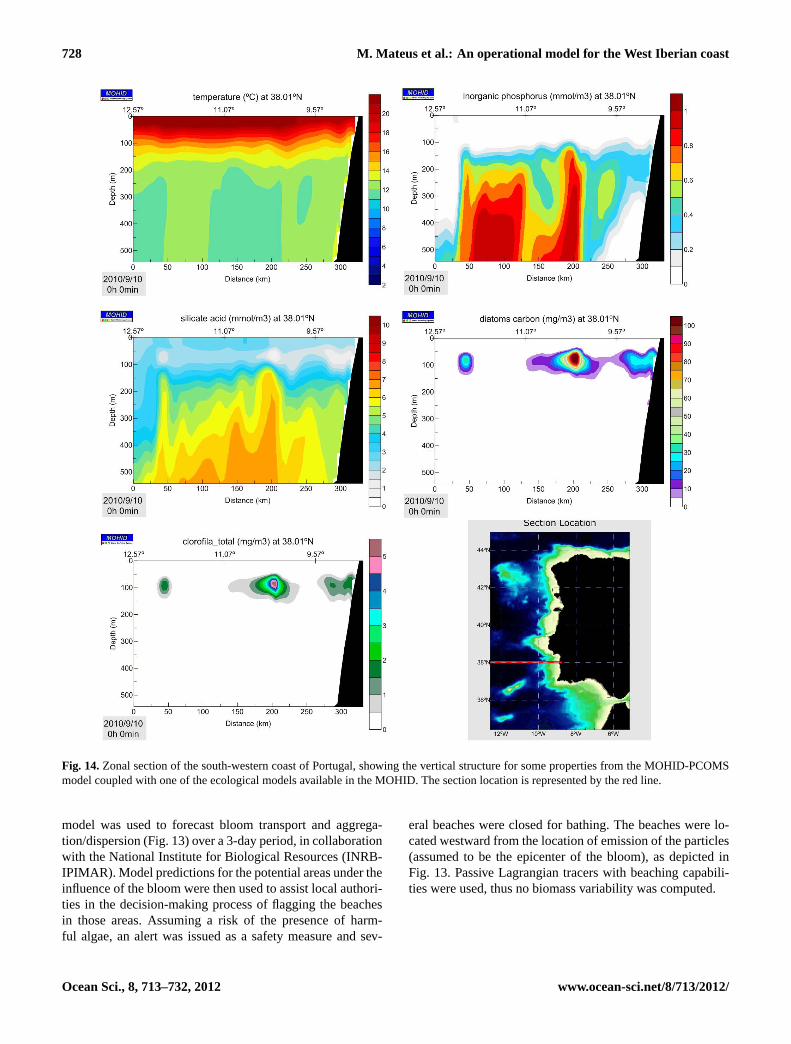
Fig. 14.Zonal section of the south-western coast of Portugal, showing the vertical structure for some properties from the MOHID-PCOMSmodel coupled with one of the ecological models available in the MOHID. The section location is represented by the red line.
model was used to forecast bloom transport and aggrega-tion/dispersion (Fig.13) over a 3-day period, in collaborationwith the National Institute for Biological Resources (INRB-IPIMAR). Model predictions for the potential areas under theinfluence of the bloom were then used to assist local authori-ties in the decision-making process of flagging the beachesin those areas. Assuming a risk of the presence of harm-ful algae, an alert was issued as a safety measure and sev-
eral beaches were closed for bathing. The beaches were lo-cated westward from the location of emission of the particles(assumed to be the epicenter of the bloom), as depicted inFig. 13. Passive Lagrangian tracers with beaching capabili-ties were used, thus no biomass variability was computed.
Ocean Sci., 8, 713–732, 2012 www.ocean-sci.net/8/713/2012/
M. Mateus et al.: An operational model for the West Iberian coast 729
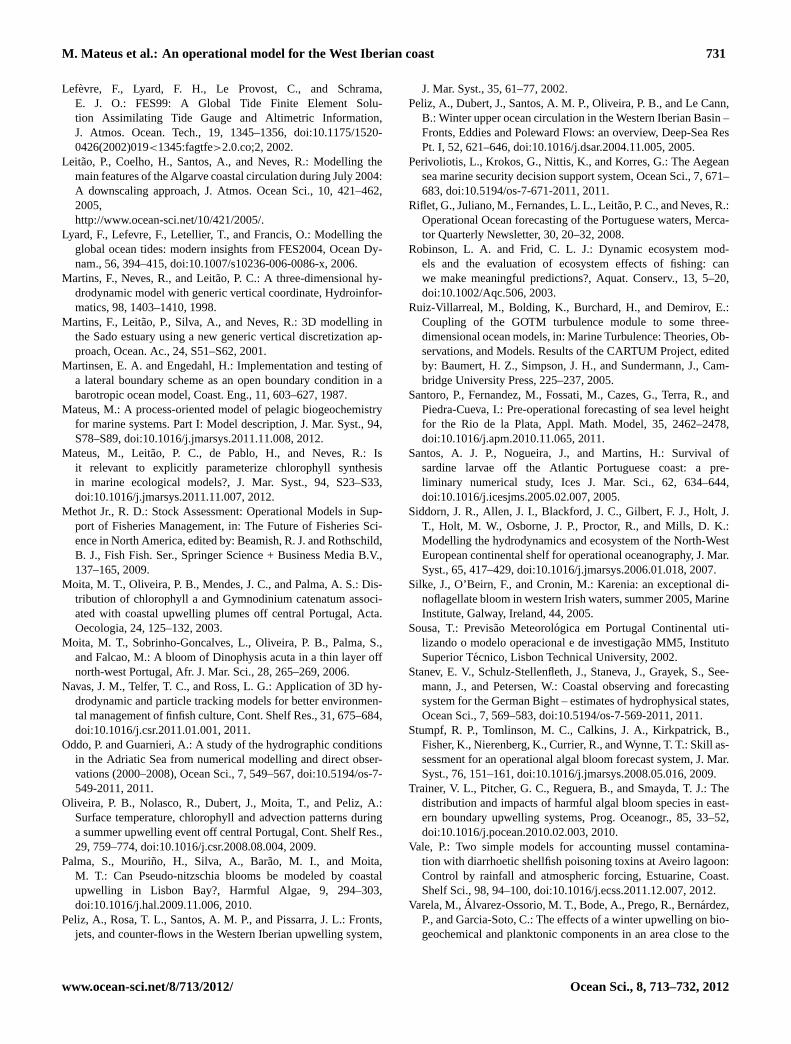
4.2.3 Coastal and marine environment
One of the most significant contributions from operationalmodels for the study of marine environments is the volumeof data that they generate and that can be stored as a synop-tic description of the state of the ocean. These data recordscan either be used to study physical and biogeochemical pro-cesses, for example, or as lateral boundary conditions forsmaller scale or local models, in hindcast or forecast mode.
There is a growing realisation that the biogeochemicalstate of our seas cannot be inferred from their physical prop-erties alone (e.g. Blackford et al., 2004), and there is a re-quirement for explicit operational modelling of the combinedphysical, chemical and biological systems. In response tothis need, coupled oceanic circulation and ecosystem op-erational models are being used with more frequency (Za-lesny and Tamsalu, 2009; Siddorn et al., 2007). The coupledhydrodynamic–ecological operational modelling has beenimplemented in MOHID-PCOMS with different ecologicalmodels.
The potential to simulate biogeochemical processes alongthe coast and in depth has been tested with an ecologicalcomplex model (Mateus, 2012; Mateus et al., 2012), and thepreliminary results (Fig.14) showed that the model is ableto reproduce some known ecological features, such as thenutrient depletion in surface layers and the sub-superficialchlorophyll maximum. This coupled modelling approach isthe basis to understand the link between physical, chemicaland ecological processes occurring in the shelf area. As seenin the example in Fig.14, the results show the clear rela-tion between thermal stratification, nutrient availability anddiatom abundance, highlighting the importance of the physi-cal structure of the ocean in the primary production patterns.The information drawn from this model application can befurther used to identify the underlying processes of HAB for-mation associated with thin layers, such asDinophysis acutablooms that are known to occur along the Portuguese coast(Moita et al., 2006). However, the high computational costof such application hinders its use in an operational way, andcurrently there is an operational application providing fore-cast for ecology using a simpler NPZ (nutrient, phytoplank-ton, zooplankton) model.
The horizontal grid size of MOHID-PCOMS is eddy per-mitting but may be insufficient to resolve on-shelf mesoscaleeddy processes, where a characteristic Rossby radius is ex-pected to be∼3 km. However, the results are used to cas-cade down to smaller domain applications with higher res-olution where needed. Results from MOHID-PCOMS havebeen used this way in several applications of local models(Fig. 12). Some of these models run in hindcast mode tostudy local processes, for example the applications to the Riade Aveiro to simulate water quality processes, and Nazareand Setubal canyons to study sediment dynamics. Other ap-plications are from local operational systems nested withMOHID-PCOMS, such as the Tagus coastal and estuarine
area model and the Sines model. In the first case the solutioncascades down to smaller domain models used (1) to studythe effect of local streams on microbiologic water quality inbeaches, (2) to evaluate the impact of a submarine outfall onthe water quality and ecological processes in the surround-ing area, and (3) as boundary conditions for the Tagus opera-tional model. In the second situation the local model is usedto assess the influence of a thermal plume from a thermoelec-tric power plant on the coastal dynamics.
5 Conclusions
We have presented an operational oceanography system forthe West Iberian waters forced by ocean and atmosphericmodel results provided by local thematic data centres. Po-tential use cases that deal with problems related to coastalmanagement, marine pollution and safe navigation were ad-dressed, as well as the relevance of the model in providinginformation to oceanographic studies.
The system is validated by data retrieved from the My-Ocean catalogue. The predicted results of the operationalsystem are exported to a web-based data system for real-time dissemination to the public (http://opendap.mohid.com:8080/thredds/catalog.html). As such, it provides informationon the state of the sea, and it provides prediction to all sectorsof society: governments, industries, local actors, research andacademic groups, and the general public.
The MOHID-PCOMS model has been shown to be an ef-fective modelling tool. The results presented show that thisoperational tool adequately represents some hydrologic fea-tures of the region and their seasonal differences in dynami-cal processes. The operational system structure is ready to beused in an operational environment where products and ser-vices can be provided on request, either for the present dayas short-term forecast, or for past events. This is a significantstep towards a community model resource with a good po-tential to become a data source on the state of the ocean anda management tool to support local studies along the WestIberia coast.
Improvements to the model are underway, namely the in-clusion of river discharge along the coast and an increase inspatial resolution in near-coast areas where upwelling is fre-quent. Local models coupled offline are also currently beingused, and they will soon run operationally and provide moredetailed information on the local state of the sea.
Acknowledgements.This work is partially supported by EuropeanFP projects MyOcean (FP7 – SPACE-2007-1) and ASIMUTH (FP7– SPACE – 261860), and projects EASYCO and ARCOPOL underthe INTERREG IV Atlantic Area Program.
Edited by: J. A. Johannessen
www.ocean-sci.net/8/713/2012/ Ocean Sci., 8, 713–732, 2012
730 M. Mateus et al.: An operational model for the West Iberian coast
References
Arakawa, A.: Computational design for long-term numerical inte-gration of the equations of fluid motion: Two-dimensional in-compressible flow. Part I, Journal of Computational Physics, 1,119-143, 1966.
Balseiro, C. F., Carracedo, P., Gomez, B., Leitao, P. C., Montero,P., Naranjo, L., Penabad, E., and Perez-Munuzuri, V.: Trackingthe Prestige oil spill: An operational experience in simulation atMeteoGalicia, Weather, 58, 452-458, 2003.
Beckmann, A., and Haidvogel, D. B.: Numerical Simulation ofFlow around a Tall Isolated Seamount. Part I: Problem Formu-lation and Model Accuracy, Journal of Physical Oceanography,23, 1736-1753, 1993.
Bell, M. J., Lefebvre, M., Le Traon, P.-Y., Smith, N., and Wilmer-Becker, K.: GODAE: the global Ocean data assimilation experi-ment, Oceanography, 22, 14–21, 2009.
Blackford, J. C., Allen, J. I., and Gilbert, F. J.: Ecosystem dynamicsat six contrasting sites: a generic modelling study, Journal of Ma-rine Systems, 52, 191-215, DOI 10.1016/j.jmarsys.2004.02.004,2004.
Blumberg, A. F., and Kantha, L.: Open Boundary Condition for Cir-culation Models, Journal of Hydraulic Engineering, 111, 237-255, 1985.
Breivik, Ø., Allen, A. A., Maisondieu, C., and Roth, J. C.: Wind-induced drift of objects at sea: The leeway field method, Ap-plied Ocean Research, 33, 100-109, 10.1016/j.apor.2011.01.005,2011.
Brickman, D., and Frank, T.: Modelling the dispersal and mortalityof Browns bank egg and larval haddock (Melanogrammus ae-glefinus), Can. J. Fish. Aquat. Sci., 57, 2519–2535, 2000.
Bryan, K.: A Numerical Method for the Study of the Circulationof the World Ocean, Journal of Computational Physics, 135 154-169, 1997.
Burchard, H.: Applied Turbulence Modelling in Marine Waters, no.100 in Lecture Notes in Earth Sciences, Springer, 2002.
Cailleau, S., Chanut, J., Levier, B., Maraldi, C., and Reffray, G.: Thenew regional generation of Mercator Ocean system in the IberianBiscay Irish (IBI) area, Mercator Quarterly Newsletter, 34, 5-15,2010.
Canuto, V. M. V., Howard, A., Cheng, Y., and Dubovikov, M. S. M.:Ocean Turbulence. Part I: One-Point Closure Model-Momentumand Heat Vertical Diffusivities, Journal of Physical Oceanogra-phy, 31, 1413-1426, 2001.
Carracedo, P., Torres-Lopez, S., Barreiro, M., Montero, P., Balseiro,C. F., Penabad, E., Leitao, P. C., and Perez-Munuzuri, V.: Im-provement of pollutant drift forecast system applied to the Pres-tige oil spills in Galicia Coast (NW of Spain): development ofan operational system, Marine Pollution Bulletin, 53, 350-360,2006.
David, H., Moita, M. T., Laza-Martınez, A., Silva, A., Mateus, M.,de Pablo, H., and Orive, E.: First bloom ofOstreopsis cf. ovatainthe continental Portuguese coast, Harmful Algae News 45, 2011.
Davidson, K., Miller, P. I., Wilding, T., Shutler, J., Bresnan, E., Ken-nington, K., and Swan, S.: A large and prolonged bloom ofKare-nia mikimotoiin Scottish waters in 2006, Harmful Algae, 8, 349-361, 2009.
De Mey, P., and Proctor, R.: Assessing the value of GODAE prod-ucts in coastal and shelf seas, Ocean Dynamics, 59, 1-2, 2009.
Delhez, E., and Deleersnijder, E.: Overshootings and spurious os-cillations caused by biharmonic mixing, Ocean Modelling, 17,183-198, 2007.
Drillet, Y.: Meddies in the Mercator North Atlantic and Mediter-ranean Sea eddy-resolving model, Journal of Geophysical Re-search, 110, 1-16, 2005.
Escalera, L., Reguera, B., Pazos, Y., Morono, A., and Cabanas, J.M.: Are different species of Dinophysis selected by climatologi-cal conditions?, Afr J Mar Sci, 28, 283-288, 2006.
Escalera, L., Reguera, B., Moita, T., Pazos, Y., Cerejo, M., Cabanas,J. M., and Ruiz-Villarreal, M.: Bloom dynamics of Dinophysisacuta in an upwelling system: In situ growth versus transport,Harmful Algae, 9, 312-322, 10.1016/j.hal.2009.12.002, 2010.
Fiuza, A. F. G., Hamann, M., Ambar, I., del Rio, G. D., Gonzalez,N., and Cabanas, J. M.: Water masses and their circulation offwestern Iberia during May 1993, Deep-Sea Res Pt I, 45, 1127-1160, 1998.
Flather, R. A.: A tidal model of the north-west European continentalshelf, Memoires de la Societe Royale des Sciences de Liege, 6,141-164, 1976.
Fofonoff, N. P., and Millard, R. C.: Algorithms for computation offundamental properties of seawater, Unesco technical papers inmarine science, 44, 1983.
Genio, L., Sousa, A., Vaz, N., Dias, J. M., and Barroso, C.: Ef-fect of low salinity on the survival of recently hatched veligerof Nassarius reticulatus (L.) in estuarine habitats: A case studyof Ria de Aveiro, Journal of Sea Research, 59, 133-143,10.1016/j.seares.2007.09.001, 2008.
Gonzalez, M., Ferrer, L., Uriarte, A., Urtizberea, A., and Ca-ballero, A.: Operational Oceanography System applied to thePrestige oil-spillage event, Journal of Marine Systems, 72, 178-188, 10.1016/j.jmarsys.2007.07.005, 2008.
Holt, J. T., and James, I. D.: A simulation of the southern North Seain comparison with measurements from the North Sea project,Part 1, Temperature, Continental Shelf Research, 19, 1087-1112,1999.
Huggett, J., Freon, P., Mullon, C., and Penven, P.: Modelling thetransport success of anchovy Engraulis encrasicolus eggs andlarvae in the southern Benguela: the effect of spatio-temporalspawning patterns, Mar. Ecol. Prog. Ser., 250, 247–262, 2003.
INE: Estatısticas da Pesca 2010, Instituto Nacional de Estatıstica,Lisboa, Portugal, 101, 2011.
Kordzadze, A. A. and Demetrashvili, D. I.: Operational forecastof hydrophysical fields in the Georgian Black Sea coastal zonewithin the ECOOP, Ocean Sci., 7, 793–803,doi:10.5194/os-7-793-2011, 2011.
Korotaev, G. K., Oguz, T., Dorofeyev, V. L., Demyshev, S. G.,Kubryakov, A. I., and Ratner, Yu. B.: Development of BlackSea nowcasting and forecasting system, Ocean Sci., 7, 629–649,doi:10.5194/os-7-629-2011, 2011.
Le Traon, P.-Y., Larnicol, G., Guinehut, S., Pouliquen, S., Ben-tamy, A., Roemmich, D., Donlon, C., Roquet, H., Jacobs,G., Griffin, D., Bonjean, F., Hoepffner, N., and Breivik, L.A.: Data assembly and processing for operational oceanog-raphy: 10 years of achievements, Oceanography, 22, 56–69,doi:10.5670/oceanog.2009.66., 2009.
Leendertse, J. J.: Aspects of a Computational Model for Long-period Water-wave Propagation, Rand Corporation for the UnitedStates Air Force Project Rand, 1967.
Ocean Sci., 8, 713–732, 2012 www.ocean-sci.net/8/713/2012/
M. Mateus et al.: An operational model for the West Iberian coast 731
Lefevre, F., Lyard, F. H., Le Provost, C., and Schrama,E. J. O.: FES99: A Global Tide Finite Element Solu-tion Assimilating Tide Gauge and Altimetric Information,J. Atmos. Ocean. Tech., 19, 1345–1356,doi:10.1175/1520-0426(2002)019<1345:fagtfe>2.0.co;2, 2002.
Leitao, P., Coelho, H., Santos, A., and Neves, R.: Modelling themain features of the Algarve coastal circulation during July 2004:A downscaling approach, J. Atmos. Ocean Sci., 10, 421–462,2005,http://www.ocean-sci.net/10/421/2005/.
Lyard, F., Lefevre, F., Letellier, T., and Francis, O.: Modelling theglobal ocean tides: modern insights from FES2004, Ocean Dy-nam., 56, 394–415,doi:10.1007/s10236-006-0086-x, 2006.
Martins, F., Neves, R., and Leitao, P. C.: A three-dimensional hy-drodynamic model with generic vertical coordinate, Hydroinfor-matics, 98, 1403–1410, 1998.
Martins, F., Leitao, P., Silva, A., and Neves, R.: 3D modelling inthe Sado estuary using a new generic vertical discretization ap-proach, Ocean. Ac., 24, S51–S62, 2001.
Martinsen, E. A. and Engedahl, H.: Implementation and testing ofa lateral boundary scheme as an open boundary condition in abarotropic ocean model, Coast. Eng., 11, 603–627, 1987.
Mateus, M.: A process-oriented model of pelagic biogeochemistryfor marine systems. Part I: Model description, J. Mar. Syst., 94,S78–S89,doi:10.1016/j.jmarsys.2011.11.008, 2012.
Mateus, M., Leitao, P. C., de Pablo, H., and Neves, R.: Isit relevant to explicitly parameterize chlorophyll synthesisin marine ecological models?, J. Mar. Syst., 94, S23–S33,doi:10.1016/j.jmarsys.2011.11.007, 2012.
Methot Jr., R. D.: Stock Assessment: Operational Models in Sup-port of Fisheries Management, in: The Future of Fisheries Sci-ence in North America, edited by: Beamish, R. J. and Rothschild,B. J., Fish Fish. Ser., Springer Science + Business Media B.V.,137–165, 2009.
Moita, M. T., Oliveira, P. B., Mendes, J. C., and Palma, A. S.: Dis-tribution of chlorophyll a and Gymnodinium catenatum associ-ated with coastal upwelling plumes off central Portugal, Acta.Oecologia, 24, 125–132, 2003.
Moita, M. T., Sobrinho-Goncalves, L., Oliveira, P. B., Palma, S.,and Falcao, M.: A bloom of Dinophysis acuta in a thin layer offnorth-west Portugal, Afr. J. Mar. Sci., 28, 265–269, 2006.
Navas, J. M., Telfer, T. C., and Ross, L. G.: Application of 3D hy-drodynamic and particle tracking models for better environmen-tal management of finfish culture, Cont. Shelf Res., 31, 675–684,doi:10.1016/j.csr.2011.01.001, 2011.
Oddo, P. and Guarnieri, A.: A study of the hydrographic conditionsin the Adriatic Sea from numerical modelling and direct obser-vations (2000–2008), Ocean Sci., 7, 549–567,doi:10.5194/os-7-549-2011, 2011.
Oliveira, P. B., Nolasco, R., Dubert, J., Moita, T., and Peliz, A.:Surface temperature, chlorophyll and advection patterns duringa summer upwelling event off central Portugal, Cont. Shelf Res.,29, 759–774,doi:10.1016/j.csr.2008.08.004, 2009.
Palma, S., Mourino, H., Silva, A., Barao, M. I., and Moita,M. T.: Can Pseudo-nitzschia blooms be modeled by coastalupwelling in Lisbon Bay?, Harmful Algae, 9, 294–303,doi:10.1016/j.hal.2009.11.006, 2010.
Peliz, A., Rosa, T. L., Santos, A. M. P., and Pissarra, J. L.: Fronts,jets, and counter-flows in the Western Iberian upwelling system,
J. Mar. Syst., 35, 61–77, 2002.Peliz, A., Dubert, J., Santos, A. M. P., Oliveira, P. B., and Le Cann,
B.: Winter upper ocean circulation in the Western Iberian Basin –Fronts, Eddies and Poleward Flows: an overview, Deep-Sea ResPt. I, 52, 621–646,doi:10.1016/j.dsar.2004.11.005, 2005.
Perivoliotis, L., Krokos, G., Nittis, K., and Korres, G.: The Aegeansea marine security decision support system, Ocean Sci., 7, 671–683,doi:10.5194/os-7-671-2011, 2011.
Riflet, G., Juliano, M., Fernandes, L. L., Leitao, P. C., and Neves, R.:Operational Ocean forecasting of the Portuguese waters, Merca-tor Quarterly Newsletter, 30, 20–32, 2008.
Robinson, L. A. and Frid, C. L. J.: Dynamic ecosystem mod-els and the evaluation of ecosystem effects of fishing: canwe make meaningful predictions?, Aquat. Conserv., 13, 5–20,doi:10.1002/Aqc.506, 2003.
Ruiz-Villarreal, M., Bolding, K., Burchard, H., and Demirov, E.:Coupling of the GOTM turbulence module to some three-dimensional ocean models, in: Marine Turbulence: Theories, Ob-servations, and Models. Results of the CARTUM Project, editedby: Baumert, H. Z., Simpson, J. H., and Sundermann, J., Cam-bridge University Press, 225–237, 2005.
Santoro, P., Fernandez, M., Fossati, M., Cazes, G., Terra, R., andPiedra-Cueva, I.: Pre-operational forecasting of sea level heightfor the Rio de la Plata, Appl. Math. Model, 35, 2462–2478,doi:10.1016/j.apm.2010.11.065, 2011.
Santos, A. J. P., Nogueira, J., and Martins, H.: Survival ofsardine larvae off the Atlantic Portuguese coast: a pre-liminary numerical study, Ices J. Mar. Sci., 62, 634–644,doi:10.1016/j.icesjms.2005.02.007, 2005.
Siddorn, J. R., Allen, J. I., Blackford, J. C., Gilbert, F. J., Holt, J.T., Holt, M. W., Osborne, J. P., Proctor, R., and Mills, D. K.:Modelling the hydrodynamics and ecosystem of the North-WestEuropean continental shelf for operational oceanography, J. Mar.Syst., 65, 417–429,doi:10.1016/j.jmarsys.2006.01.018, 2007.
Silke, J., O’Beirn, F., and Cronin, M.: Karenia: an exceptional di-noflagellate bloom in western Irish waters, summer 2005, MarineInstitute, Galway, Ireland, 44, 2005.
Sousa, T.: Previsao Meteorologica em Portugal Continental uti-lizando o modelo operacional e de investigacao MM5, InstitutoSuperior Tecnico, Lisbon Technical University, 2002.
Stanev, E. V., Schulz-Stellenfleth, J., Staneva, J., Grayek, S., See-mann, J., and Petersen, W.: Coastal observing and forecastingsystem for the German Bight – estimates of hydrophysical states,Ocean Sci., 7, 569–583,doi:10.5194/os-7-569-2011, 2011.
Stumpf, R. P., Tomlinson, M. C., Calkins, J. A., Kirkpatrick, B.,Fisher, K., Nierenberg, K., Currier, R., and Wynne, T. T.: Skill as-sessment for an operational algal bloom forecast system, J. Mar.Syst., 76, 151–161,doi:10.1016/j.jmarsys.2008.05.016, 2009.
Trainer, V. L., Pitcher, G. C., Reguera, B., and Smayda, T. J.: Thedistribution and impacts of harmful algal bloom species in east-ern boundary upwelling systems, Prog. Oceanogr., 85, 33–52,doi:10.1016/j.pocean.2010.02.003, 2010.
Vale, P.: Two simple models for accounting mussel contamina-tion with diarrhoetic shellfish poisoning toxins at Aveiro lagoon:Control by rainfall and atmospheric forcing, Estuarine, Coast.Shelf Sci., 98, 94–100,doi:10.1016/j.ecss.2011.12.007, 2012.
Varela, M.,Alvarez-Ossorio, M. T., Bode, A., Prego, R., Bernardez,P., and Garcia-Soto, C.: The effects of a winter upwelling on bio-geochemical and planktonic components in an area close to the
www.ocean-sci.net/8/713/2012/ Ocean Sci., 8, 713–732, 2012

732 M. Mateus et al.: An operational model for the West Iberian coast
Galician Upwelling Core: The Sound of Corcubion (NW Spain),J. Sea Res., 64, 260–272,doi:10.1016/j.seares.2010.03.004,2010.
Velo-Suarez, L., Reguera, B., Gonzalez-Gil, S., Lunven, M., Lazure,P., Nezan, E., and Gentien, P.: Application of a 3D Lagrangianmodel to explain the decline of aDinophysis acuminatabloomin the Bay of Biscay, J. Mar. Syst., 83, 242–252, 2010.
Wynne, T. T., Stumpf, R. P., Tomlinson, M. C., Schwab, D. J.,Watabayashi, G. Y., and Christensen, J. D.: Estimating cyanobac-terial bloom transport by coupling remotely sensed imagery anda hydrodynamic model, Ecol. Appl., 21, 2709–2721, 2011.
Zalesny, V. B. and Tamsalu, R.: High-resolution modeling of amarine ecosystem using the FRESCO hydroecological model.Izvestiya, Atmos. Ocean. Phys., 45, 108–122, 2009.
Zhuang, S. Y., Fu, W. W., and She, J.: A pre-operationalthree Dimensional variational data assimilation system in theNorth/Baltic Sea, Ocean Sci., 7, 771–781,doi:10.5194/os-7-771-2011, 2011.
Ocean Sci., 8, 713–732, 2012 www.ocean-sci.net/8/713/2012/