Embed Size (px)
Citation preview

sustainability
Article
An Open Data and Citizen Science Approach toBuilding Resilience to Natural Hazards in aData-Scarce Remote Mountainous Part of Nepal
Binod Prasad Parajuli 1,*, Prakash Khadka 2, Preshika Baskota 1, Puja Shakya 1, Wei Liu 2,Uttam Pudasaini 3, Roniksh B.C. 3,4, Jonathan D. Paul 5, Wouter Buytaert 6 and Sumit Vij 7,8
1 Climate and Resilience, Practical Action Consulting South Asia, Kathmandu 44600, Nepal;[email protected] (P.B.); [email protected] (P.S.)
2 Risk and Resilience, International Institute for Applied Systems Analysis, A-2361 Laxenburg, Austria;[email protected] (P.K.); [email protected] (W.L.)
3 Geomatics, Naxa Private Limited, Kathmandu 44600, Nepal; [email protected] (U.P.);[email protected] (R.B.C.)
4 Department of Environmental Science, Tri-Chandra Multiple Campus, Tribhuvan University,Kathmandu 44605, Nepal
5 Department of Earth Sciences, School of Life Sciences and the Environment, Royal Holloway, University ofLondon, Egham TW20 0EX, UK; [email protected]
6 Department of Civil and Environmental Engineering, Imperial College London, London SW7 2AZ, UK;[email protected]
7 Public Administration and Policy Group, Wageningen University & Research,6706 KN Wageningen, The Netherlands; [email protected]
8 Earth & Climate Cluster, Department of Earth Sciences, Faculty of Earth & Life Sciences, Vrije UniversityAmsterdam, 1081 HV Amsterdam, The Netherlands
* Correspondence: [email protected]
Received: 13 October 2020; Accepted: 6 November 2020; Published: 13 November 2020�����������������
Abstract: The citizen science approach has gained momentum in recent years. It can enable bothexperts and citizen scientists to co-create new knowledge. Better understanding of local environmental,social, and geographical contexts can help in designing appropriate plans for sustainable development.However, a lack of geospatial data, especially in the context of developing countries, often precludescontext-specific development planning. This study therefore tests an innovative approach ofvolunteer citizen science and an open mapping platform to build resilience to natural hazards inthe remote mountainous parts of western Nepal. In this study, citizen scientists and mappingexperts jointly mapped two districts of Nepal (Bajhang and Bajura) using the OpenStreetMap (OSM)platform. Remote mapping based on satellite imagery, capacity building, and mobilization of citizenscientists was performed to collect the data. These data were then uploaded to OSM and laterretrieved in ArcGIS to produce a usable map that could be exploited as a reference resource forevidence-based decision-making. The collected data are freely accessible to community membersas well as government and humanitarian actors, and can be used for development planning andrisk reduction. By piloting in two communities of western Nepal, we found that using open dataplatforms for collecting and analyzing location-based data has a mutual benefit for researchers andcommunities. Such data could be vital in understanding the local landscape, environmental risk,and distribution of resources. Furthermore, they enable both researchers and local people to transfertechnical knowledge, collect location-specific data, and use them for better decision-making.
Keywords: citizen science; hazards; open data; remote mapping; sustainable development
Sustainability 2020, 12, 9448; doi:10.3390/su12229448 www.mdpi.com/journal/sustainability

Sustainability 2020, 12, 9448 2 of 13
1. Introduction
Nepal is exposed to a multitude of recurrent natural and human-induced hazards [1–3]. The steepslopes and fragile geology and landscapes, coupled with heavy monsoon rainfall patterns, lead to awide range of hazards across the country [4,5], with landslides and floods claiming the majority oflives every year [5]. A total of 159 lives were lost in the year 2019 in Nepal from floods and landslidesonly [6]. Furthermore, low adaptive capacity exacerbated by poor governance plays a significant rolein increasing vulnerability to these natural hazards [7]. Lack of adequate and scientific data is a majorhindrance to effective decision-making and community-based resilience building [8].
Open data, in this context, are crucial to strengthening the impact of resilience-building efforts [9].The availability and accessibility of open data can provide information on various climates as well asdisaster-related information, helping communities to build awareness of pre-, during-, and post-disasterevents [10]. In addition, open data help to expose risks and vulnerabilities, along with providingmethods of applying these data to decision-making [11]. The United Nations Office for DisasterRisk Reduction (UNDRR) defines community resilience as an ability to “resist, absorb, accommodate,adapt, transform, and recover” after an exposure to hazards. They also emphasize the preventionof damage to the essential structure and quick recovery [12]. In this context, the use of open datain modeling hazards, as well as in assessing risks in data-scarce regions, can provide importantinformation to potentially strengthen the disaster resilience of communities and individuals [13].Hence, there has been increasing effort over the past few years to leverage open data and innovation tobuild climate and disaster resilience [9].
Citizen science is an approach that enables non-scientists from a diverse group of communitiesto leverage local knowledge and data in depicting a community through different interventionslike monitoring or mapping in a locally understandable format [14]. It involves a wide range ofstakeholders and citizens to co-produce knowledge more effectively and efficiently [15]. Citizen scienceinvolvement in participatory collaborative mapping has been growing as a practice in scaling upthe conceptual common ground of communities and disseminating geographic information [16–18].Volunteered Geographic Information (VGI) more broadly explains the concept of citizen-basedgeospatial mapping [19]. It is an approach of utilizing citizen scientists to generate geospatial contentwith participatory involvement using online platforms [20].
OpenStreetMap (OSM) is such an open platform used for VGI [21,22] to create and freely sharegeospatial information through mapping [21–23]. It consists of geographical data such as streets,buildings, and infrastructure, which can be added by any user with a ground-level knowledge torepresent their community at varying spatial scales [24]. VGI enables individuals to capture localobservations and make informed assessments of their communities through an increased awarenessof local hazards, risks, and vulnerability [25]. The use of citizen science in mapping data in disastersituations is also vital for the acquisition of local and the most current information, the development ofinstant rescue plans, and monitoring of post-disaster influences on society and the environment [26,27].Moreover, the shared knowledge and improved understanding of the broader community throughcommunity-based participatory mapping help to enhance disaster resilience building [15,28].
Hence, this study focuses on the use of open data and citizen science in a VGI approach inorder to archive local knowledge and capture geospatial information at higher spatial resolutionand accuracy. Most of the remote mountainous parts of Nepal lack geospatial data in digitalplatforms [29]. Thus, with remote mapping technology validated by a field-based mapping approachusing citizen scientists, we demonstrate how essential geo-information can be generated and used inlocal-level planning and enhance resilience-building efforts of the community. This study also fills asizeable data gap in remote mountainous communities by contributing to open data systems throughgeospatial data enrichment and providing the foundation for a wide range of actors to participate inresilience-building activities.

Sustainability 2020, 12, 9448 3 of 13
The remainder of the manuscript is as follows. In Section 2, we describe the materials andmethods used for this study. Section 3 contains results, and is followed by a discussion in Section 4.Finally, Section 5 provides brief conclusions and a prospect for future activities.
2. Materials and Methods
2.1. Study Area
The study was carried out in the Bajhang and Bajura districts of the Sudur Paschim provincein western Nepal. These districts are considered as the remotest districts of Nepal in terms ofdevelopment, with the lowest human development index values as of 2014 [30], and are alsoamong the most disaster-prone, affected by a wide range of disasters like landslides and floods [31].The Bitthadchir Rural Municipality and Budhiganga Municipality, from their respective districts, werechosen as study sites. The latter covers elevations of 706–2449 m, having a total population of 21,677and 4277 total households according to the 2011 national census. By contrast, Bitthadchir lies between799–2747 m elevation and contains 17,154 inhabitants and 2739 households. Figure 1 is a map of thestudy area.
Sustainability 2020, 12, x FOR PEER REVIEW 3 of 14
The remainder of the manuscript is as follows. In Section 2, we describe the materials and methods used for this study. Section 3 contains results, and is followed by a discussion in Section 4. Finally, Section 5 provides brief conclusions and a prospect for future activities.
2. Materials and Methods
2.1. Study Area
The study was carried out in the Bajhang and Bajura districts of the Sudur Paschim province in western Nepal. These districts are considered as the remotest districts of Nepal in terms of development, with the lowest human development index values as of 2014 [30], and are also among the most disaster-prone, affected by a wide range of disasters like landslides and floods [31]. The Bitthadchir Rural Municipality and Budhiganga Municipality, from their respective districts, were chosen as study sites. The latter covers elevations of 706–2449 m, having a total population of 21,677 and 4277 total households according to the 2011 national census. By contrast, Bitthadchir lies between 799–2747 m elevation and contains 17,154 inhabitants and 2739 households. Figure 1 is a map of the study area.
Figure 1. Maps showing Bitthadchir Rural Municipality and Budhiganga Municipality in the Bajhang and Bajura districts of western Nepal, respectively, as well as their elevation range. (a) Position of research districts, western Nepal; (b) Bajhang and Bajura districts; (c) Bitthadchir Rural Municipality elevation range; (d) Budhiganga Municipality elevation range.
Figure 1. Maps showing Bitthadchir Rural Municipality and Budhiganga Municipality in the Bajhangand Bajura districts of western Nepal, respectively, as well as their elevation range. (a) Position ofresearch districts, western Nepal; (b) Bajhang and Bajura districts; (c) Bitthadchir Rural Municipalityelevation range; (d) Budhiganga Municipality elevation range.

Sustainability 2020, 12, 9448 4 of 13
2.2. Methods
2.2.1. Citizen Science for Collaborative Mapping
A collaborative mapping approach was used to enable citizen scientists to use ground-levelknowledge in representing a community at varying spatial scales through mapping [32]. This processinvolved a wide range of stakeholders, including people from diverse backgrounds, such as students,government officials from municipal and ward offices, IT officers from the respective municipalities,representatives from Civil Society Organizations (CSOs), and those from the Nepal Police and theNepal Army, to co-produce knowledge more effectively and efficiently. A preliminary study was madeby remotely mapping the selected sites, followed by field training and data collection. First, intensiveremote mapping was conducted by six volunteers. Then, a five-day training workshop was conductedin Budhiganga Municipality, Bajura, on 13–17 November, 2019 and in Bitthadchir Rural Municipality,Bajhang, on 19–23 November 2019 to further validate the data from the remote mapping. Figure 2presents a summary of our workflow.
1
Figure 2. Flowchart of the methodological approach.
2.2.2. Remote Mapping
Remote mapping was carried out in order to digitize all possible objects on the ground beforethe field-level training and mapping exercises were undertaken. Digitization of the satellite image inOSM was carried out via a remote mapping event organized in Kathmandu, in which six mapperscontributed over a span of two weeks. Preliminary remote mapping was carried out by experts whowere familiar with remote mapping in OSM, and had an academic understanding of digital mapping.They consisted of a mix of people from geomatics, as well as students of environmental science andgeography. Altogether, 110 h of remote mapping was performed using the JOSM software.

Sustainability 2020, 12, 9448 5 of 13
2.2.3. Map Literacy and OSM Training
A total of 49 participants, including six remote mappers, 21 citizen scientists from Bajhang, and 22from Bajura, were involved in remote mapping, sensitization, and field training about the mapping.The sensitization session was planned to introduce the concept of data, open data, mapping at a locallevel, and data-driven planning, inter alia. Furthermore, participants were trained in preparing andinterpreting maps with different practical sessions in order to assess their level of cartographic literacyand to teach them to prepare as well as read maps. The training session also included the concept anduse of online and offline tools for mapping in OSM. The participants were instructed to create newdata layers, to digitize the locations they knew, and to fill in attribute details. Similarly, a one-day datacollection exercise was carried out in the field. Citizen scientists used GPS devices, mobile phones,and the OSMTracker app to collect geographical data, such as the locations of educational institutions,health facilities, road networks, and other community resources from the field.
2.2.4. Tools and Software Used
JOSM is a free software desktop editing tool for OSM geo-data created in Java, and it is helpful inremote mapping, editing, and exporting the data to the OSM platform [33]. It was used for digitizingfield data, remote mapping, editing the collected data, and uploading to the OSM server. Likewise,OSMTracker, an offline smartphone app, was used to collect the points of interest to be added to themap with photos, recordings, and any geo-tagged information [34]. In addition, a GPS device wasused for tracking and mapping local trails during field work. ArcGIS software was used to retrieveOSM data and visualize the maps.
2.2.5. Data Processing, Analysis, Validation, and Uploading
The data collected by participants were further analyzed, processed, and uploaded to OSM.The data processing, analysis, and validation steps were executed in two phases. First, the participantswere divided into four groups, in which one trainer was assigned to assist. The data collected fromthe OSM tracker and GPS device were exported in JOSM software; each attribute and the nodes werechecked carefully. Any errors in the name of the attribute, tag, and/or location were jointly discussedin a team and addressed accordingly. The trainer allocated to each group facilitated this process;each member of the group edited at least one of their known locations. This gave an opportunityto jointly learn and validate the collected information among both the trainers and citizen scientists.After data cleaning and validation, the data were uploaded to the OSM server. In the second phase,these data were again retrieved in JOSM, and were checked for inconsistencies and overlaps betweenthe different nodes and attributes. Later, the shapefiles and tags were retrieved from the OSM serverand visualized in ArcGIS to produce final usable and shareable maps.
3. Results
3.1. Remote Mapping of Two Districts
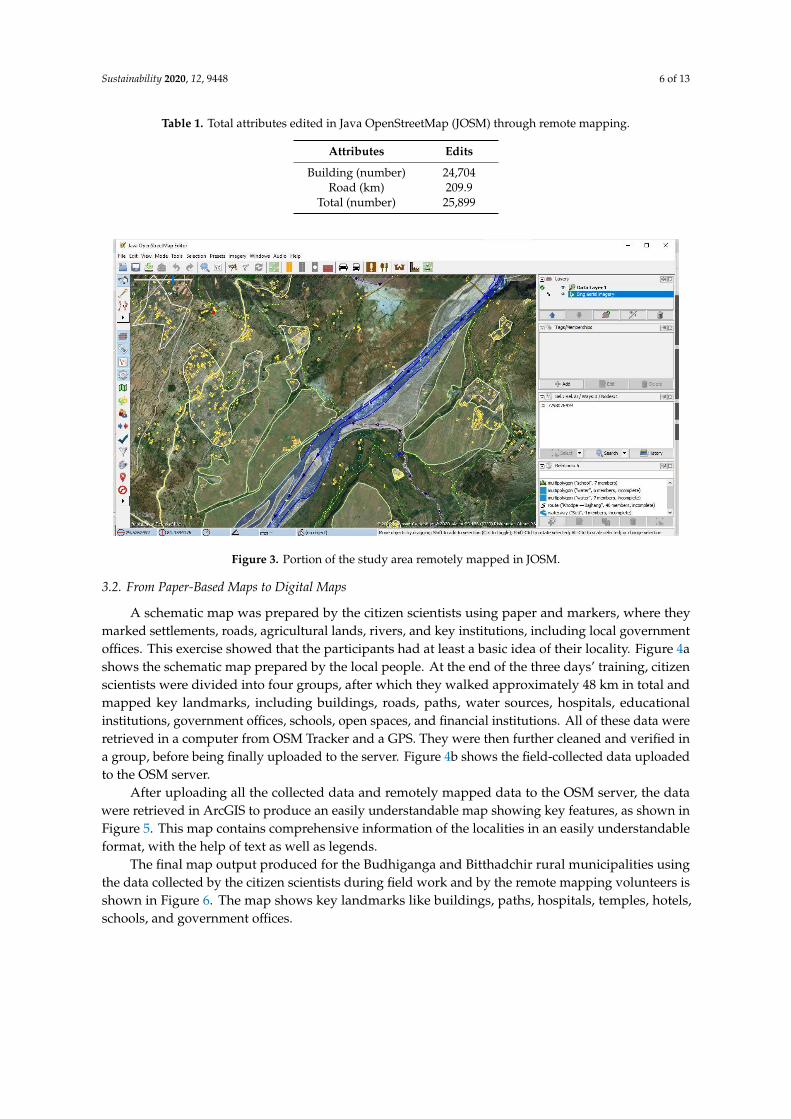
Two districts of the Sudurpaschim province were mapped by six volunteer citizen scientists usingJOSM editor software with the help of freely available satellite imageries. During the remote mappingprocess, we mapped new features and updated already mapped areas, incorporating the changes seenin the latest satellite images. During two weeks of remote mapping, a total of 25,899 edits were made,including 24,704 buildings and 209.9 km of road, as listed in Table 1. Figure 3 shows the portion of thestudy area after the remote mapping.
Sustainability 2020, 12, 9448 6 of 13
Table 1. Total attributes edited in Java OpenStreetMap (JOSM) through remote mapping.
Attributes Edits
Building (number) 24,704Road (km) 209.9
Total (number) 25,899
Sustainability 2020, 12, x FOR PEER REVIEW 6 of 14
Table 1. Total attributes edited in Java OpenStreetMap (JOSM) through remote mapping.
Attributes Edits Building (number) 24,704
Road (km) 209.9 Total (number) 25,899
Figure 3. Portion of the study area remotely mapped in JOSM.
3.2. From Paper-Based Maps to Digital Maps
A schematic map was prepared by the citizen scientists using paper and markers, where they marked settlements, roads, agricultural lands, rivers, and key institutions, including local government offices. This exercise showed that the participants had at least a basic idea of their locality. Figure 4a shows the schematic map prepared by the local people. At the end of the three days’ training, citizen scientists were divided into four groups, after which they walked approximately 48 km in total and mapped key landmarks, including buildings, roads, paths, water sources, hospitals, educational institutions, government offices, schools, open spaces, and financial institutions. All of these data were retrieved in a computer from OSM Tracker and a GPS. They were then further cleaned and verified in a group, before being finally uploaded to the server. Figure 4b shows the field-collected data uploaded to the OSM server.
Figure 3. Portion of the study area remotely mapped in JOSM.
3.2. From Paper-Based Maps to Digital Maps
A schematic map was prepared by the citizen scientists using paper and markers, where theymarked settlements, roads, agricultural lands, rivers, and key institutions, including local governmentoffices. This exercise showed that the participants had at least a basic idea of their locality. Figure 4ashows the schematic map prepared by the local people. At the end of the three days’ training, citizenscientists were divided into four groups, after which they walked approximately 48 km in total andmapped key landmarks, including buildings, roads, paths, water sources, hospitals, educationalinstitutions, government offices, schools, open spaces, and financial institutions. All of these data wereretrieved in a computer from OSM Tracker and a GPS. They were then further cleaned and verified ina group, before being finally uploaded to the server. Figure 4b shows the field-collected data uploadedto the OSM server.
After uploading all the collected data and remotely mapped data to the OSM server, the datawere retrieved in ArcGIS to produce an easily understandable map showing key features, as shown inFigure 5. This map contains comprehensive information of the localities in an easily understandableformat, with the help of text as well as legends.
The final map output produced for the Budhiganga and Bitthadchir rural municipalities usingthe data collected by the citizen scientists during field work and by the remote mapping volunteers isshown in Figure 6. The map shows key landmarks like buildings, paths, hospitals, temples, hotels,schools, and government offices.

Sustainability 2020, 12, 9448 7 of 13Sustainability 2020, 12, x FOR PEER REVIEW 7 of 14
(a)
(b)
Figure 4. (a) Schematic map prepared by local citizen scientists during the first day of mapping training; triangle = households, double line = roads, boxes = public health posts, schools, etc.; (b) data retrieval and upload to the OpenStreetMap (OSM) server using the JOSM editor.
After uploading all the collected data and remotely mapped data to the OSM server, the data were retrieved in ArcGIS to produce an easily understandable map showing key features, as shown in Figure 5. This map contains comprehensive information of the localities in an easily understandable format, with the help of text as well as legends.
Figure 4. (a) Schematic map prepared by local citizen scientists during the first day of mapping training;triangle = households, double line = roads, boxes = public health posts, schools, etc.; (b) data retrievaland upload to the OpenStreetMap (OSM) server using the JOSM editor.

Sustainability 2020, 12, 9448 8 of 13
1
5
Figure 5. Initial map output produced for a portion of the study area using data collected by theparticipants during fieldwork. Key landmarks are highlighted.
Sustainability 2020, 12, x FOR PEER REVIEW 8 of 14
Figure 5. Initial map output produced for a portion of the study area using data collected by the
participants during fieldwork. Key landmarks are highlighted.
The final map output produced for the Budhiganga and Bitthadchir rural municipalities using
the data collected by the citizen scientists during field work and by the remote mapping volunteers
is shown in Figure 6. The map shows key landmarks like buildings, paths, hospitals, temples, hotels,
schools, and government offices.
(a)
Figure 6. Cont.

Sustainability 2020, 12, 9448 9 of 13
Sustainability 2020, 12, x FOR PEER REVIEW 9 of 14
(b)
Figure 6. (a) Final map of Budhiganga municipality; (b) final map of Bitthadchir rural municipality.
Salient features such as buildings, paths, hospitals, schools, and financial institutions are highlighted.
3.3. Map Literacy and Interest in Digital Mapping
The citizen scientists learned skills to collect both the location and attribute data of community
resources, upload the data to open mapping platforms, and also retrieve those data to use for finding
their local services and key institutions. This knowledge was also disseminated to a wider group of
data users. The citizen scientists in the training were keen to learn about data collection tools and
techniques. Since the mapping exercise had instantly visible outputs, the training was more engaging.
As a result of the training, 43 citizen scientists from the two districts worked in collaborative
mapping activities and were able to understand and interpret the maps. After the training, 34
participants shared that they felt confident in reading maps and locating their areas on any map.
During the first day of training, participants had difficulties in finding their houses and making sense
of printed maps. However, after the training, they were able to identify their houses, agricultural
land, and key institutions. This shows that the map literacy was demonstrably increased. Ten citizen
scientists who were active during the group work and mapping created their own personal OSM
accounts and shared a commitment to continue mapping their area in future.
3.4. Technology in Resilience Building
The output maps from this exercise reflected how remote mapping technologies, volunteers’
knowledge, and the efforts of citizen scientists and technical mapping experts could successfully co-
create crucial geospatial information in a data-sparse region. This joint effort resulted in open
availability of base information accessible by different user groups, which could be used to better
understand local resources, capacities, and vulnerabilities. The maps provide crucial information
Figure 6. (a) Final map of Budhiganga municipality; (b) final map of Bitthadchir rural municipality.Salient features such as buildings, paths, hospitals, schools, and financial institutions are highlighted.
3.3. Map Literacy and Interest in Digital Mapping
The citizen scientists learned skills to collect both the location and attribute data of communityresources, upload the data to open mapping platforms, and also retrieve those data to use for findingtheir local services and key institutions. This knowledge was also disseminated to a wider group ofdata users. The citizen scientists in the training were keen to learn about data collection tools andtechniques. Since the mapping exercise had instantly visible outputs, the training was more engaging.
As a result of the training, 43 citizen scientists from the two districts worked in collaborativemapping activities and were able to understand and interpret the maps. After the training,34 participants shared that they felt confident in reading maps and locating their areas on anymap. During the first day of training, participants had difficulties in finding their houses and makingsense of printed maps. However, after the training, they were able to identify their houses, agriculturalland, and key institutions. This shows that the map literacy was demonstrably increased. Ten citizenscientists who were active during the group work and mapping created their own personal OSMaccounts and shared a commitment to continue mapping their area in future.
3.4. Technology in Resilience Building
The output maps from this exercise reflected how remote mapping technologies, volunteers’knowledge, and the efforts of citizen scientists and technical mapping experts could successfullyco-create crucial geospatial information in a data-sparse region. This joint effort resulted in openavailability of base information accessible by different user groups, which could be used to better

Sustainability 2020, 12, 9448 10 of 13
understand local resources, capacities, and vulnerabilities. The maps provide crucial informationconcerning key institutions, including government offices, health facilities, financial institutions,and public assets. In the future, these maps could be improved based on an explicit consultationwith different stakeholders, revolving around their actual needs, with the help of the citizen scientists.The updated maps could then provide important information that could potentially be used as referencedata while updating disaster-related policies and developmental plans. Most importantly, the trainedcitizen scientists could play an important future role in bringing new innovation to shape local-levelplanning and program implementation.
As a secondary output of the mapping exercise, a number of printable maps were prepared.These maps can be printed and be used by municipal offices and ward offices for wider dissemination.The mayor of the local municipalities mentioned these technologies as being crucial to buildingresilience to natural hazards by better understanding the localities; the newly trained citizen scientistsare, therefore, useful resources to each municipality.
4. Discussion
We piloted a citizen science approach and remote mapping to co-create a geospatial knowledgeopenly available for further use in development planning. The results reflect that there is a clearpossibility of producing new comprehensive datasets by combining the skills and knowledge of citizenscientists and mapping experts. As suggested by Rossi et al. [35], the discovery of new knowledgeis dependent on the dedication and active participation of everyone with certain set purposes andinterest in the issue, and is impacted by ongoing discussion. Another important factor is the ownershipand collaboration between different institutions and stakeholders, which is vital for knowledgeco-production [36]. As the co-creation of knowledge is a series of processes evolving though a similarseries of discussions and implementation, the process should be flexible enough to learn from anyerrors while also producing knowledge in an integrated approach [37]. Enhancing the inclusivenessof such an integrated method could be crucial in minimizing barriers to collaborative learning andadopting new tools and approaches towards resilience building.
Our approach included flexibility to incorporate inputs from people of diverse backgrounds anddisciplines, bringing valuable insights and understandings. The interest and enthusiasm shown by thecitizen scientists and volunteer mappers resulted in the creation of base maps in places where very fewdigital mapping activities were hitherto implemented.
“Before this training, none of the ward offices in our municipality were mapped. but after goingthrough this training, I was able to map all the ward offices of our municipality along with therespective contact details and upload the data to OSM platform”—Feedback from the IT Officer atBudhiganga Municipality, Bajura.
Data quality is often a major issue in citizen-scientist-based approaches; we reflected on howthese quality measures could be addressed through joint efforts during the designing, data collection,and analysis steps.
The production of new knowledge can only be sustainable if it incorporates the issues of all thedisciplines that are cross-cutting with those discussed, including as many people as possible who aredirectly or indirectly concerned [38]. The design of this study gave us a better understanding of thespecific roles of each stakeholder, resulting in integrative and collaborative results [39].
Incorporating and valuing the understanding of different groups of people with different realmsof expertise could result in the creation of knowledge that could better support the planning process,as well as forming the basis for guiding knowledge-based decision-making [40]. We believe that thesenewly developed resources will be a useful resource material for decision-making and informingsustainable local development [41]. Ownership by the citizen scientists, local government, and mappingexperts involved in the process will play a role in supporting the communities to improve adaptation

Sustainability 2020, 12, 9448 11 of 13
strategies to natural hazards through evidence-based decision-making, and will be crucial to buildingresilience to natural hazards in general [42].
Furthermore, the open-platform geospatial information could be crucial during emergencysituations, and could also greatly enhance disaster preparedness, quick responses, and earlyrecovery [43]. The Government of Nepal has developed an integrated disaster information managementportal; this method of co-producing knowledge could help collect ground data on hazards,risk, and locally available resources. As the information is openly available, the new contributorsmay make updates in a changing context [44]. Such a dynamic nature of this approach has a low cost:The volunteers can contribute their knowledge for the well-being of the society. Furthermore, as thereis a global community of volunteer mappers, errors are regularly updated through multiple sources,making the process more robust. The least-developed countries have a number of barriers in accessinglocation-based data and in the availability of open geospatial data; our suggested method increasesdata access for academics, governments, and local community members to better understand theirimmediate local environment.
5. Conclusions
We conclude that local capacity building on digital mapping and emerging technologies through acitizen science approach holds rich potential to benefit both scientific researchers and citizen scientistsby co-leveraging scientific expertise and local knowledge. This will considerably reduce the time andeffort required by mapping experts, and also benefit citizen scientists through knowledge transfer.Most importantly, it helps to bring knowledge from different sources and experts in the volunteeredcontribution and allows them to corroborate each other. It also enables both researchers and local peopleto transfer technical knowledge, collect location-specific data, and use them for better decision-making.The data collected jointly by citizen scientists and mapping experts were used to produce a geo-databaseof the region that can be usefully leveraged in decision-making and information dissemination.
The collected information is available on an open platform and, as such, could play an importantrole in better understanding the local landscape, environmental risk, and locally available resources.These data could also be used in future geospatial and disaster risk research, as the data layer fromOSM can be overlain with other datasets to better understand exposure and proximity to any particularhazard. Data accuracy and credibility remain an important concern around open geospatial data:future research could focus on improving data accuracy and correcting citizen scientist subjectivity toprovide more robust information.
Author Contributions: Conceptualization and methodology: B.P.P., P.K., P.B., and W.L.; software: R.B.C. andU.P.; validation: P.K. and P.S.; formal analysis: J.D.P.; investigation: B.P.P., P.K., and U.P.; data curation: U.P. andR.B.C.; writing—original draft preparation: B.P.P. and P.B.; writing—review and editing: S.V., J.D.P., and W.B.;visualization: B.P.P., P.B., and U.P.; supervision: P.S., J.D.P., and W.B.; funding acquisition: W.B. All authors haveread and agreed to the published version of the manuscript.
Funding: We acknowledge funding from the UK Natural Environment Research Council (NERC) and Departmentfor International Development (DfID) (grant number: NE/P000452/1) under the UK SHEAR (Science forHumanitarian Emergencies and Resilience) programme.
Acknowledgments: We would like to acknowledge the effort of all the citizen scientists for their volunteeredcontributions in this study. In addition, we are thankful to the representatives of the Budhiganga and Bitthadchirmunicipalities of western Nepal for their cooperation and support during our capacity building and data collectionwork. We would also like to acknowledge the contributions from previous OSM mappers, who already mappedseveral landmarks in the study region.
Conflicts of Interest: The authors declare no conflict of interest.
Sustainability 2020, 12, 9448 12 of 13
References
1. Ministry of Home Affairs. Nepal Disaster Report 2017: The Road to Sendai; Government of Nepal:Kathmandu, Nepal, 2017.
2. UNDRR. Disaster Risk Reduction in Nepal: Status Report; United Nations Office for Disaster Risk Reduction(UNDRR), Regional Office for Asia and the Pacific: Bangkok, Thailand, 2019.
3. Aksha, S.K.; Emrich, C.T. Benchmarking Community Disaster Resilience in Nepal. Int. J. Environ. Res.Public Health 2020, 17, 1985. [CrossRef]
4. Nepal Disaster Management Reference Handbook. Available online: https://reliefweb.int/report/nepal/nepal-disaster-management-reference-handbook-august-2017 (accessed on 15 September 2020).
5. Ministry of Home Affairs. Nepal Disaster Report; Government of Nepal: Kathmandu, Nepal, 2019; pp. 1–73.6. Nepal Disaster Risk Reduction Portal. Available online: http://drrportal.gov.np/ (accessed on 10 September 2020).7. Southasia Institute of Advanced Studies. Post-Earthquake Disaster Governance in Nepal: Reflections from Practice
and Policy; Nepal South Asia Institute of Advanced Studies: Kathmandu, Nepal, 2016.8. Chatterjee, R.; Shiwaku, K.; Das Gupta, R.; Nakano, G.; Shaw, R. Bangkok to Sendai and Beyond: Implications
for Disaster Risk Reduction in Asia. IJDRR 2015, 6, 177–188. [CrossRef]9. Ospina, A.V. Big Data for Resilience Storybook: Experiences Integrating Big Data into Resilience Programming;
Canada International Institute for Sustainable Development: Winnipeg, MB, Canada, 2018.10. GFDRR. Open Data for Resilience Initiative: Policy Notes and Principles; World Bank: Washington, DC, USA, 2016.11. Nicoson, C.; Uexkull, N.V. Overlapping Vulnerabilities: The Impacts of Climate Change on Humanitarian Needs;
Norwegian Red Cross: Oslo, Norway, 2019.12. United Nations Office for Disaster Risk Reduction (UNDRR). Available online: https://www.undrr.org/
terminology/resilience (accessed on 29 October 2020).13. Data-Pop Alliance. Available online: https://datapopalliance.org/item/dfid-big-data-for-resilience-synthesis-
report (accessed on 4 August 2020).14. Corbett, J. Good Practices in Participatory Mapping; International Fund for Agricultural Development:
Rome, Italy, 2009.15. Liu, W.; Dugar, S.; McCallum, I.; Thapa, G.; See, L.; Khadka, P.; Budhathoki, N.; Brown, S.; Mechler, R.;
Fritz, S.; et al. Integrated Participatory and Collaborative Risk Mapping for Enhancing Disaster Resilience.Int. J. GeoInf. 2018, 7, 68. [CrossRef]
16. Goodchild, M.F. Citizens as sensors: The world of volunteered geography. GeoJournal 2007, 69, 211–221.[CrossRef]
17. Moor, A.D. Common Agenda Setting through Participatory Collaboration Mapping: A KnowledgeBase-Driven Approach. In Proceedings of the 16th CIRN Conference Monash Centre, Prato, Italy, 24–26October 2018.
18. Panek, J.; Netek, R. Collaborative Mapping and Digital Participation: A Tool for Local Empowerment inDeveloping Countries. Information 2019, 10, 255. [CrossRef]
19. USGS. Available online: https://www.usgs.gov/core-science-systems/ngp/cegis/vgi (accessed on22 September 2020).
20. Haklay, M. Citizen Science and Volunteered Geographic Information—Overview and typology ofparticipation. In Crowdsourcing Geographic Knowledge: Volunteered Geographic Information (VGI) in Theoryand Practice; Sui, D.Z., Elwood, S., Goodchild, M.F., Eds.; Springer: Berlin/Heidelberg, Germany, 2013;pp. 105–122.
21. Dorn, H.; Törnros, T.; Zipf, A. Quality Evaluation of VGI Using Authoritative Data—A Comparison withLand Use Data in Southern Germany. ISPRS Int. J. GeoInf. 2015, 4, 1657–1671. [CrossRef]
22. Lin, W. Volunteered Geographic Information constructions in a contested terrain: A case of OpenStreetMapin China. Geoforum 2018, 89, 73–82. [CrossRef]
23. Neis, P.; Zielstra, D. Recent Developments and Future Trends in Volunteered Geographic InformationResearch: The Case of OpenStreetMap. Future Internet 2014, 6, 76–106. [CrossRef]
24. Bégin, D.; Devillers, R.; Roche, S. Assessing Volunteered Geographic Information (VGI) Quality Based onContributors’ Mapping Behaviours. Int. Arch. Photogramm. Remote Sens. Spat. Inf. Sci. 2013, 149–154.[CrossRef]

Sustainability 2020, 12, 9448 13 of 13
25. Haworth, B.T.; Bruce, E.; Whittaker, J.; Read, R. The Good, the Bad, and the Uncertain: Contributions ofVolunteered Geographic Information to Community Disaster Resilience. Front. Earth Sci. 2018, 6, 183.[CrossRef]
26. Kocaman, S.; Anbaroglu, B.; Gokceoglu, C.; Altan, O. A Review on Citizen Science (CITSCI) Applications forDisaster Management. Int. Arch. Photogramm. Remote Sens. Spat. Inf. Sci. 2018, 301–306. [CrossRef]
27. Yalcin, I.; Kocaman, S.; Gokceoglu, C. A CitSci Approach for Rapid Earthquake Intensity Mapping: A CaseStudy from Istanbul (Turkey). ISPRS Int. J. GeoInf. 2020, 9, 266. [CrossRef]
28. Haworth, B. Emergency Management Perspectives on Volunteered Geographic Information: Opportunities,Challenges and Change. Comput. Environ. Urban Syst. 2016, 57, 189–198. [CrossRef]
29. Aksha, S.K.; Resler, L.M.; Juran, L.; Carstensen, L.W. A geospatial analysis of multi-hazard risk in Dharan,Nepal. Geomat. Nat. Hazards Risk 2020, 11, 88–111. [CrossRef]
30. Sharma, P.; Guha-Khasnobis, B.; Khanal, D.R. Nepal Human Development Report 2014, Beyond Geography,Unlocking Human Potential; National Planning Commission, Government of Nepal, United NationsDevelopment Programme: Kathmandu, Nepal, 2014.
31. Ministry of Home Affairs. Nepal Disaster Report 2015; Government of Nepal, Disaster PreparednessNetwork-Nepal (DPNet-Nepal): Kathmandu, Nepal, 2017.
32. Weyer, D.; Bezerra, J.C.; Vos, A.D. Participatory Mapping in a Developing Country Context: Lessons fromSouth Africa. Land 2020, 8, 134. [CrossRef]
33. Java OpenStreetMap. Available online: https://josm.openstreetmap.de/ (accessed on 9 September 2020).34. OSM Tracker. Available online: https://play.google.com/store/apps/details?id=net.osmtracker&hl=en
(accessed on 9 September 2020).35. Rossi, F.; Rosli, A.; Yip, N. Academic engagement as knowledge co-production and implications for impact:
Evidence from Knowledge Transfer Partnerships. J. Bus. Res. 2017, 80, 1–9. [CrossRef]36. Wamsler, C. Stakeholder involvement in strategic adaptation planning: Transdisciplinarity and Co-production
at Stake? Environ. Sci. Policy 2017, 75, 148–157. [CrossRef]37. Hegger, D.; Lamers, M.; Van Zeijl-Rozema, A.; Dieperink, C. Conceptualising joint knowledge production in
regional climate change adaptation projects: Success conditions and levers for action. Environ. Sci. Policy2012, 18, 52–65. [CrossRef]
38. Lemos, M.C.; Morehouse, B.J. The co-production of science and policy in integrated climate assessments.Glob. Environ. Chang. 2005, 15, 57–68. [CrossRef]
39. Groot, A.M.E.; Bosch, P.R.; Buijs, S.; Jacobs, C.M.J.; Moors, E.J. Integration in urban climate adaptation:Lessons from Rotterdam on integration between scientific disciplines and integration between scientific andstakeholder knowledge. Build. Environ. 2015, 83, 177–188. [CrossRef]
40. Edelenbos, J.; van Buuren, A.; van Schie, N. Co-producing knowledge: Joint knowledge production betweenexperts, bureaucrats and stakeholders in Dutch water management projects. Environ. Sci. Policy 2011, 14,675–684. [CrossRef]
41. Moreno, J. The role of communities in coping with natural disasters: Lessons from the 2010 Chile Earthquakeand Tsunami. Proc. Eng. 2018, 212, 1040–1045. [CrossRef]
42. Gorddard, R.; Colloff, M.J.; Wise, R.M.; Ware, D.; Dunlop, M. Environmental Science & Policy Values, rulesand knowledge: Adaptation as change in the decision context. Environ. Sci. Policy 2016, 57, 60–69. [CrossRef]
43. Bhanumurthy, V.; Ram Mohan Rao, K.; Jai Sankar, G.; Nagamani, P.V. Spatial data integration fordisaster/emergency management: An Indian experience. Spat. Inf. Res. 2017, 25, 303–314. [CrossRef]
44. Coetzee, S.; Ivánová, I.; Mitasova, H.; Brovelli, M.A. Open geospatial software and data: A review of thecurrent state and a perspective into the future. ISPRS Int. J. GeoInf. 2020, 9, 90. [CrossRef]
Publisher’s Note: MDPI stays neutral with regard to jurisdictional claims in published maps and institutionalaffiliations.
© 2020 by the authors. Licensee MDPI, Basel, Switzerland. This article is an open accessarticle distributed under the terms and conditions of the Creative Commons Attribution(CC BY) license (http://creativecommons.org/licenses/by/4.0/).